The SF Team, Eva + James, Compass

San Francisco Q1 2022 housing report on rising interest rates, low inventory, and strong demand.
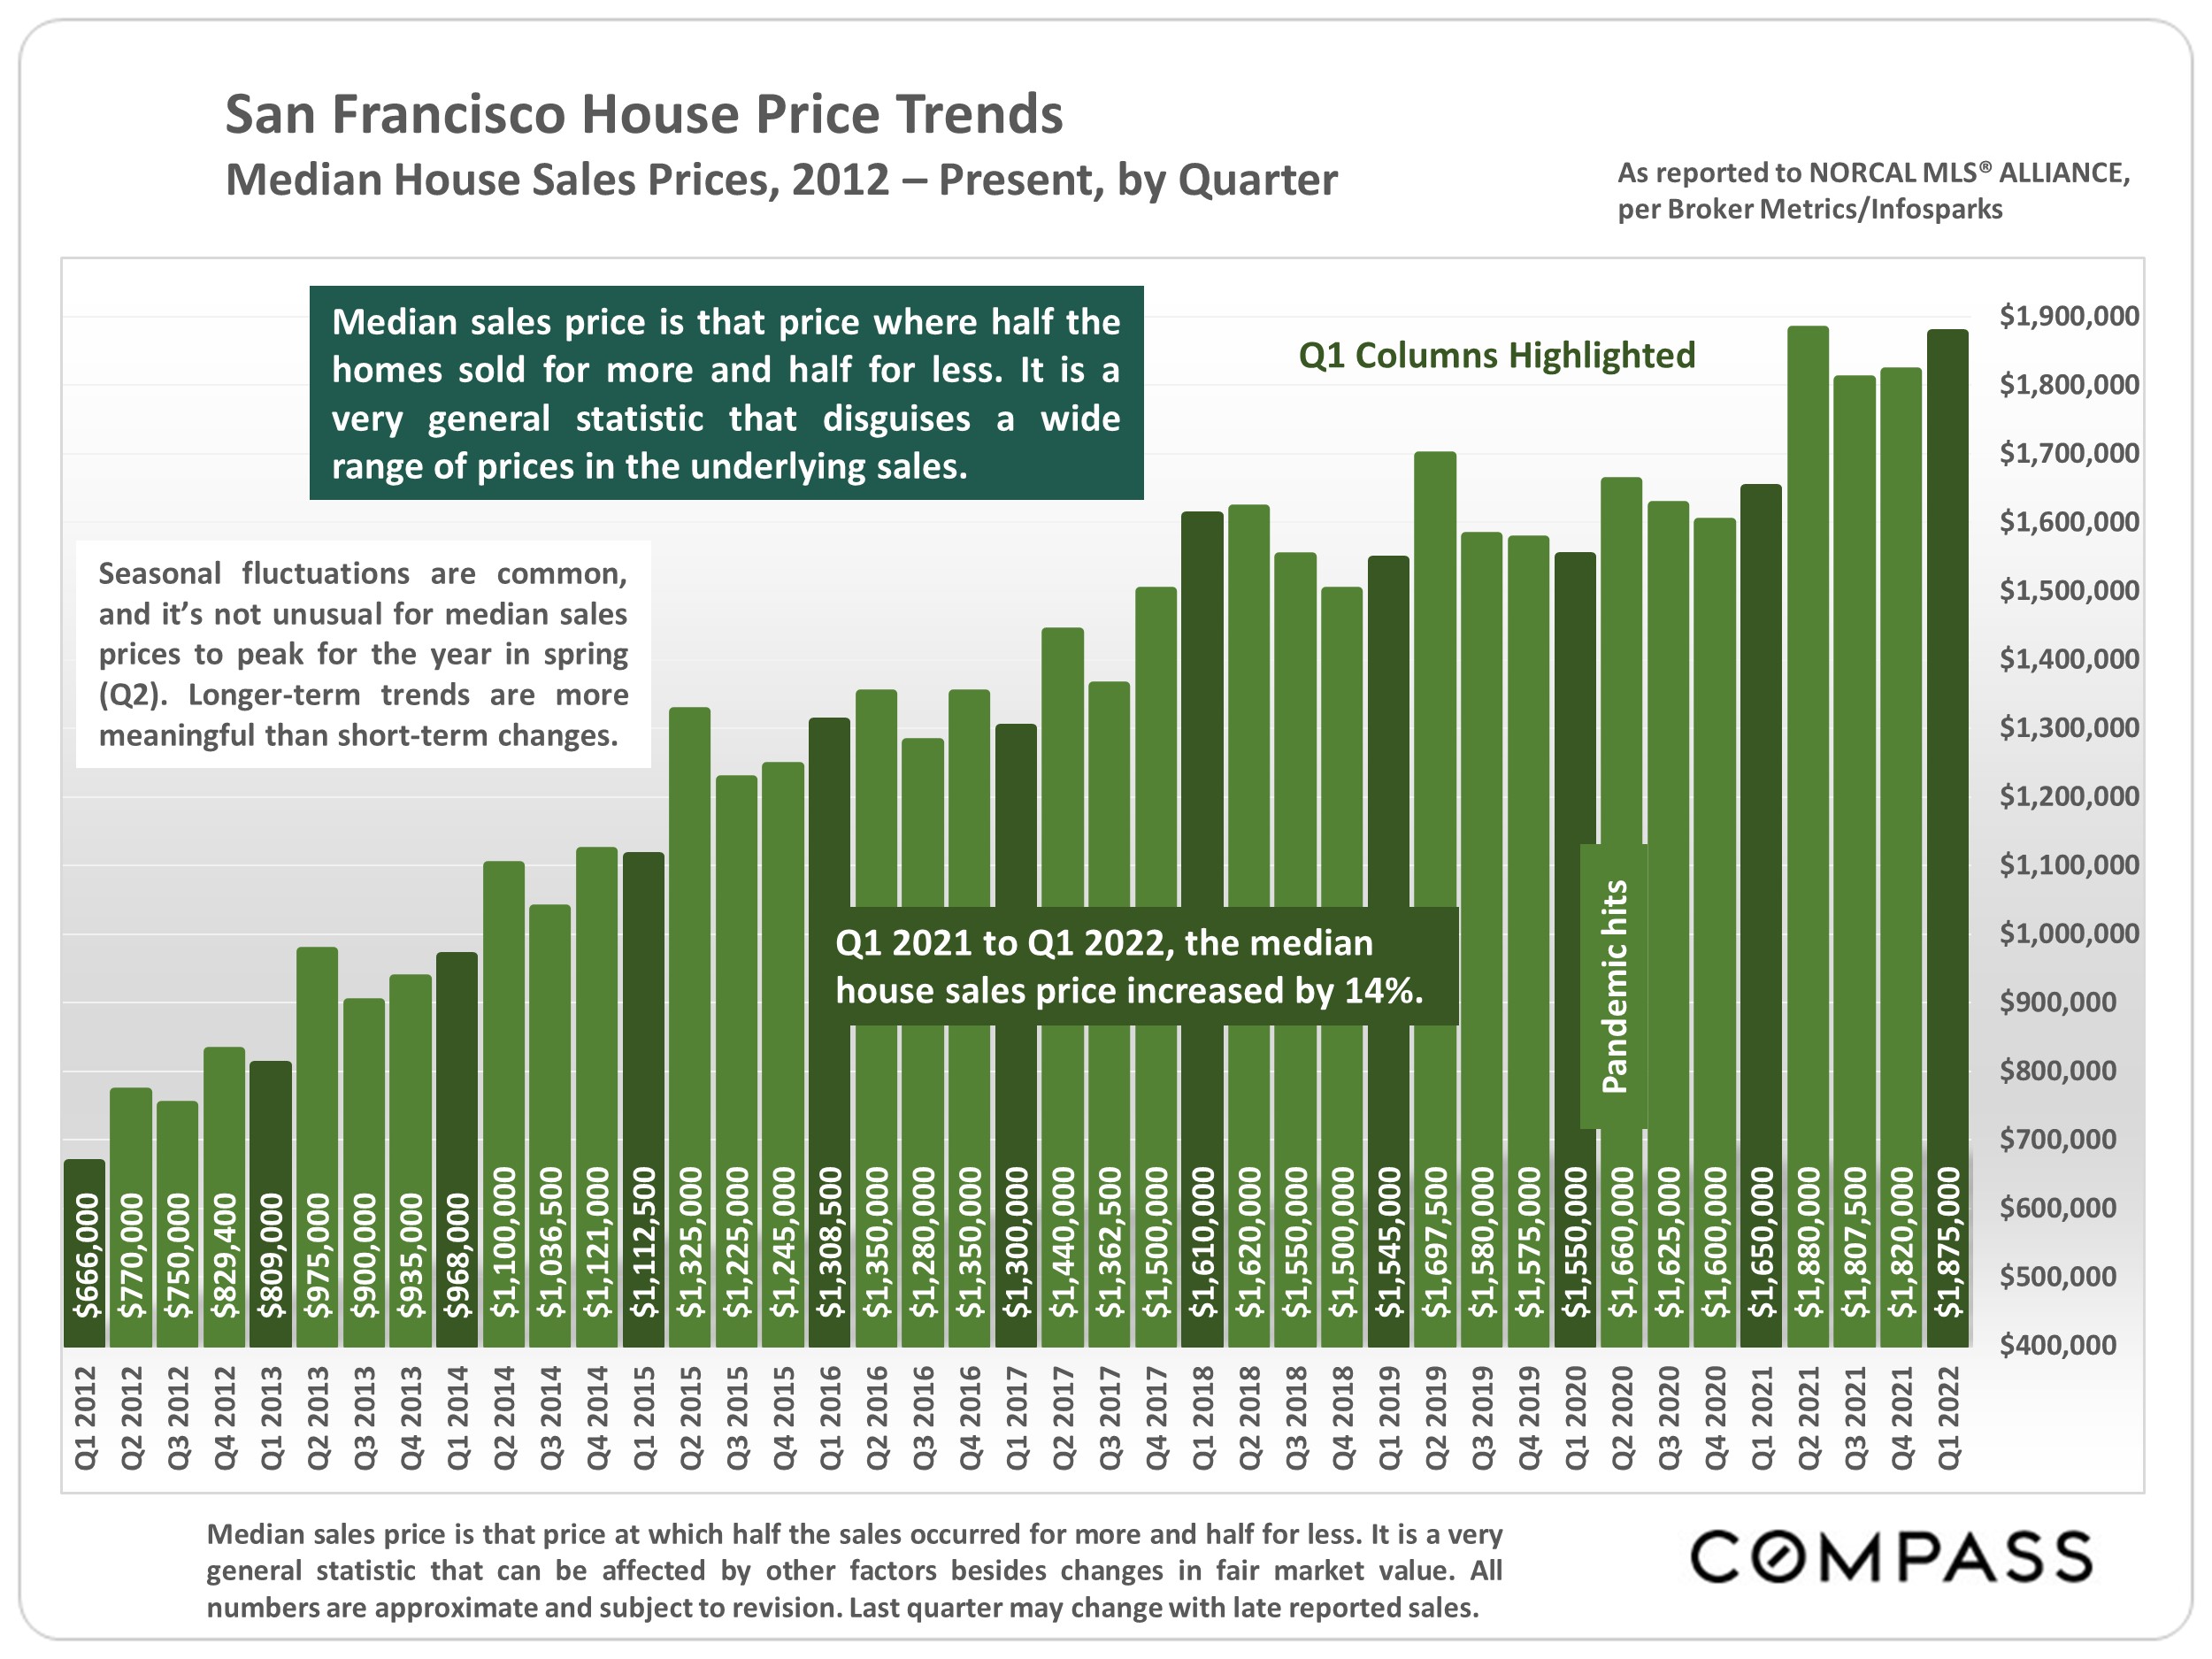
Chart of San Francisco quarterly median house prices, rising from $666,000 in 2012 to $1.875 million in 2022.
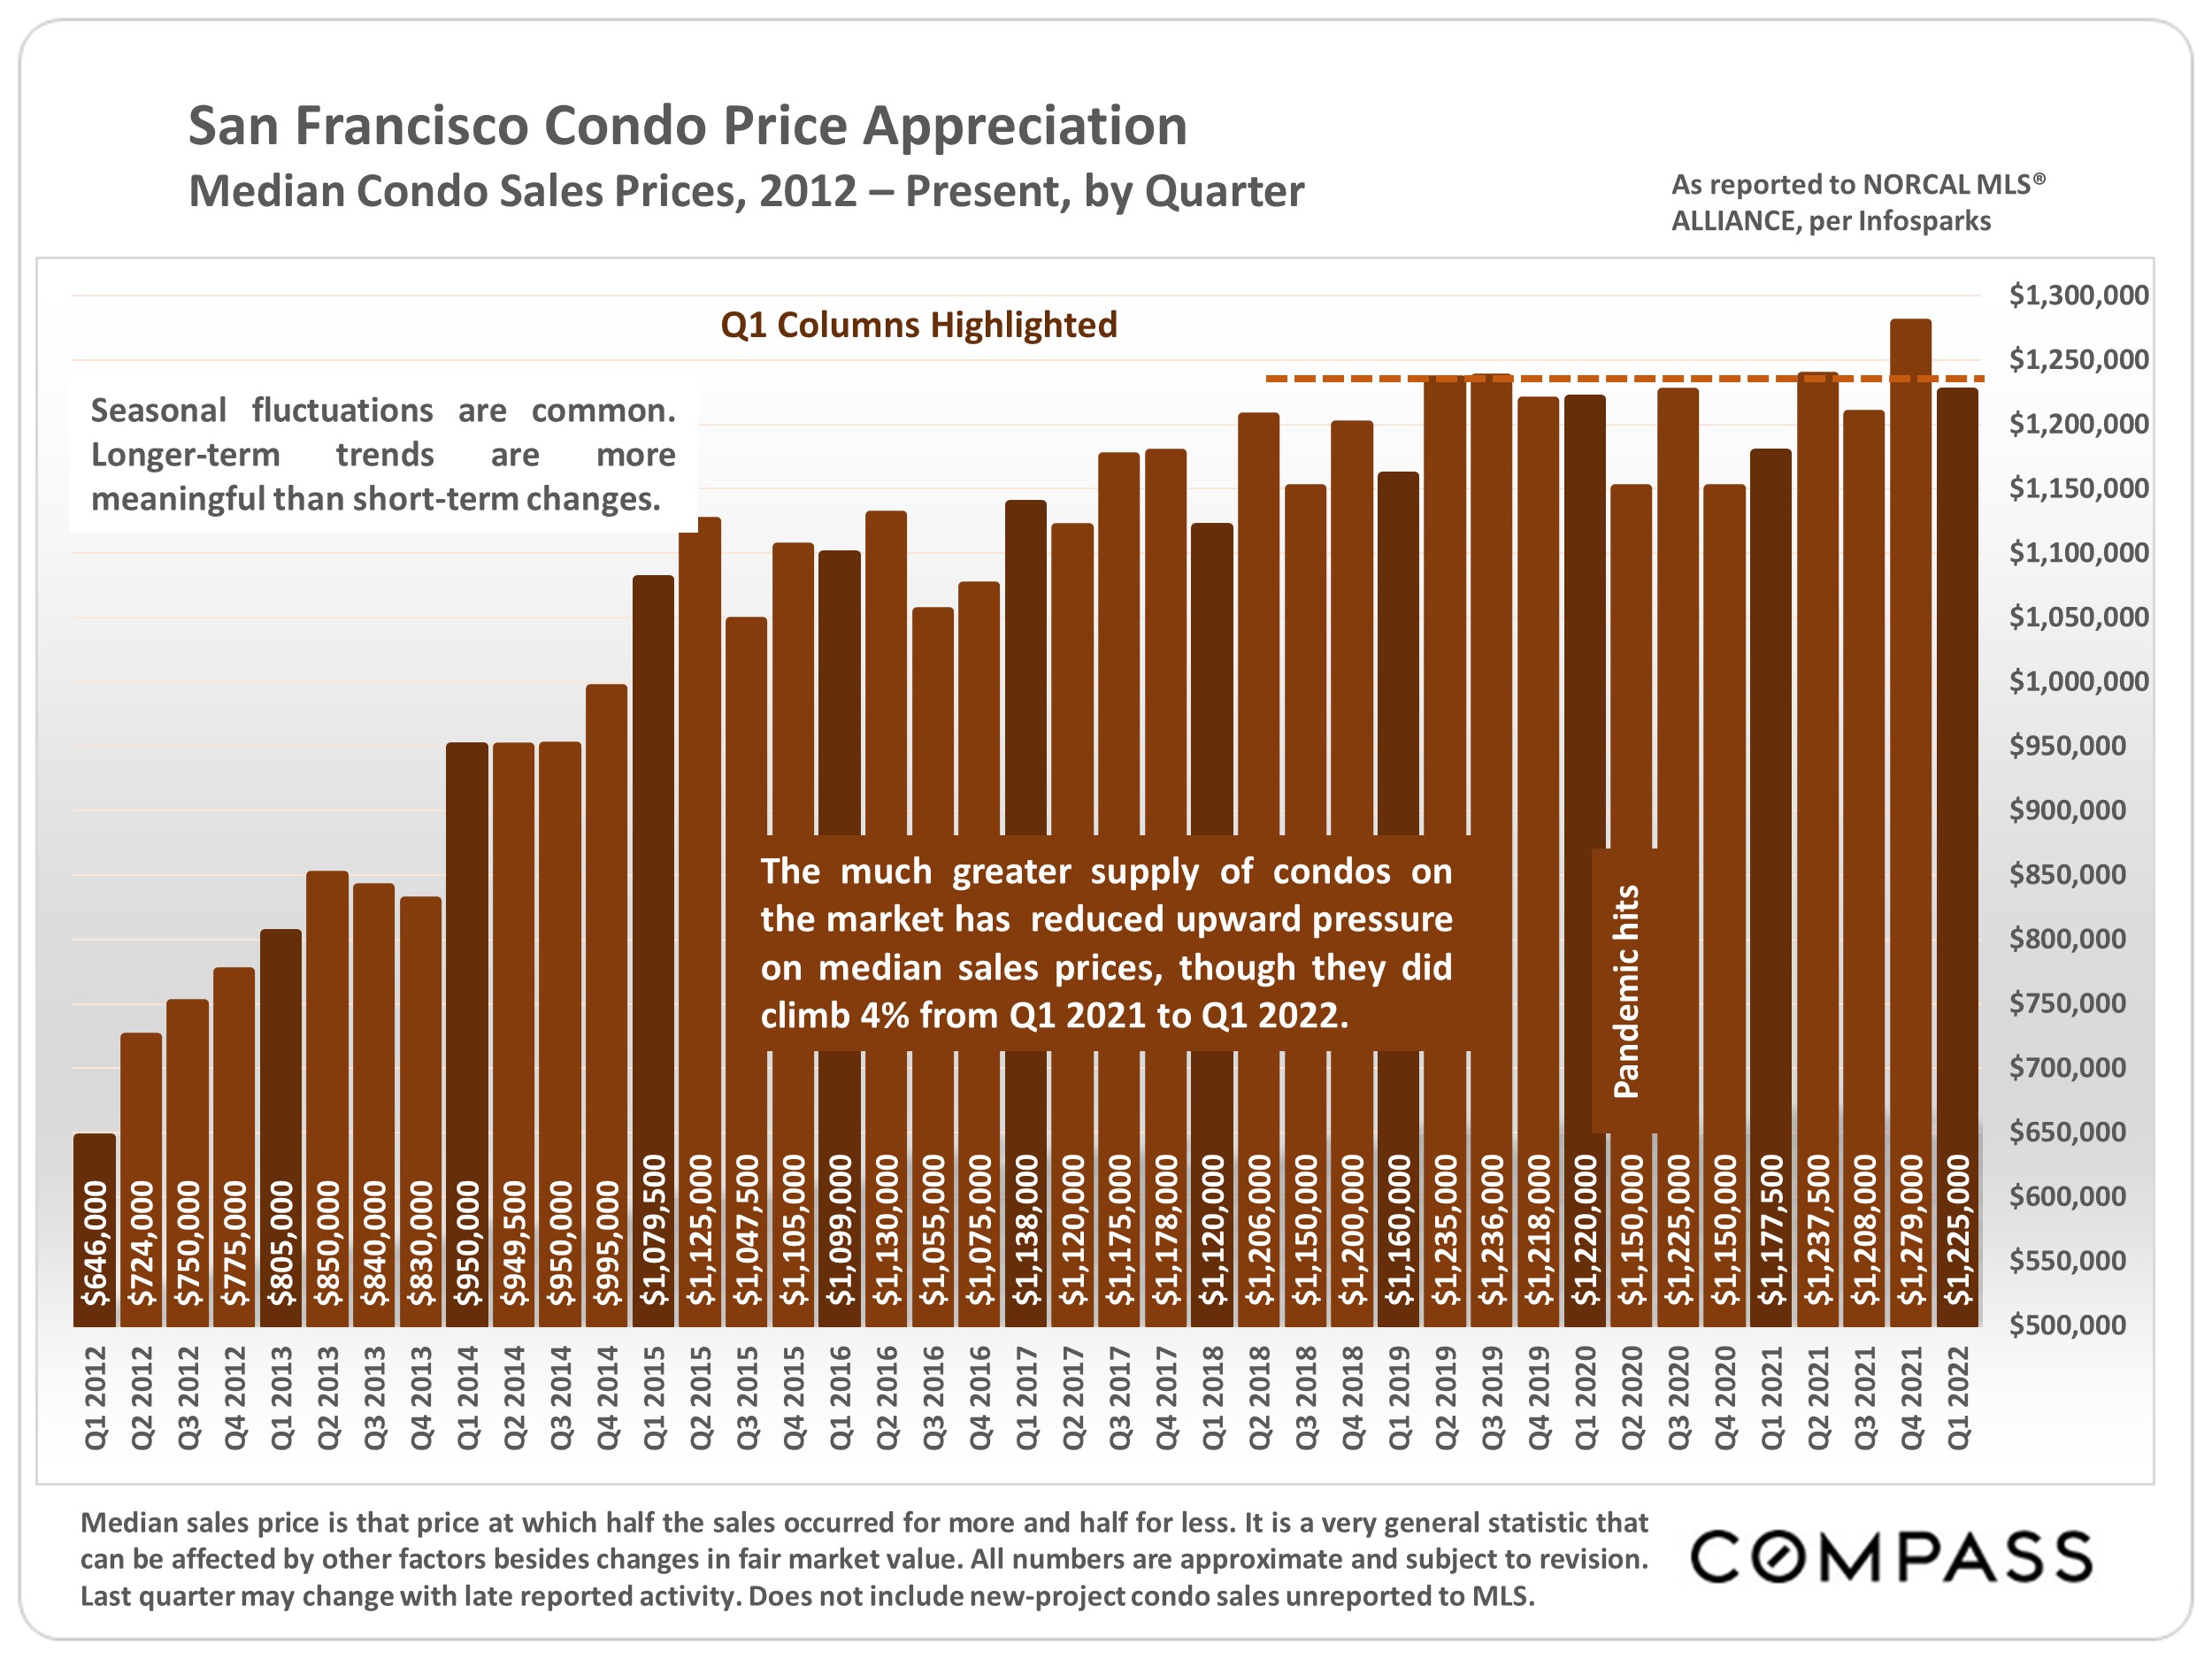
Chart of San Francisco median condo sale prices by quarter, 2012–2022, with Q1 values highlighted.
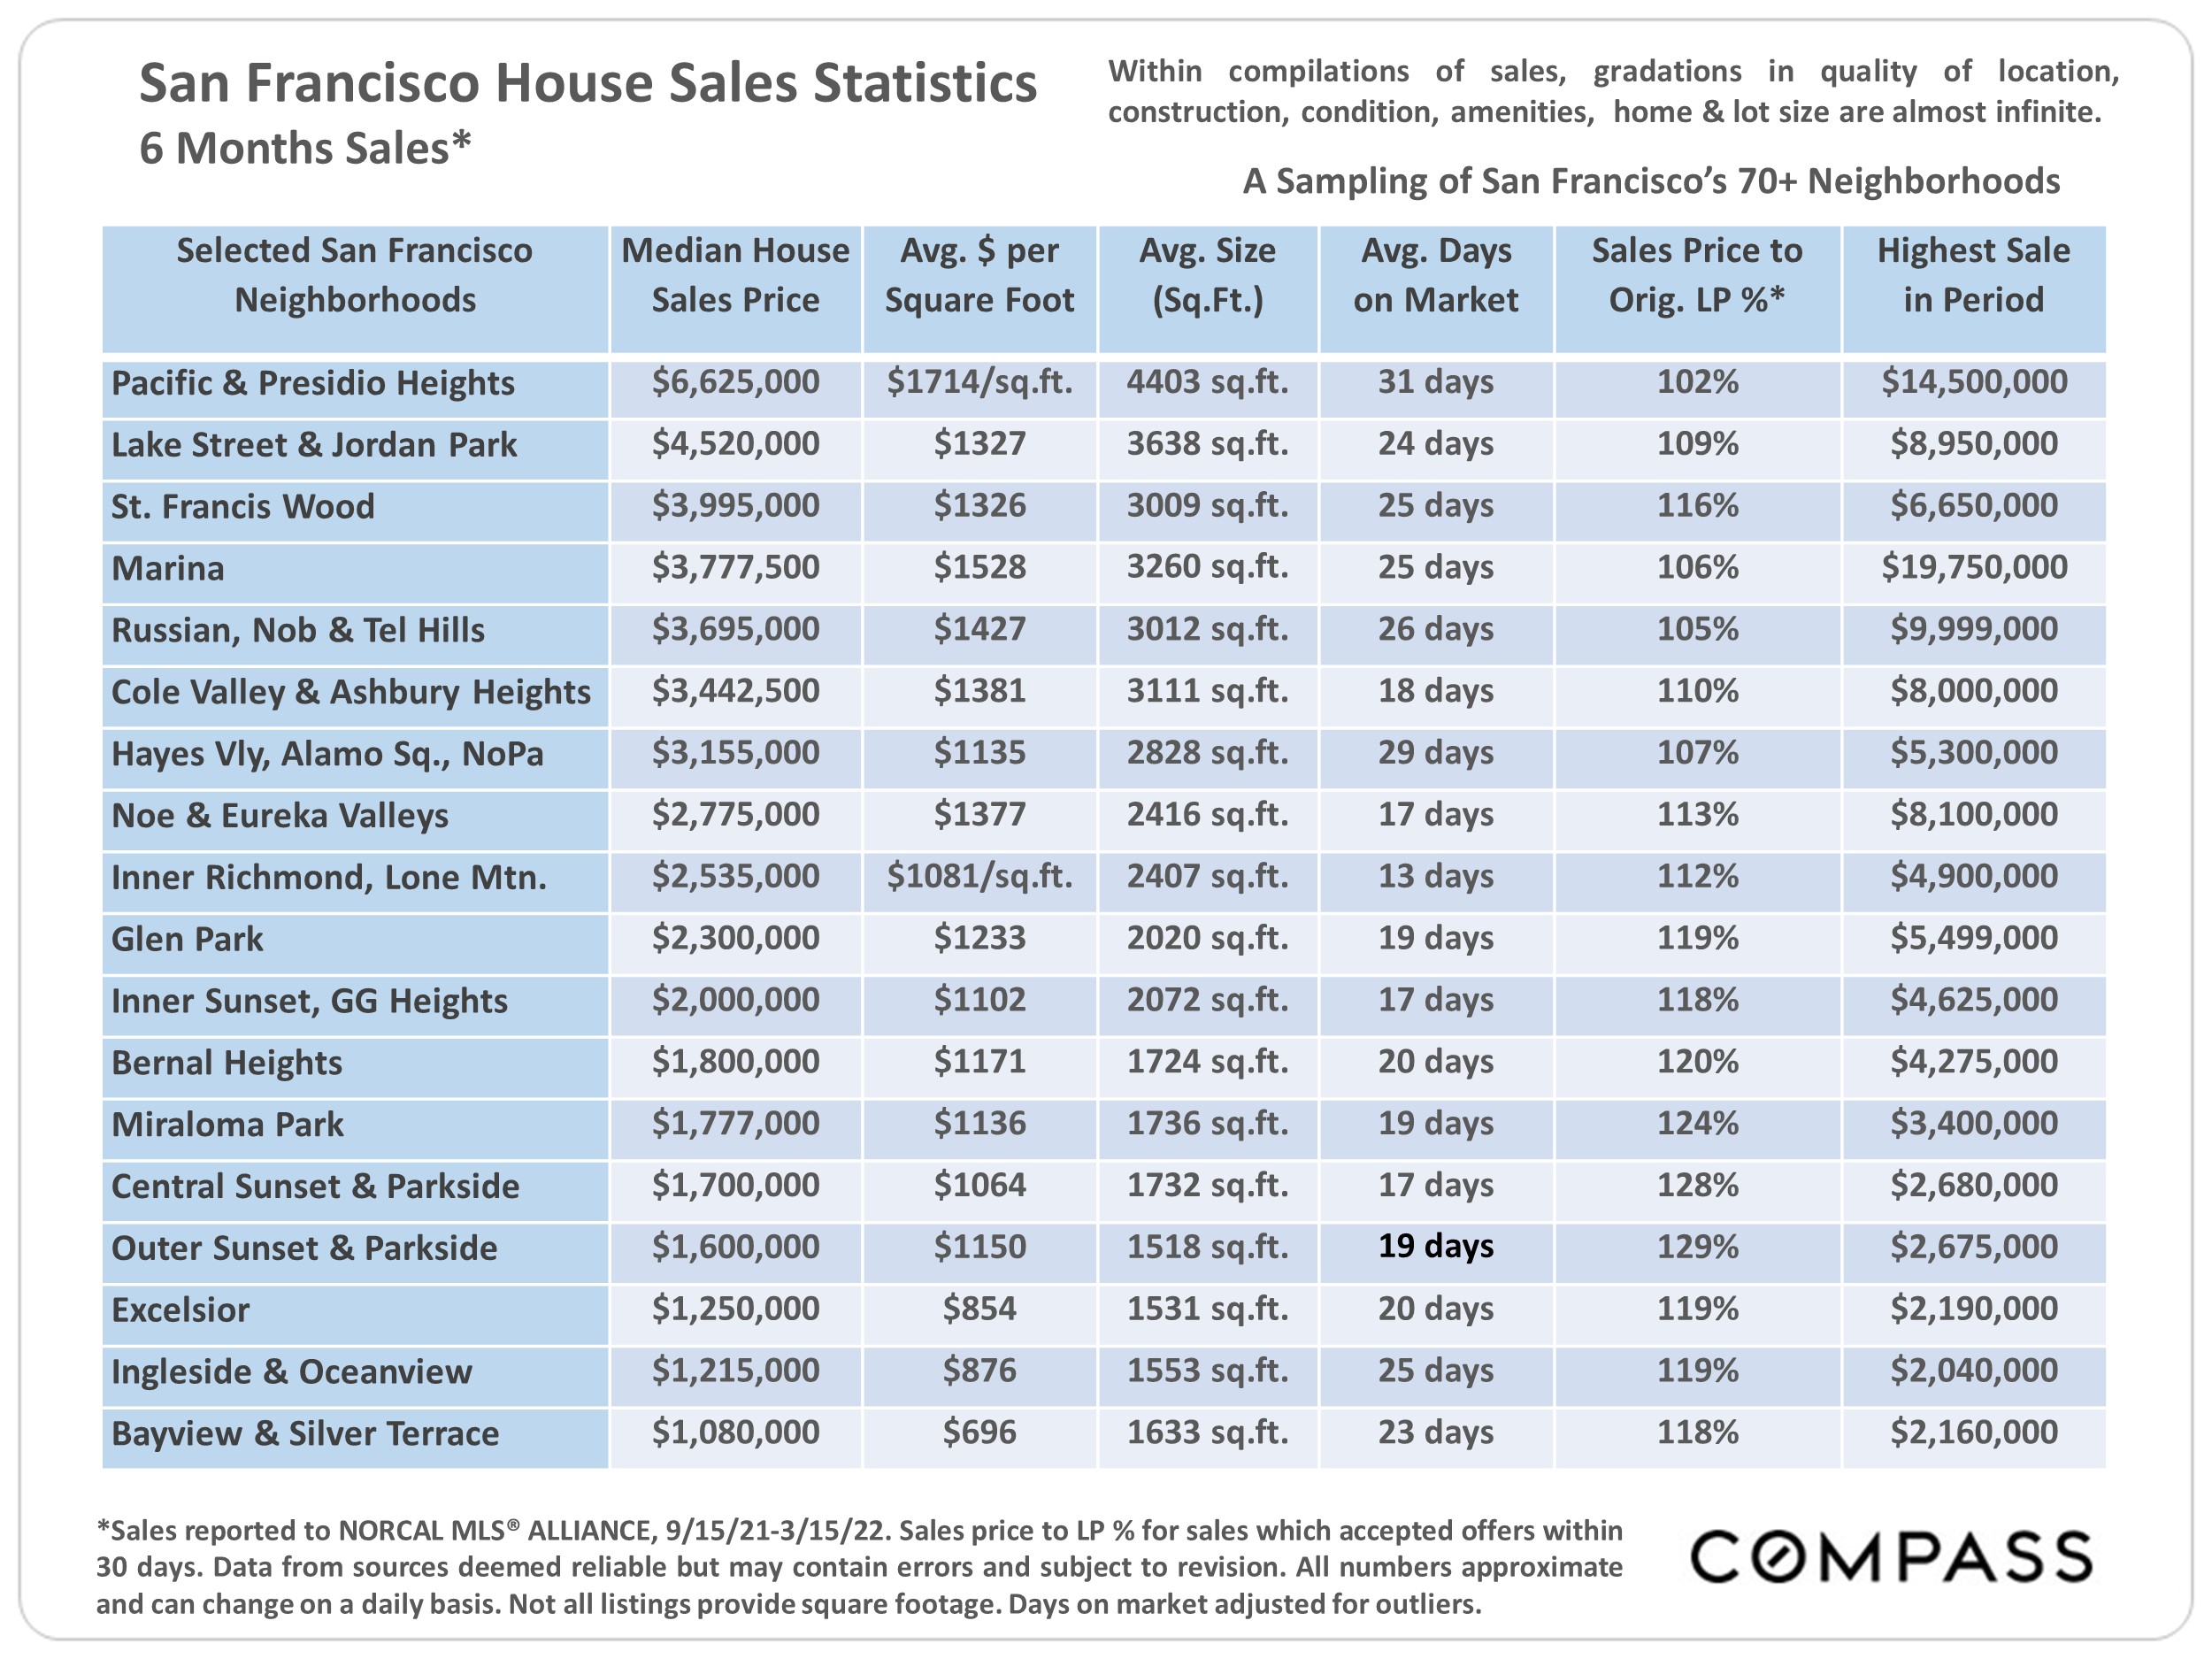
San Francisco neighborhood home-sale statistics table with prices, sizes, days on market, and Compass branding.
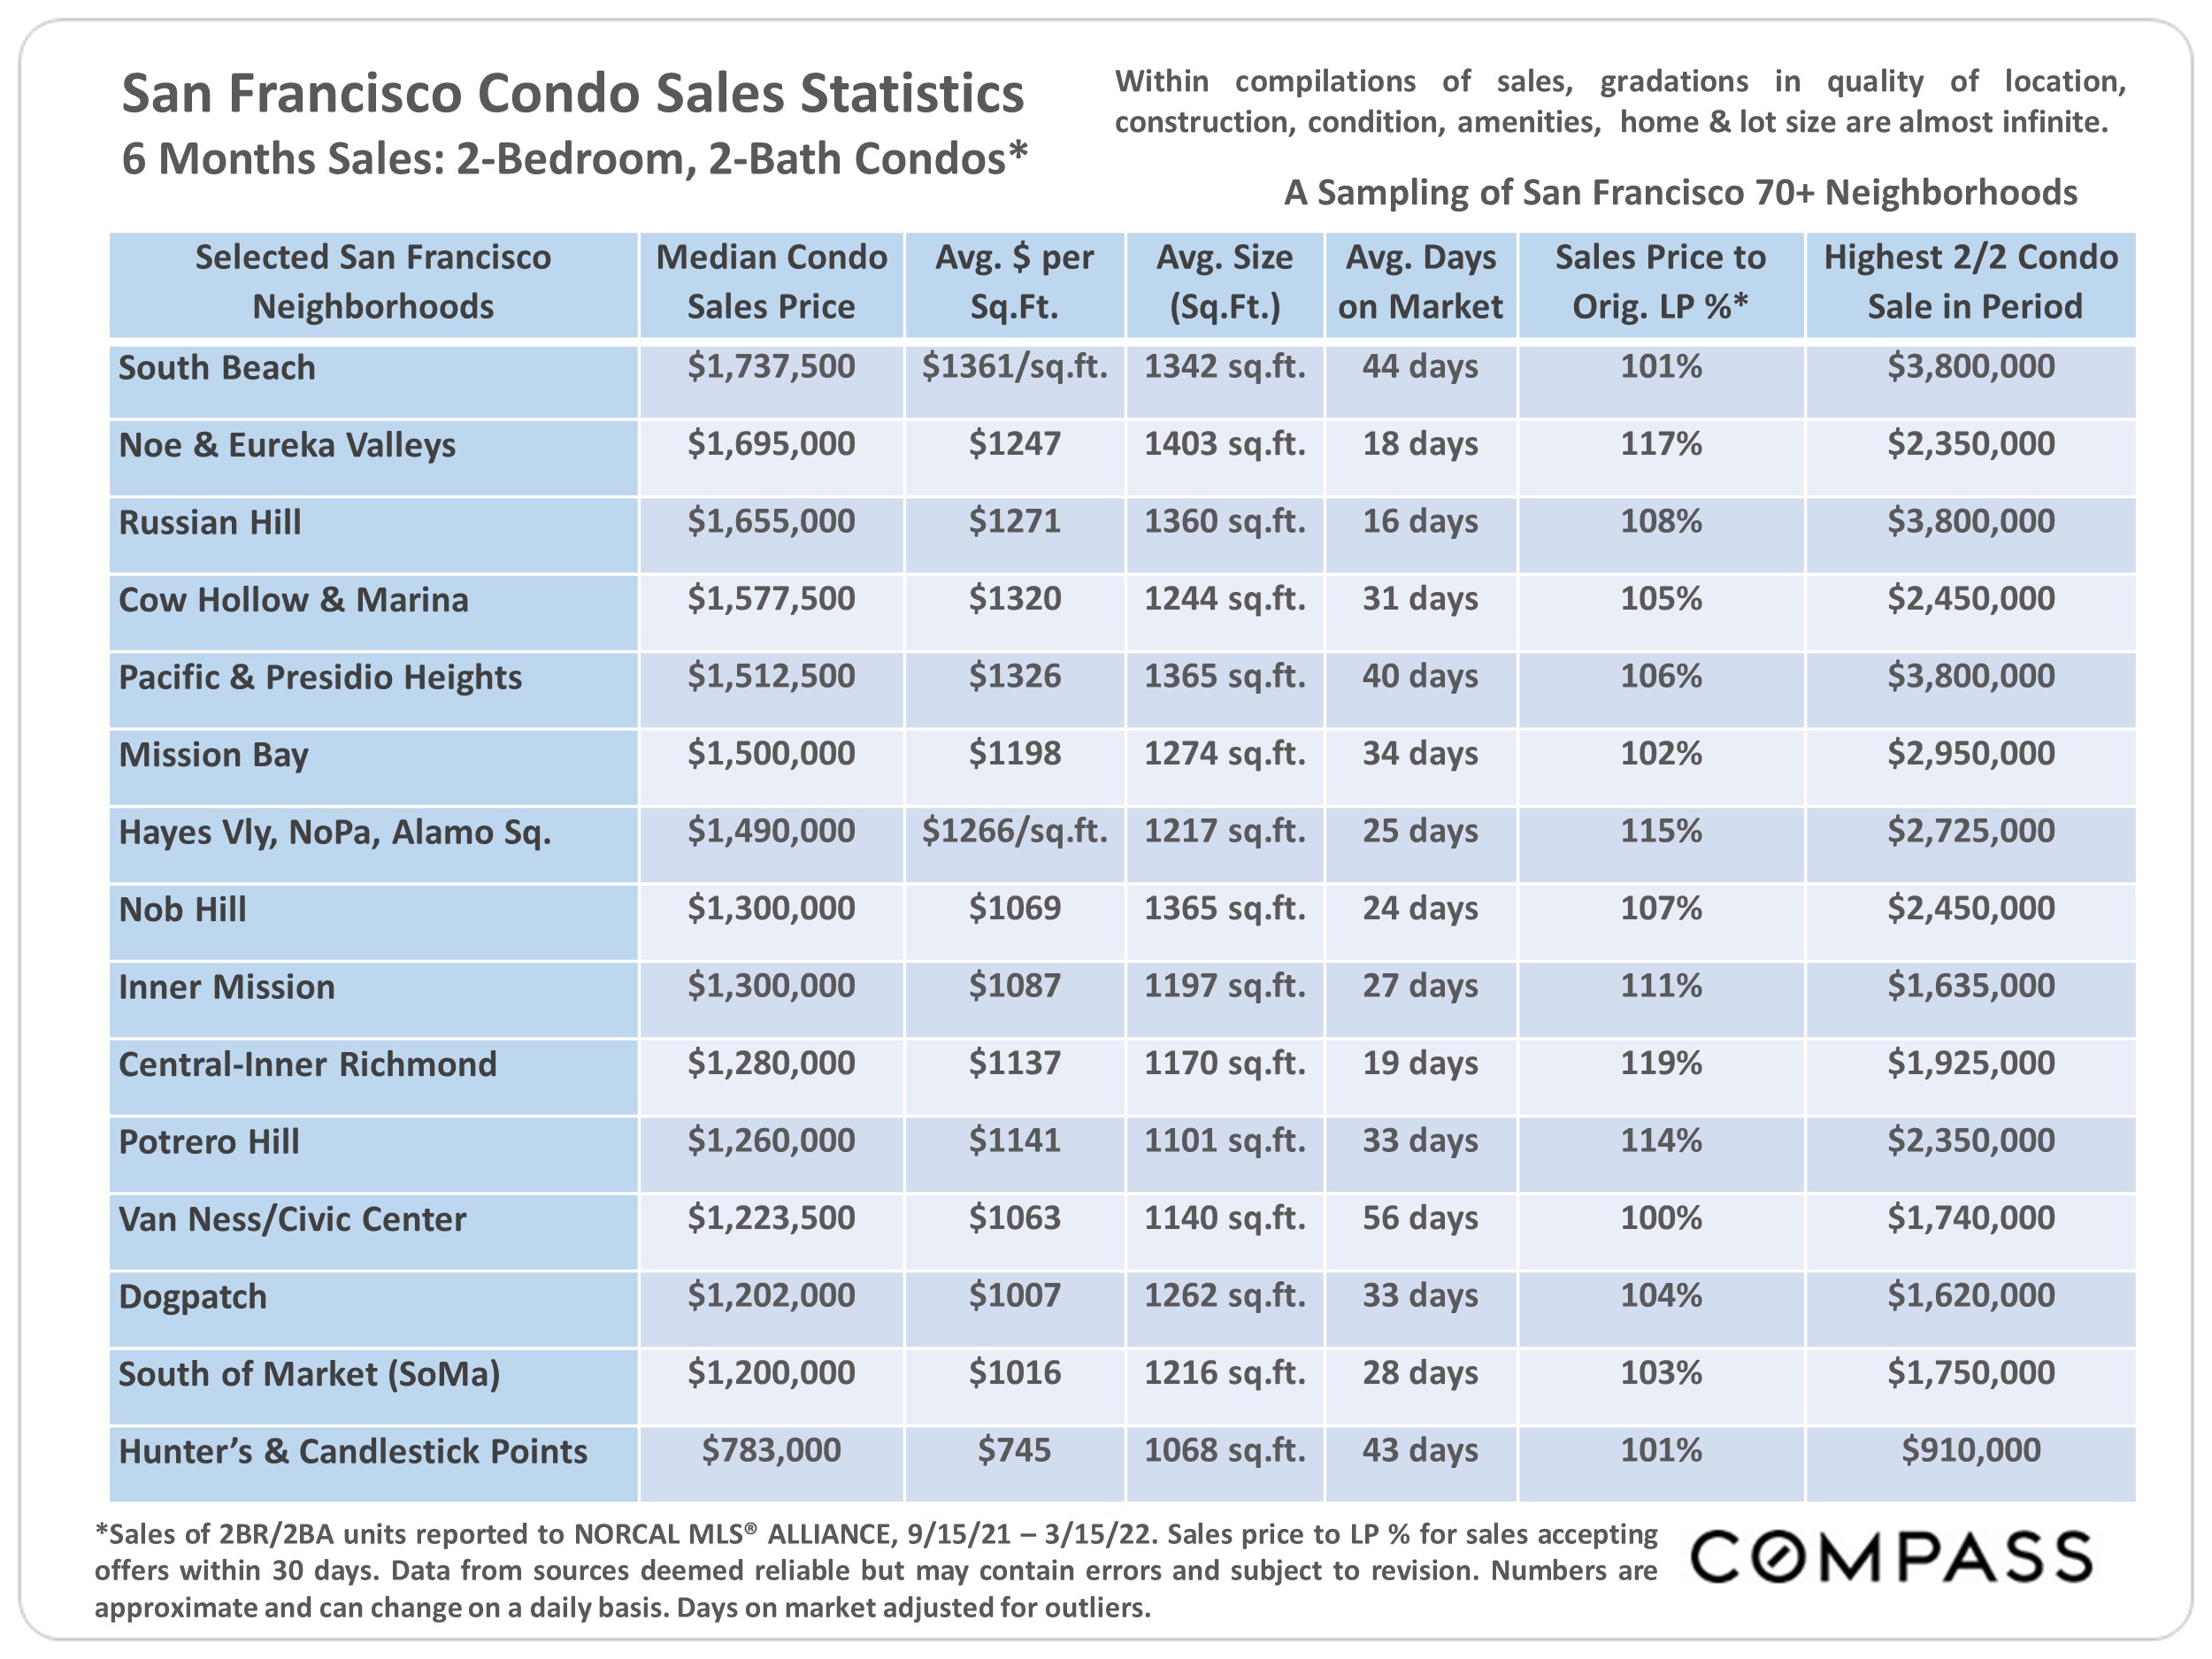
San Francisco condo sales statistics by neighborhood, comparing prices, sizes, days on market, and sale-to-list ratios.
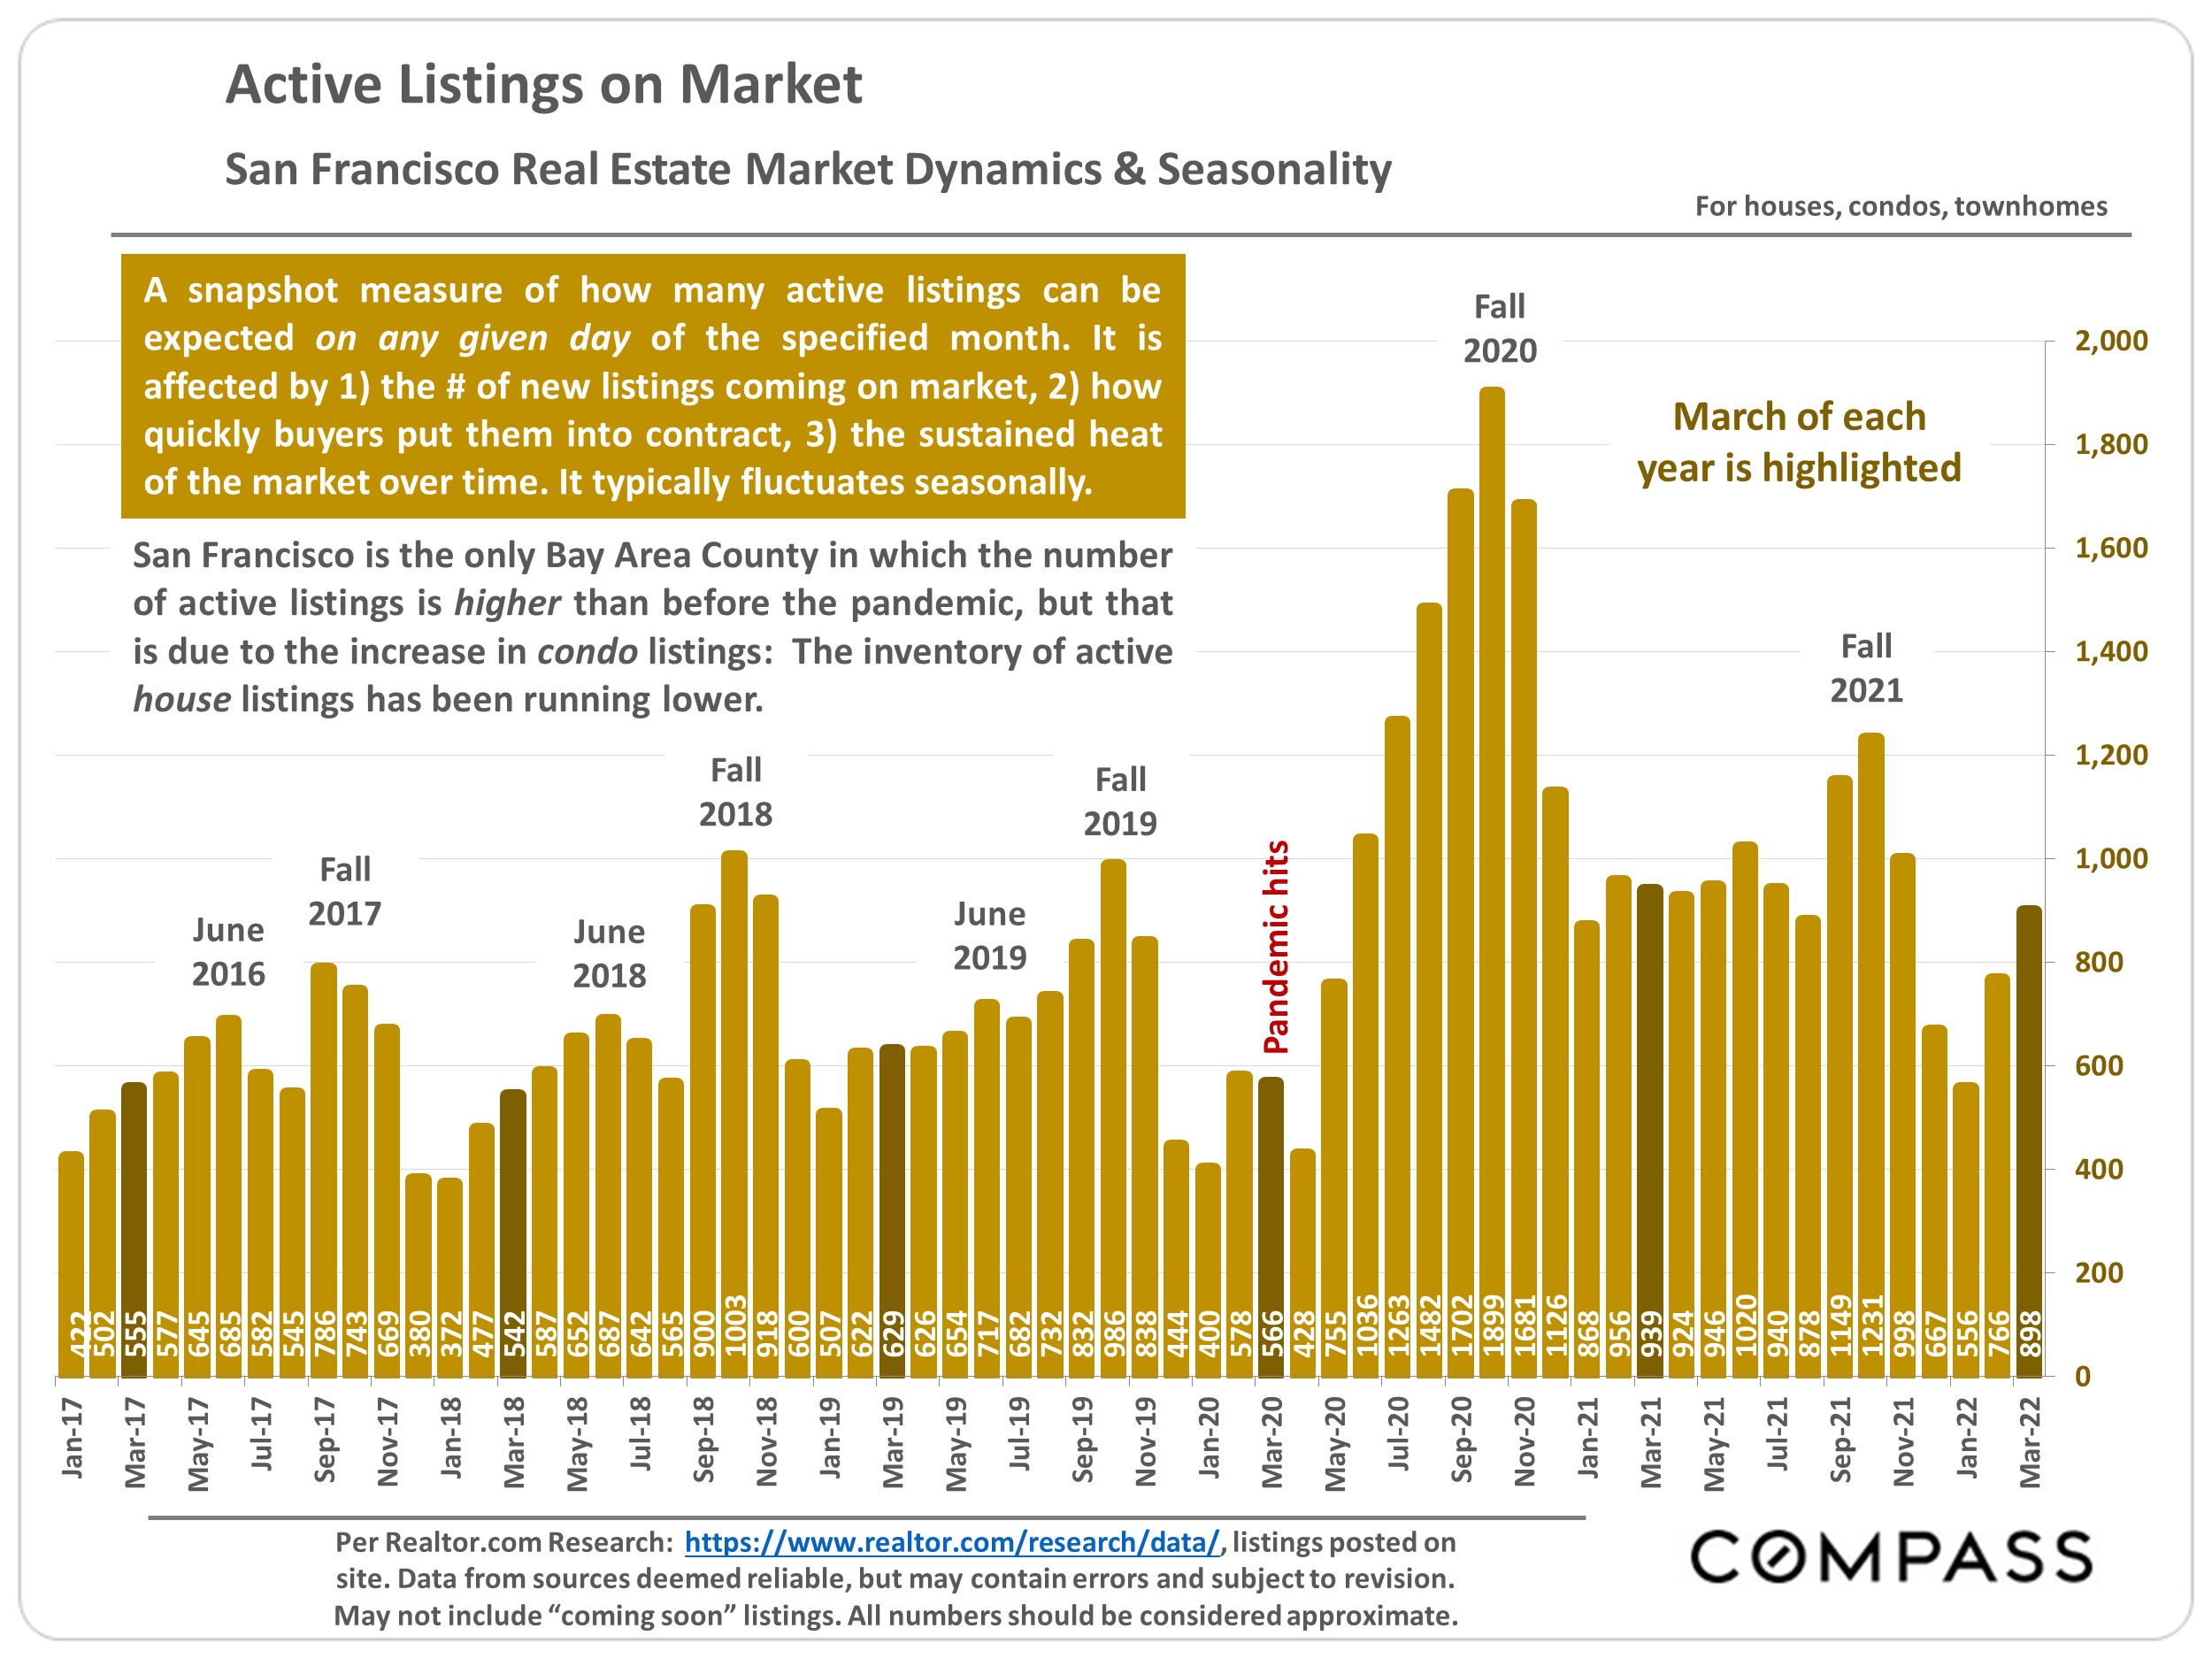
Chart of San Francisco active listings, January 2017–March 2022, with yearly March figures highlighted.
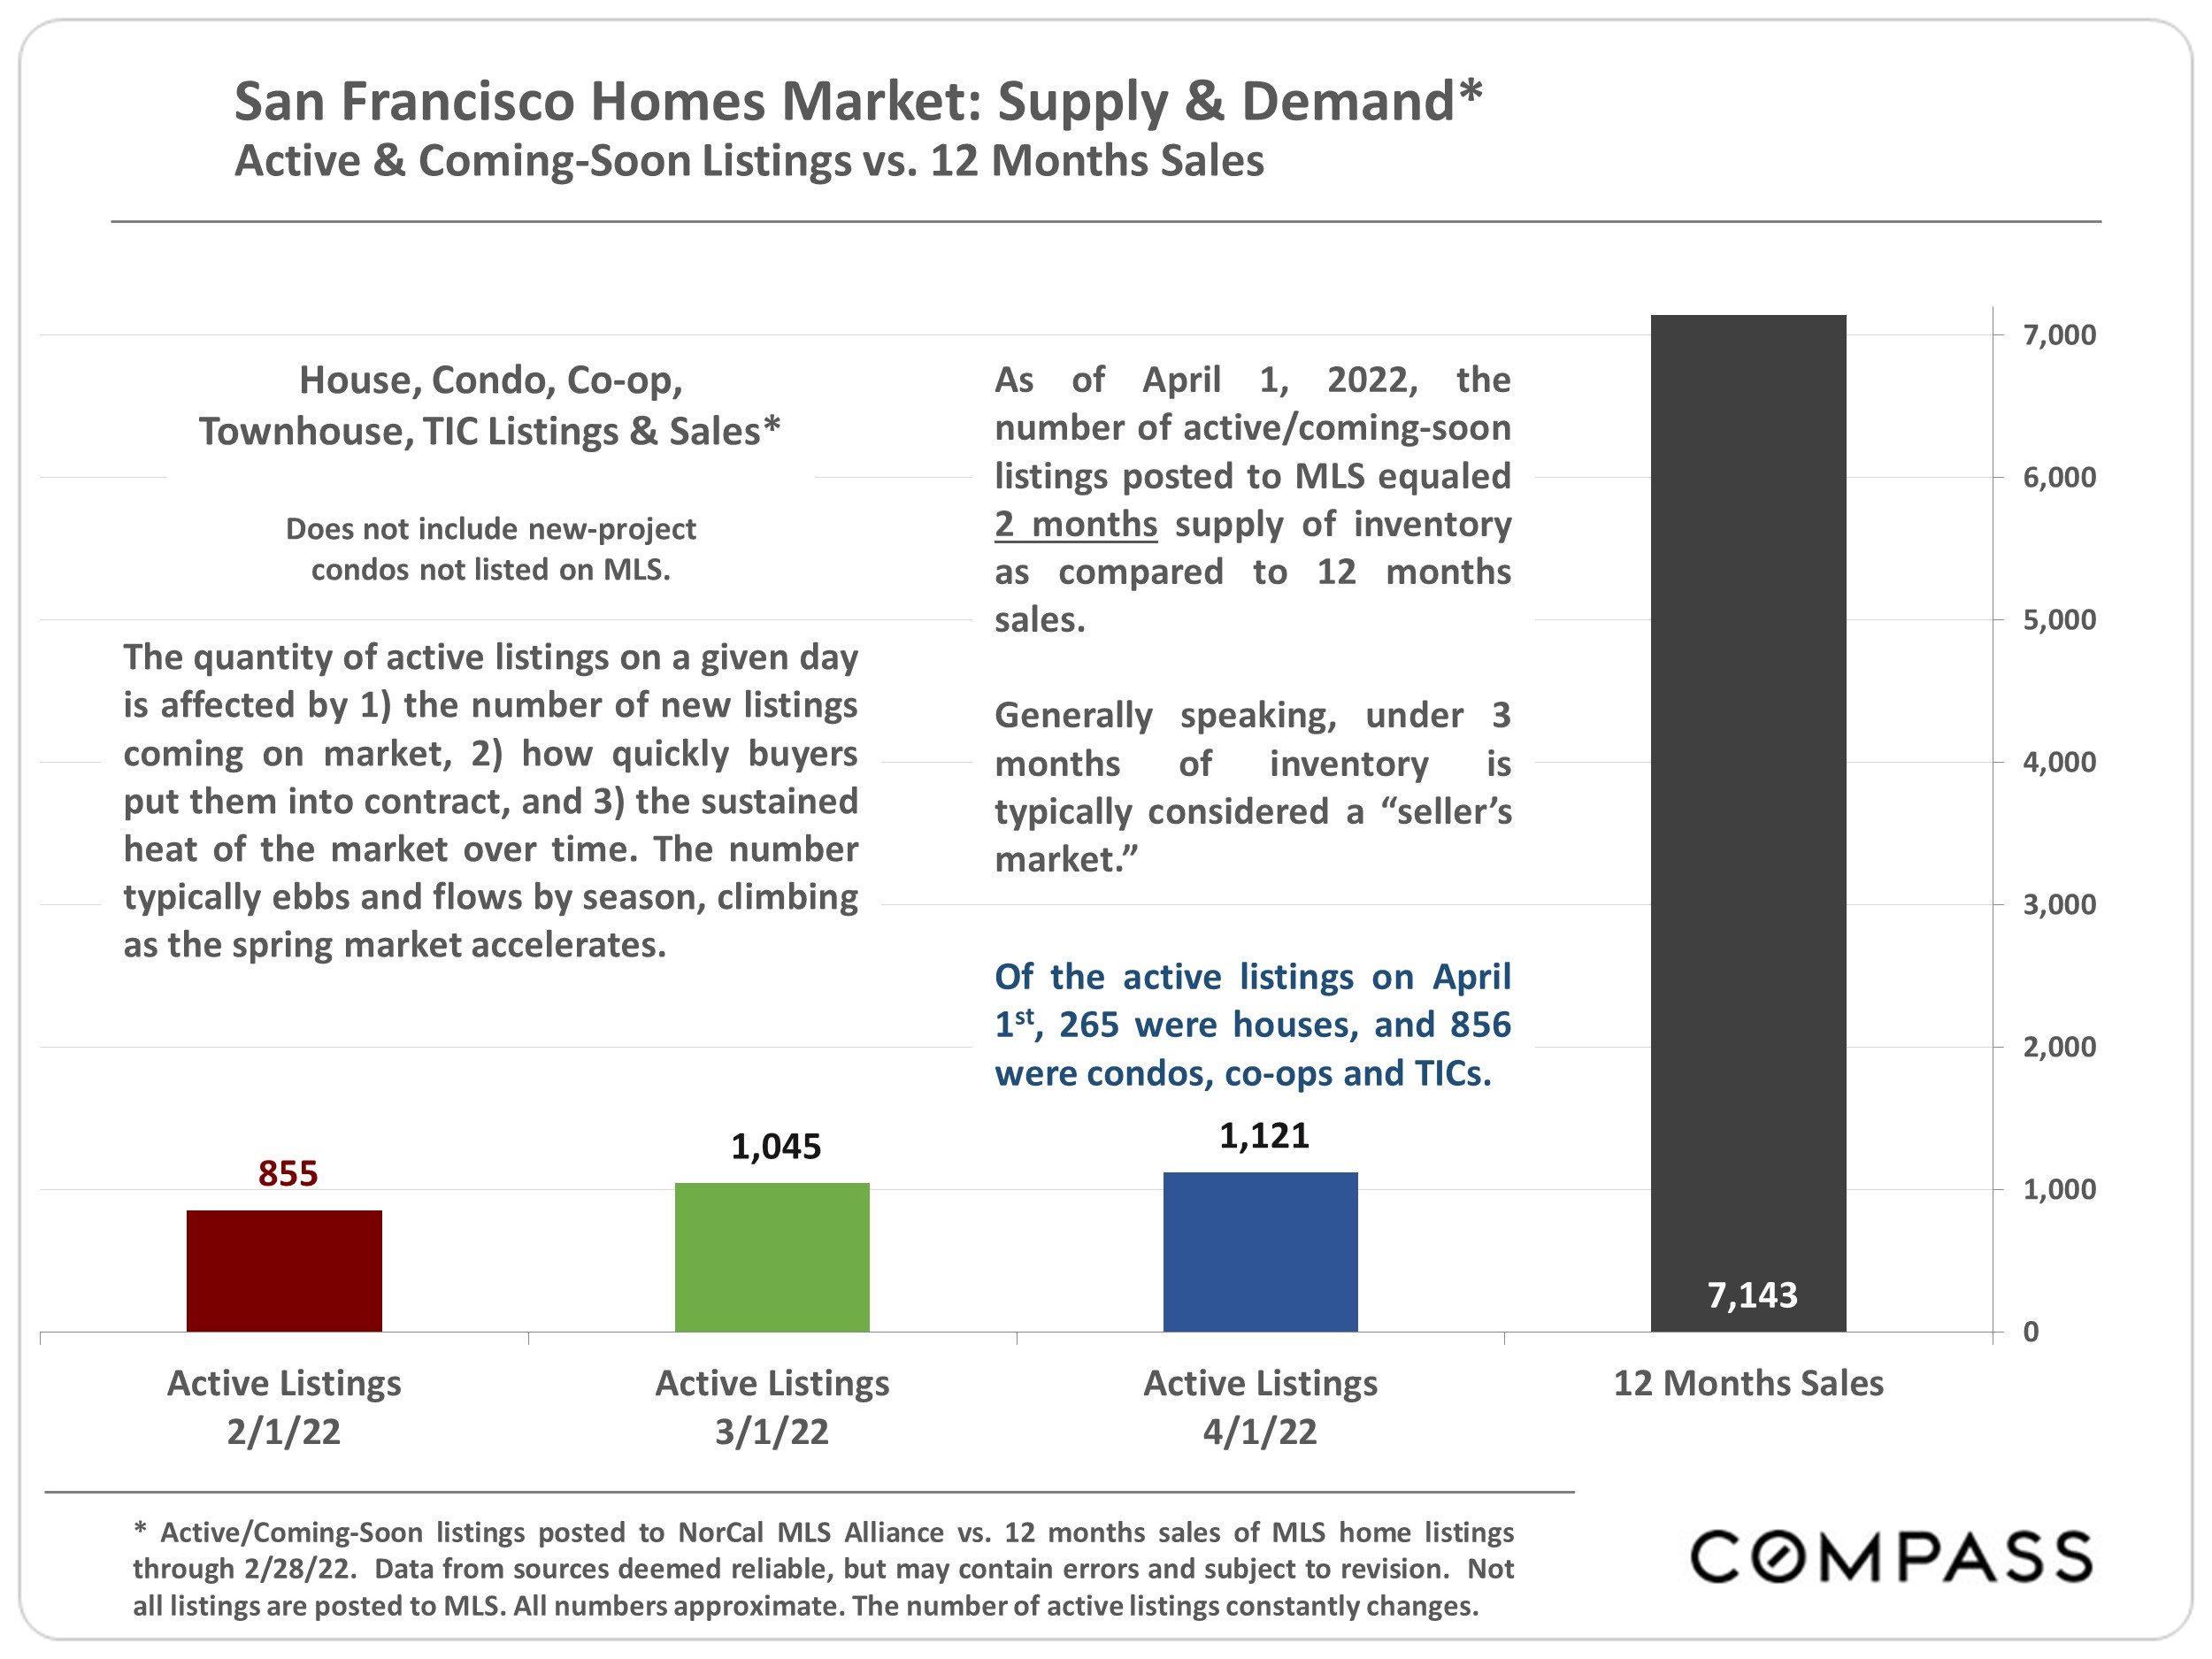
Chart comparing San Francisco active listings in February, March, and April 2022 with 12 months of sales.
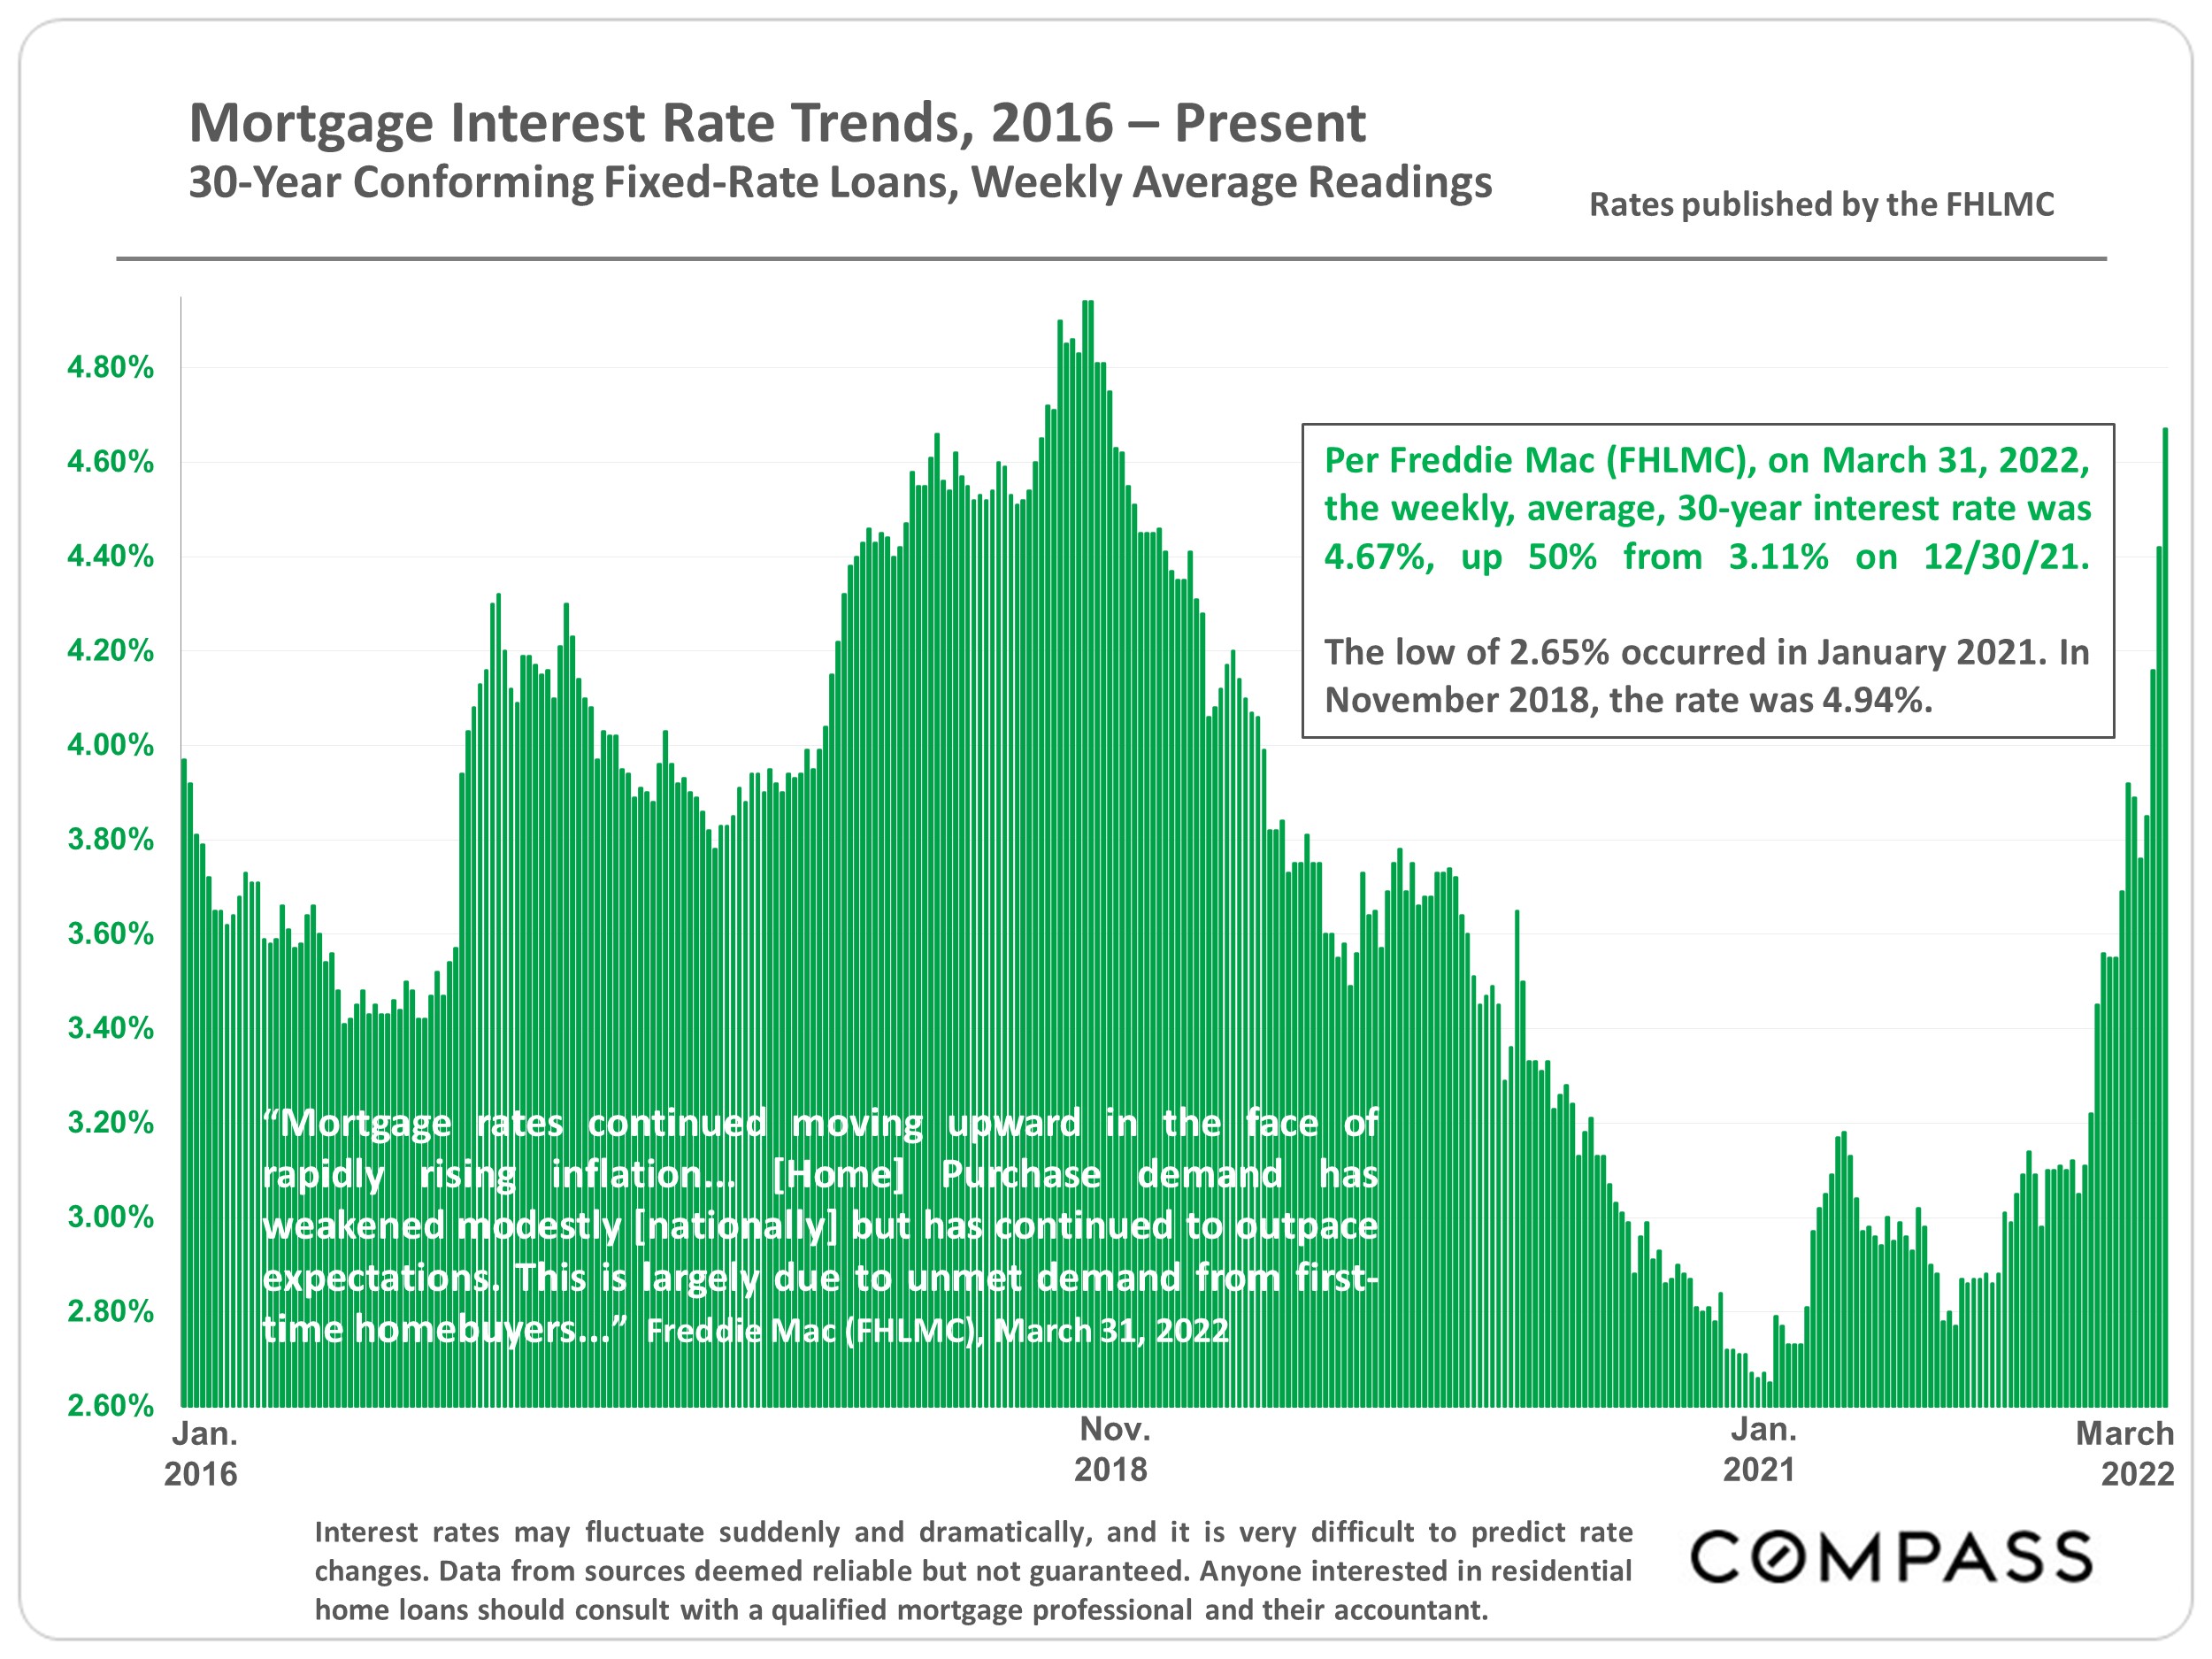
Chart of 30-year mortgage rates from 2016 to March 2022, highlighting the sharp rise to 4.67%.
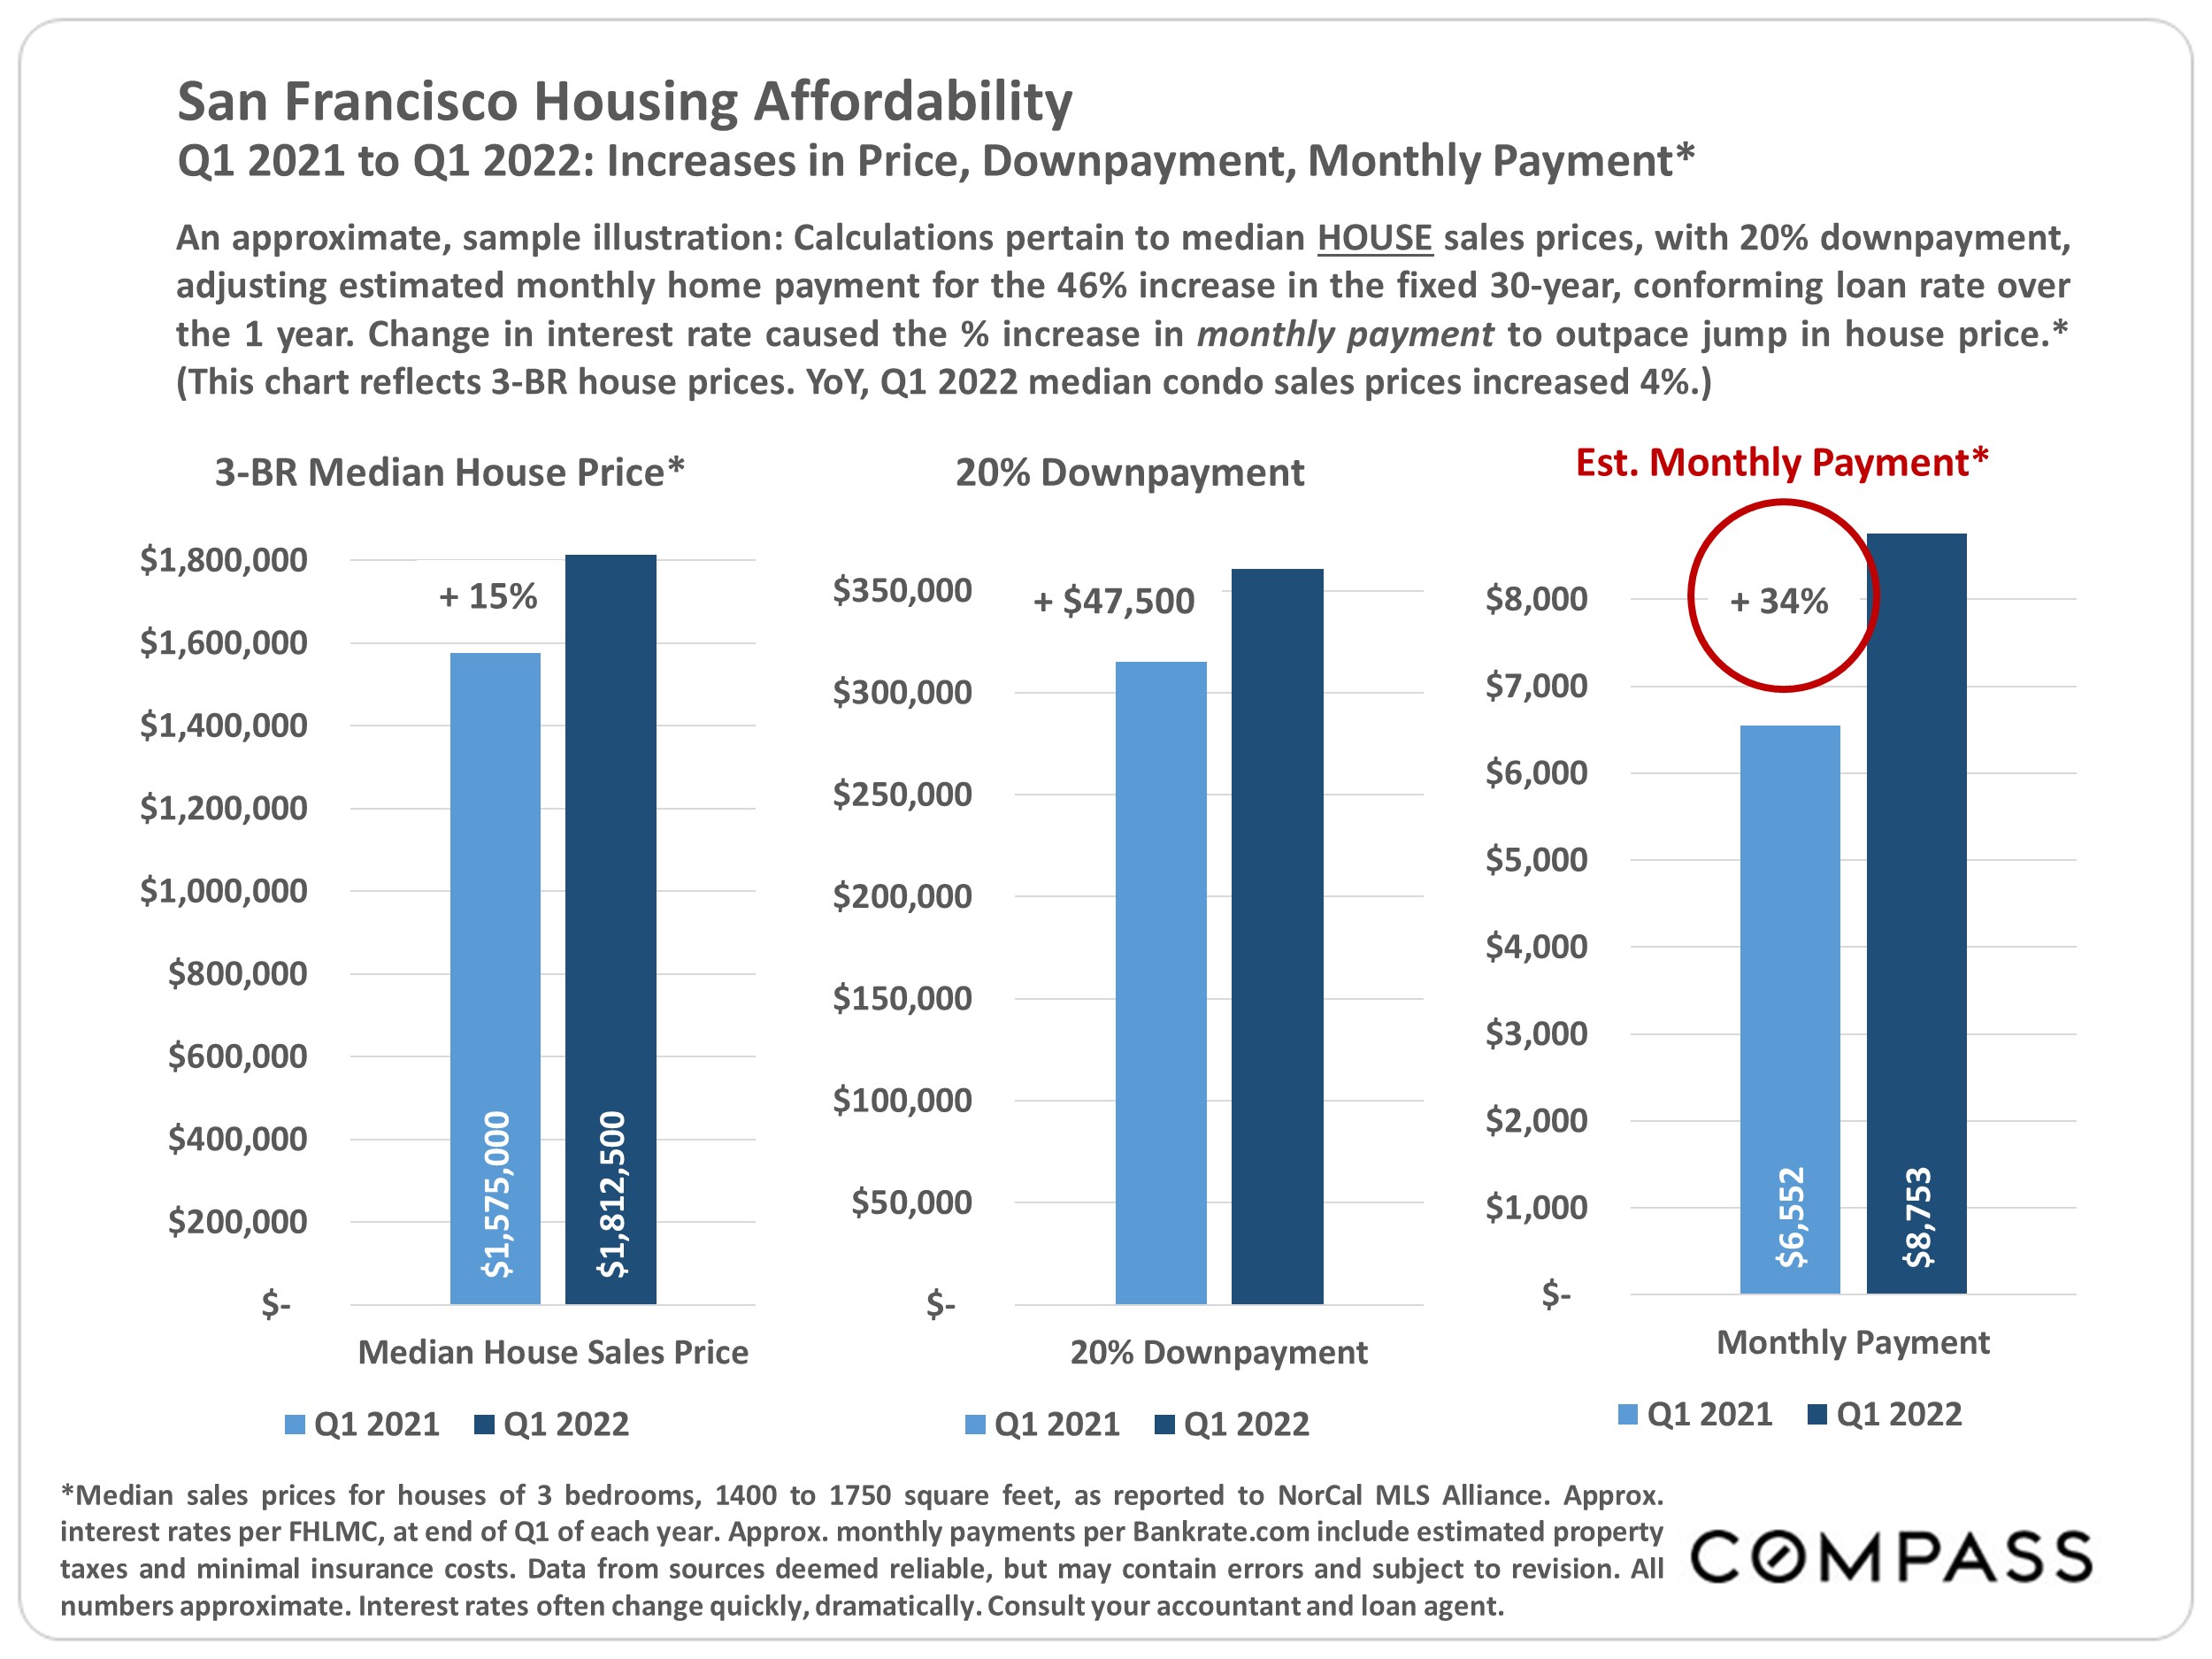
San Francisco housing affordability charts compare 2021 and 2022 home prices, downpayments, and monthly payments.
Chart showing seasonal patterns in San Francisco new listings from December 2017 to March 2022.
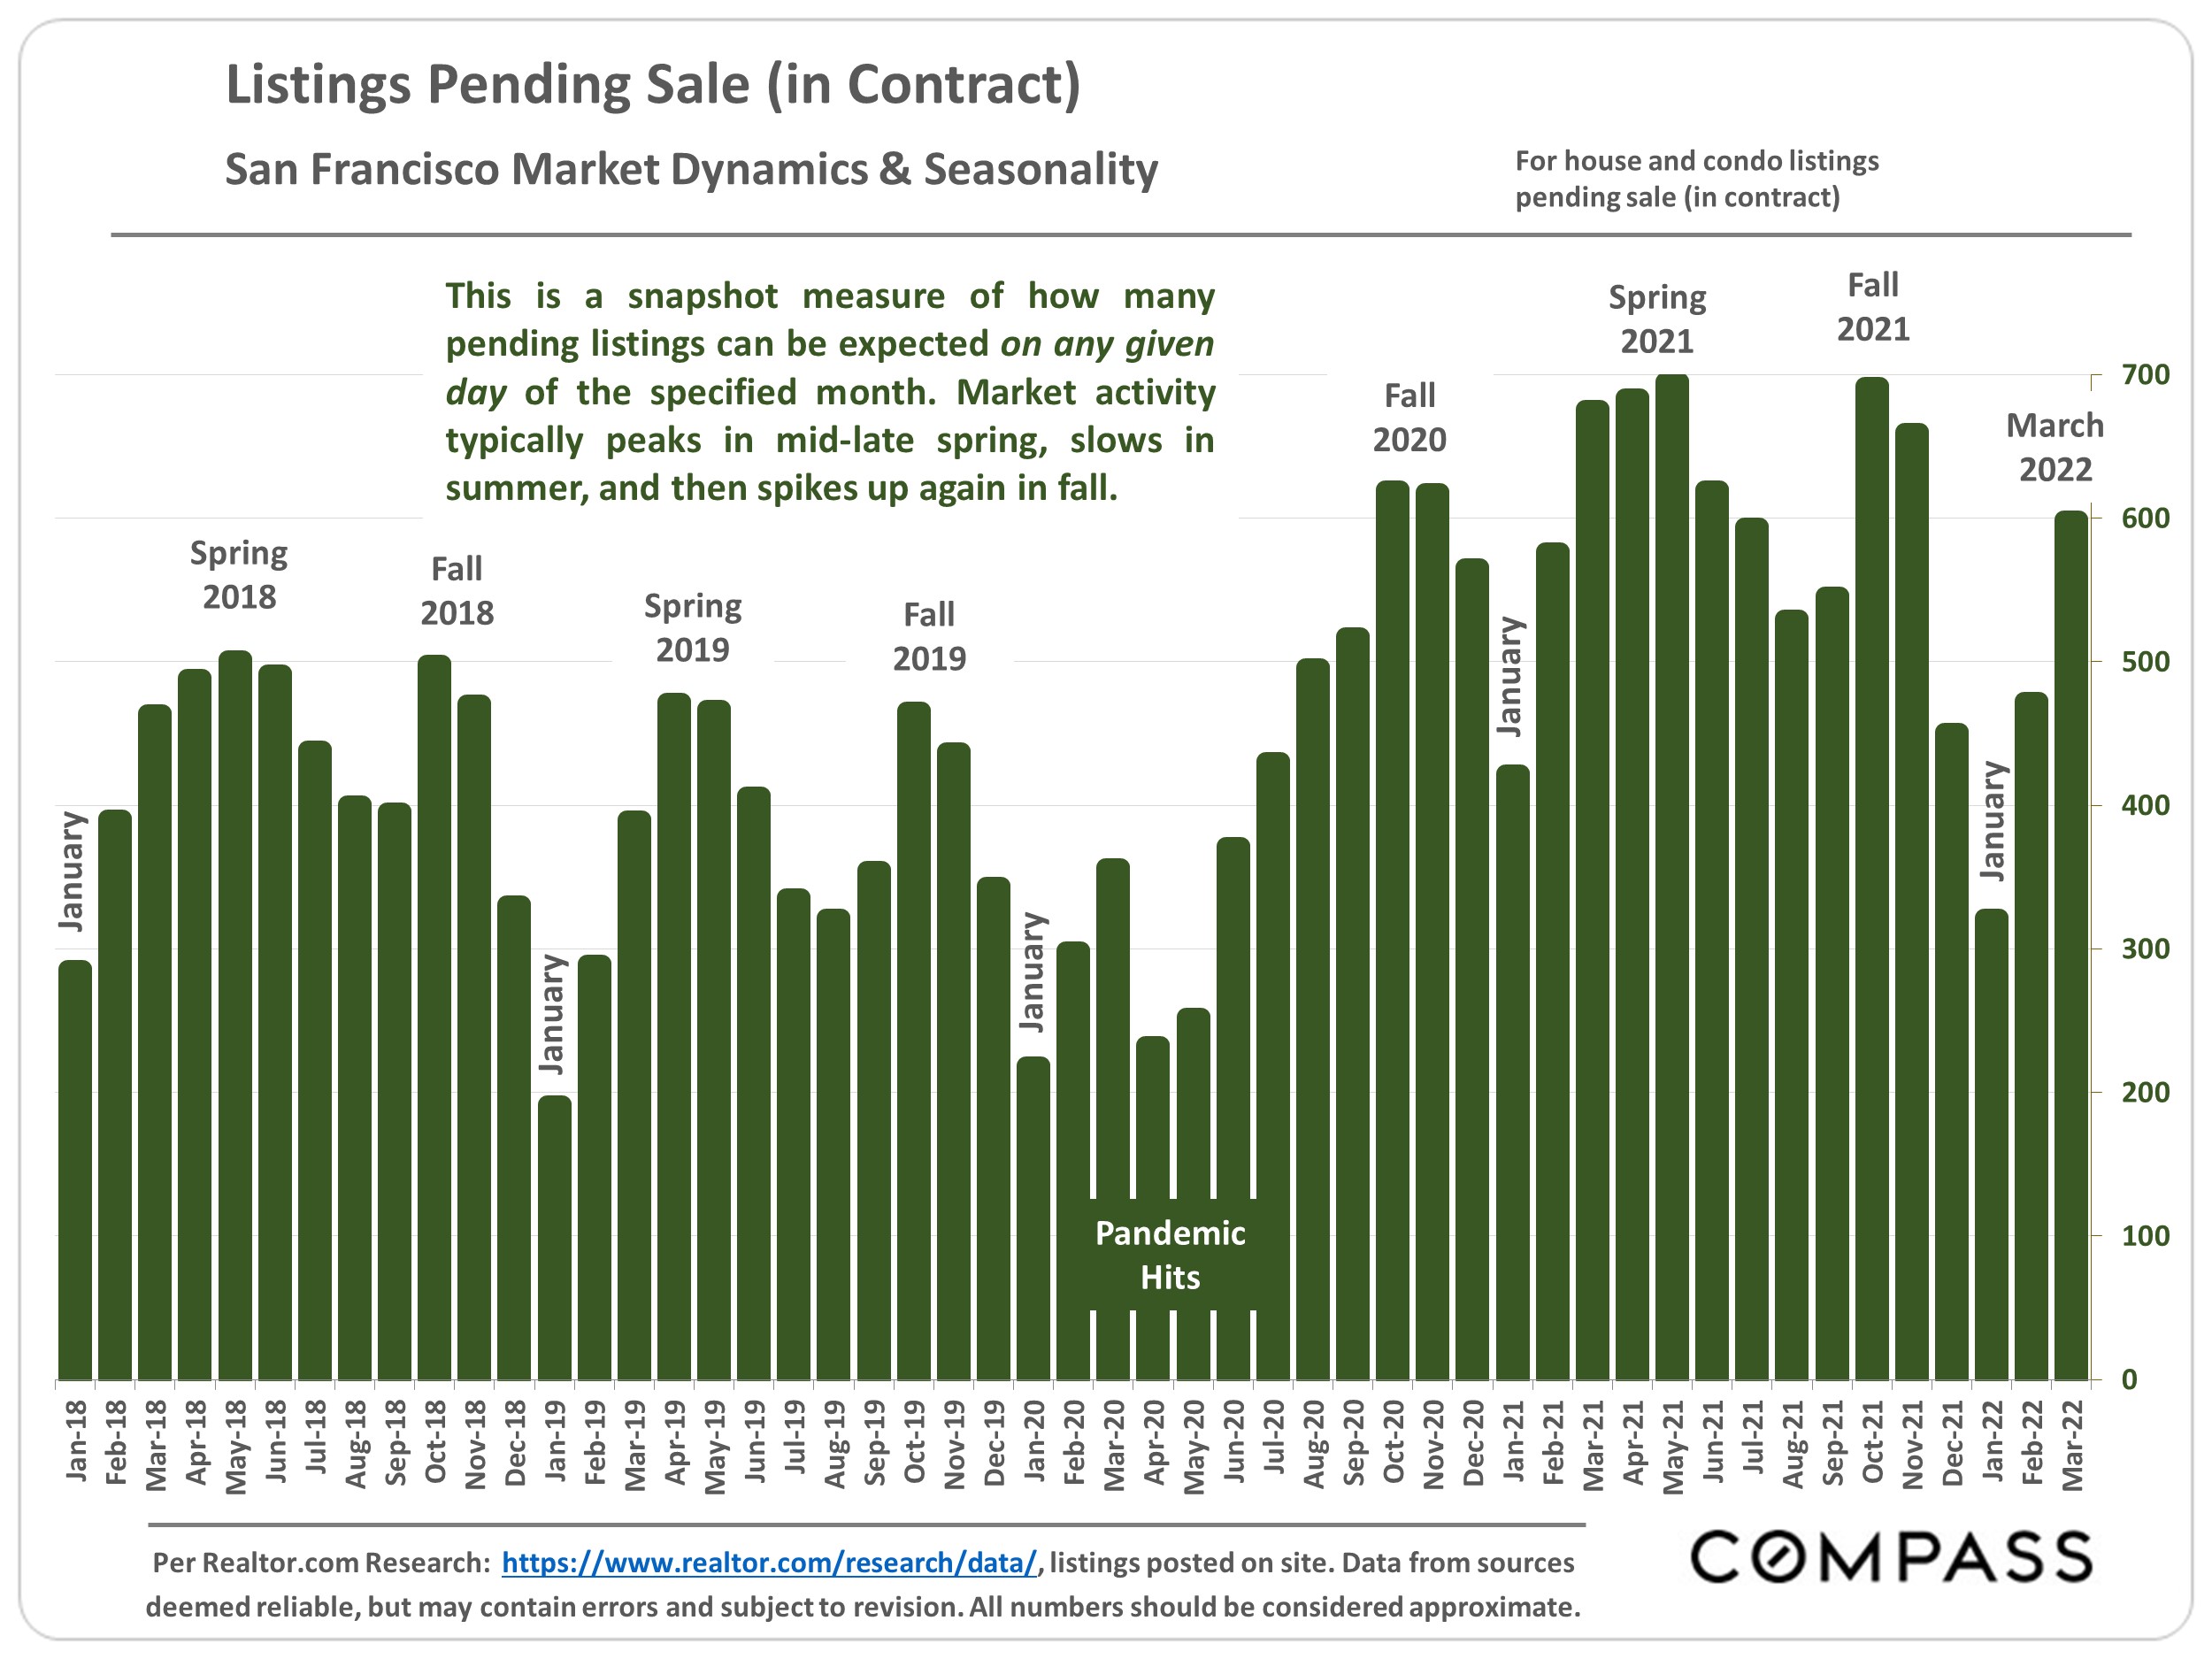
San Francisco pending home listings, Jan 2018–Mar 2022, showing seasonal peaks and a pandemic-era dip.
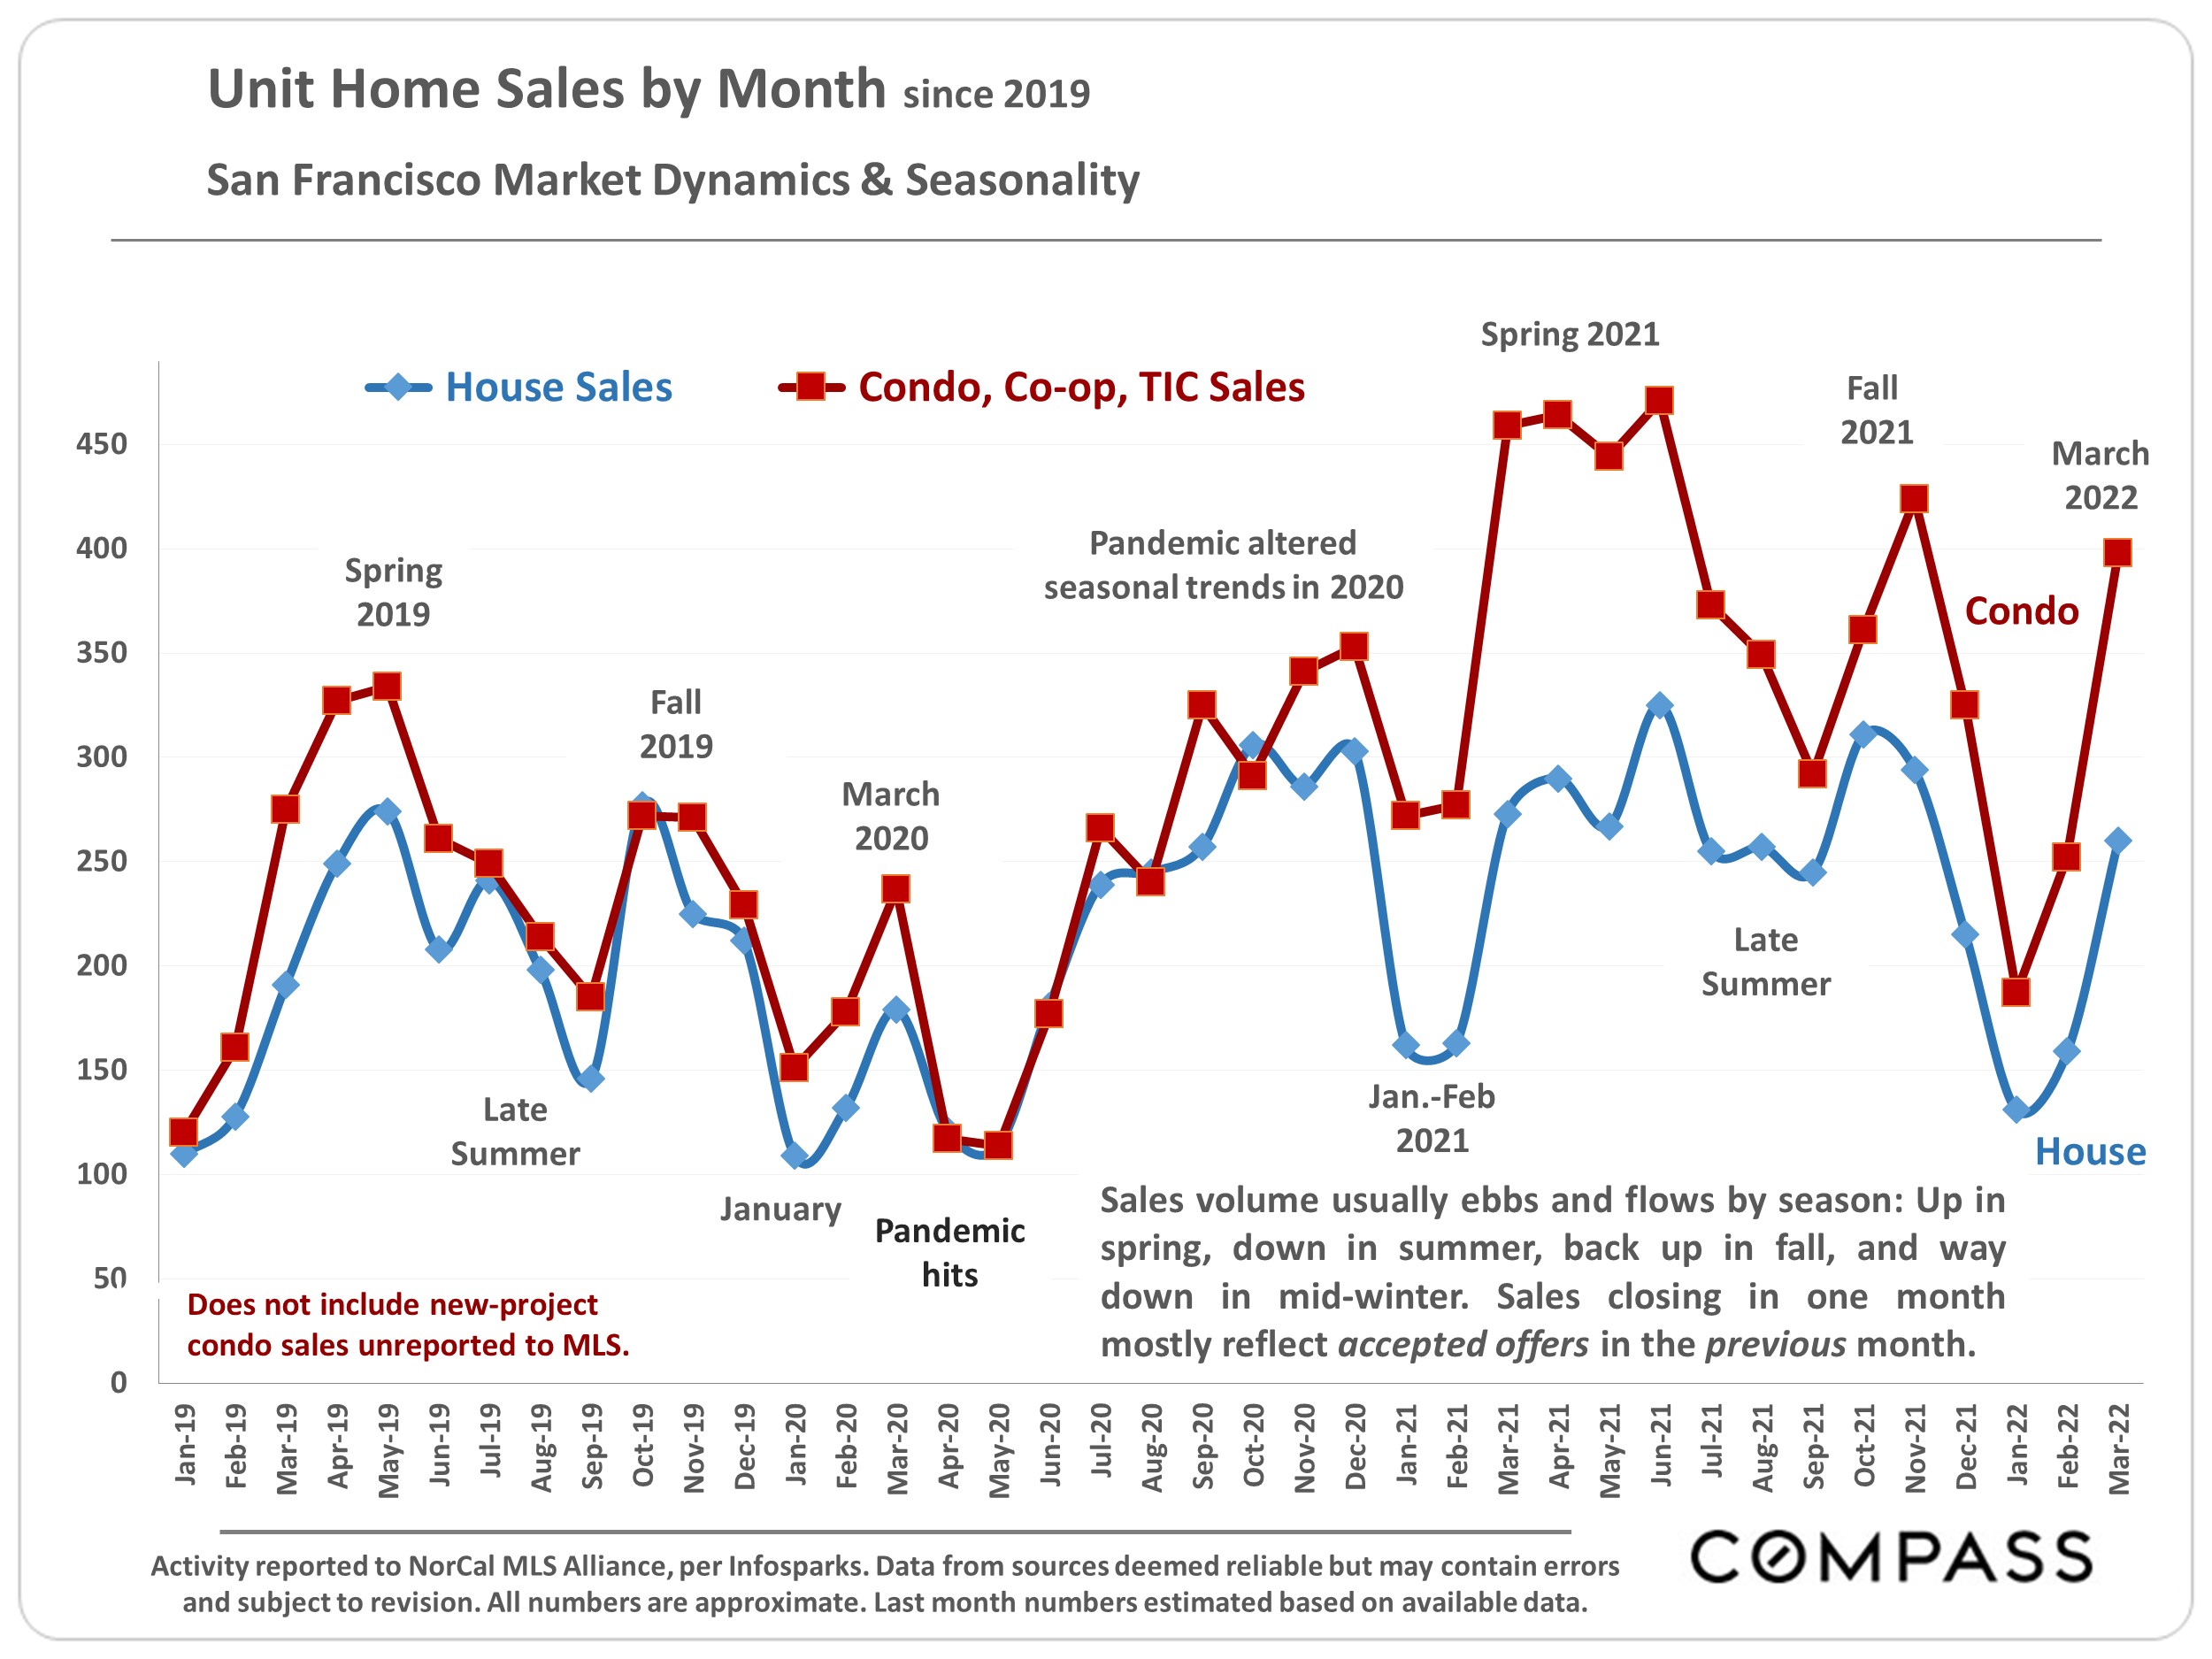
Chart comparing monthly San Francisco house and condo sales from 2019 to March 2022, with seasonal and pandemic annotations.
Chart compares quarterly San Francisco luxury house and condo sales from 2018 through early 2022.
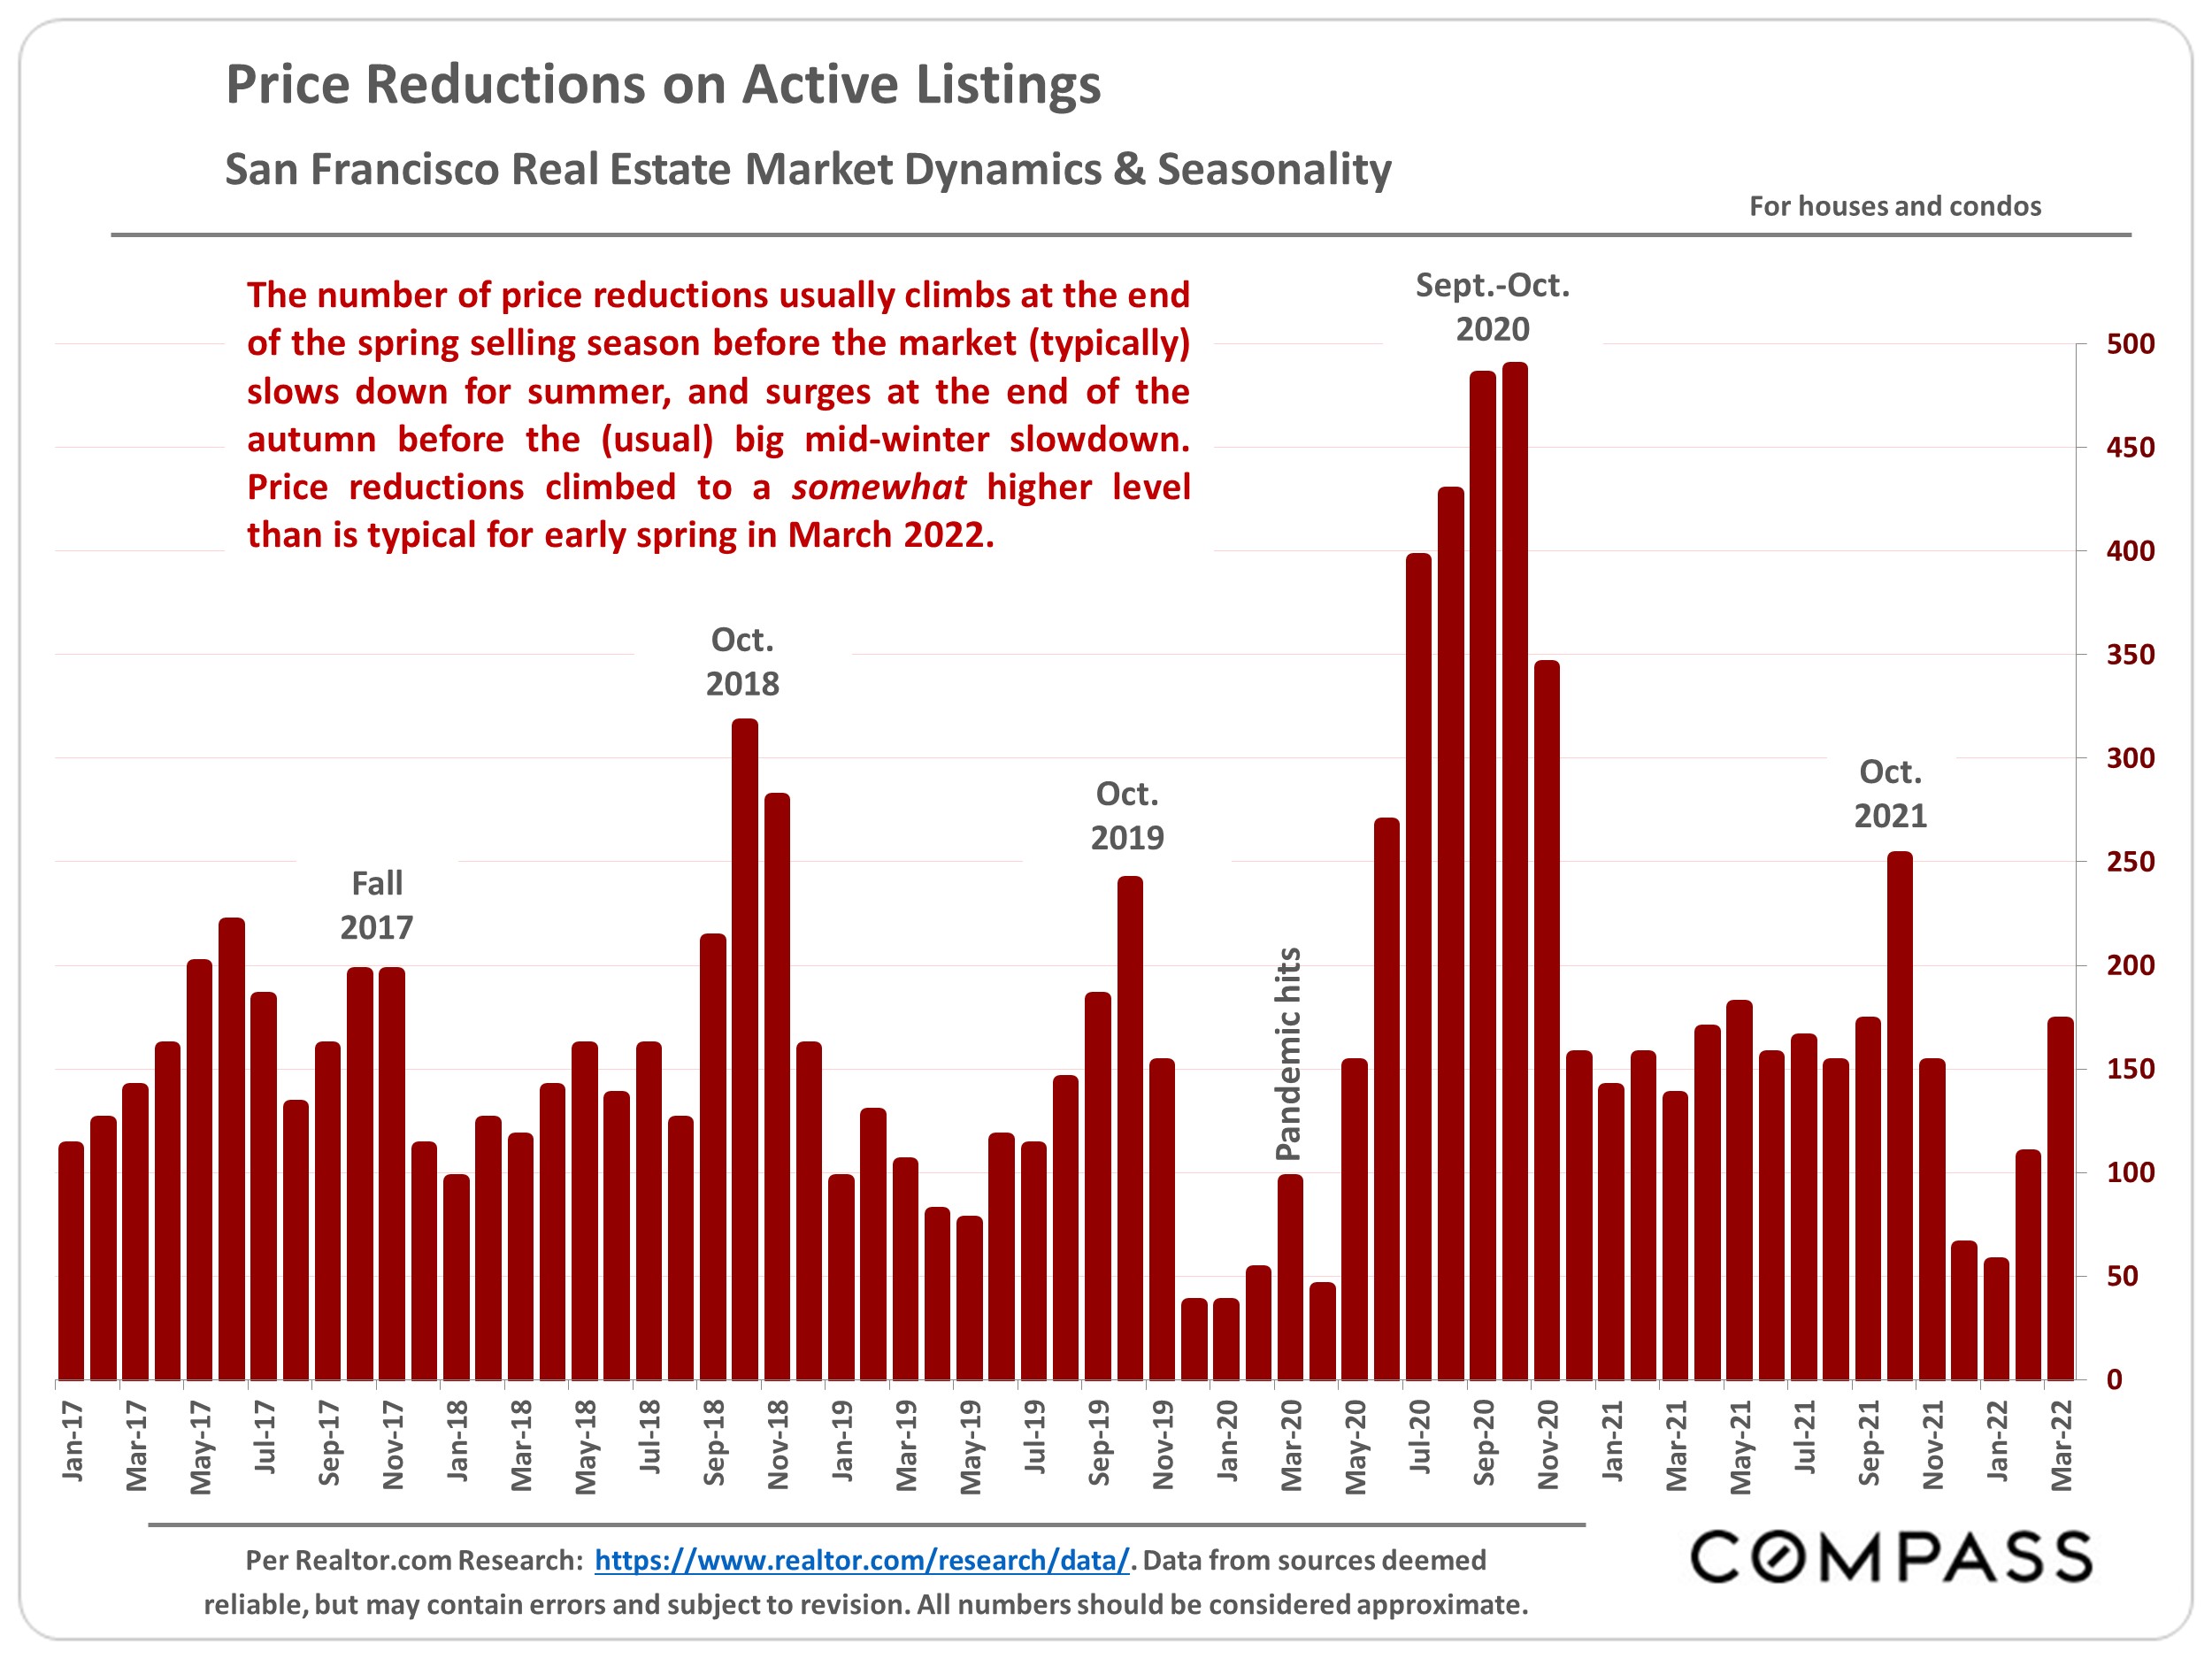
Bar chart of San Francisco listing price reductions from 2017 to March 2022, with a sharp peak in autumn 2020.
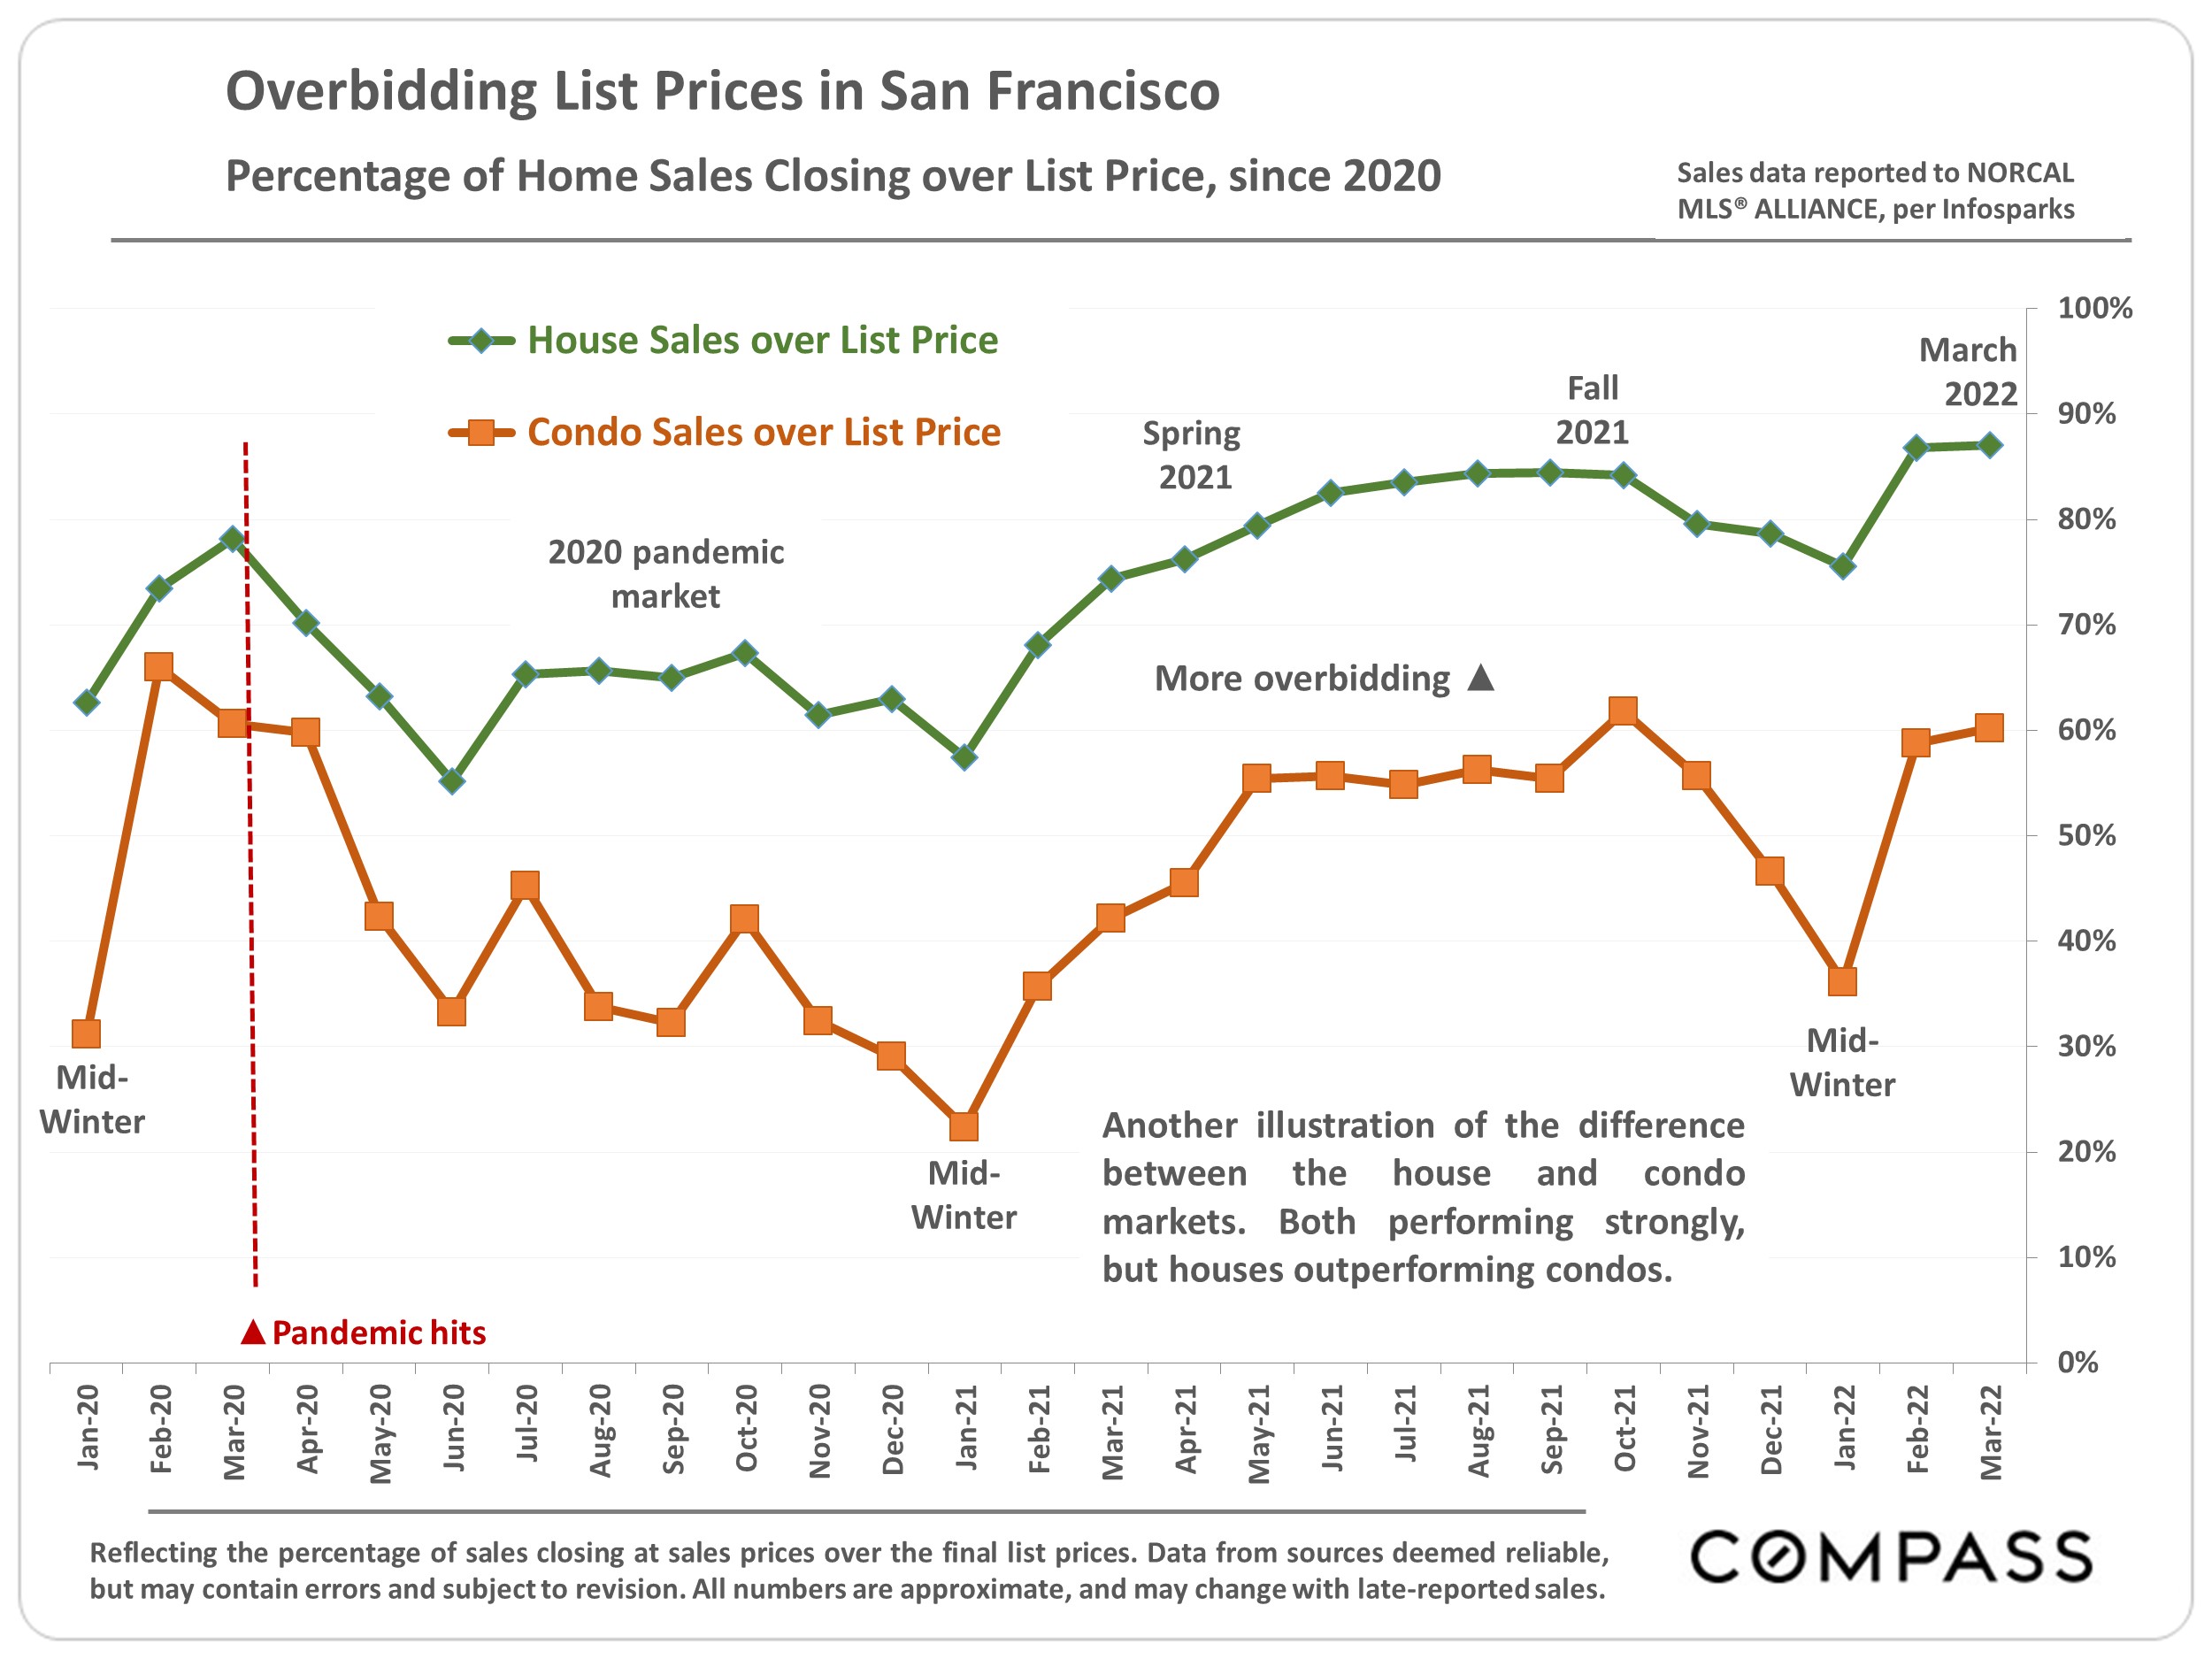
Chart comparing San Francisco house and condo sales over list price from January 2020 to March 2022.
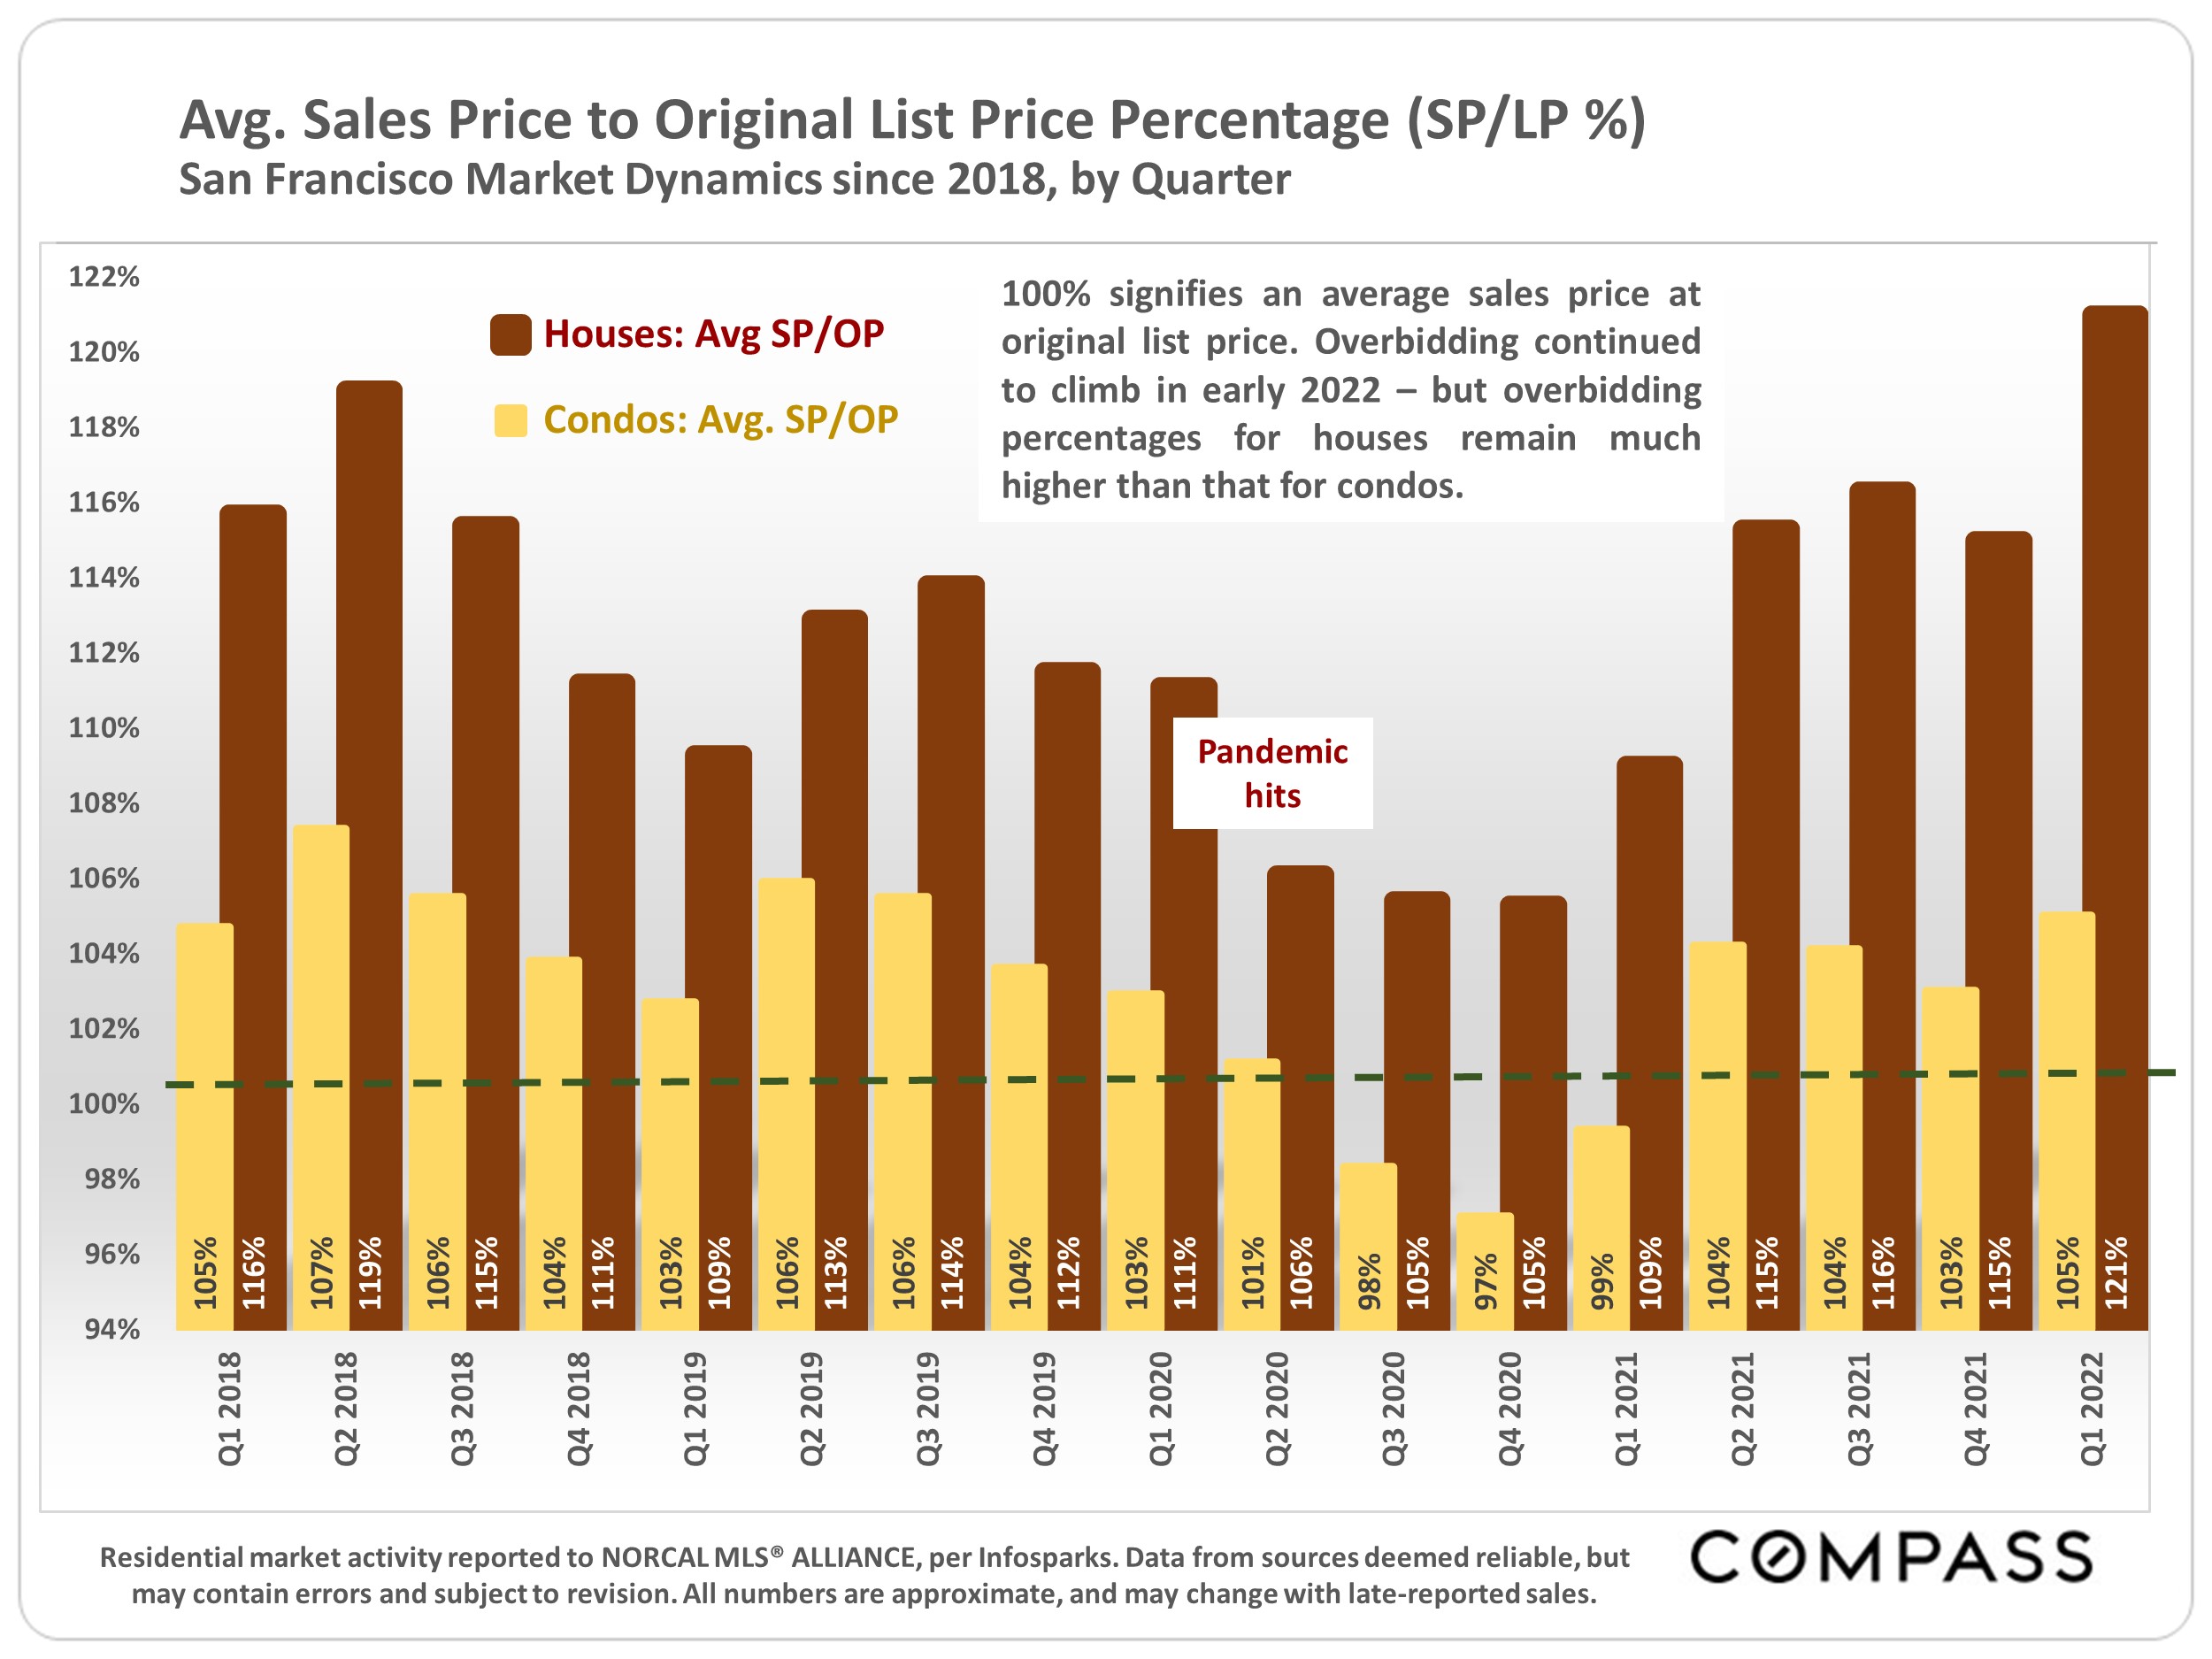
San Francisco quarterly sales-to-list price chart, with house and condo percentages from 2018 through Q1 2022.
Bar chart comparing average days on market for San Francisco houses and condos from Q2 2019 through Q1 2022.
Compass graphic promoting its latest Bay Area luxury home market report, with an ornate gate and garden path.
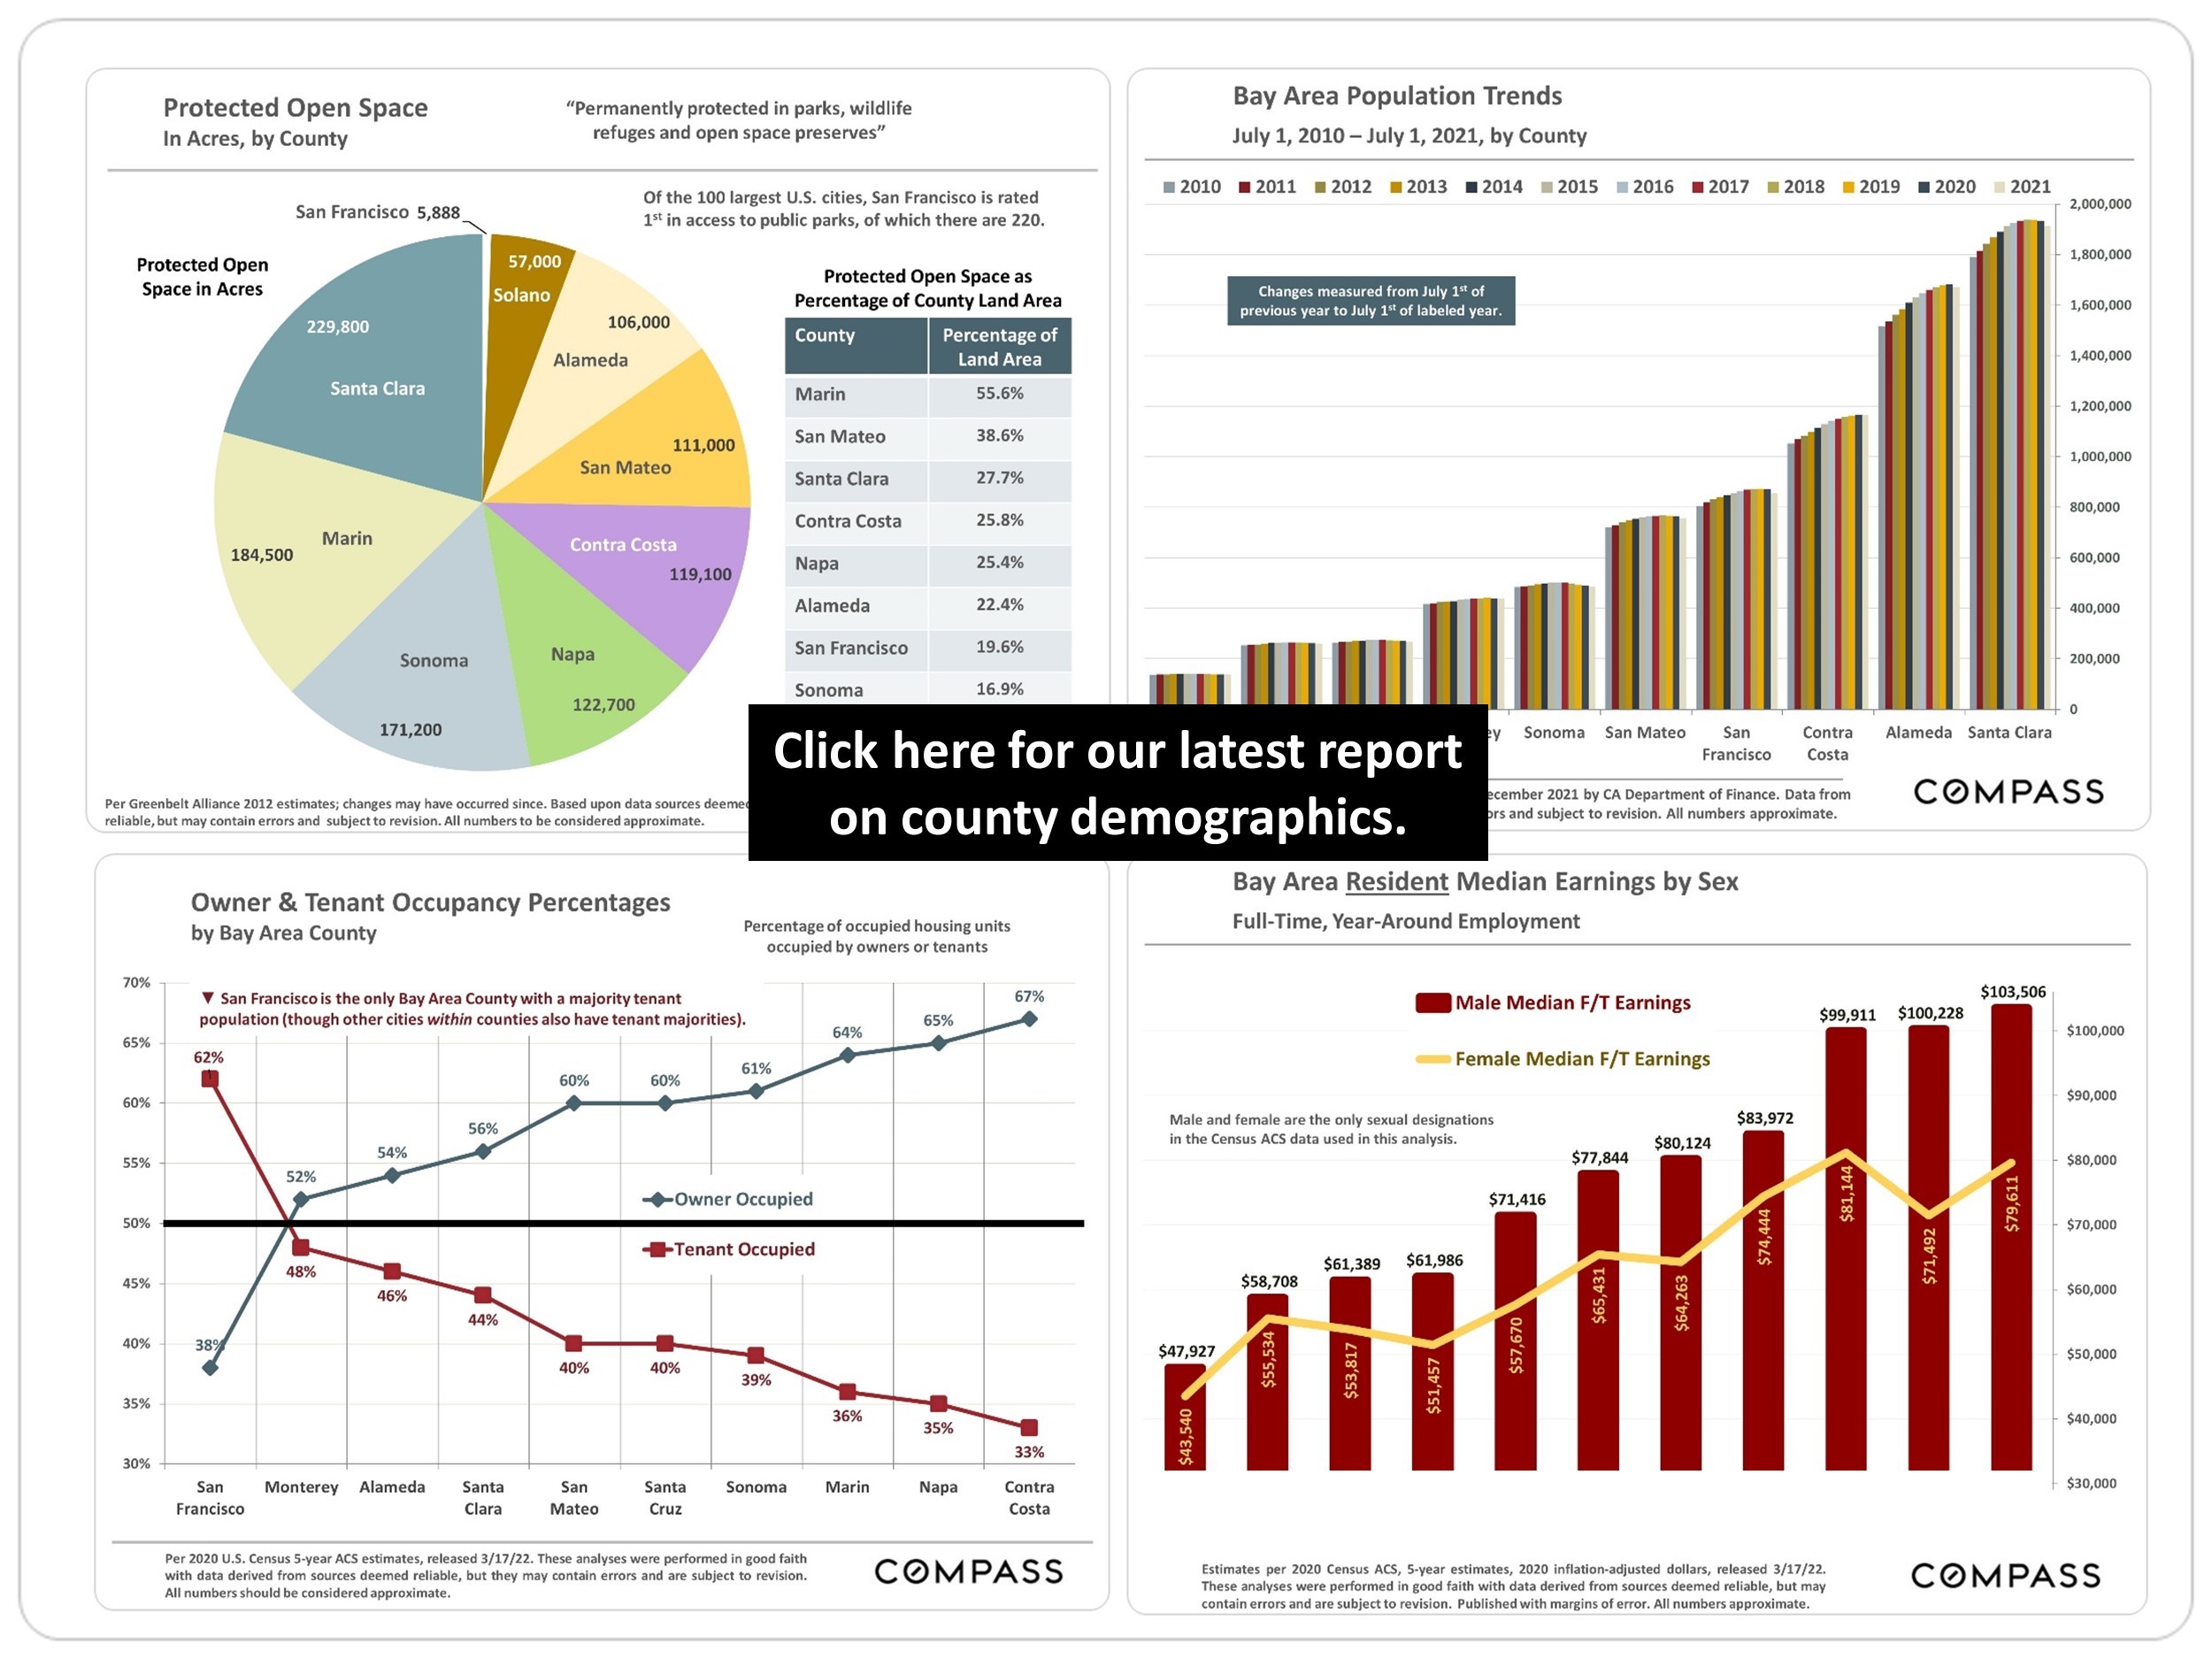
Bay Area demographics infographic comparing county open space, population, housing occupancy, and median earnings.
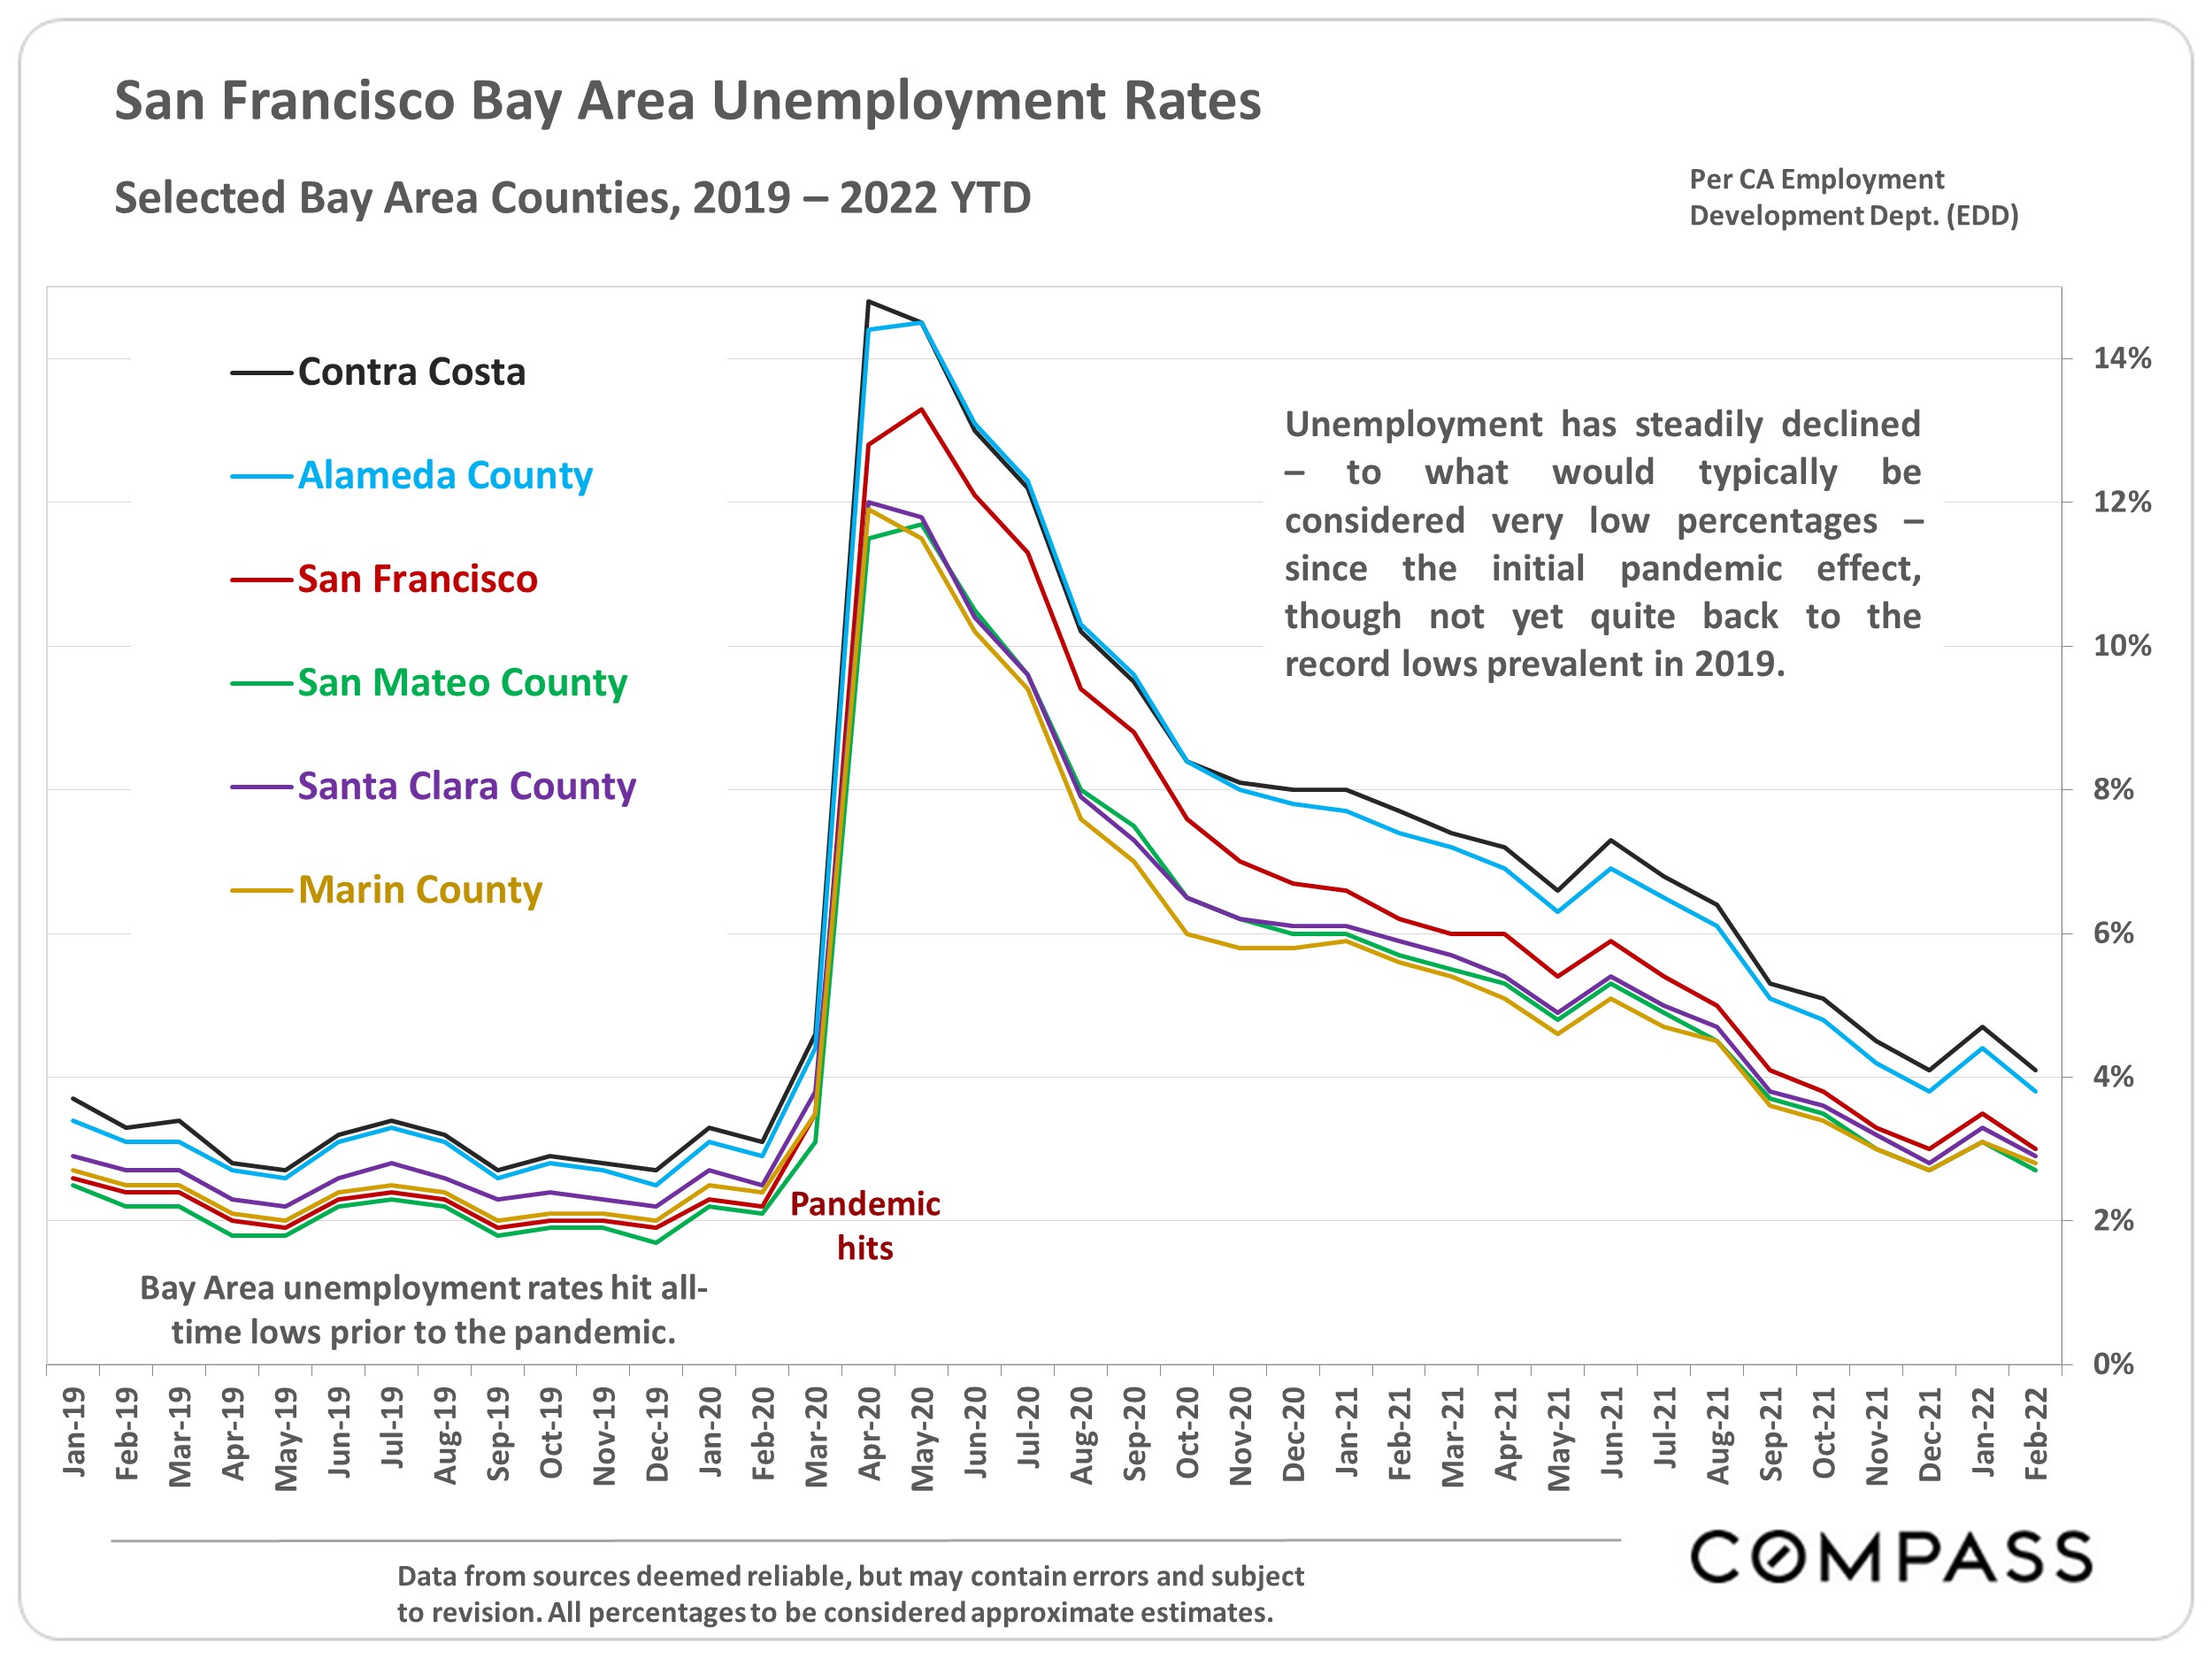
Line chart of Bay Area county unemployment rates, with a sharp pandemic spike in 2020 followed by a decline.
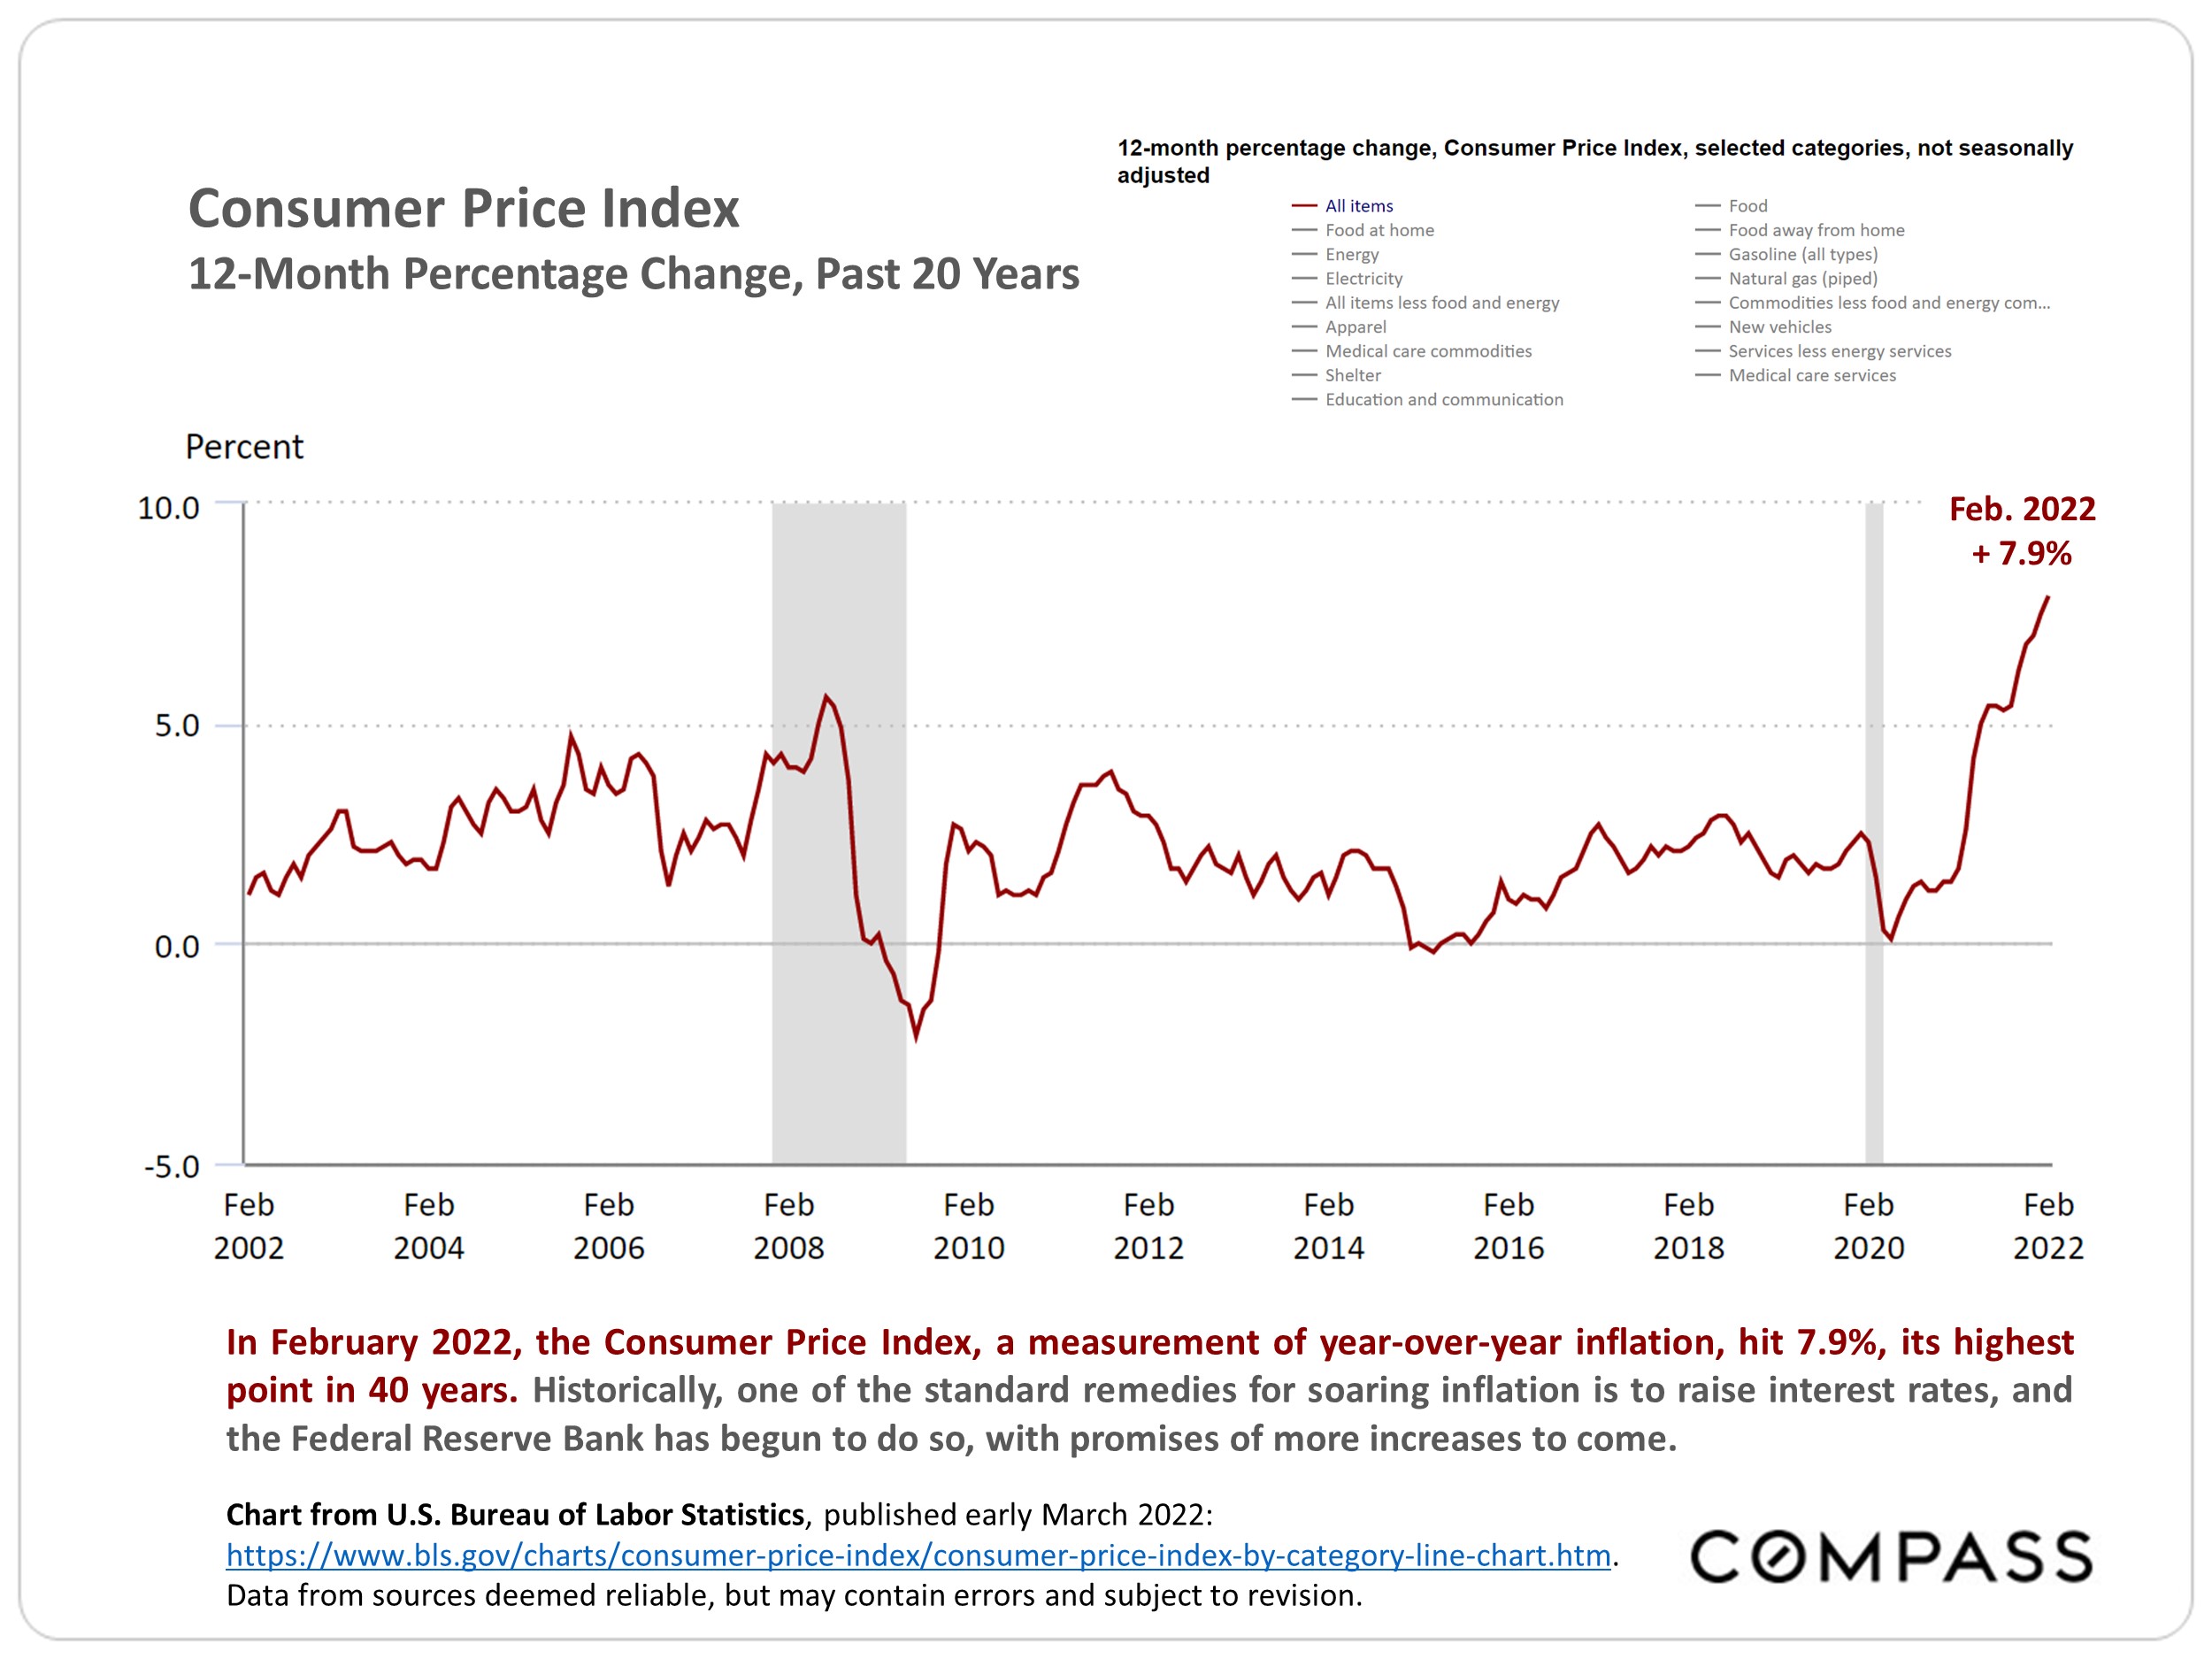
Consumer Price Index percentage-change chart, 2002–2022, rising to 7.9% in February 2022.
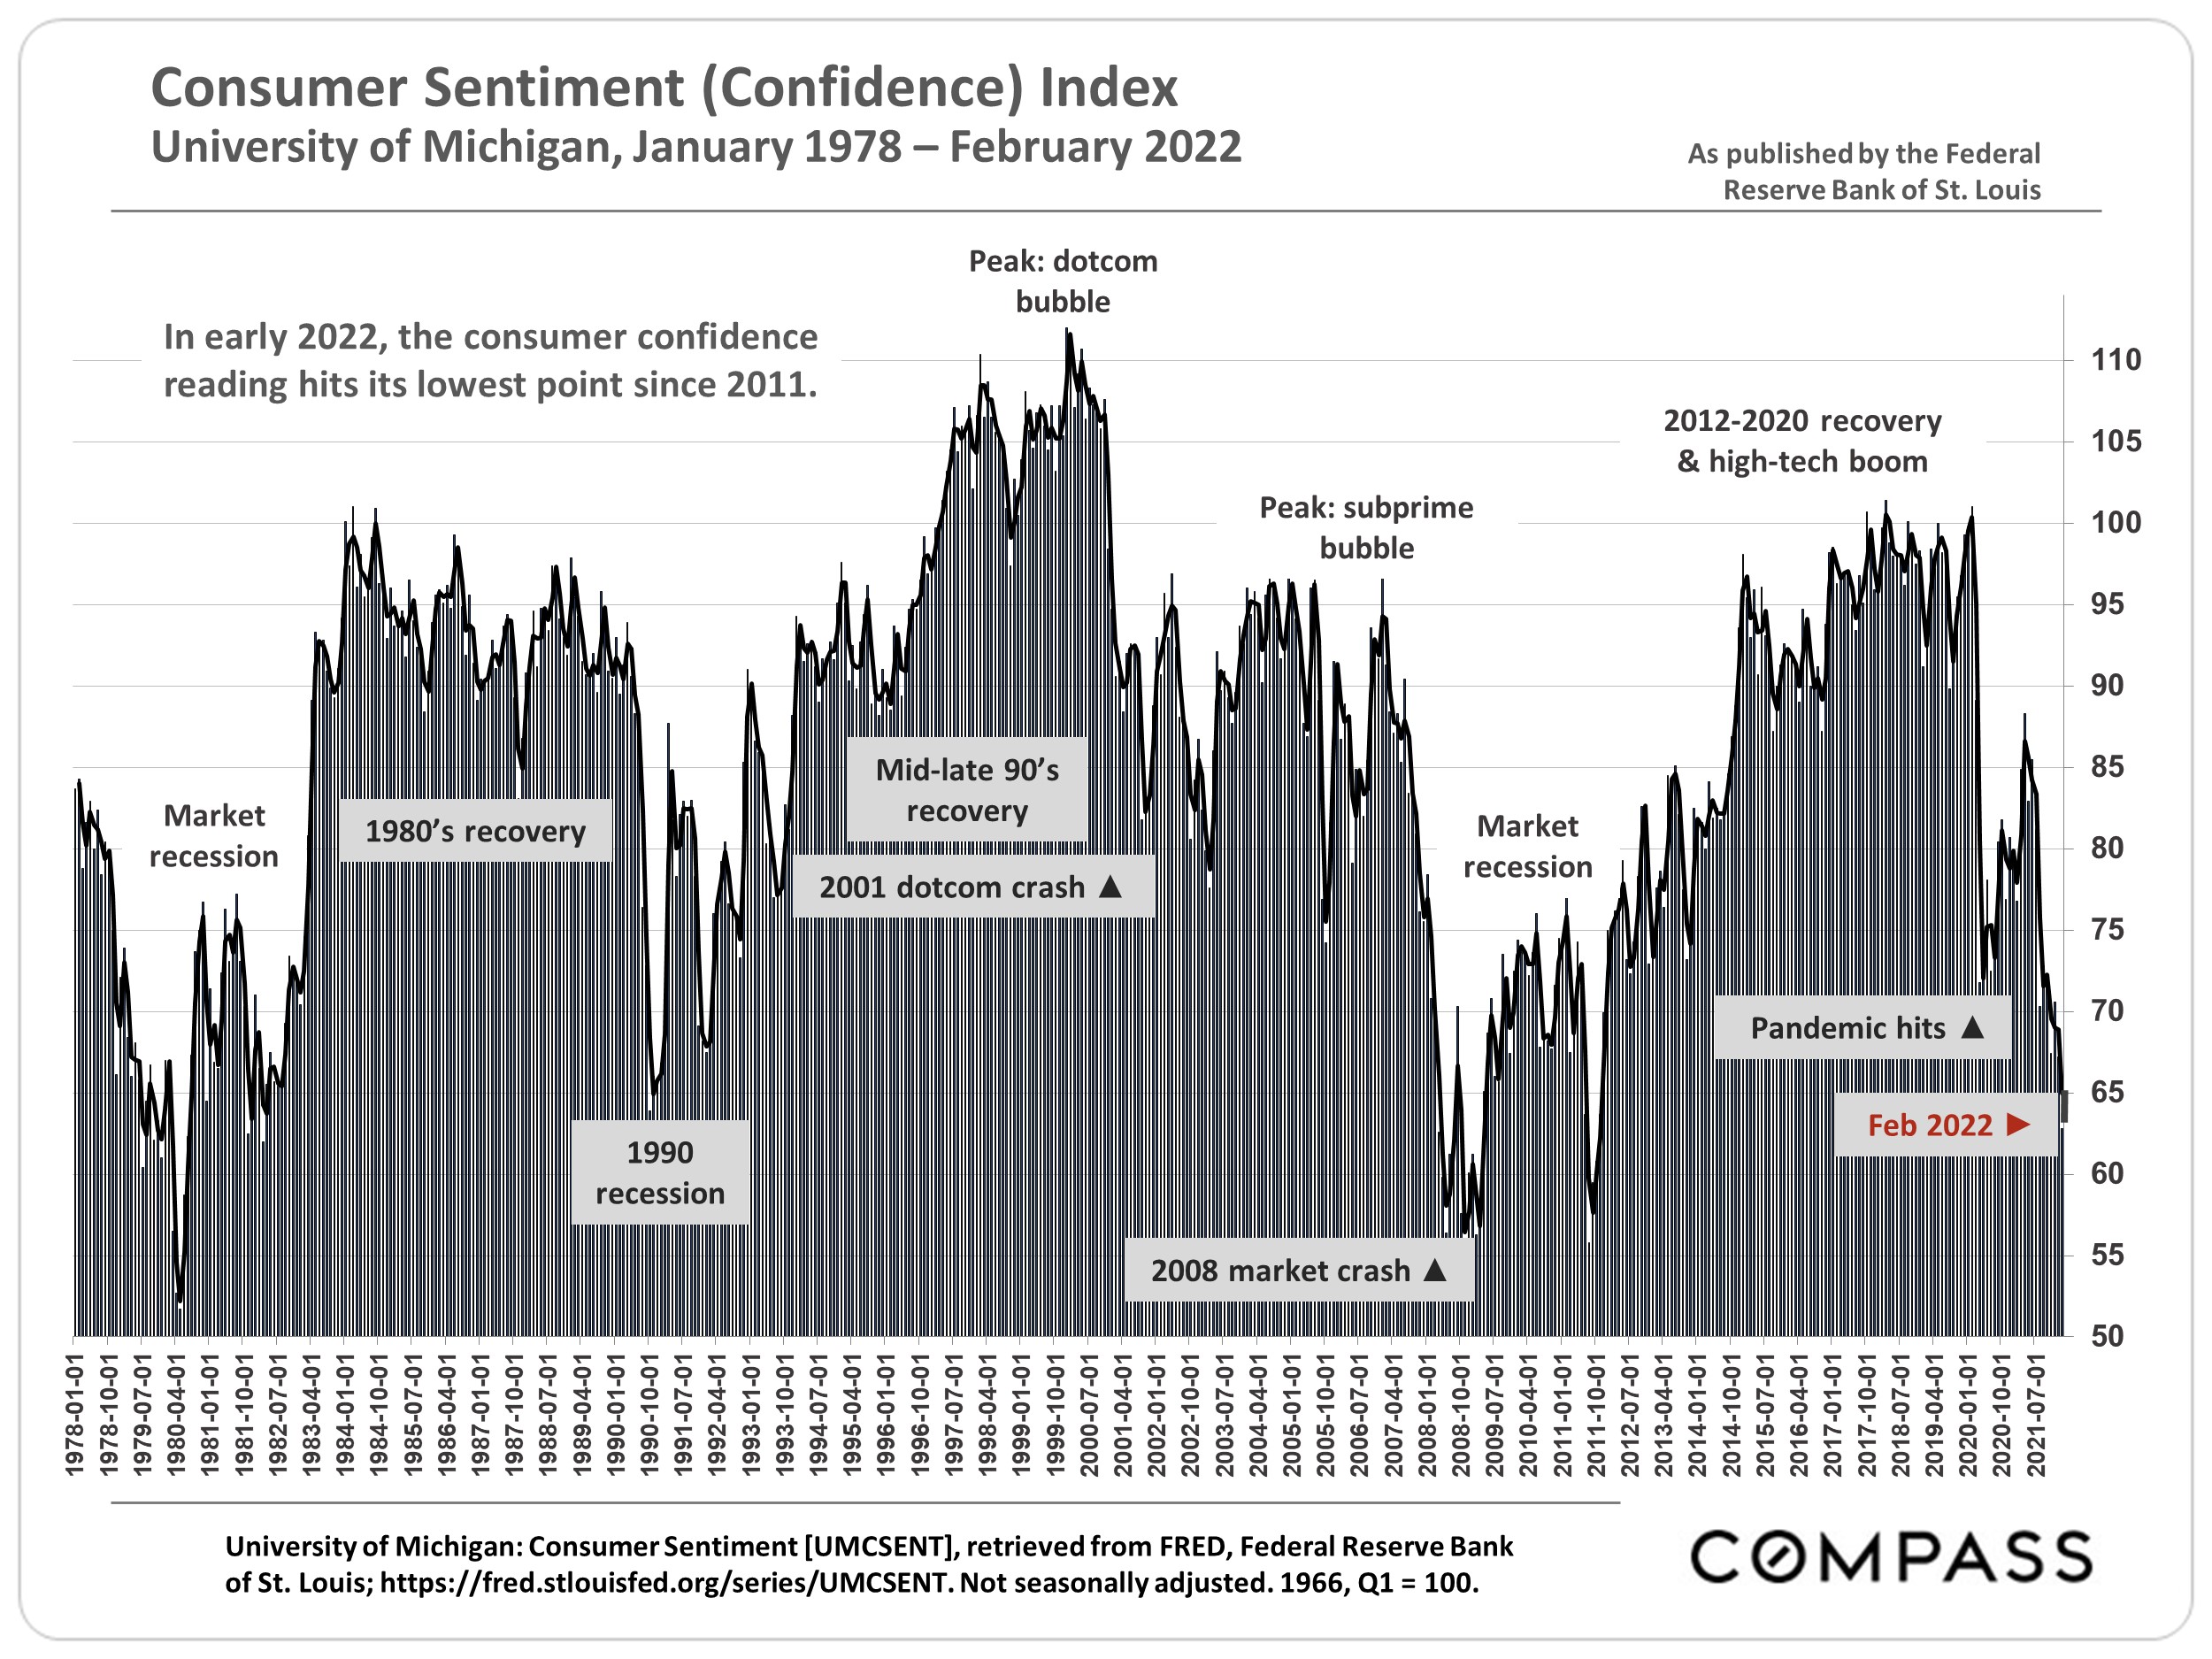
Chart of U.S. consumer sentiment from 1978 to February 2022, marking recessions, market crashes, and recoveries.
Real estate market report notes and legal disclaimer with Compass branding.

Work With Us

We will help you understand the complex aspects of the transaction and share our expertise so that you can make the best decisions possible. We are experienced, market savvy, and energetic. With both of us working for our clients, you get twice the amount of attention and insight.