

The SF Team, Eva + James, Compass

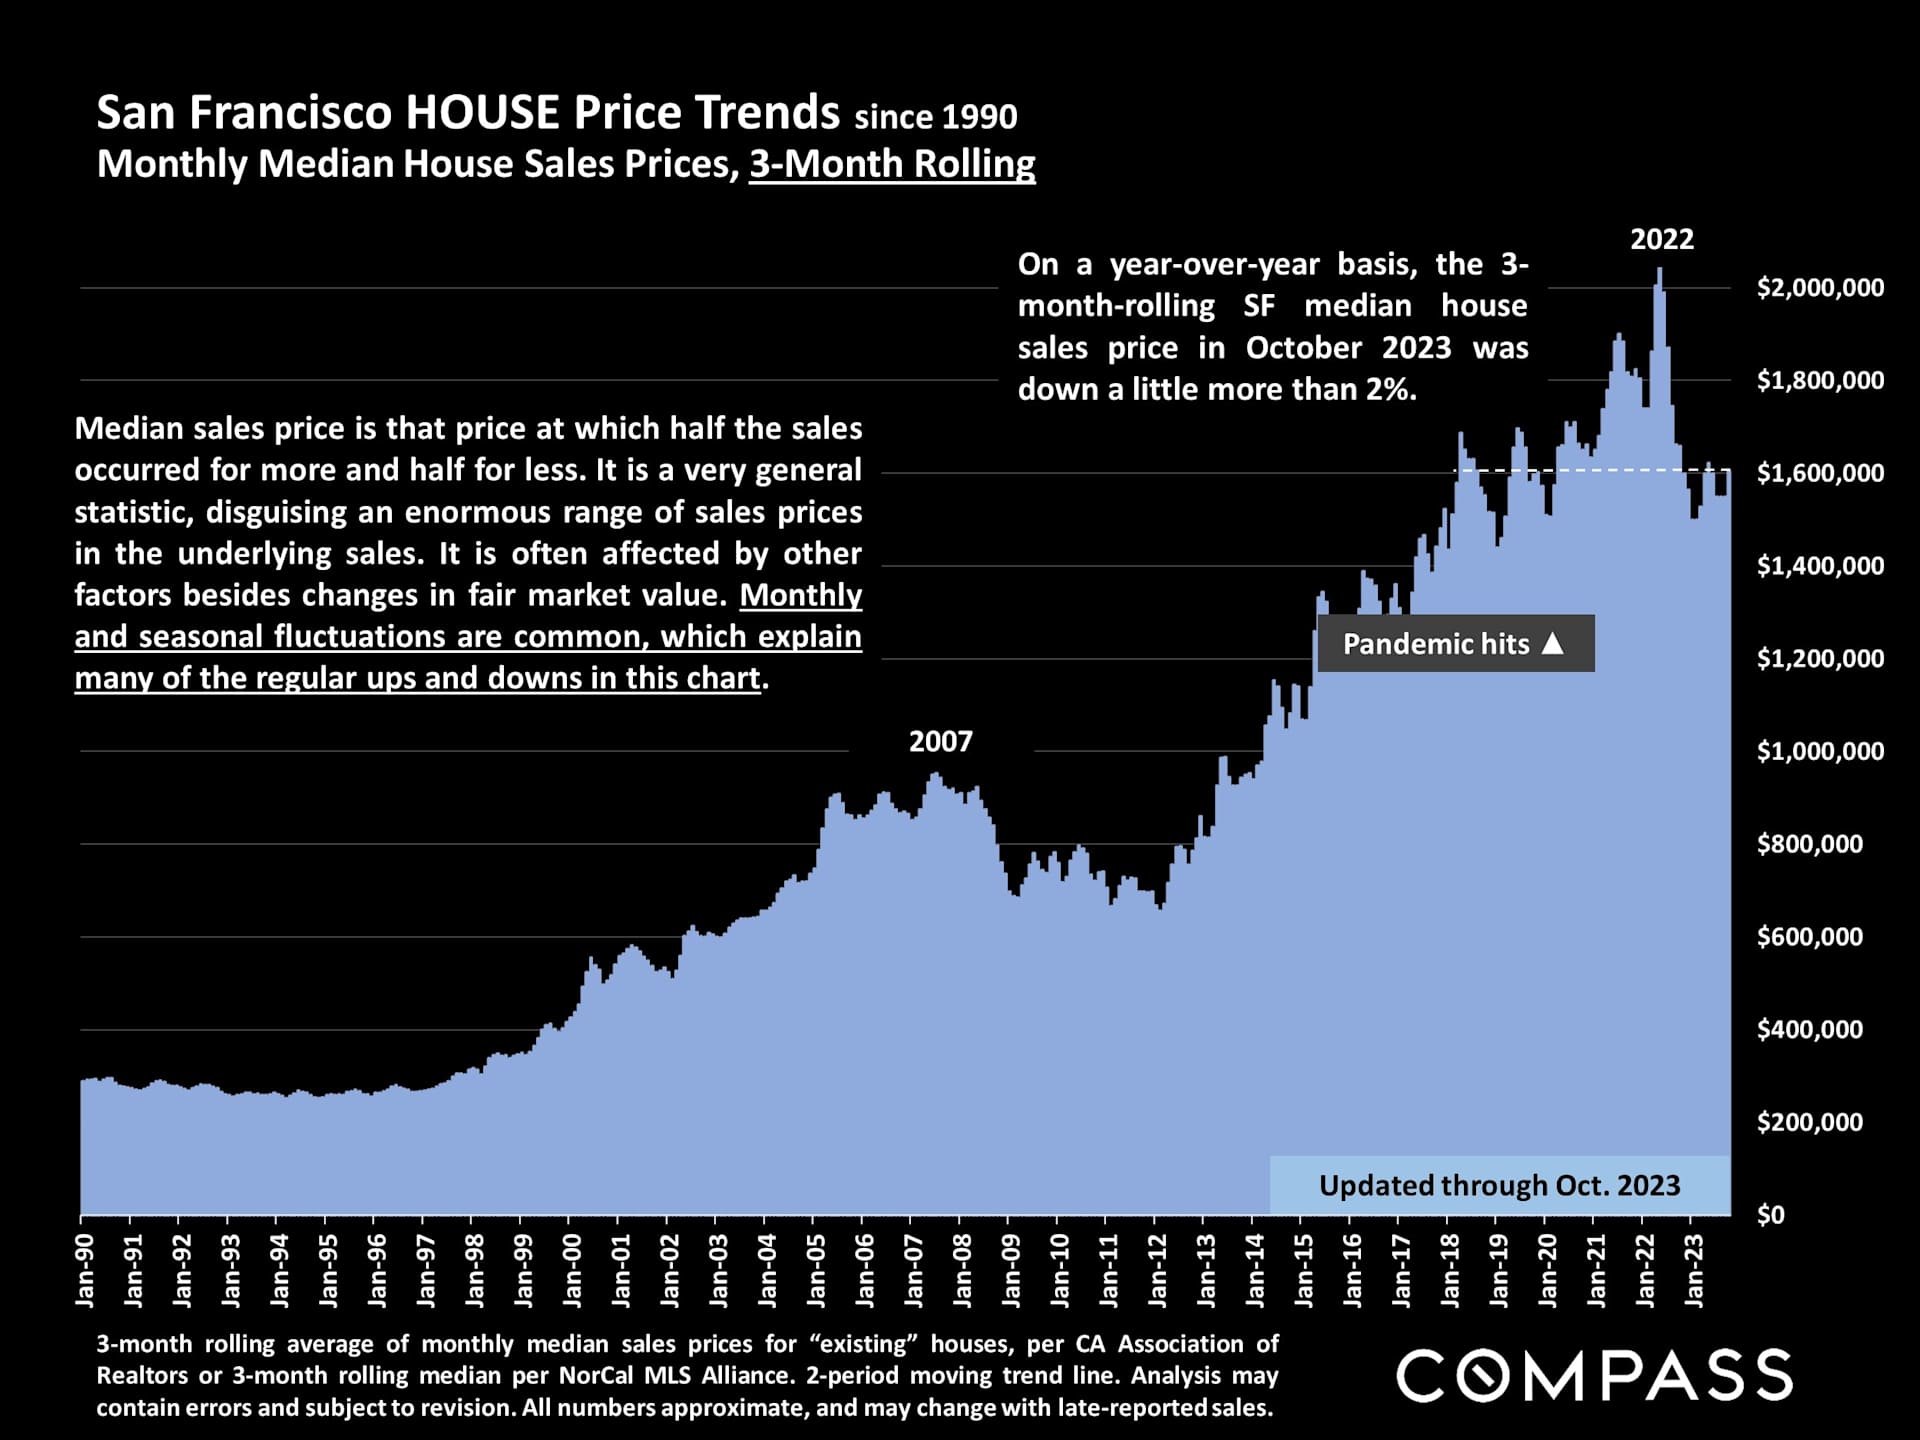
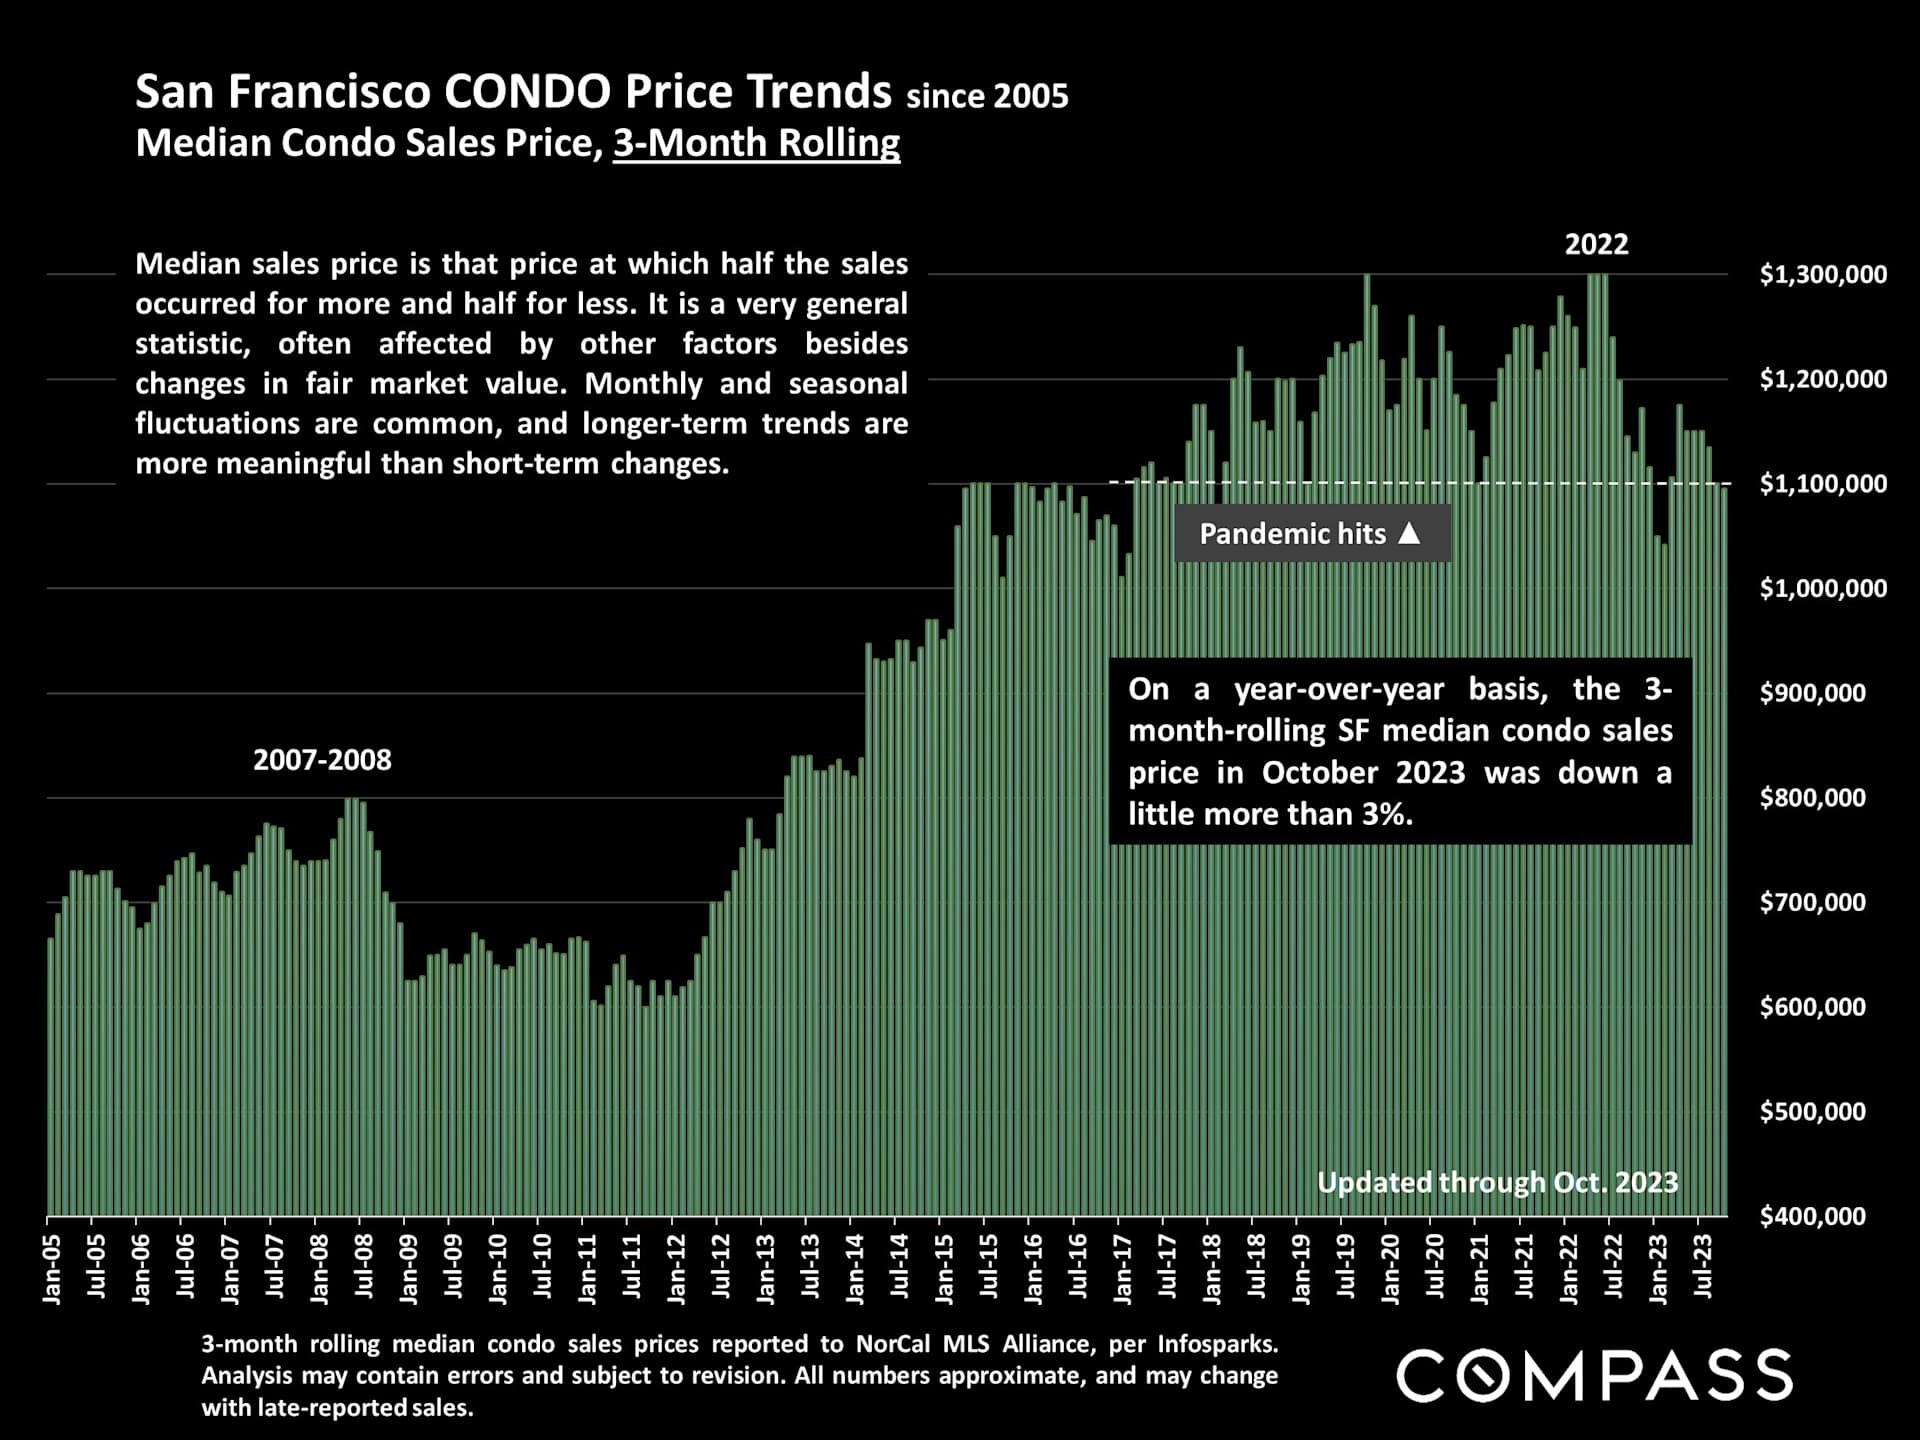
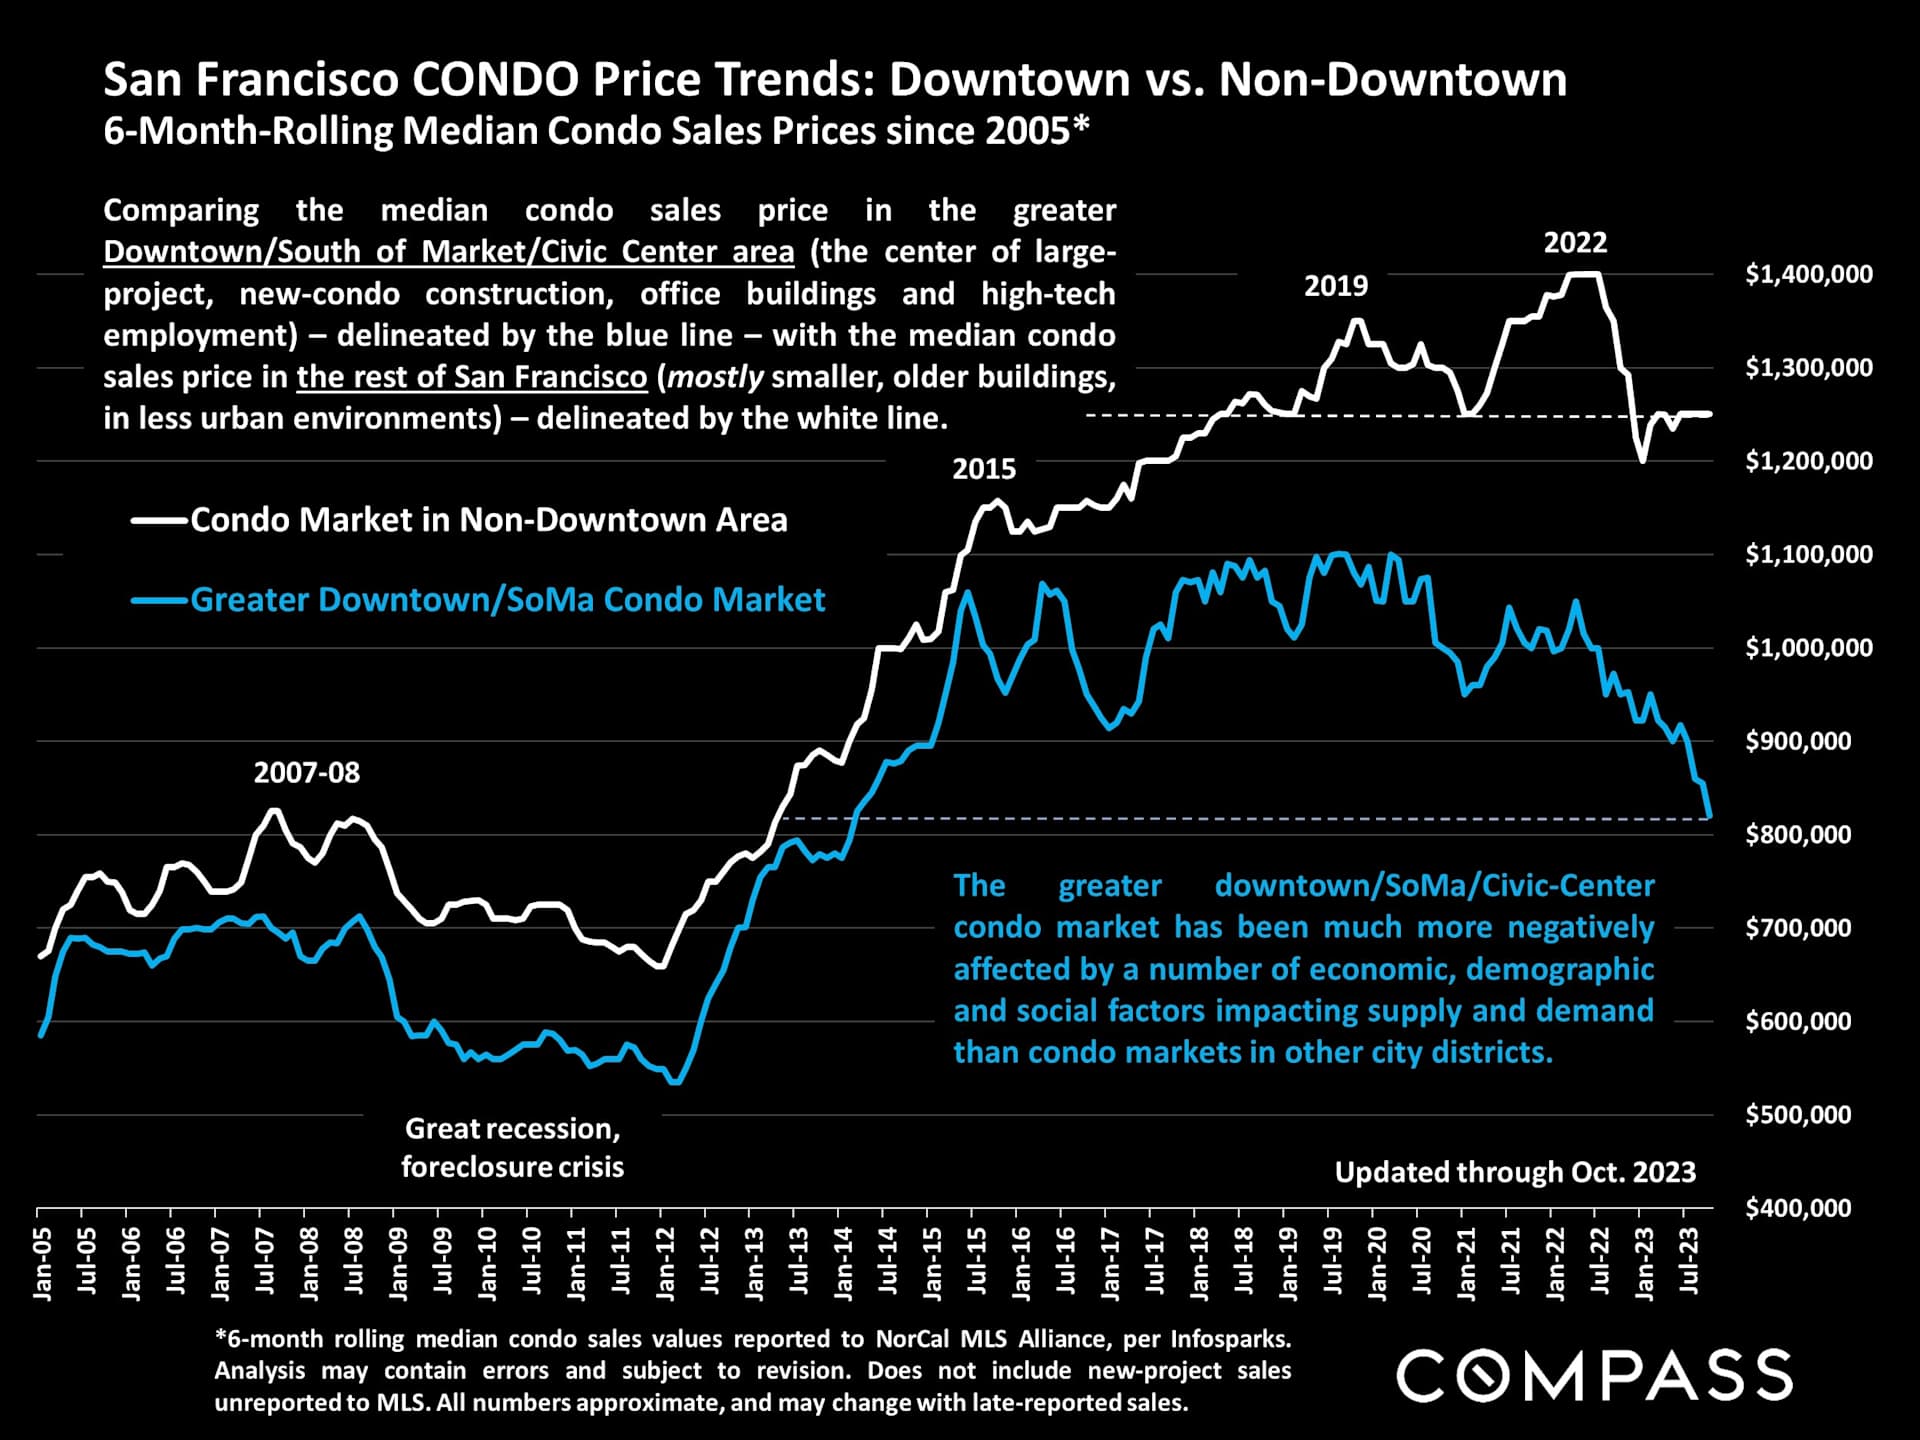
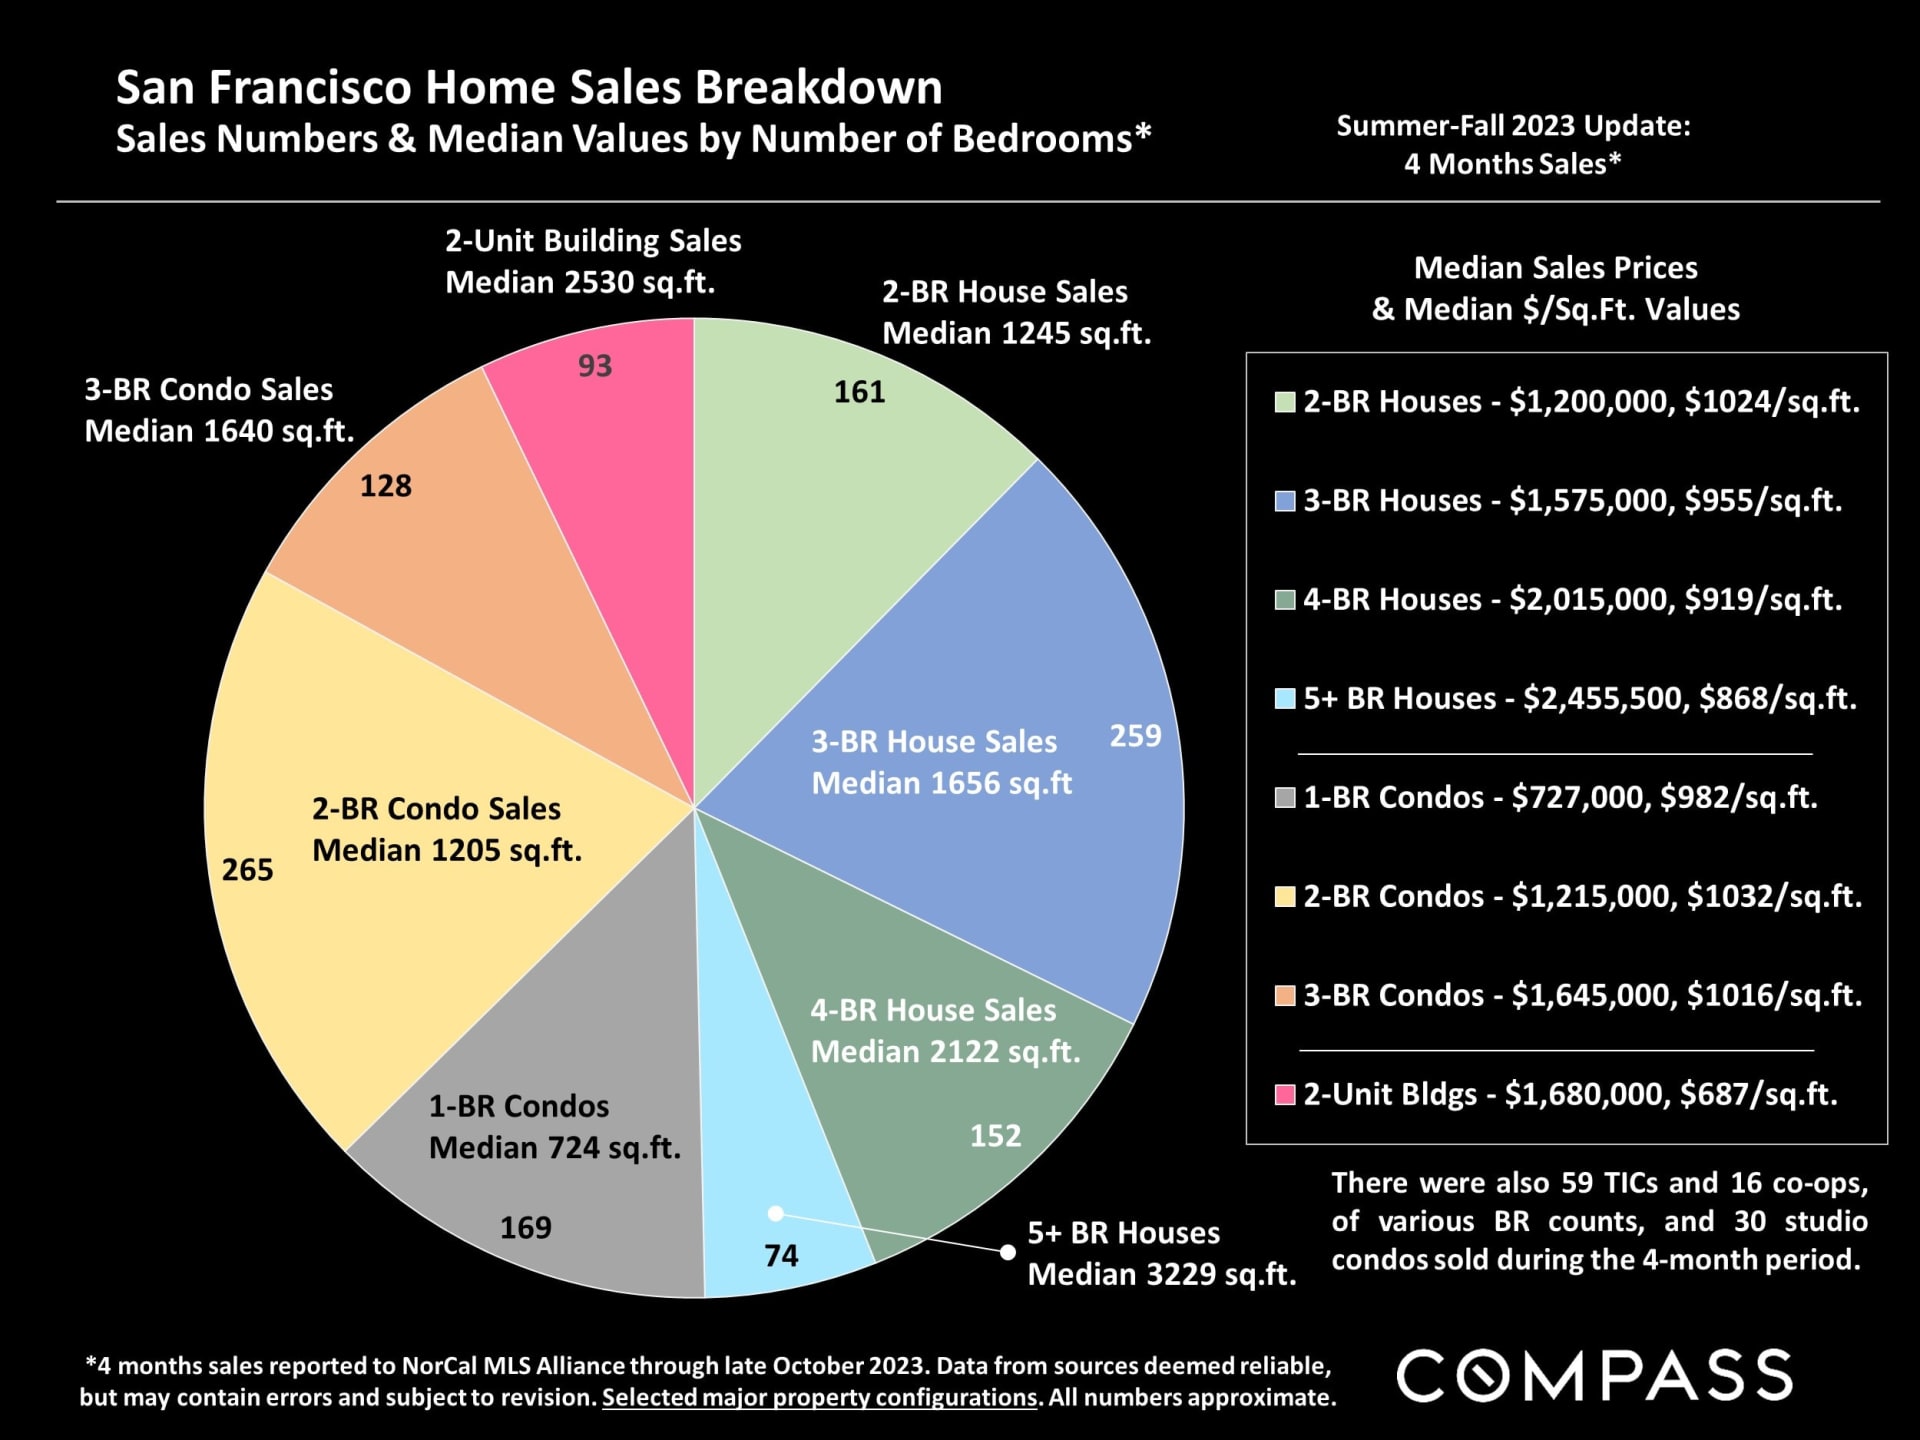
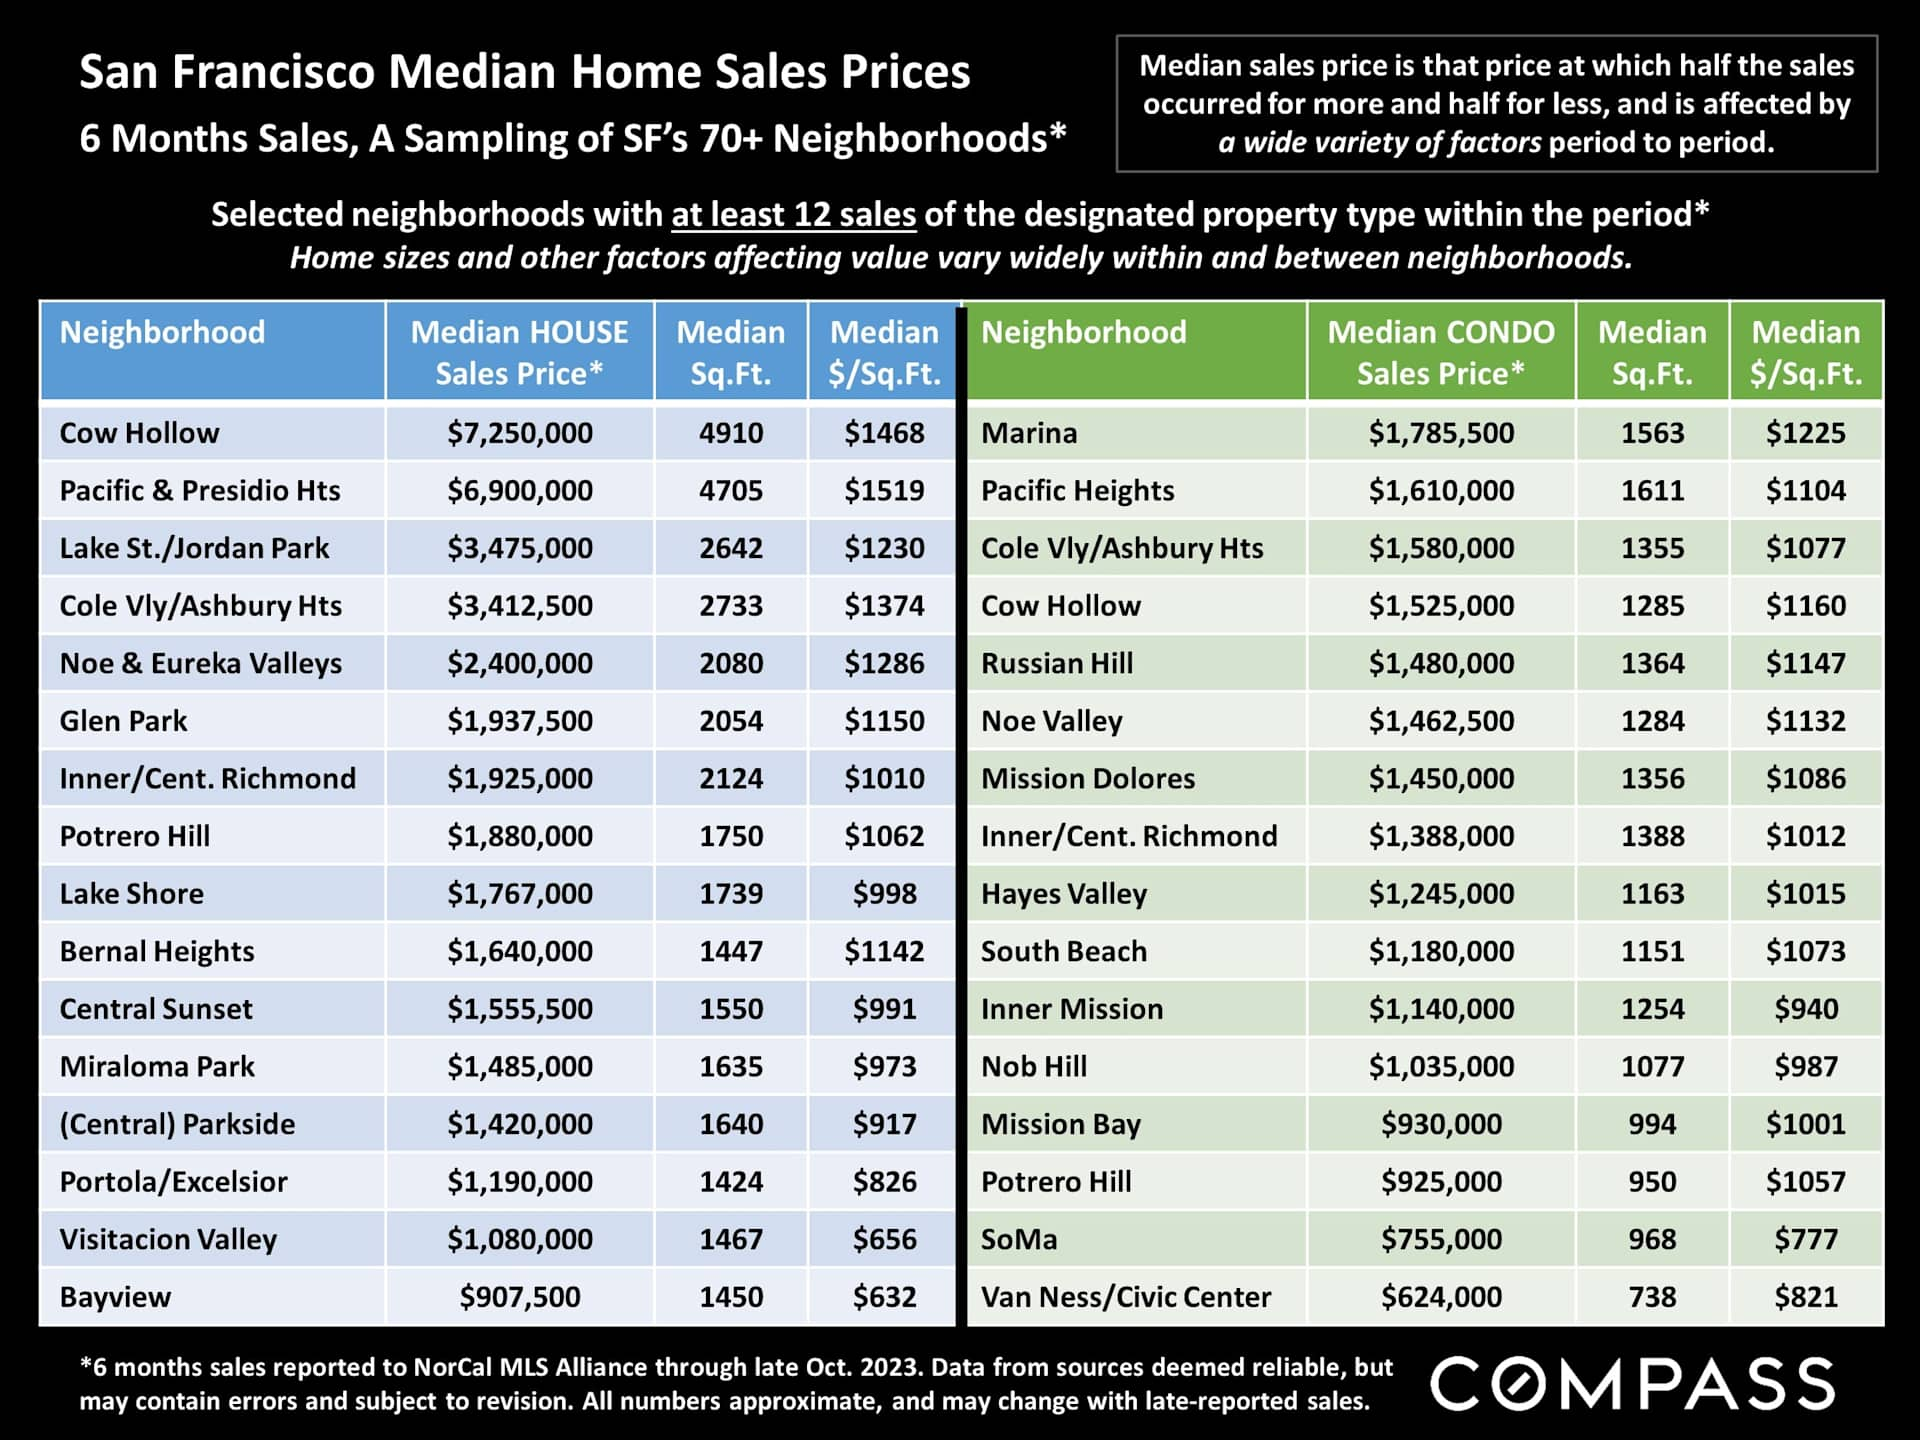
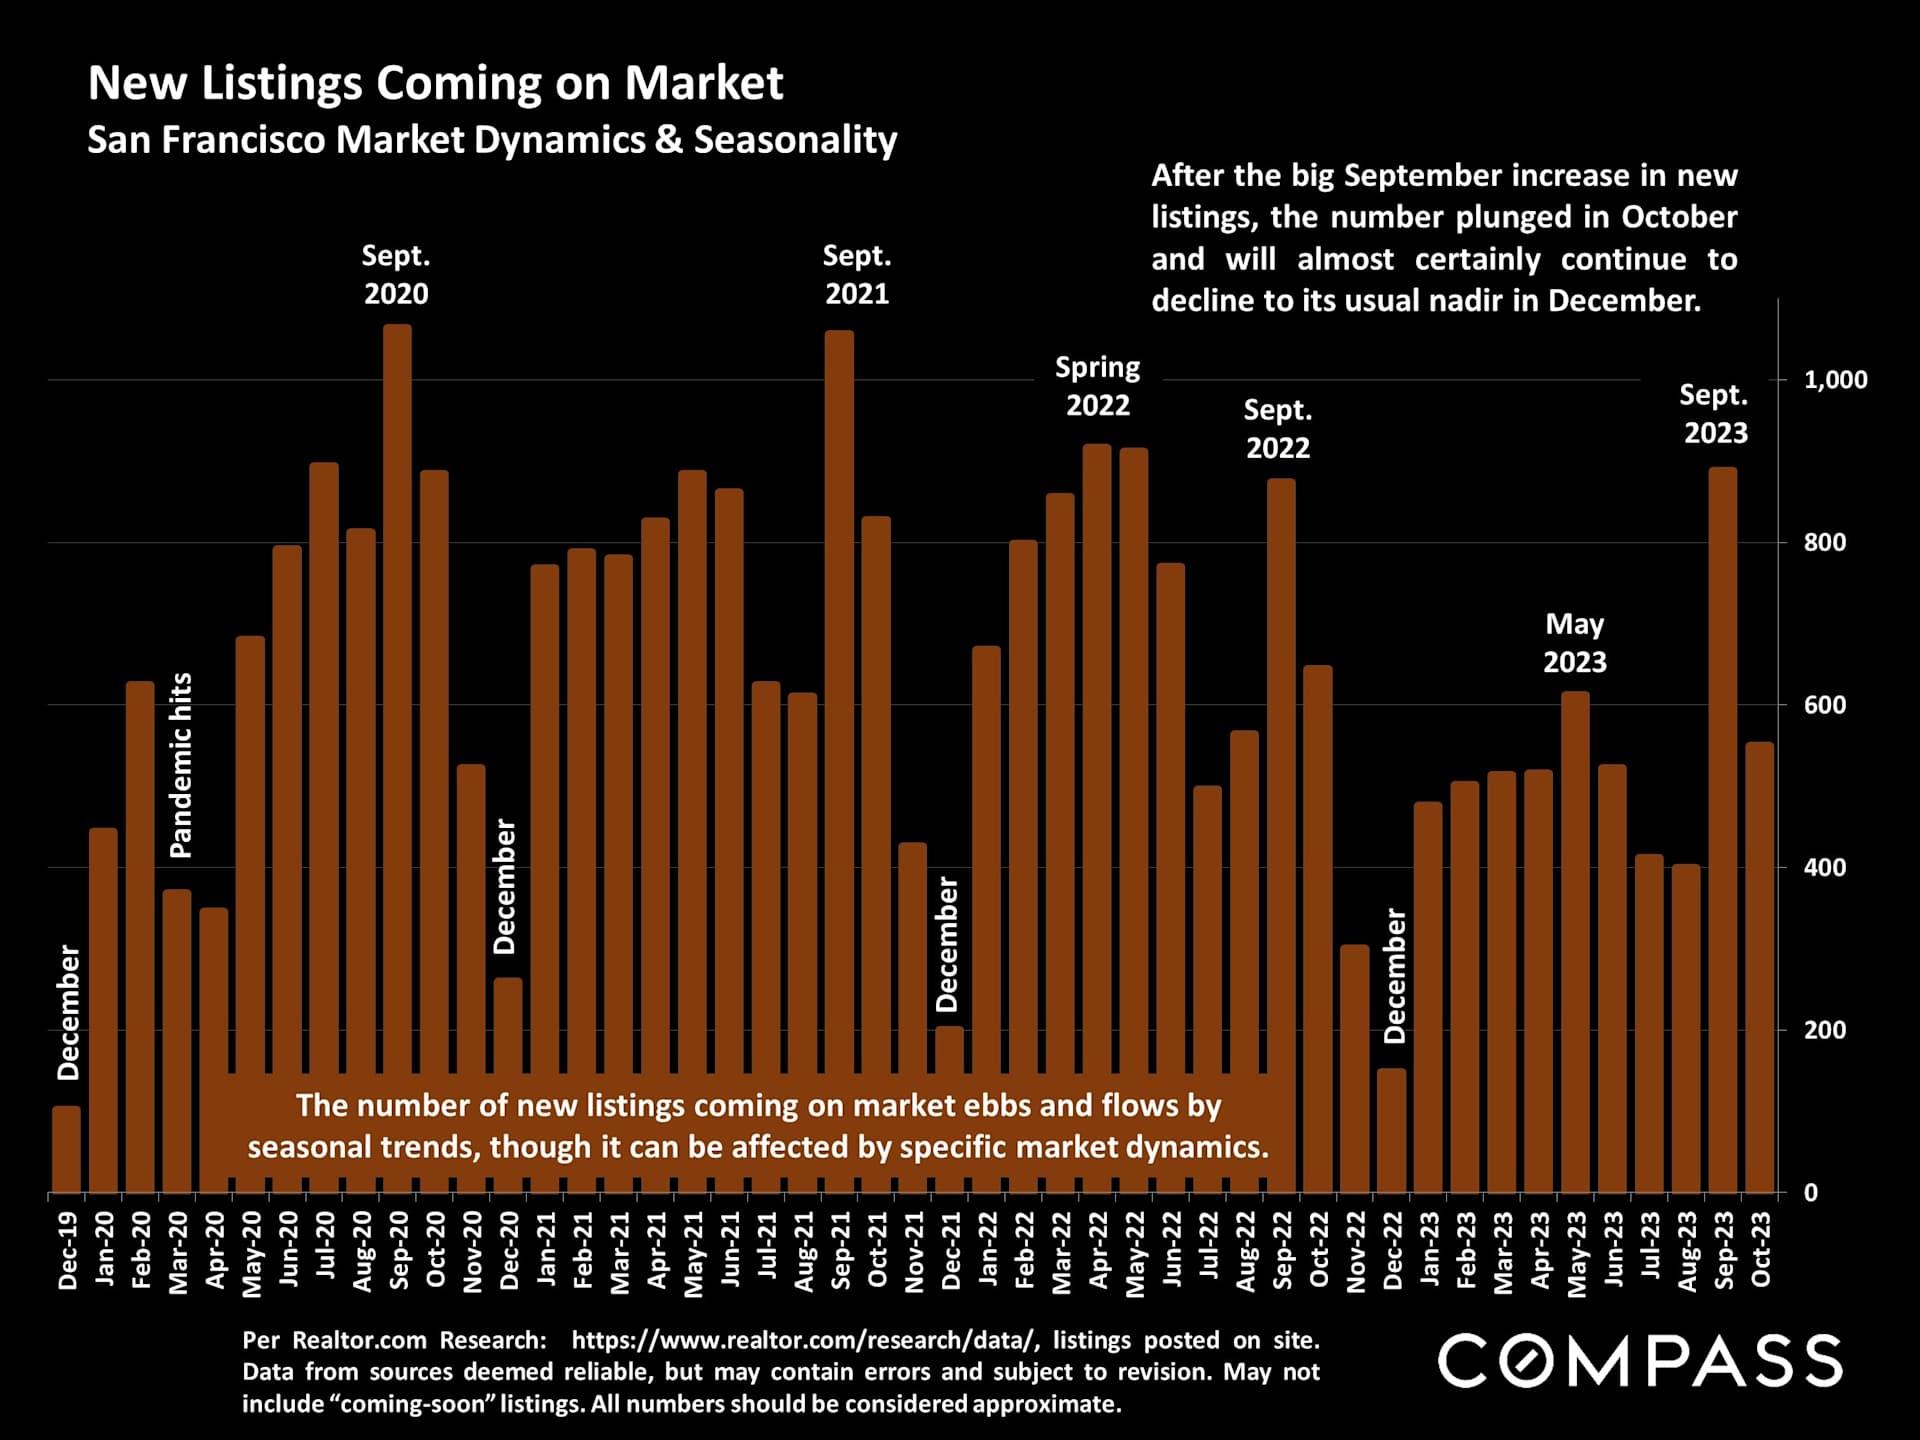
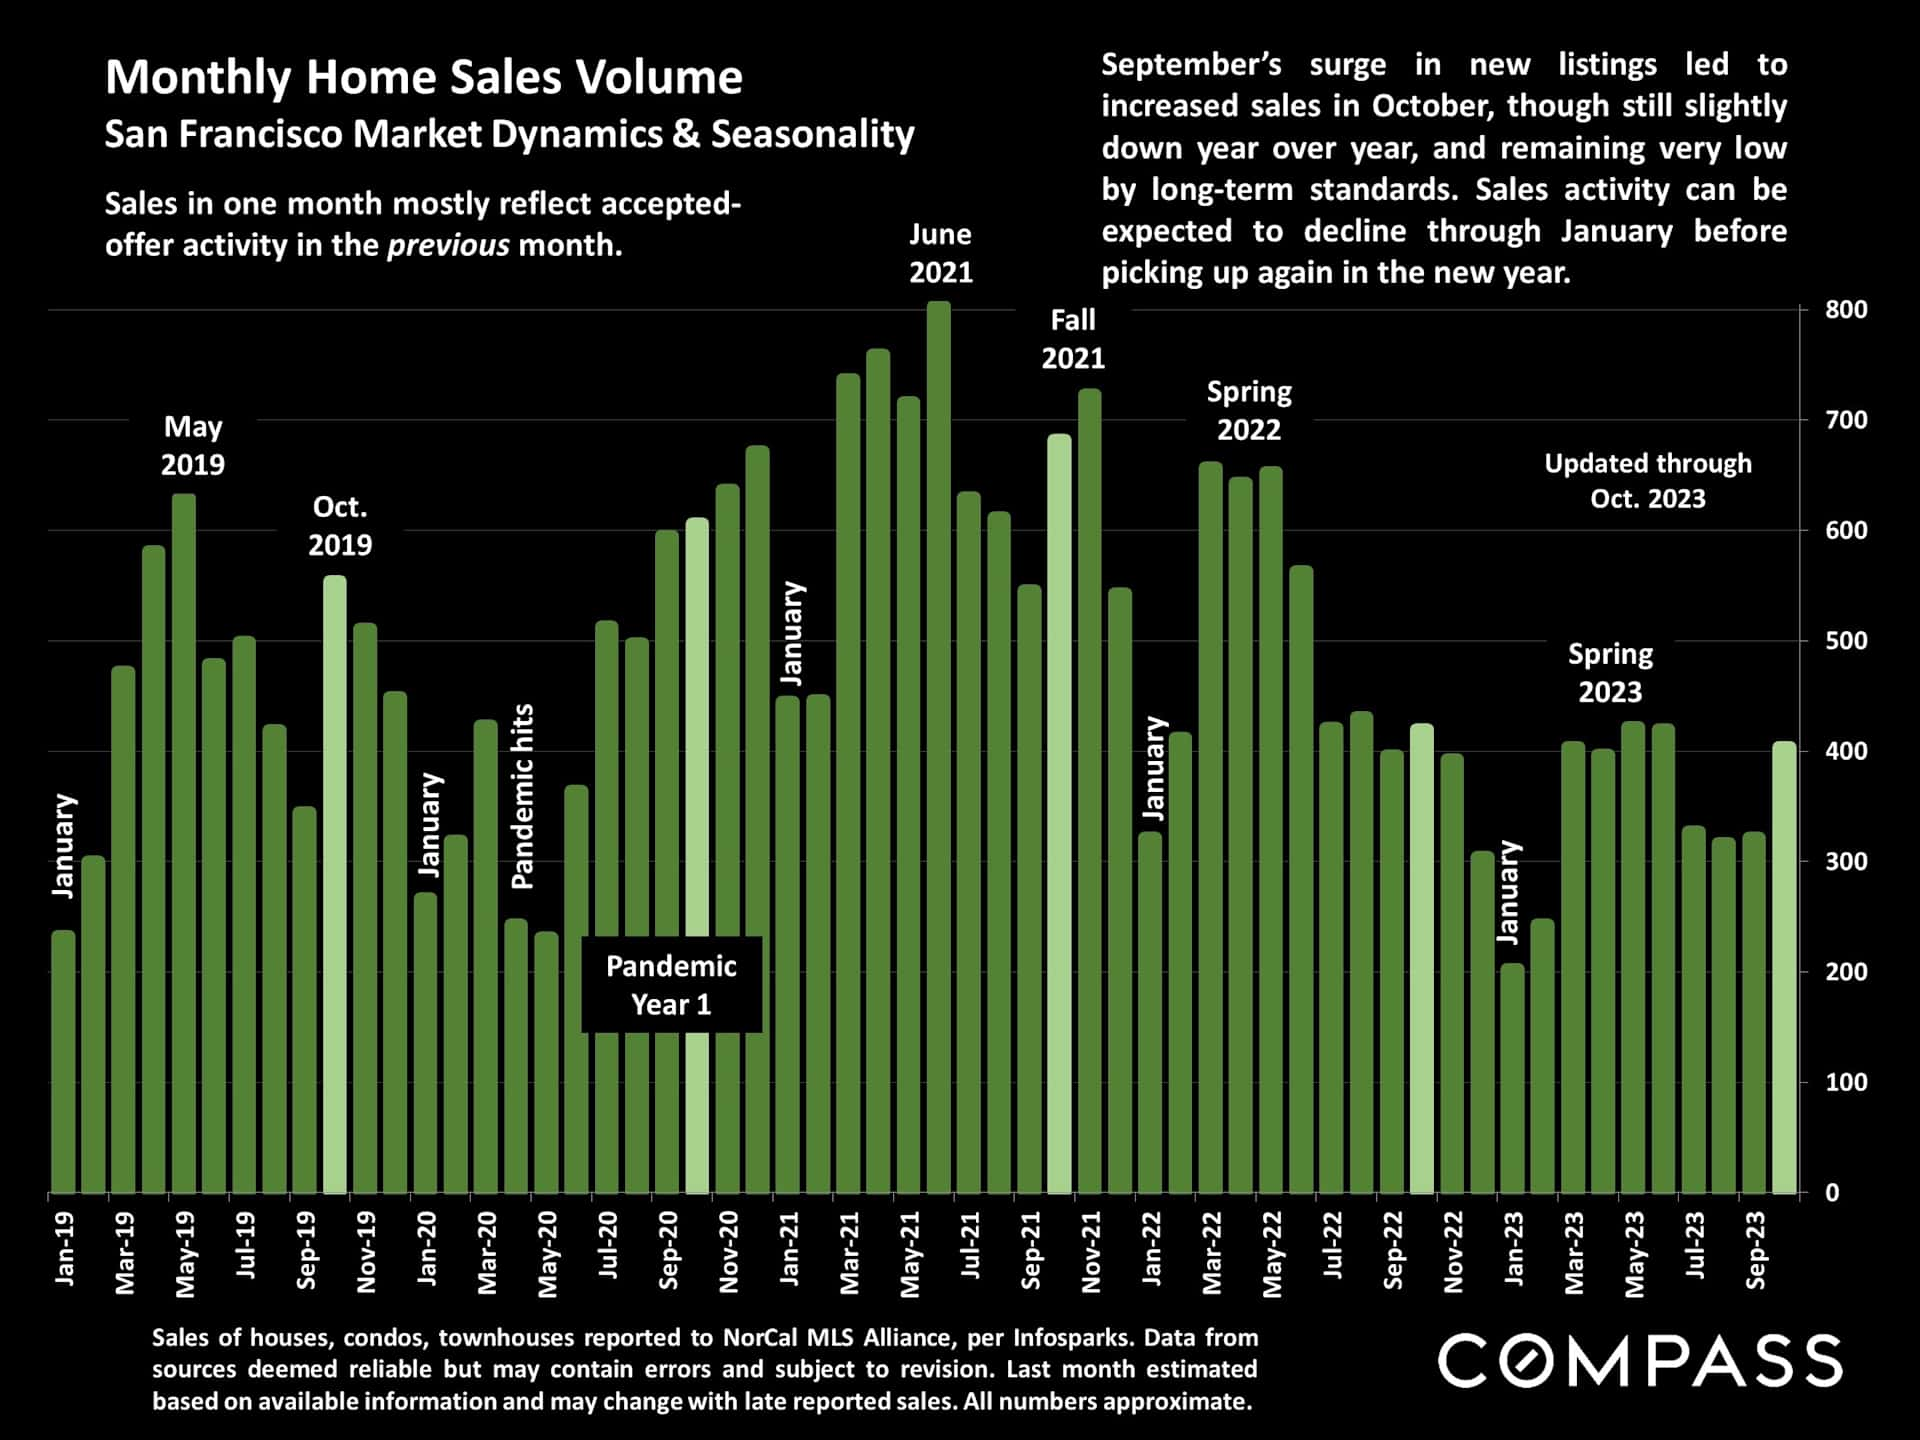
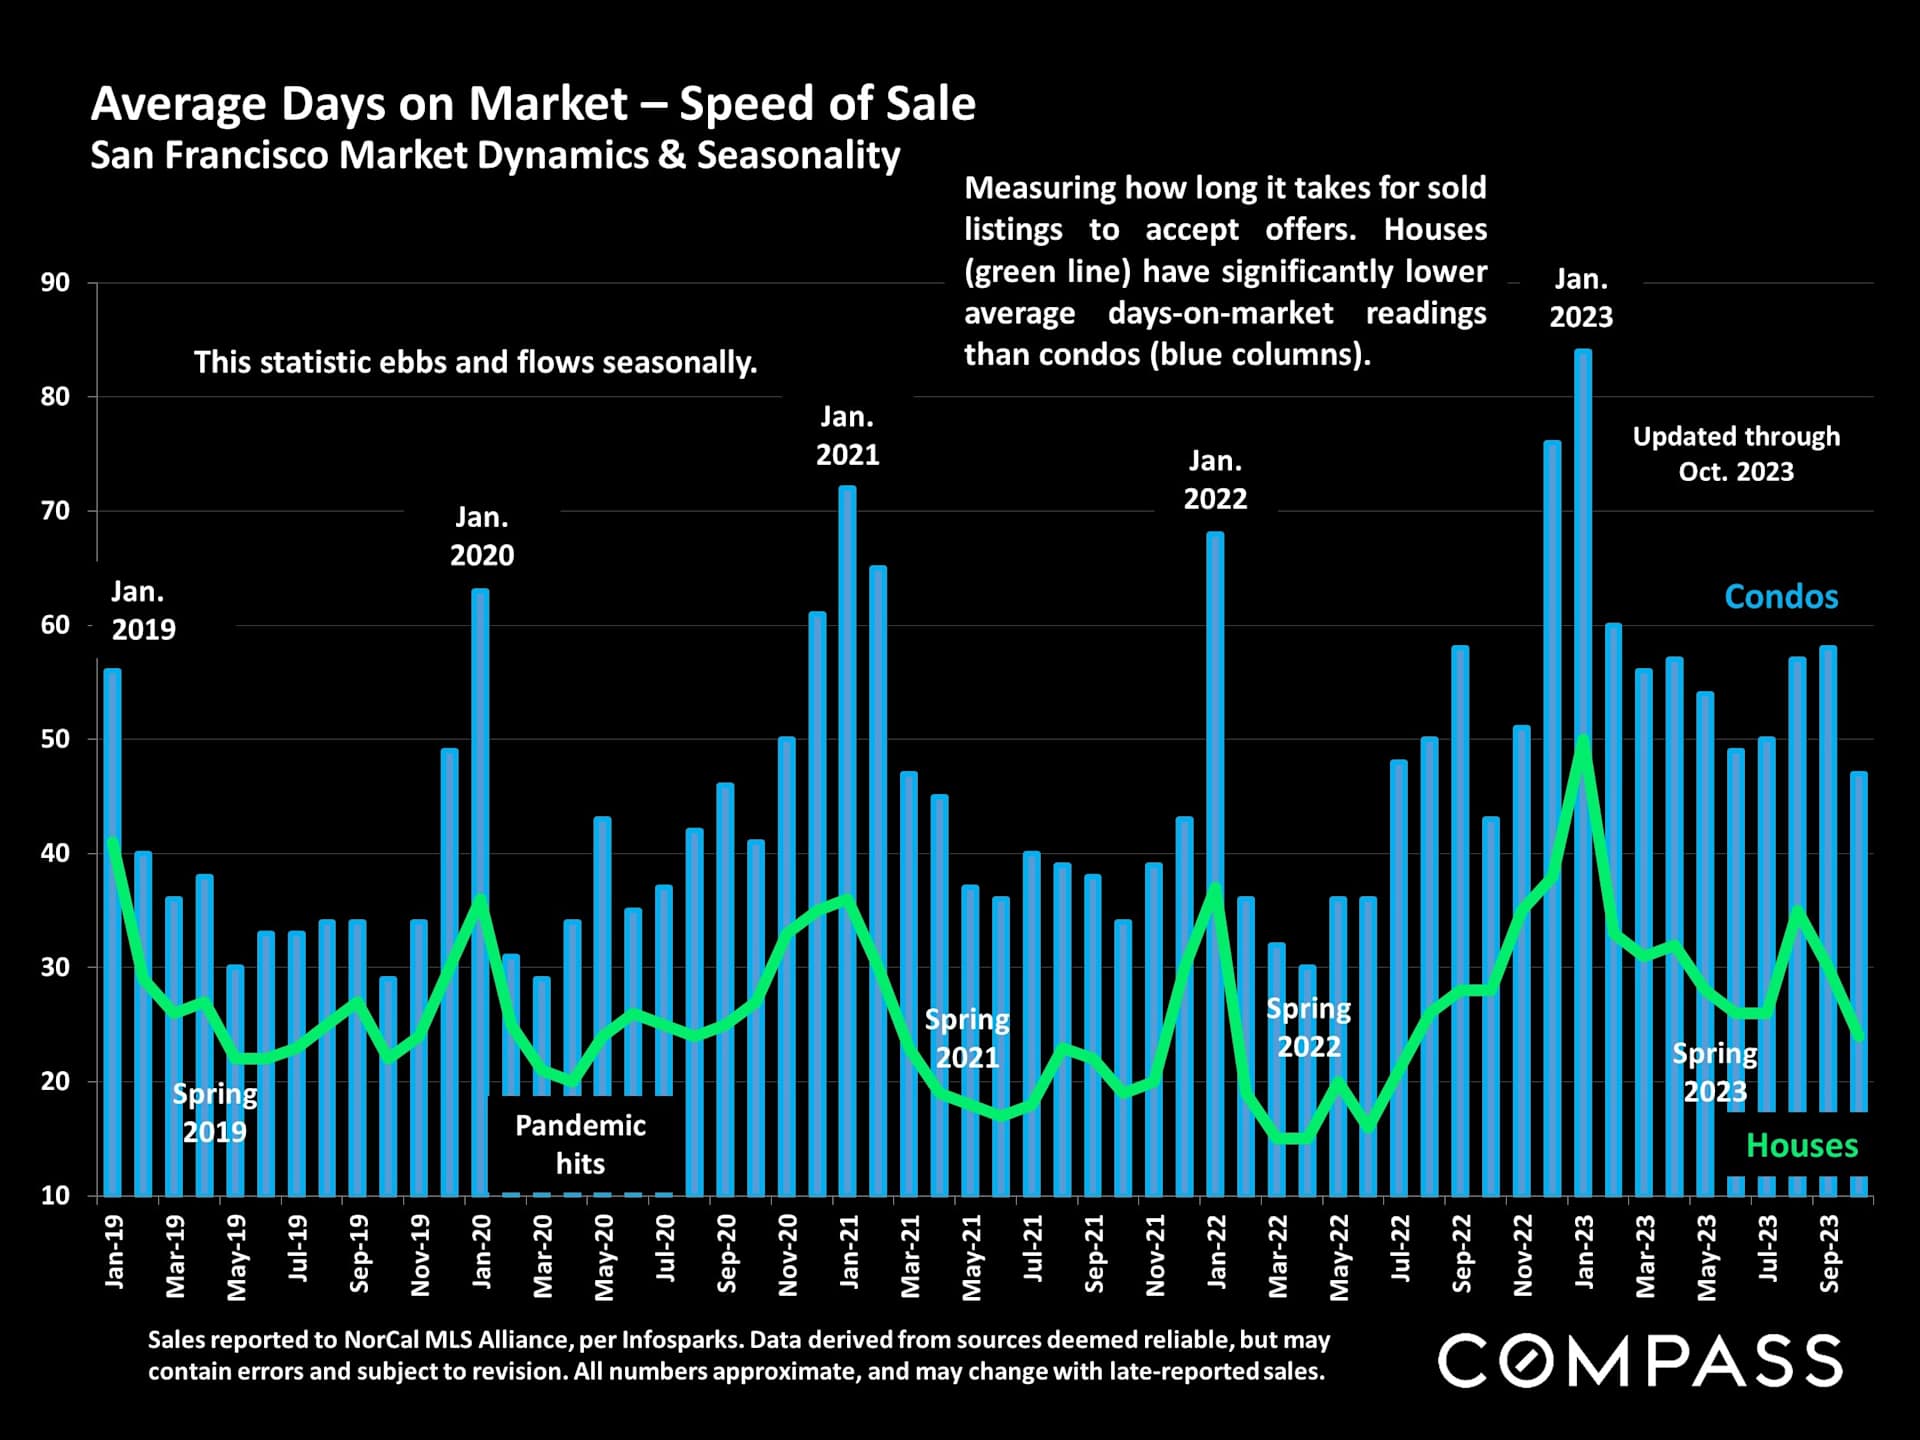
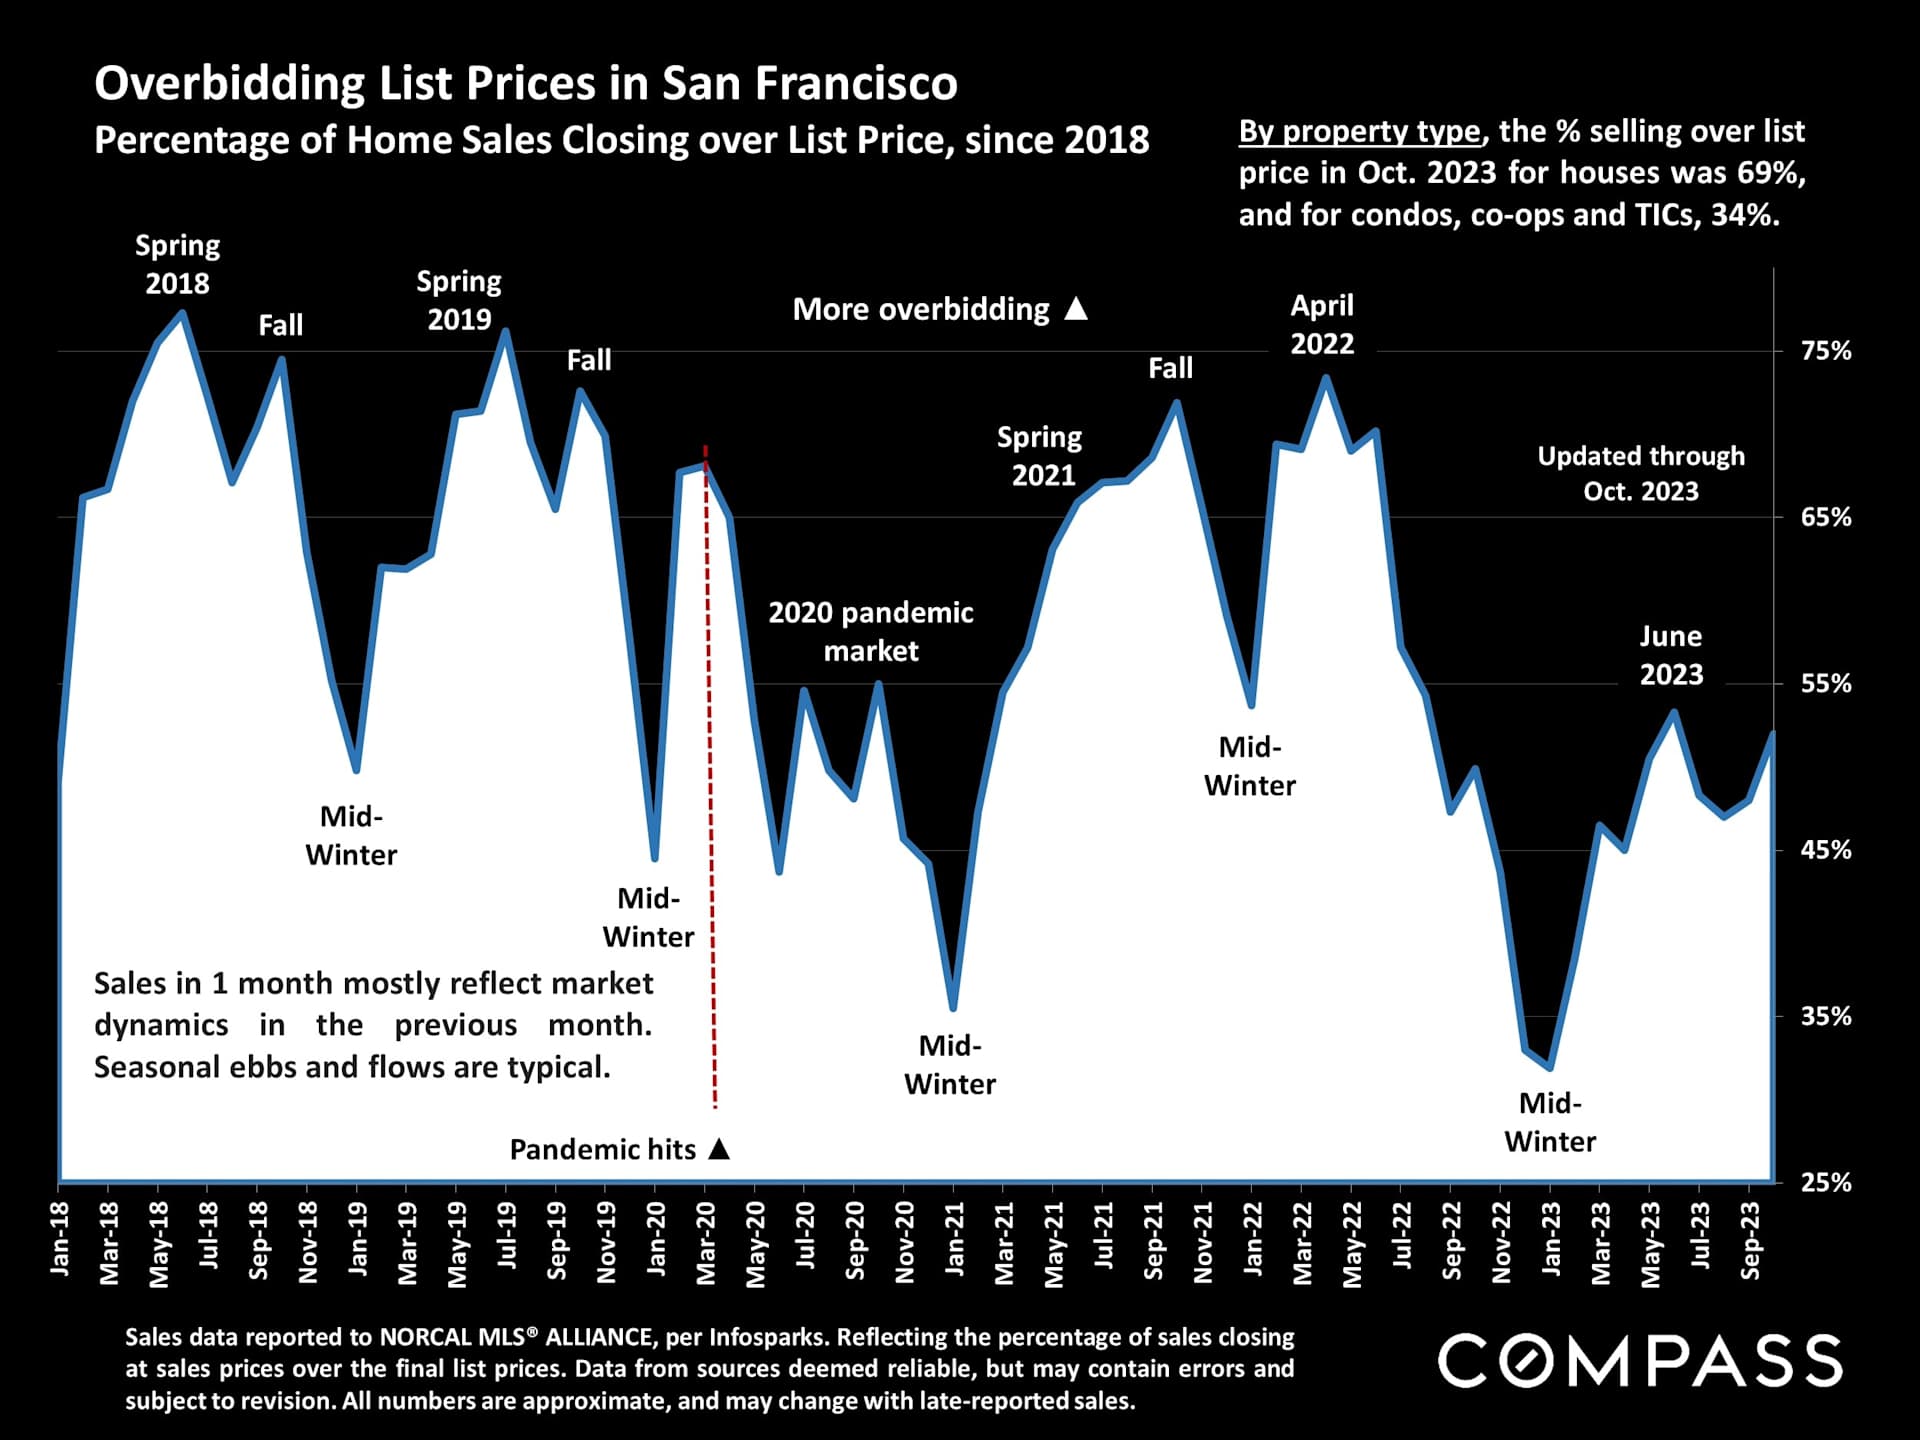
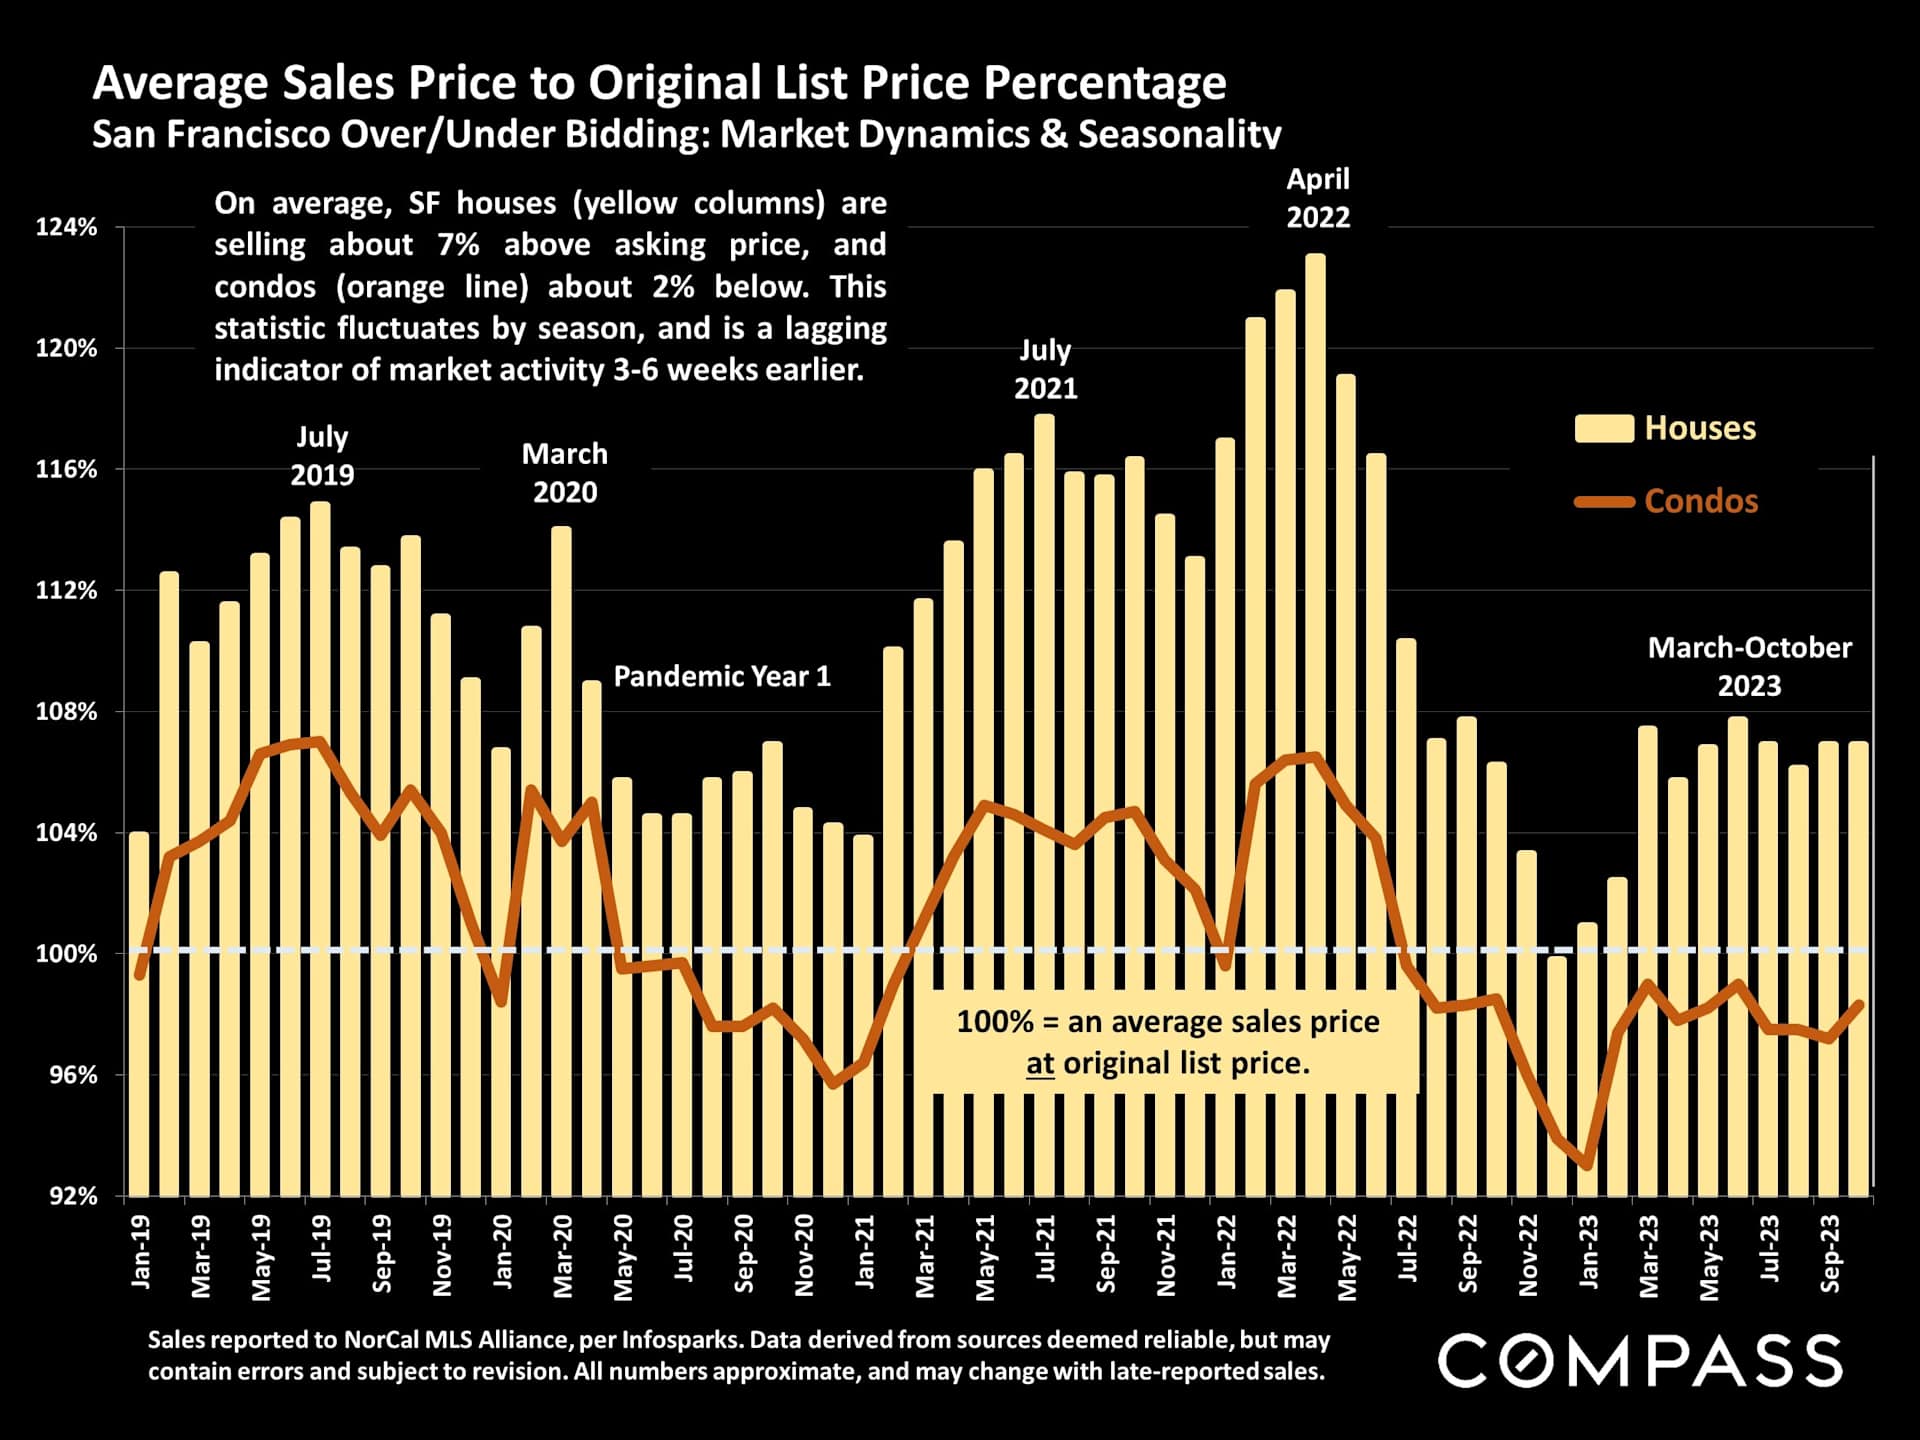
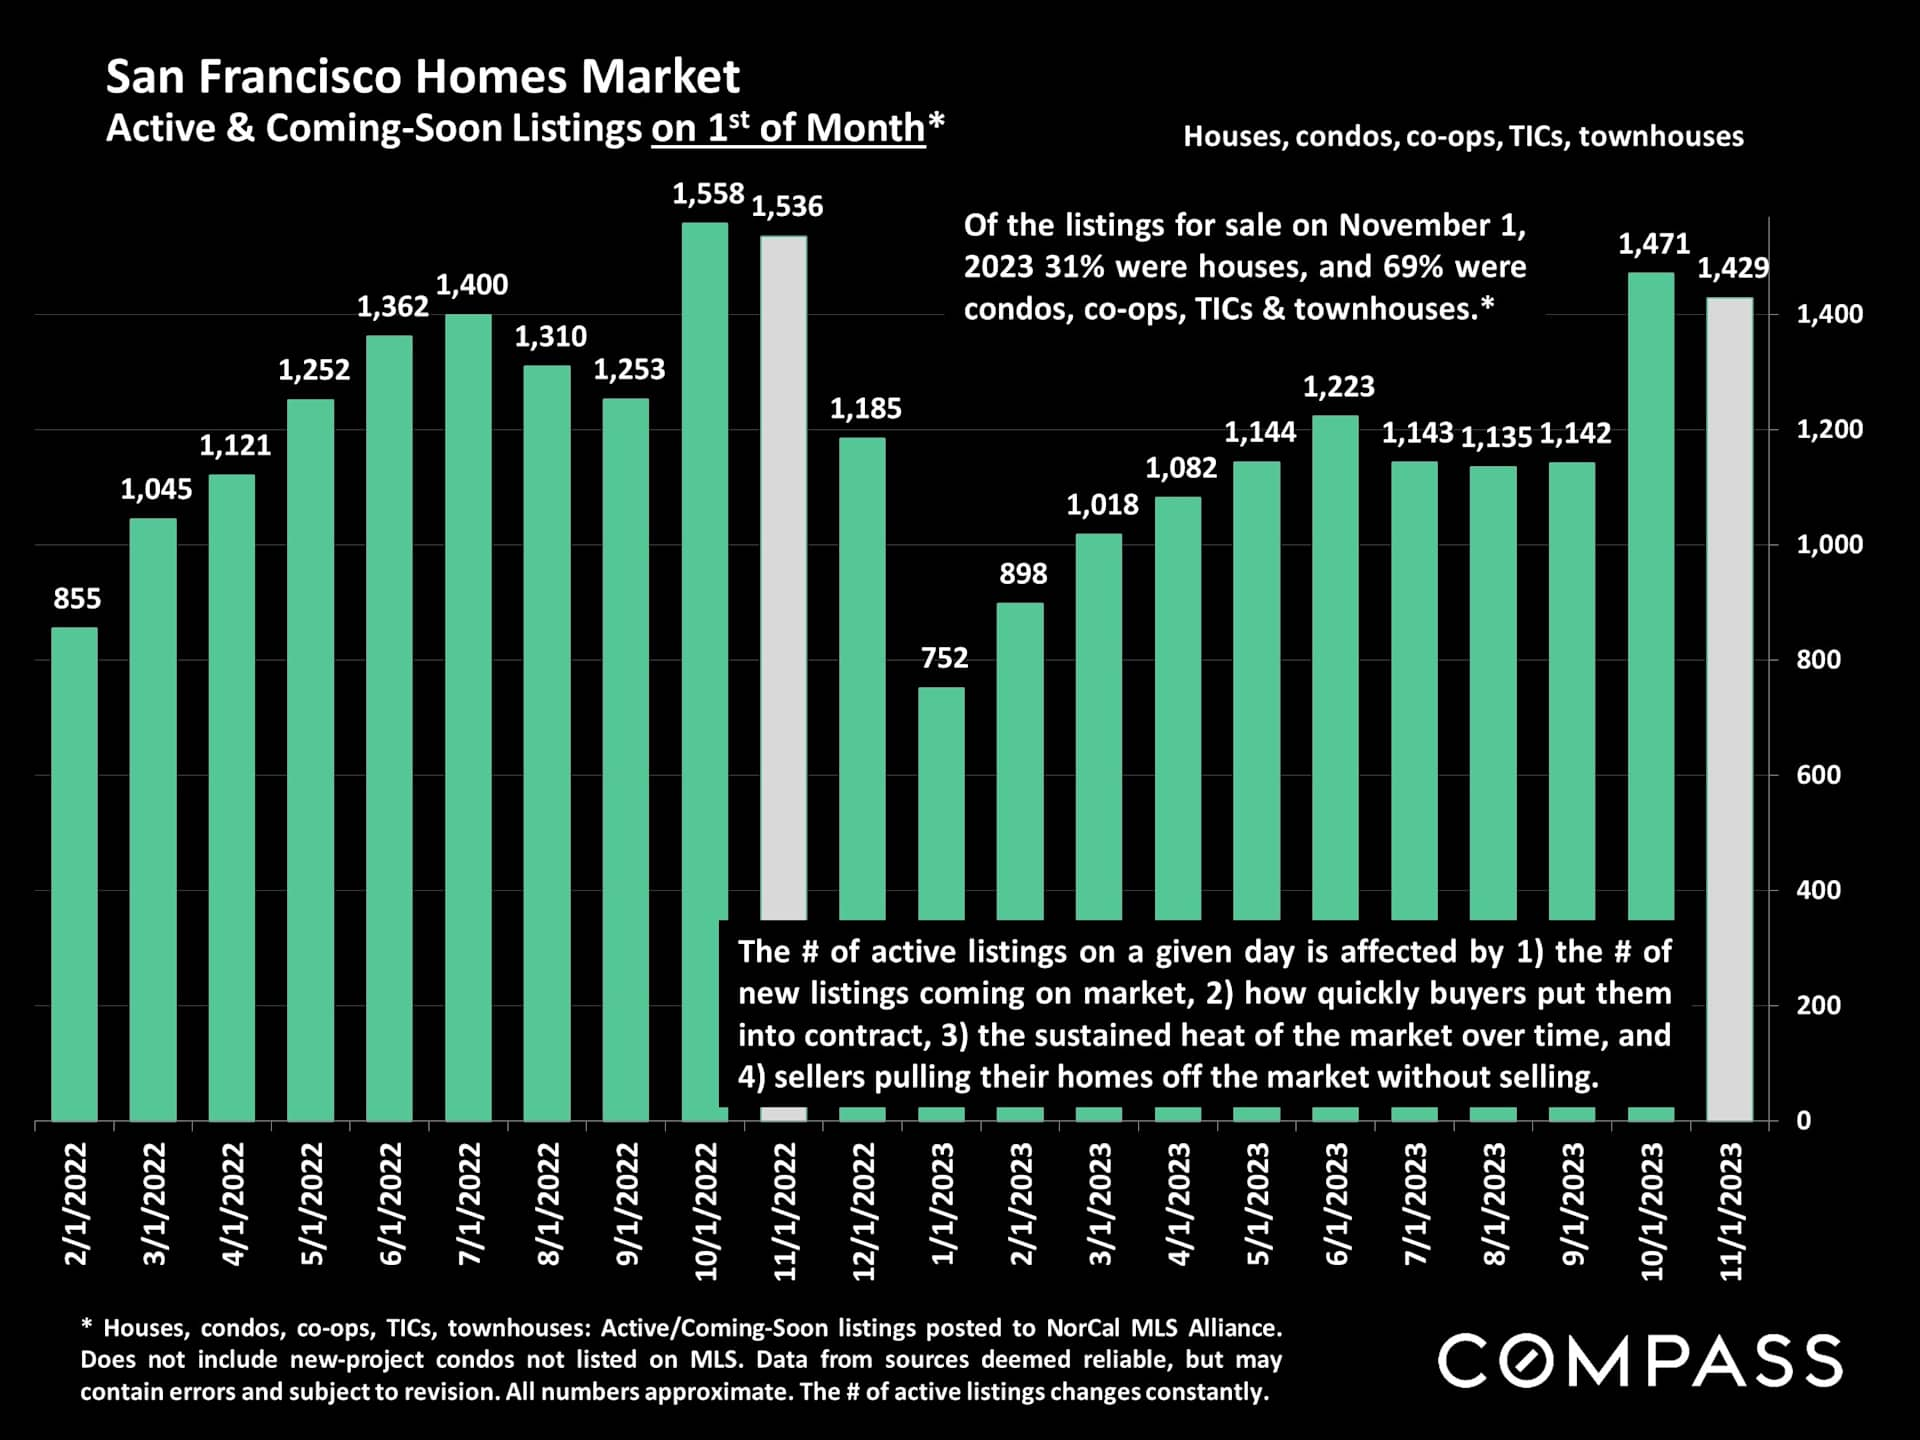
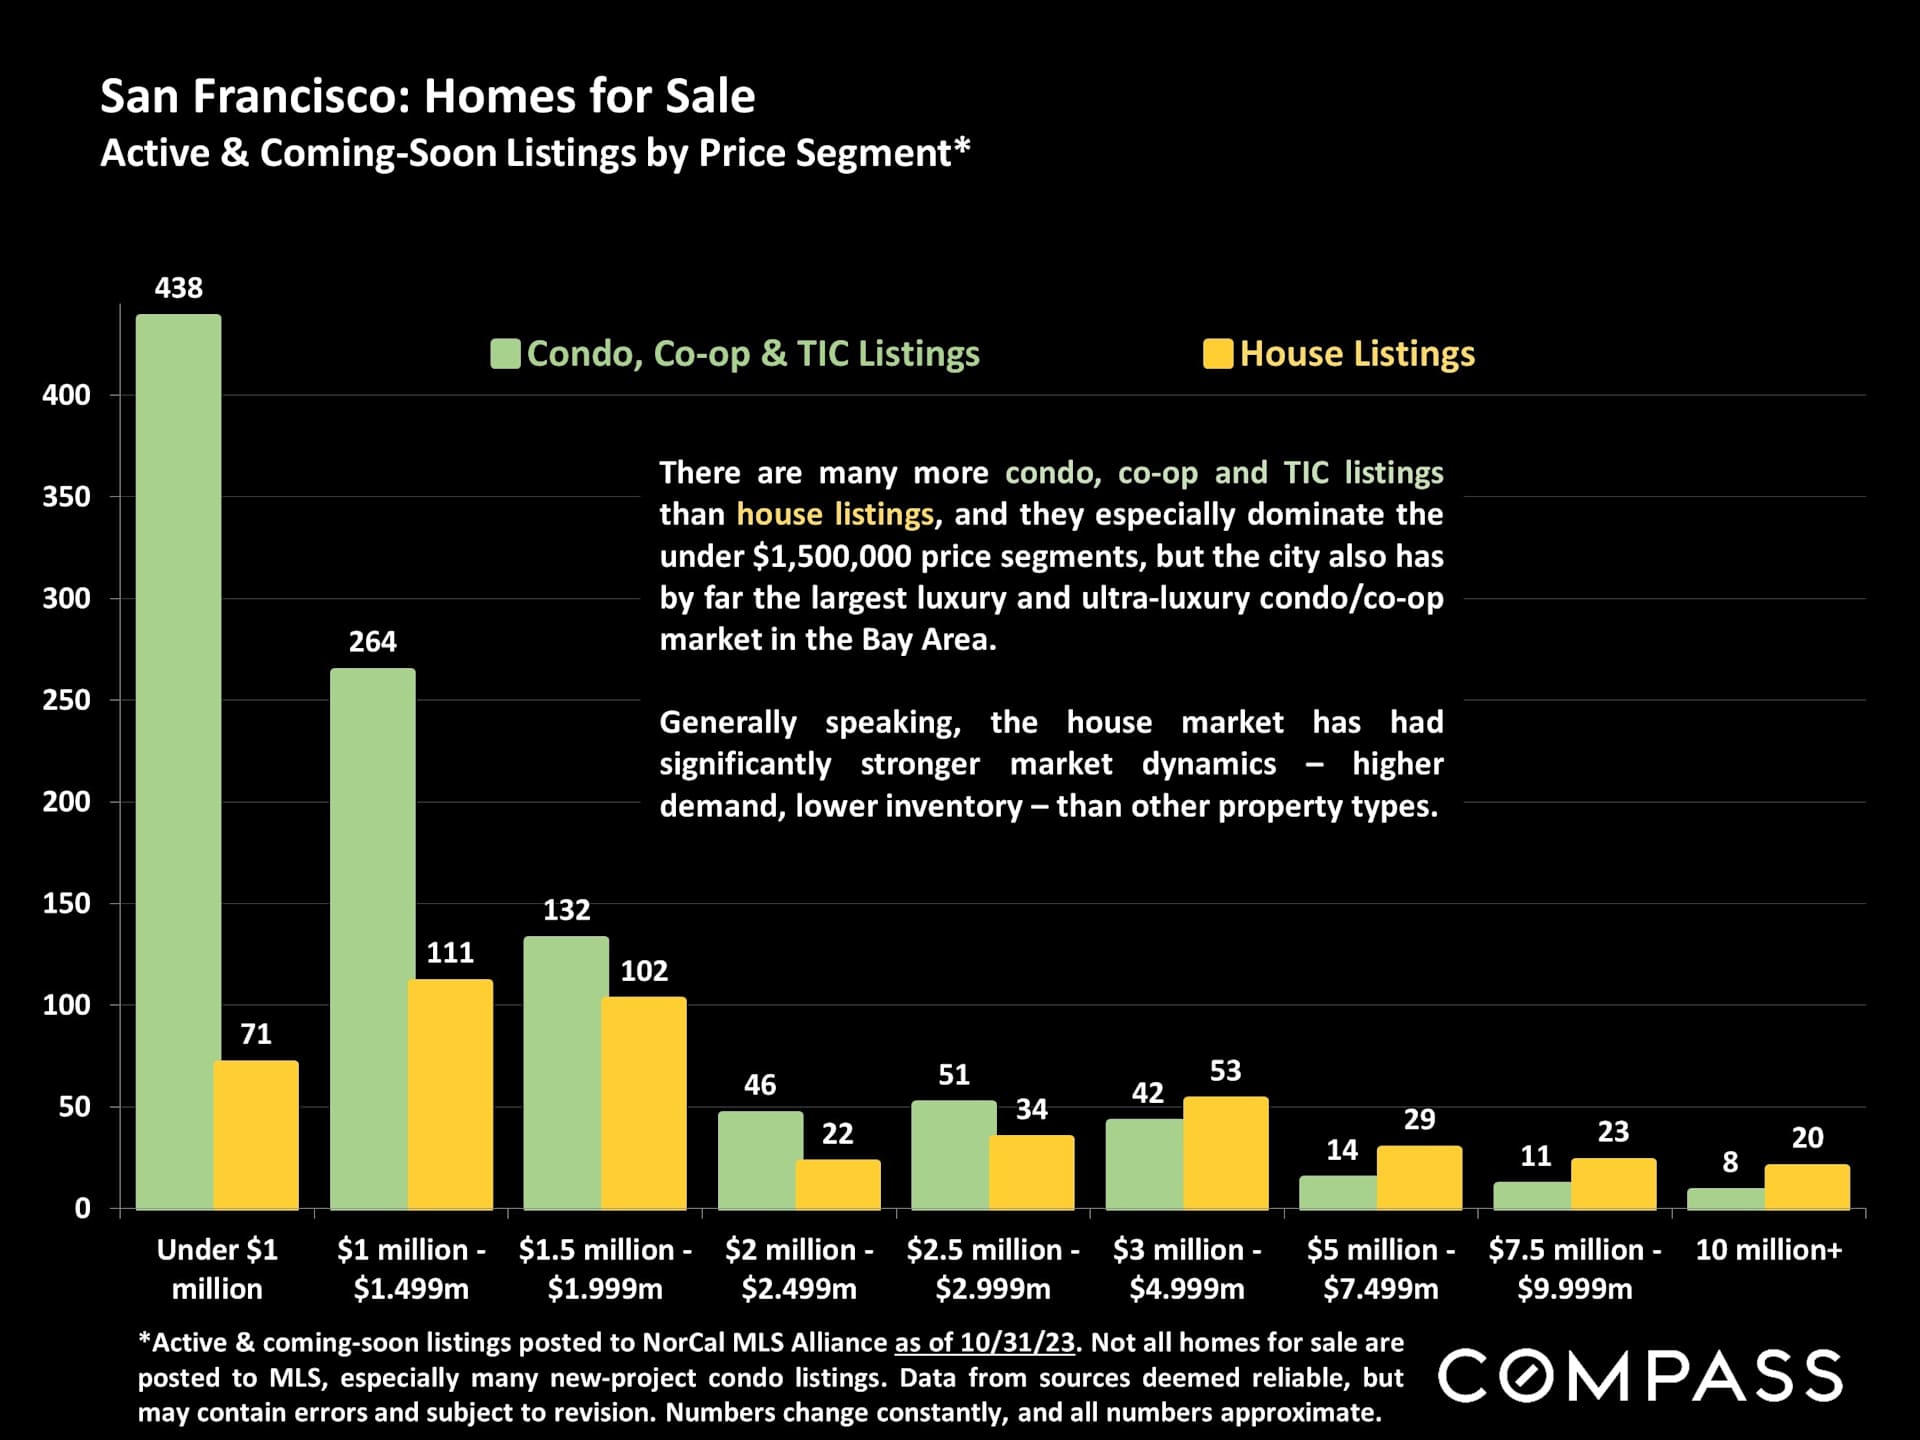
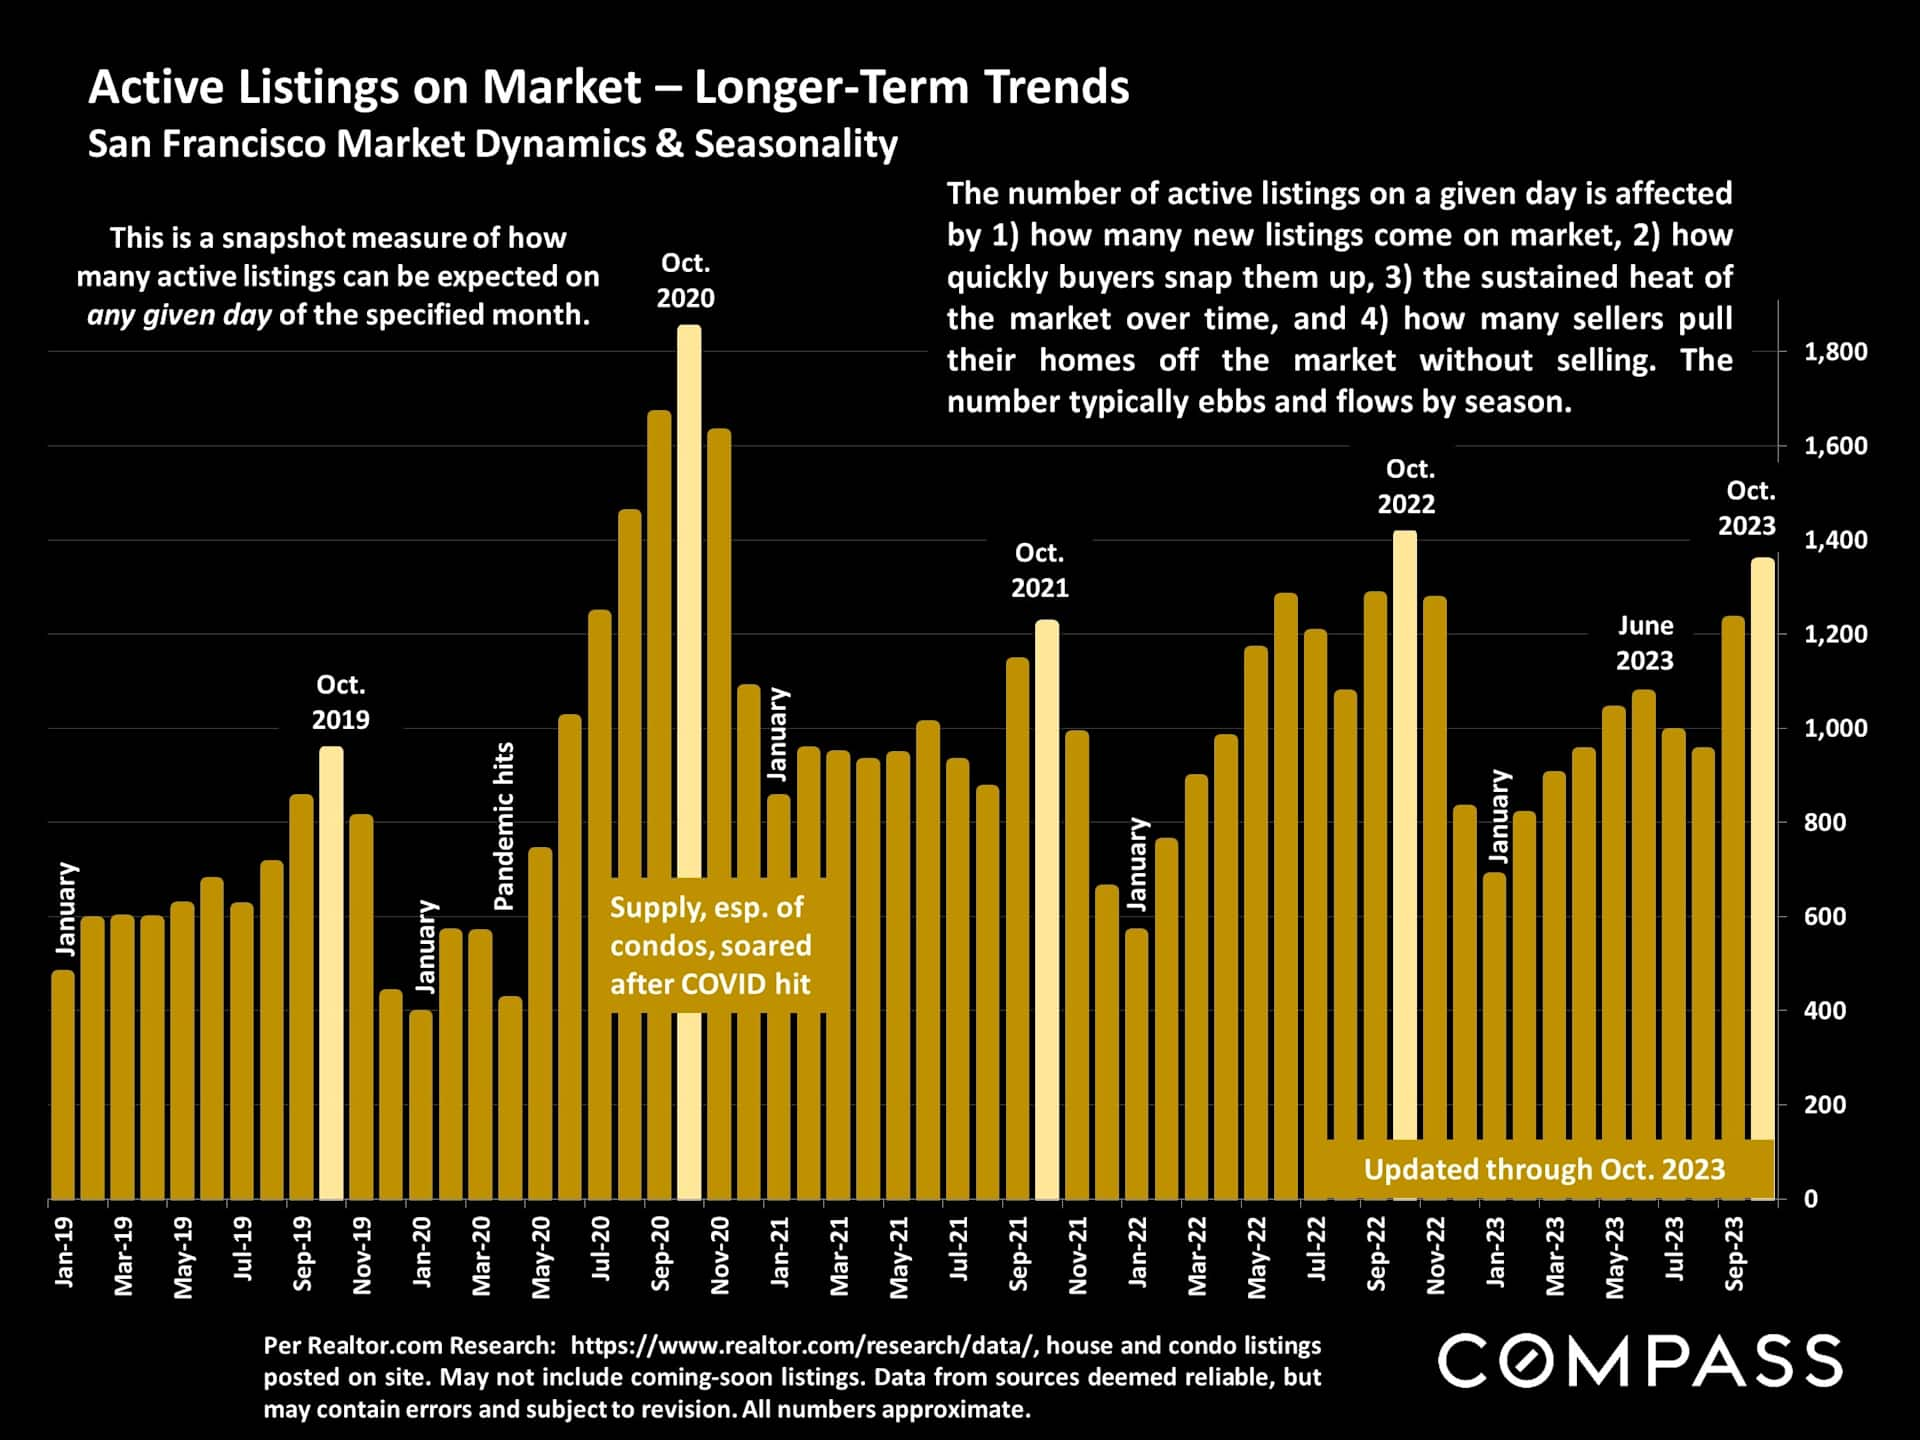
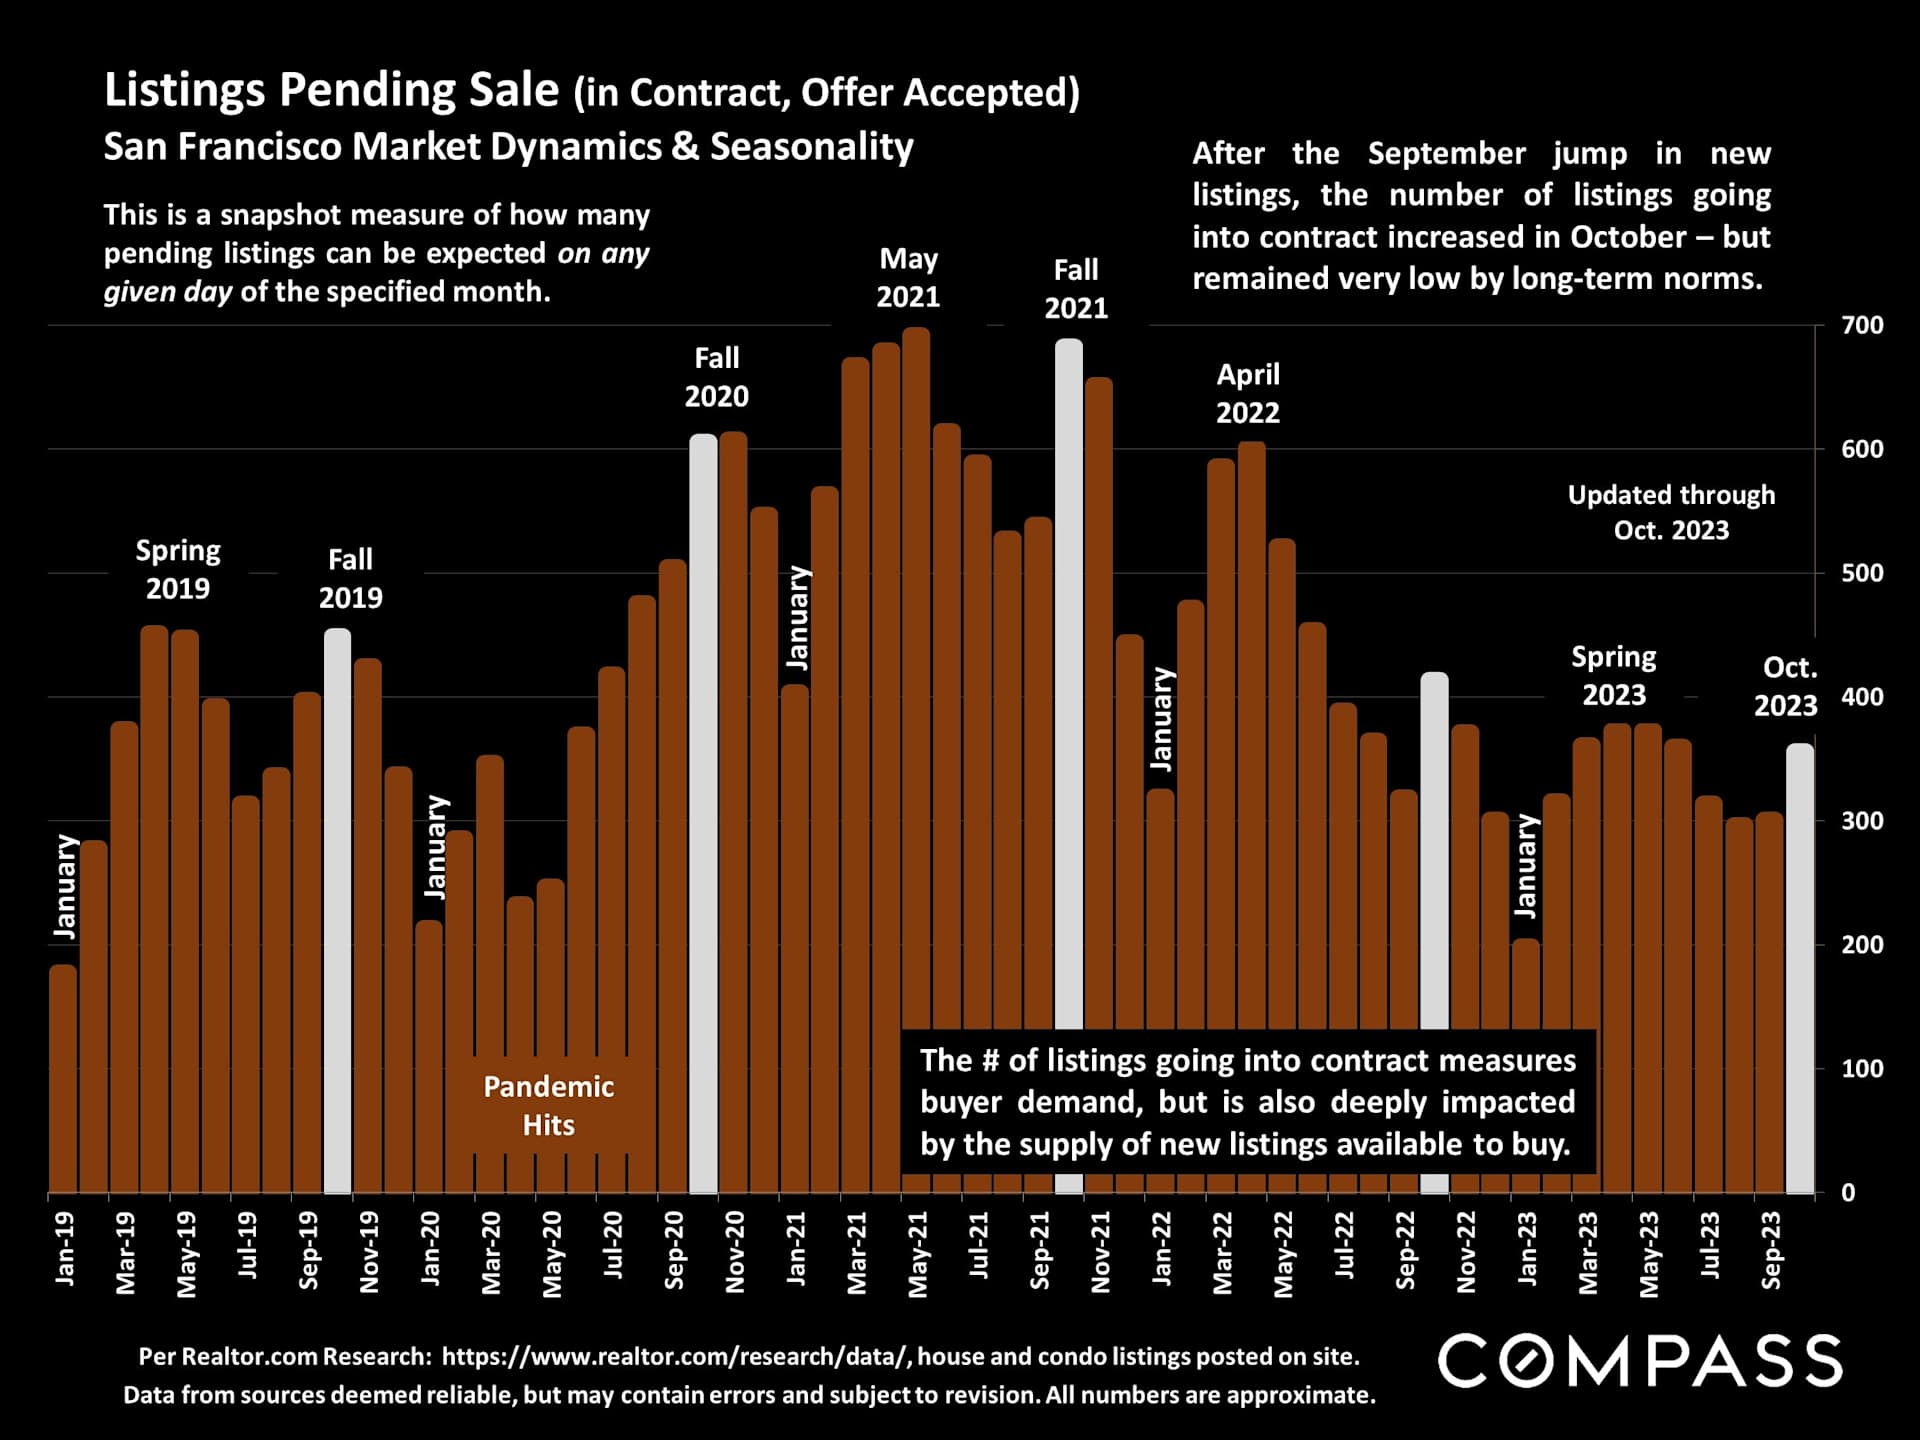
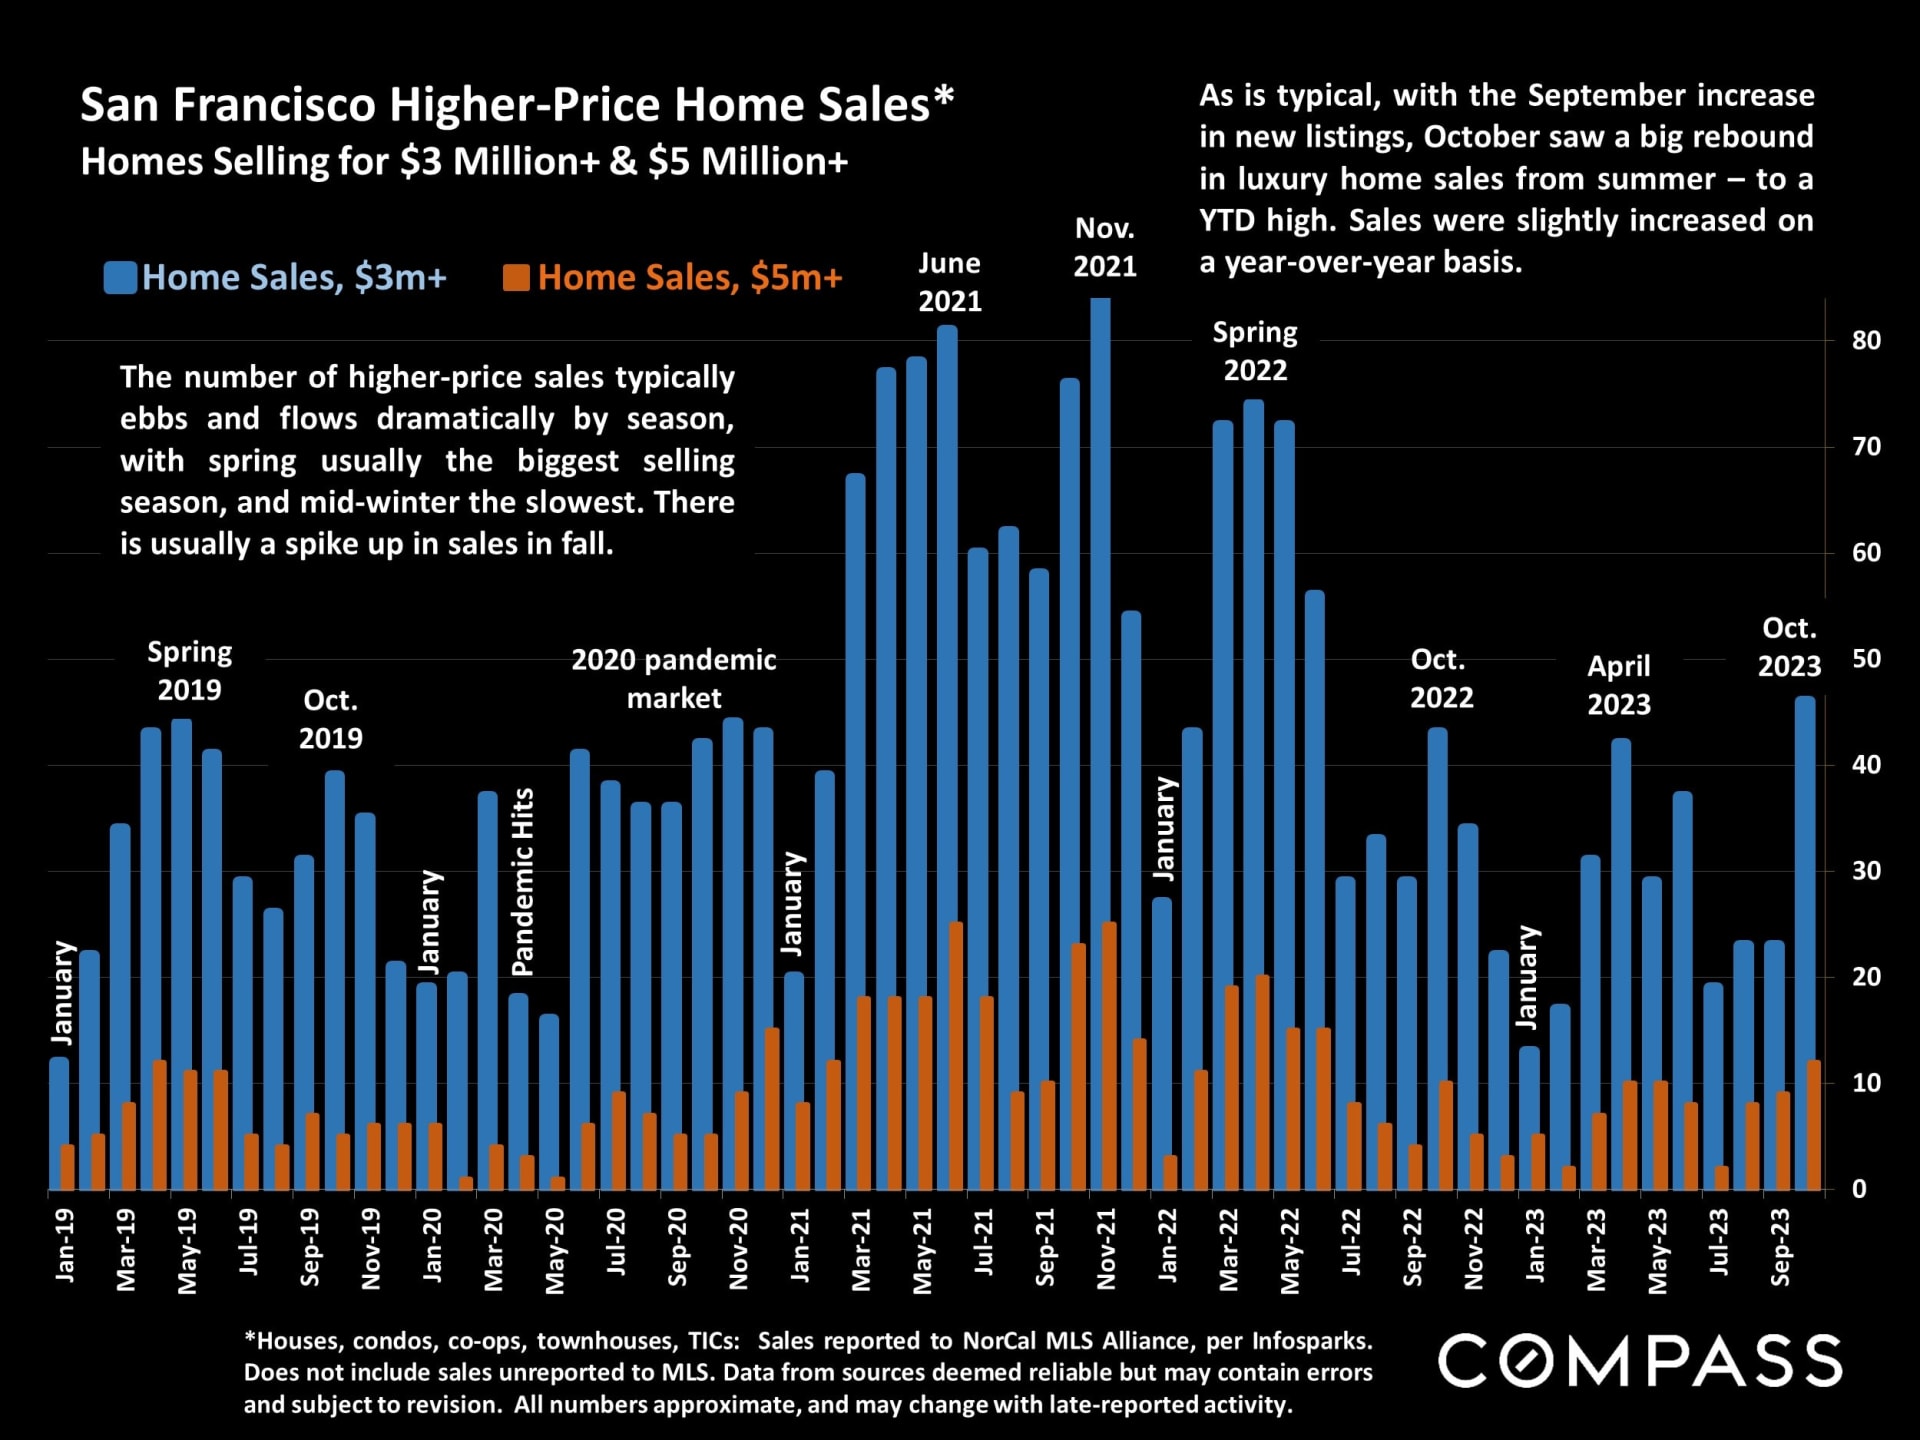
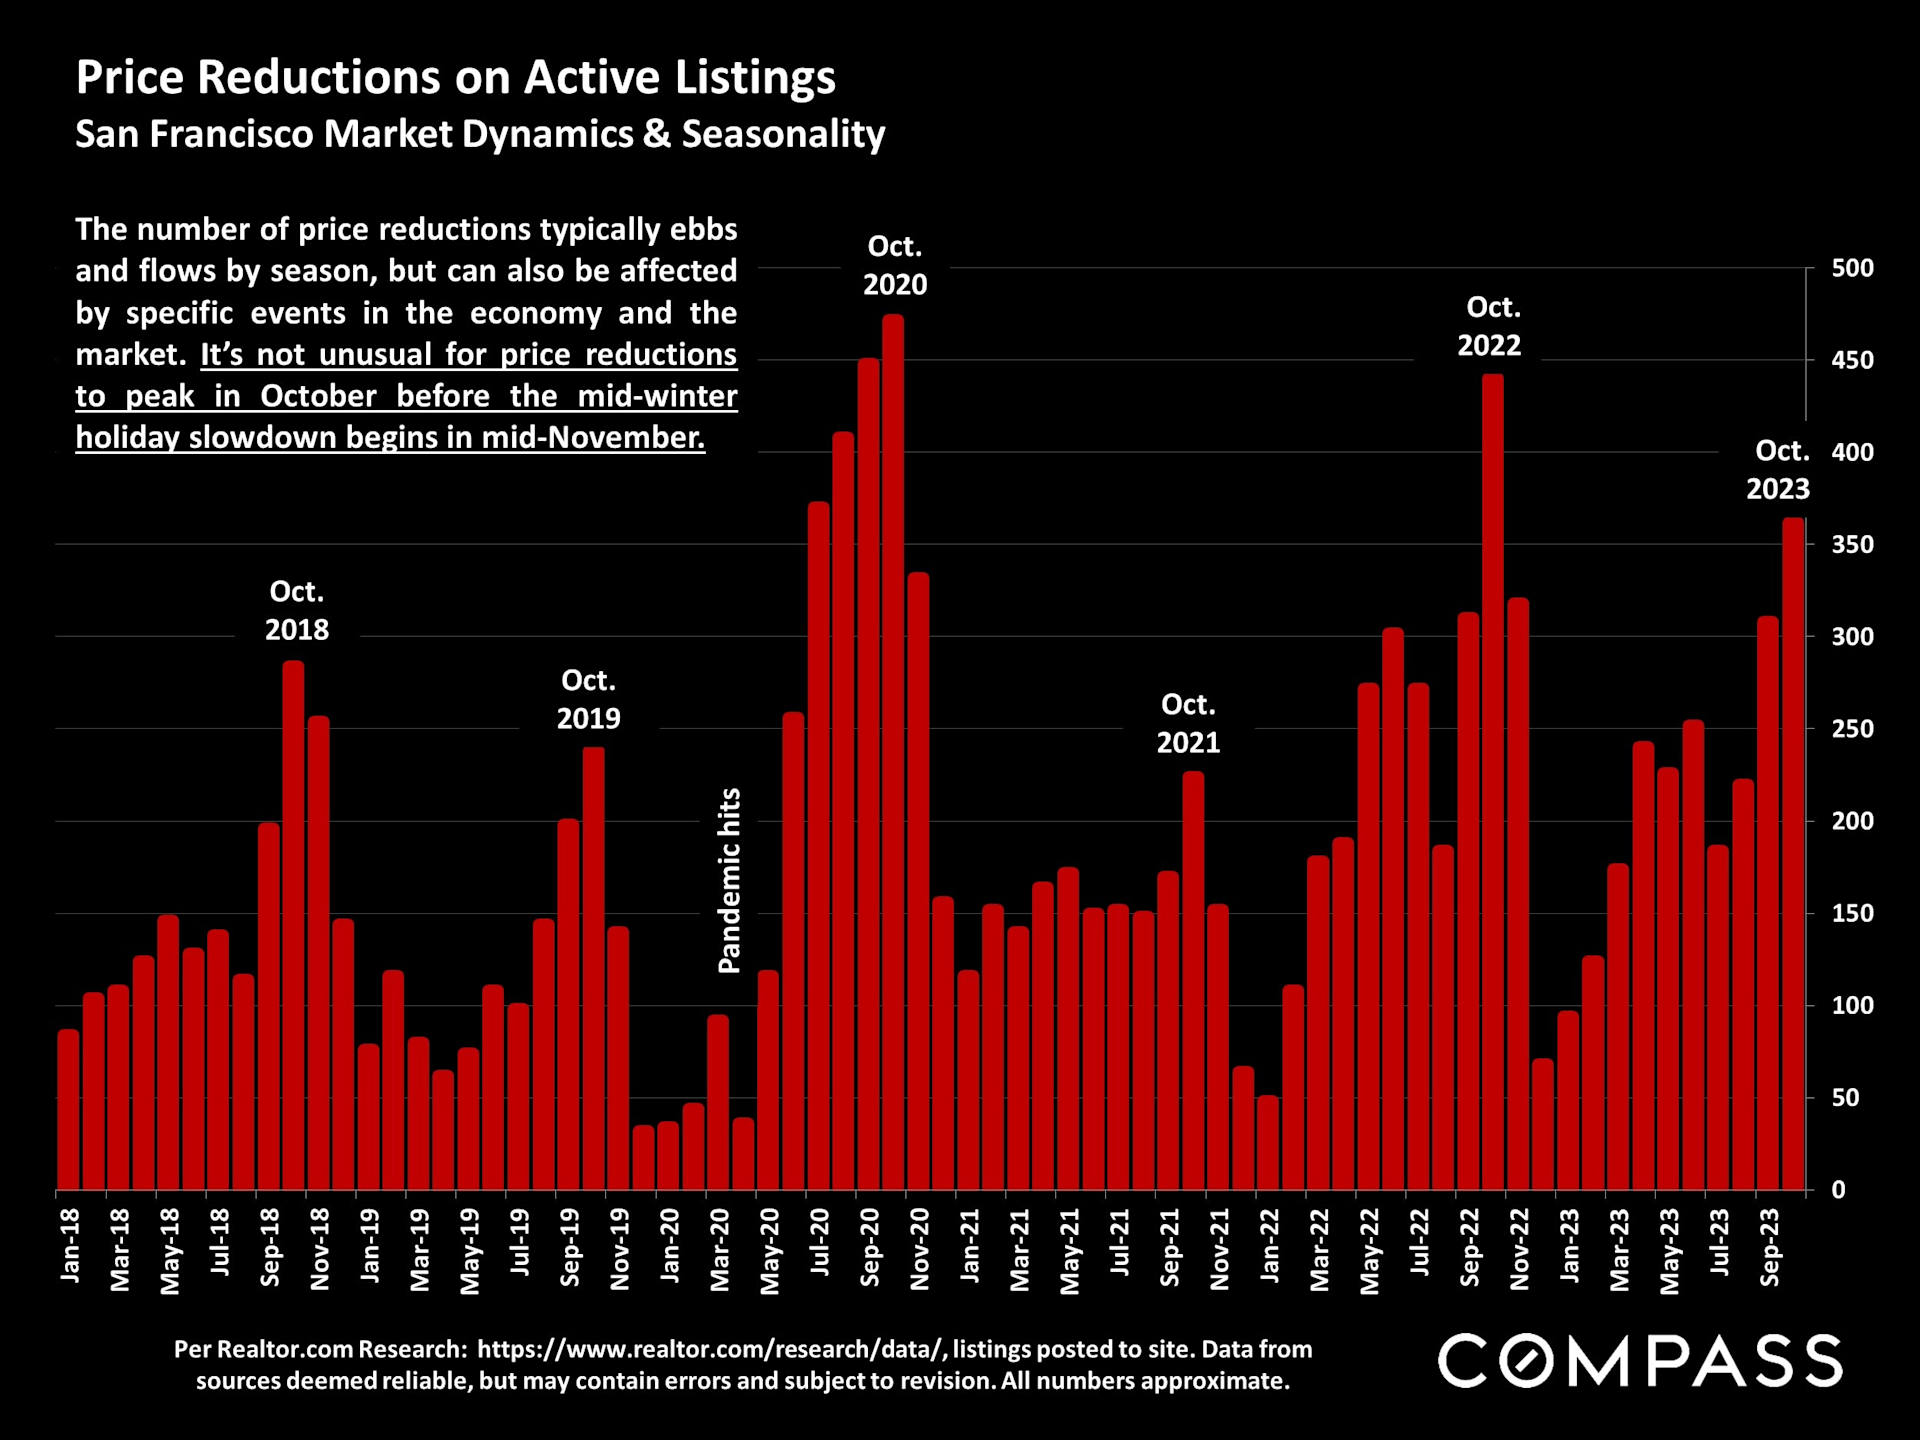
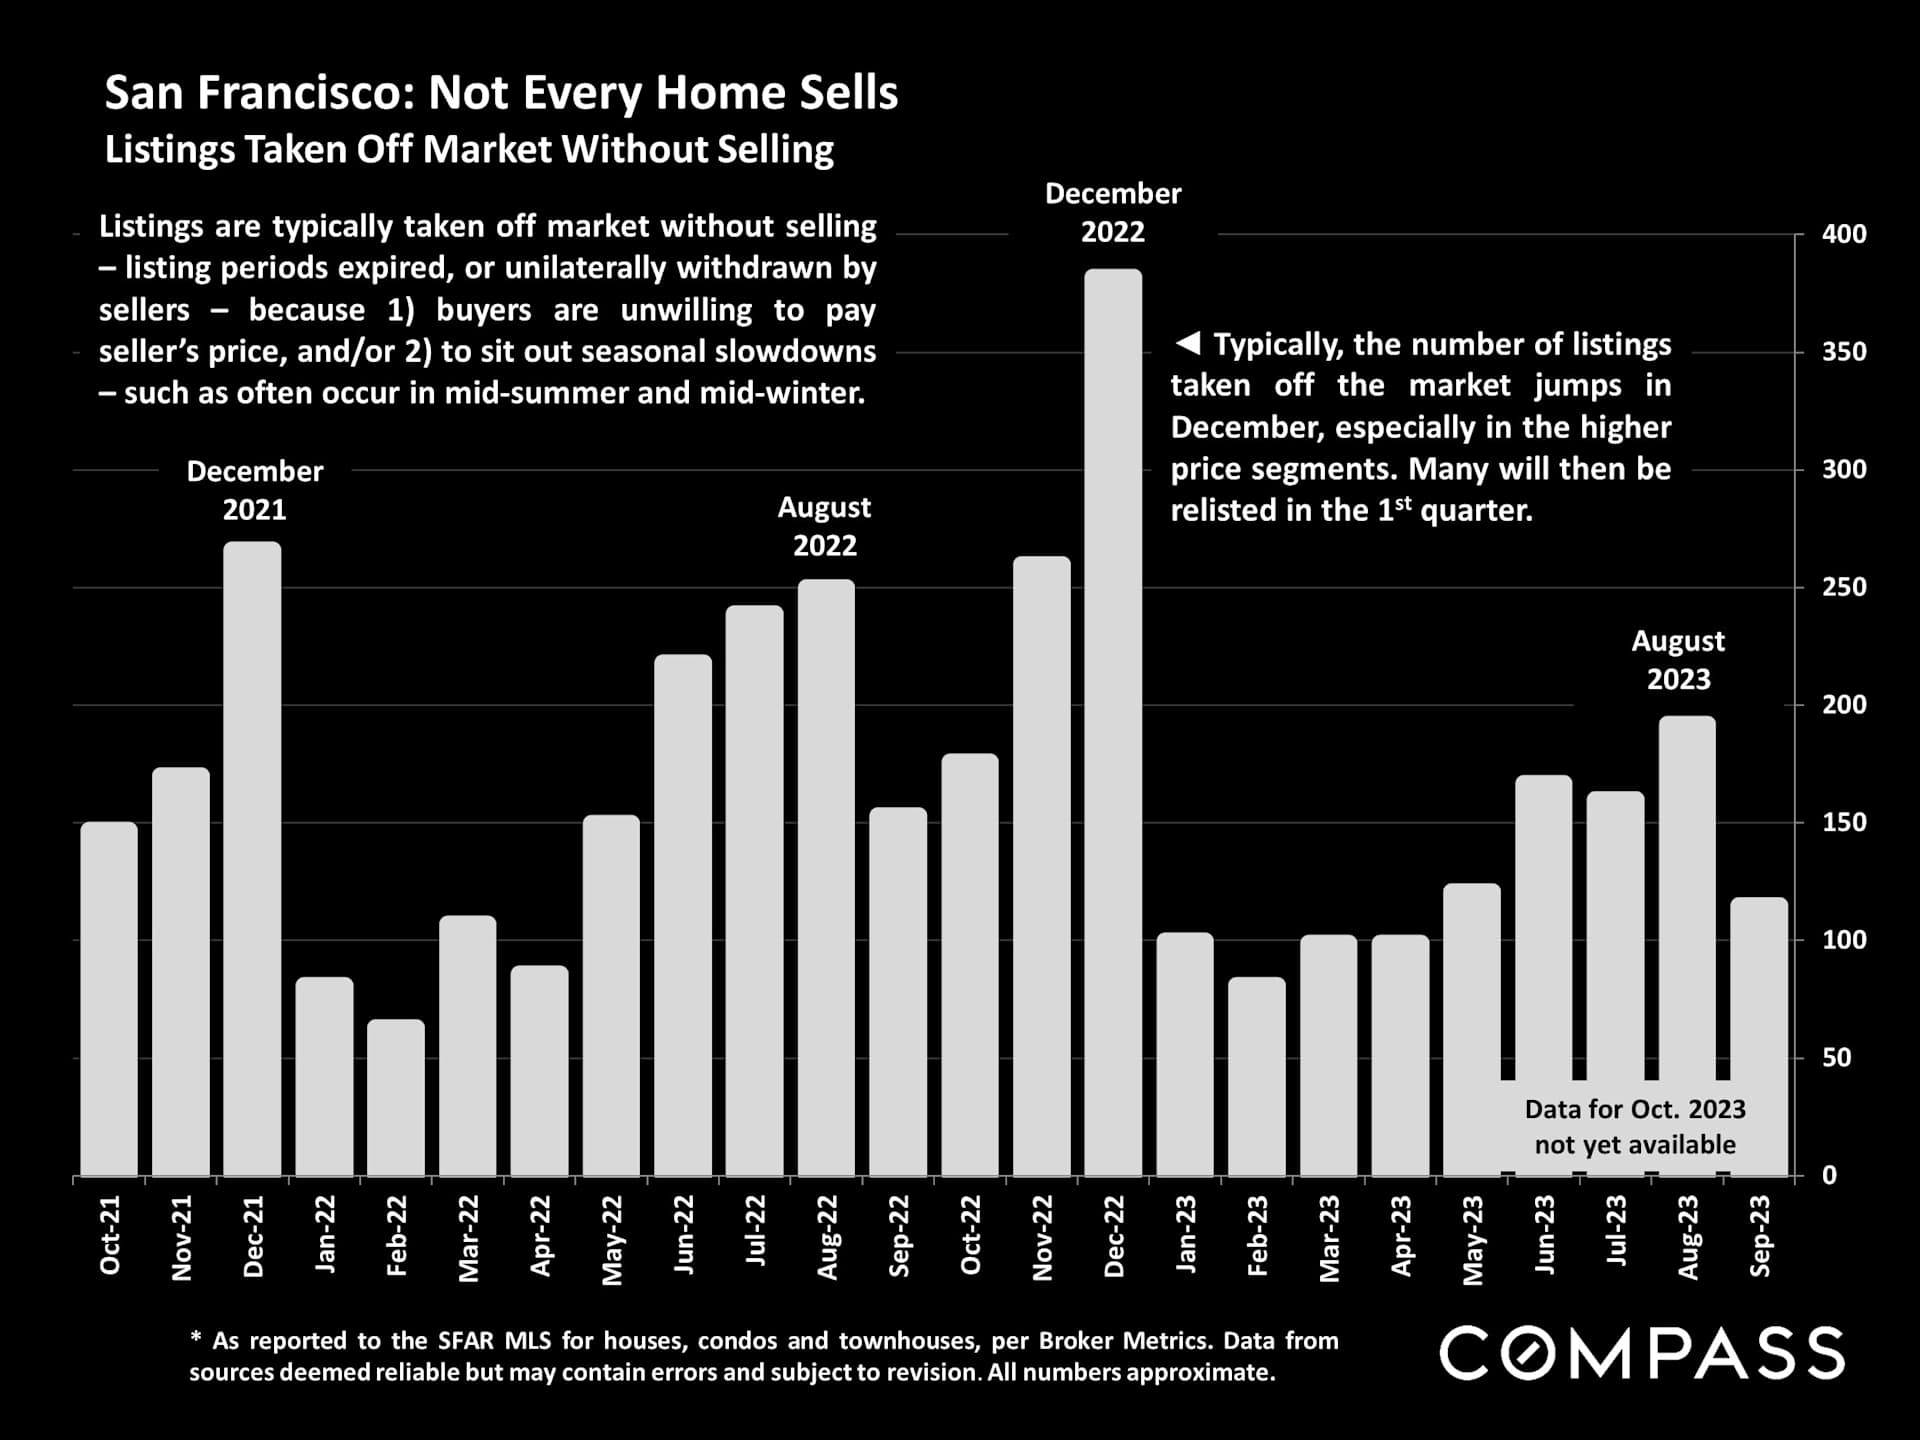
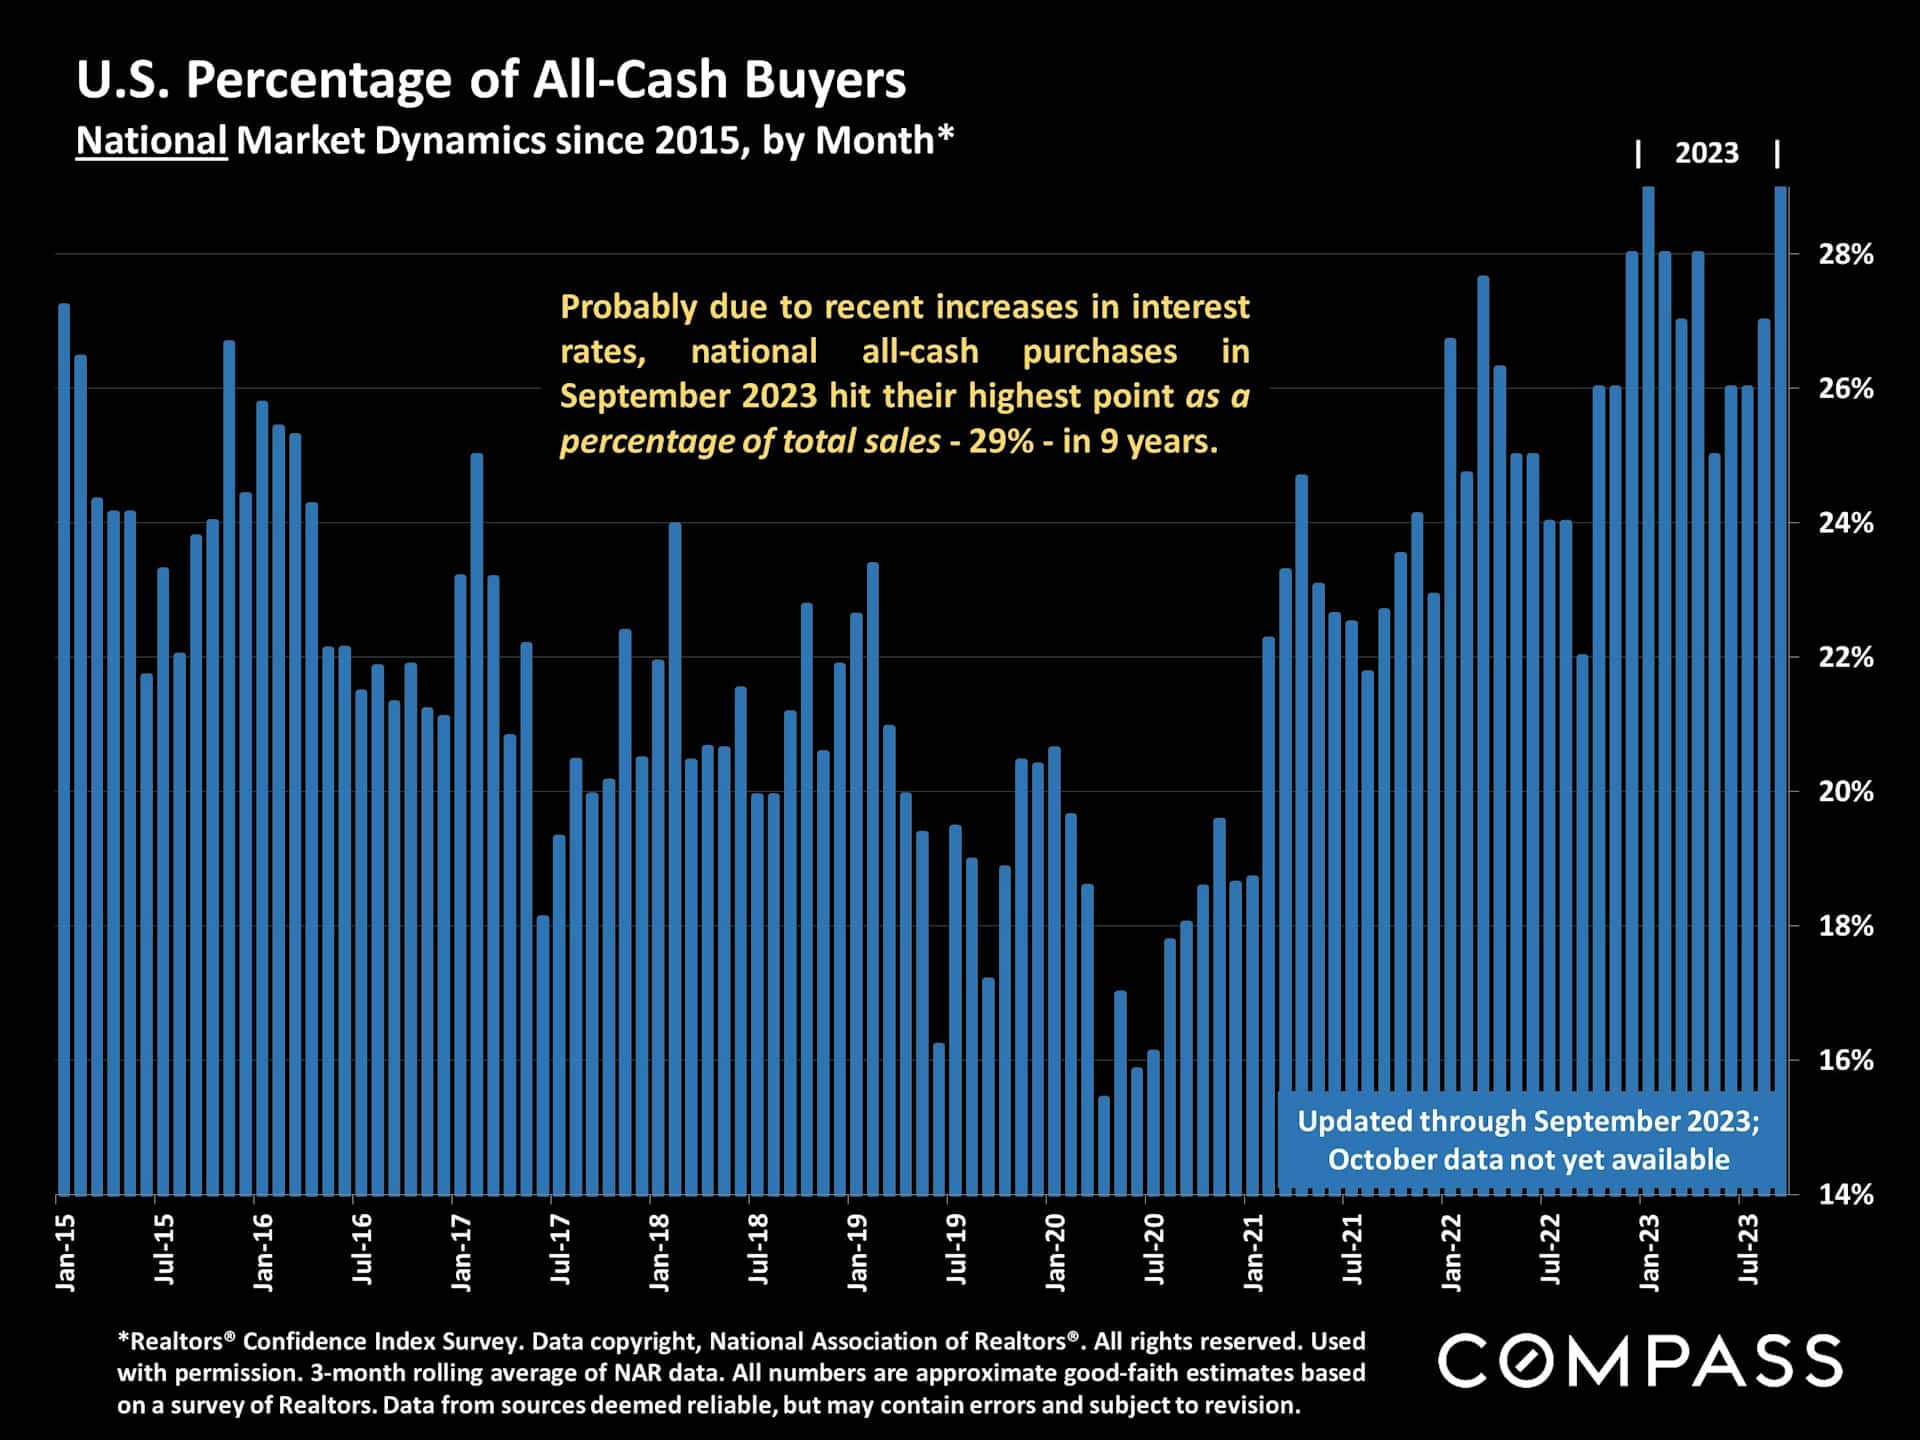
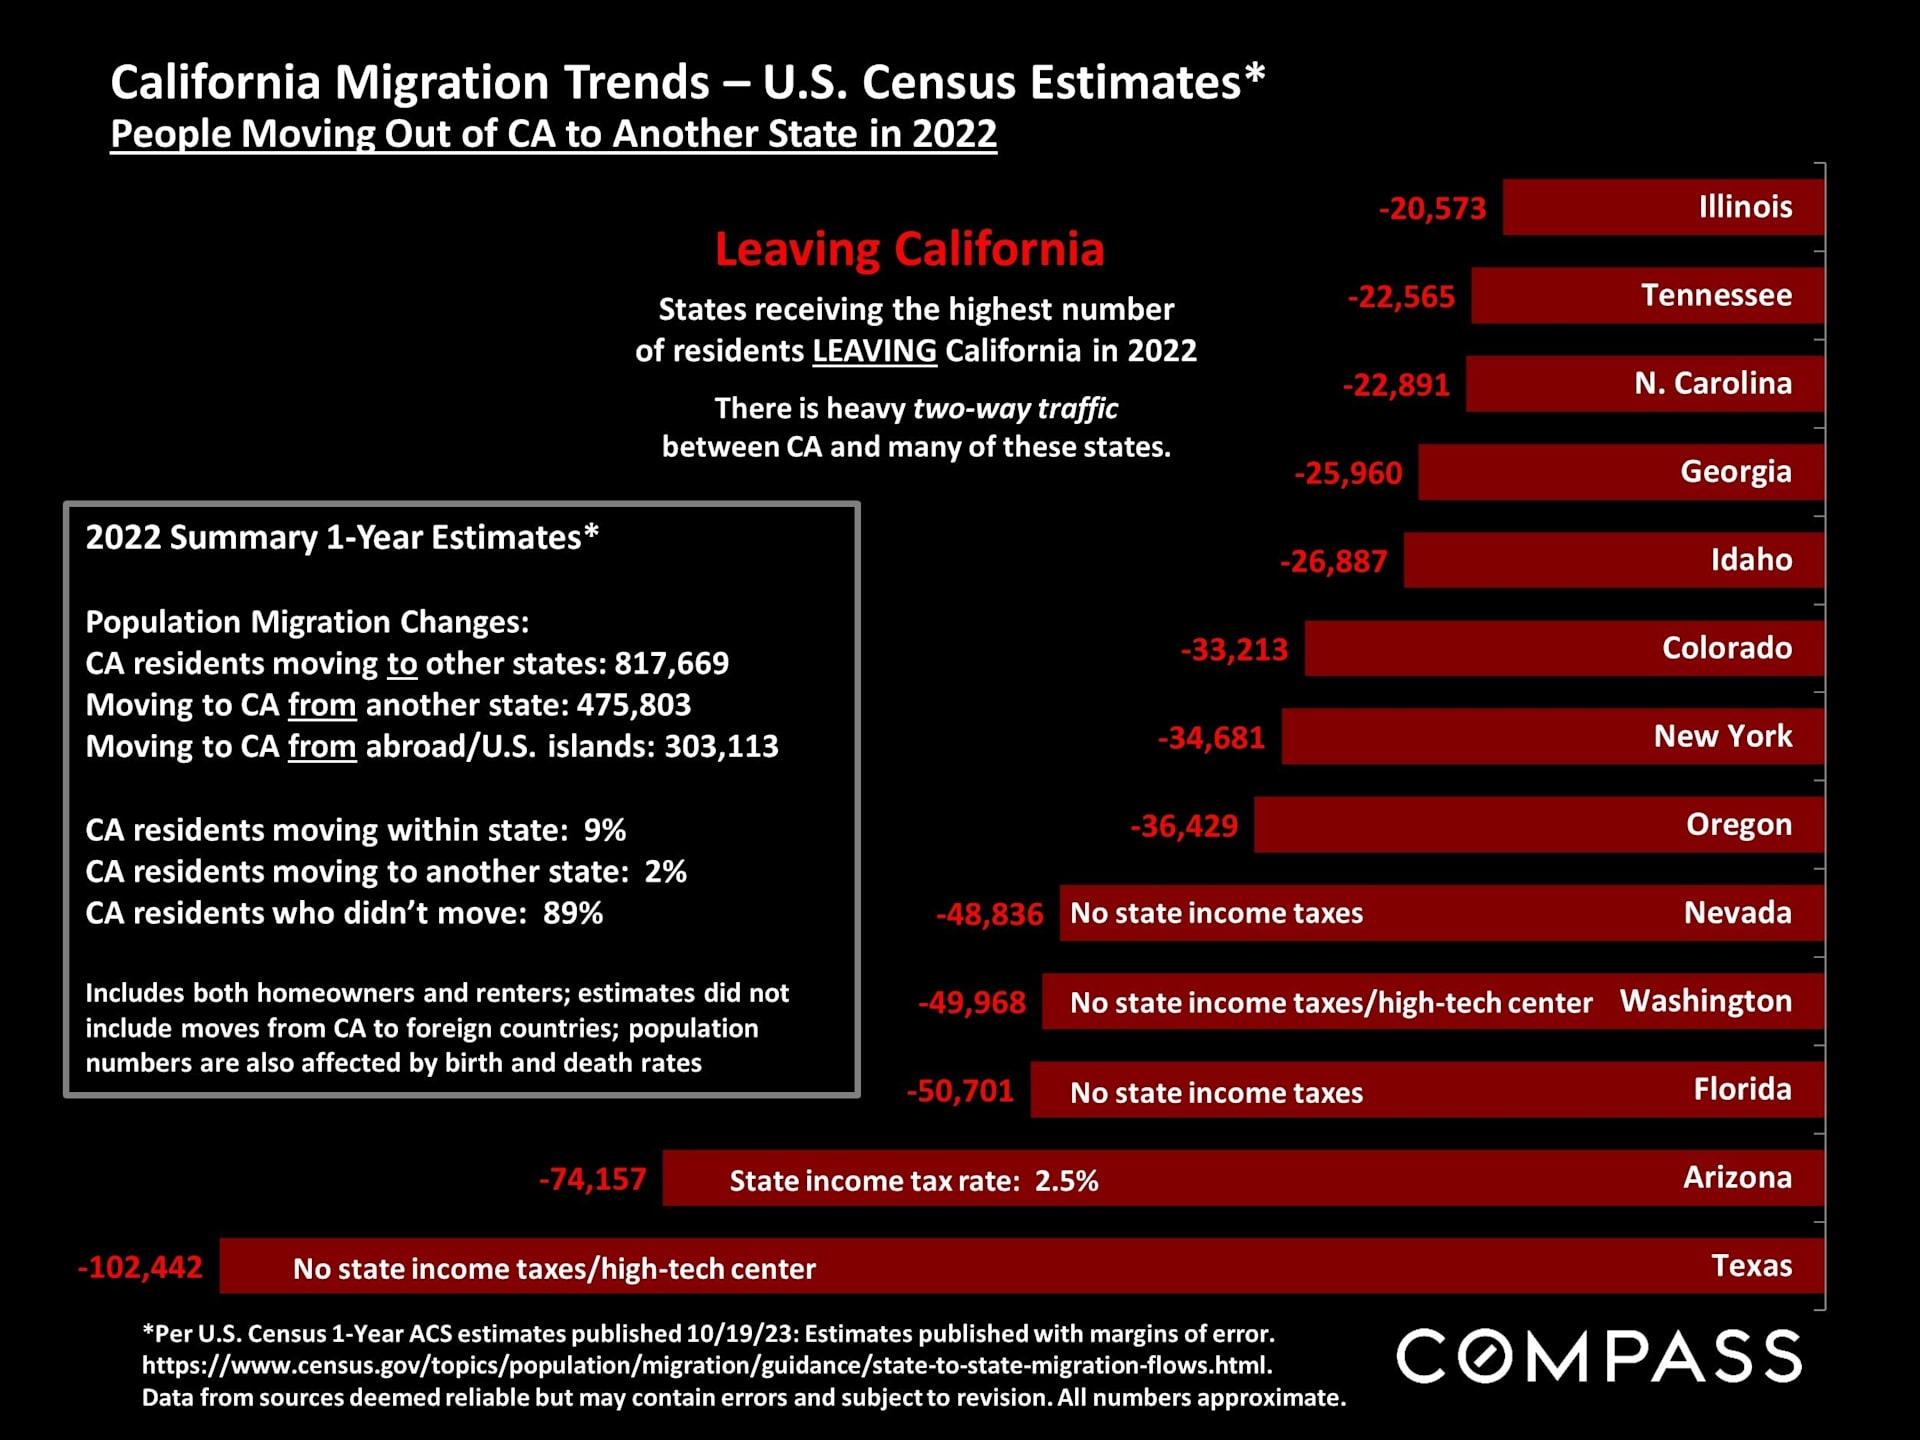
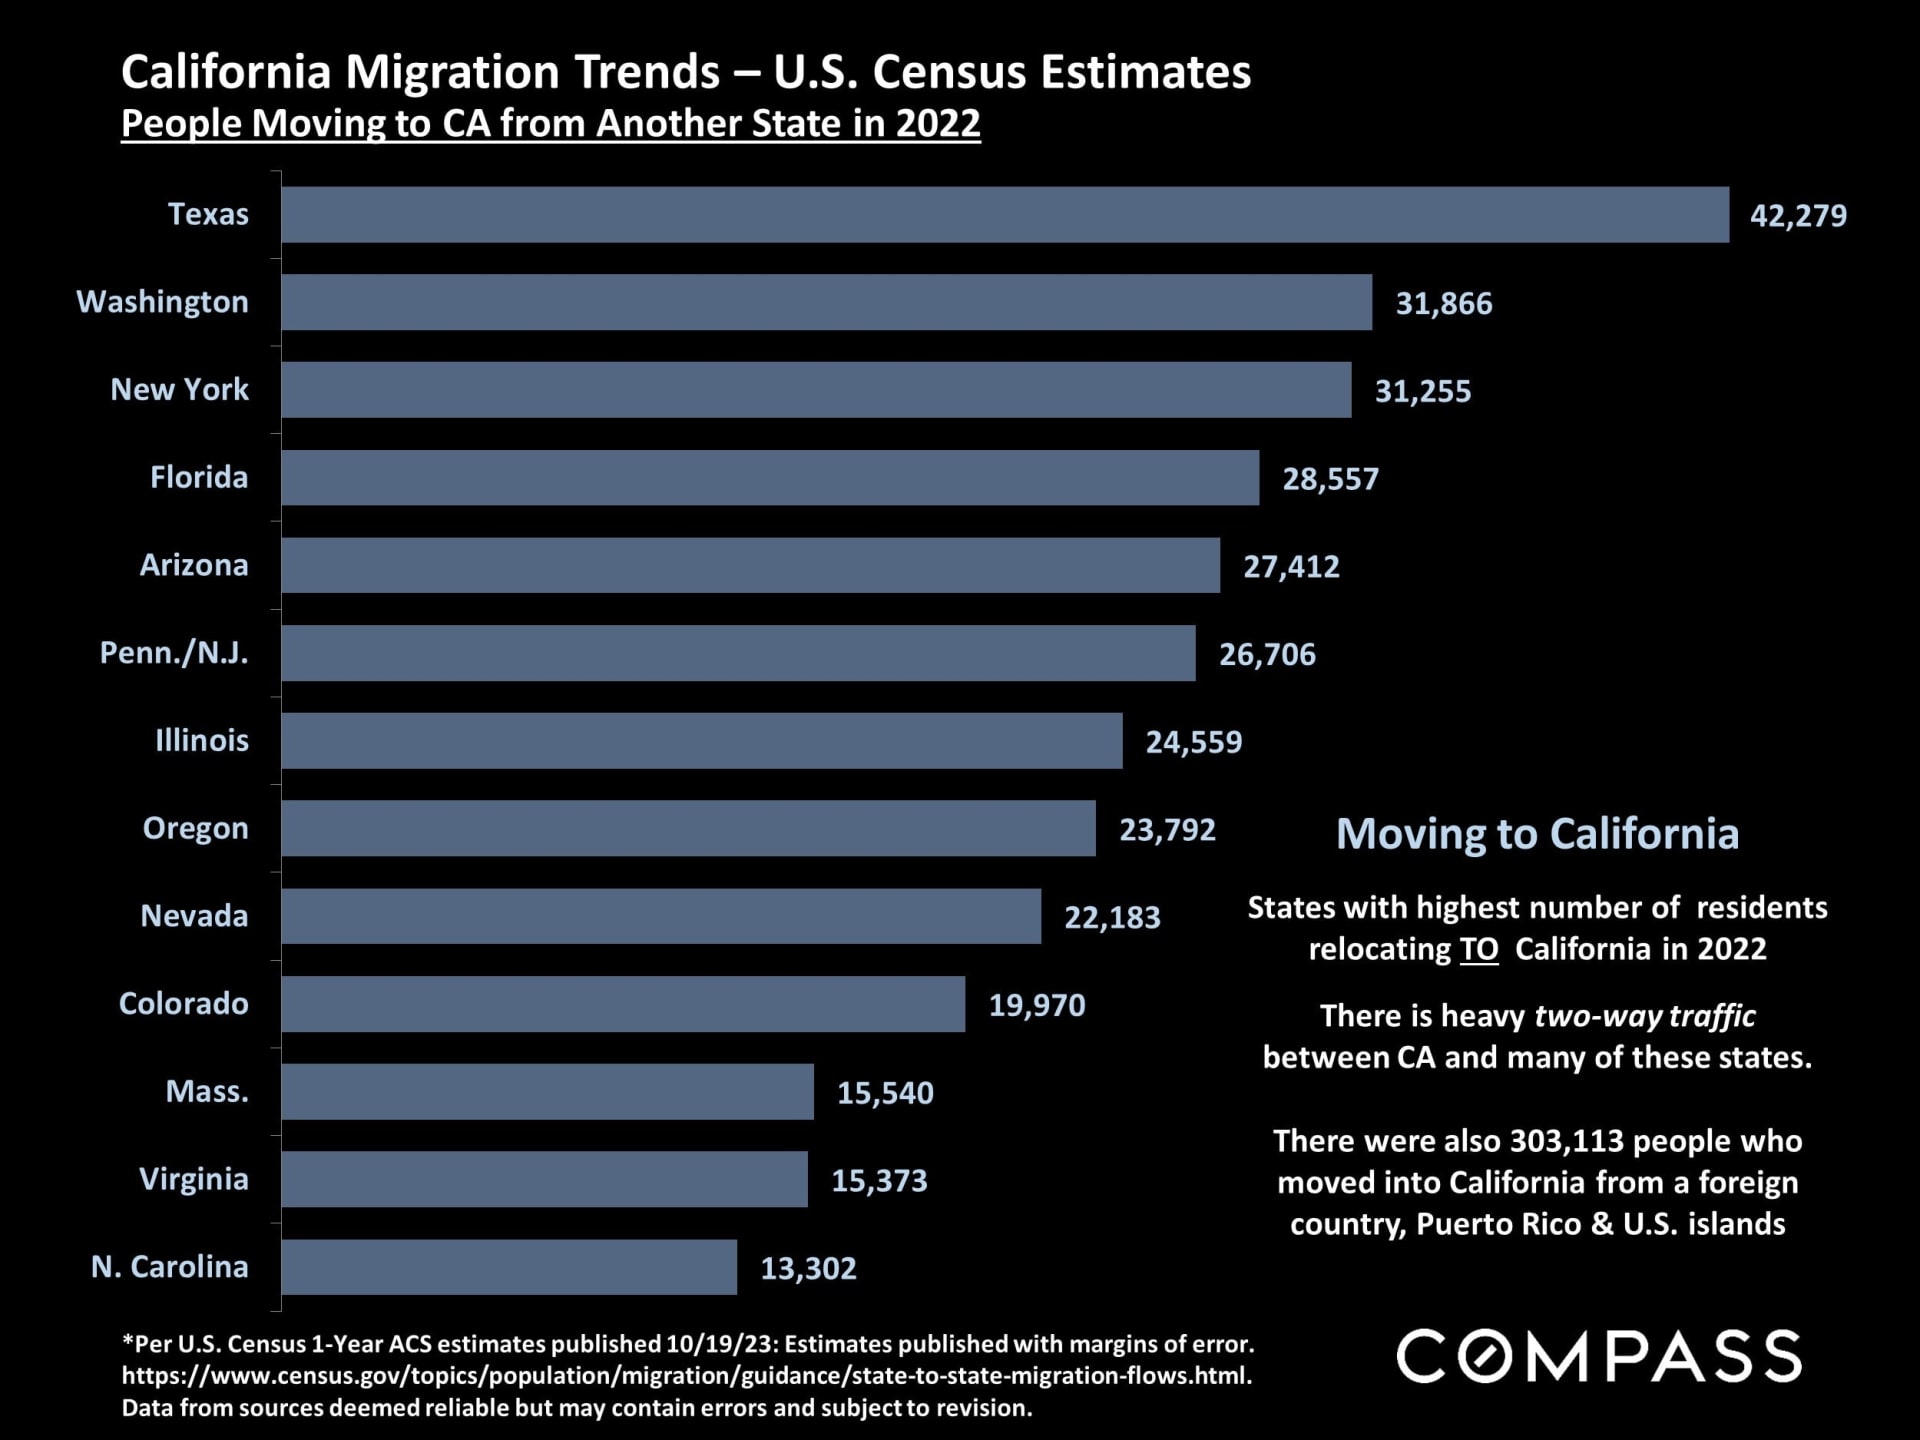
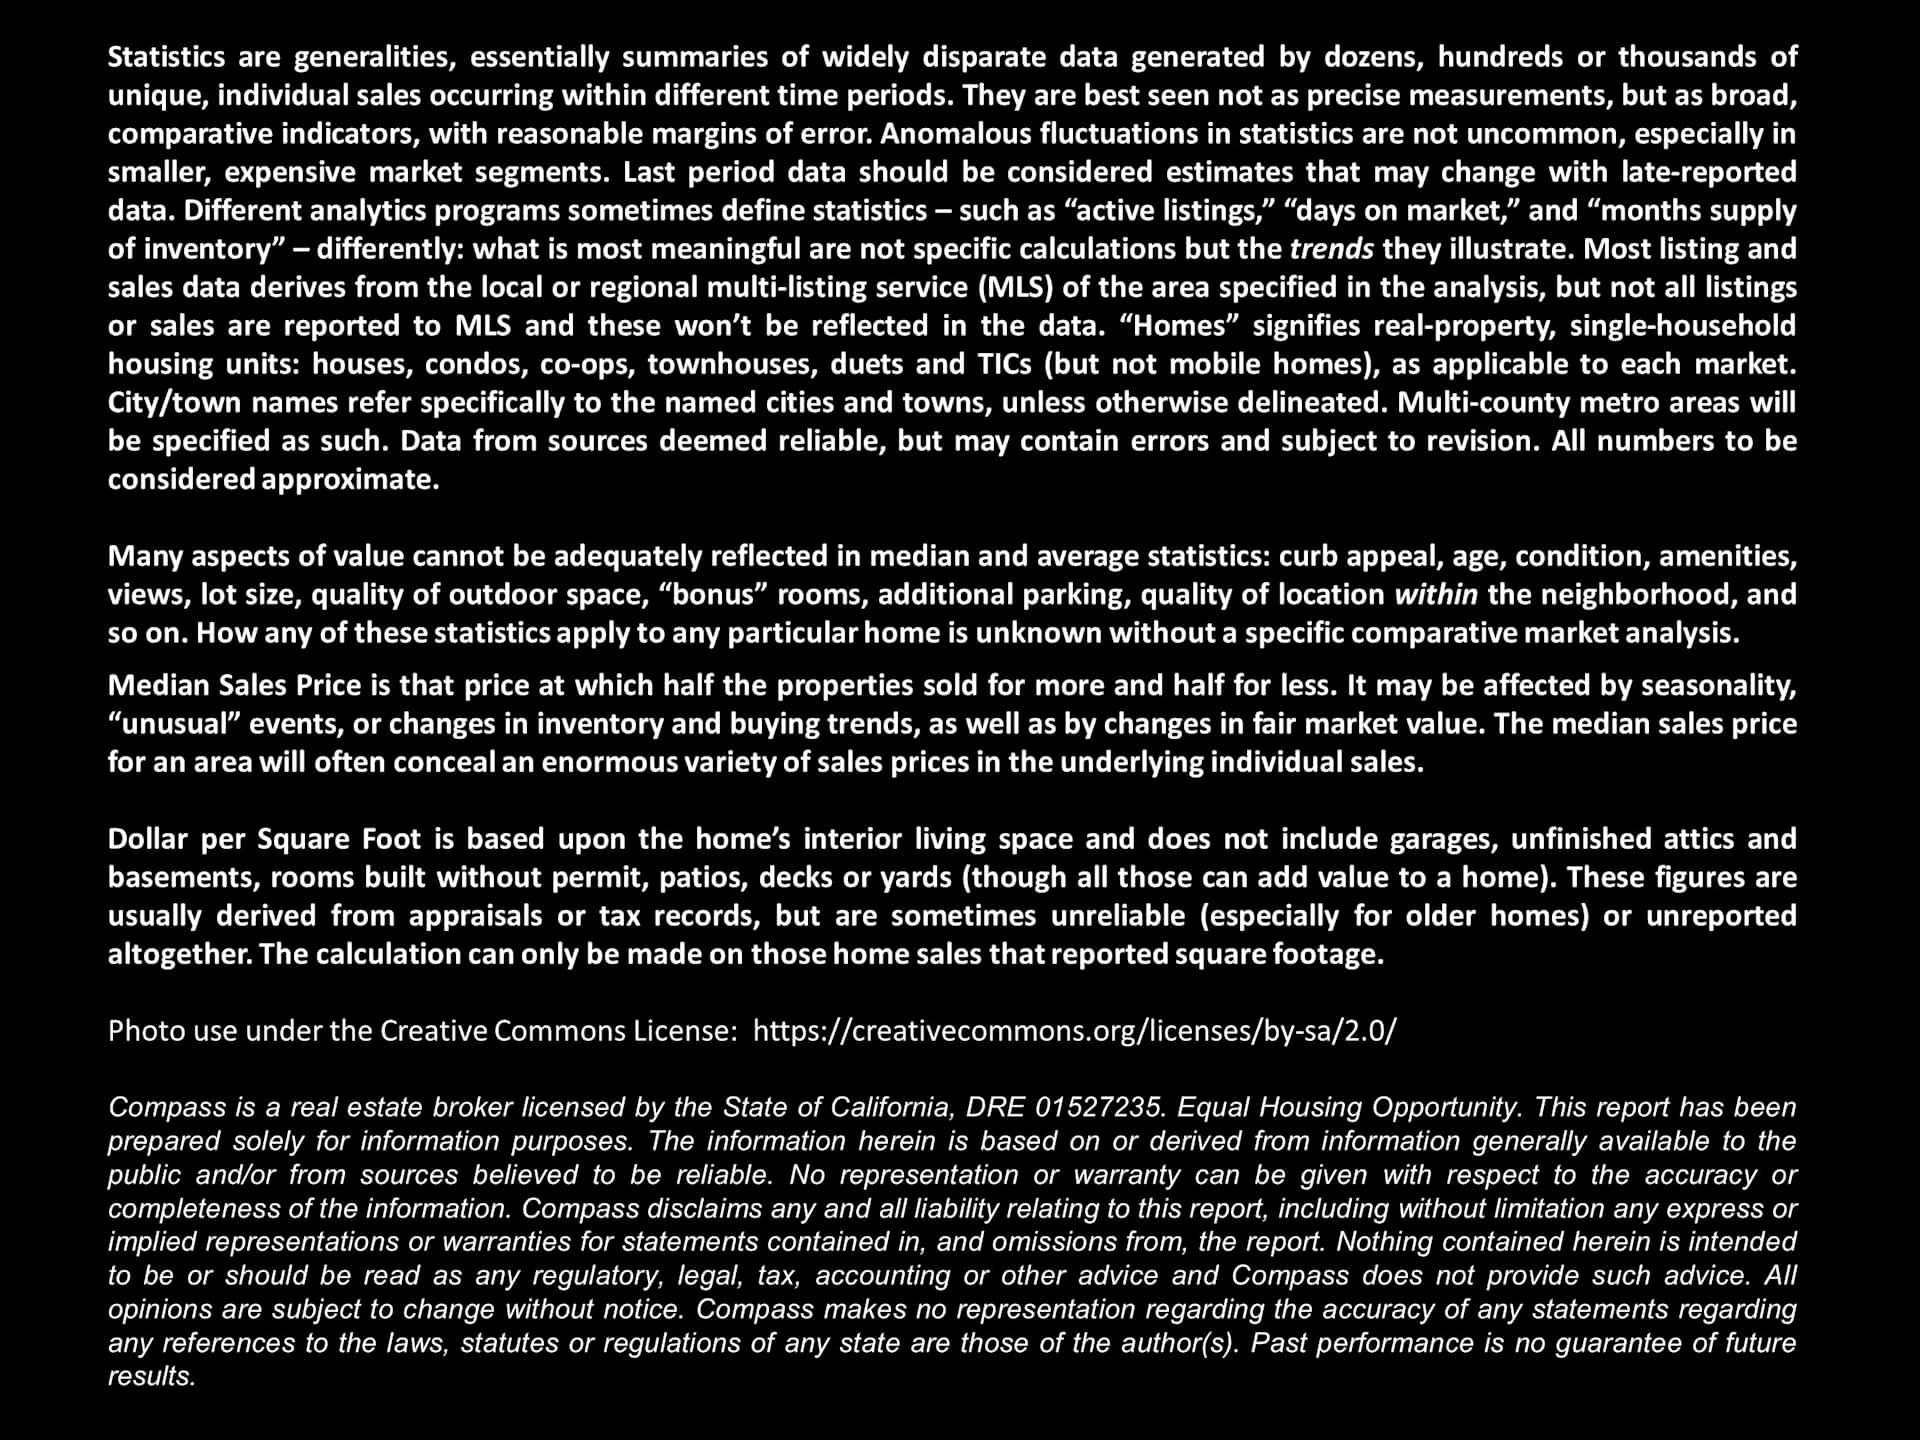
San Francisco real estate report on interest rates, seasonal market trends, and Bay Area housing data.Chart of San Francisco median house prices from 1990 to October 2023, peaking near $2 million in 2022.Chart of San Francisco condo median sale prices from 2005 to October 2023, with a year-over-year decline noted.Chart comparing San Francisco downtown and non-downtown median condo prices from 2005 through October 2023.San Francisco home sales breakdown by bedroom count, sales volume, median size, and prices.San Francisco neighborhood house and condo median sale prices, square footage, and price per square foot over six months.Quote graphic citing San Francisco’s resilience as a major technology and artificial intelligence hub.Chart of San Francisco new listings from December 2019 to October 2023, showing seasonal peaks and declines.Bar chart of monthly San Francisco home sales from 2019 through September 2023, with seasonal and pandemic annotations.San Francisco days-on-market chart comparing condos and houses from 2019 through October 2023.Chart of San Francisco home sales over list price, showing seasonal trends from 2018 through 2023.Chart comparing San Francisco house and condo sale prices to original list prices from 2019 through October 2023.Chart of San Francisco active and coming-soon listings, February 2022–November 2023; November 2023 shows 1,429.Chart comparing San Francisco condo, co-op, TIC, and house listings across nine price segments.Chart of San Francisco active listings from 2019–2023, with October comparisons and a pandemic-era supply spike.Bar chart of San Francisco listings pending sale, peaking in 2021 and declining to October 2023.Bar chart of San Francisco $3 million-plus and $5 million-plus home sales, January 2019–October 2023.Chart of San Francisco active-listing price reductions from 2018 to 2023, with October peaks highlighted.San Francisco chart of listings taken off market without selling, with monthly bars peaking in December 2022.Chart of U.S. all-cash homebuyer percentages from 2015 to September 2023, with a 29% peak in September 2023.Infographic ranking states receiving California residents in 2022, with migration estimates and a summary of population movement.Infographic of 2022 migration to California, with Texas leading at 42,279 people, followed by Washington and New York.Real estate report notes on statistics, median sales prices, square-foot pricing, licensing, and legal disclaimers.

Work With Us

We will help you understand the complex aspects of the transaction and share our expertise so that you can make the best decisions possible. We are experienced, market savvy, and energetic. With both of us working for our clients, you get twice the amount of attention and insight.