
The SF Team, Eva + James, Compass

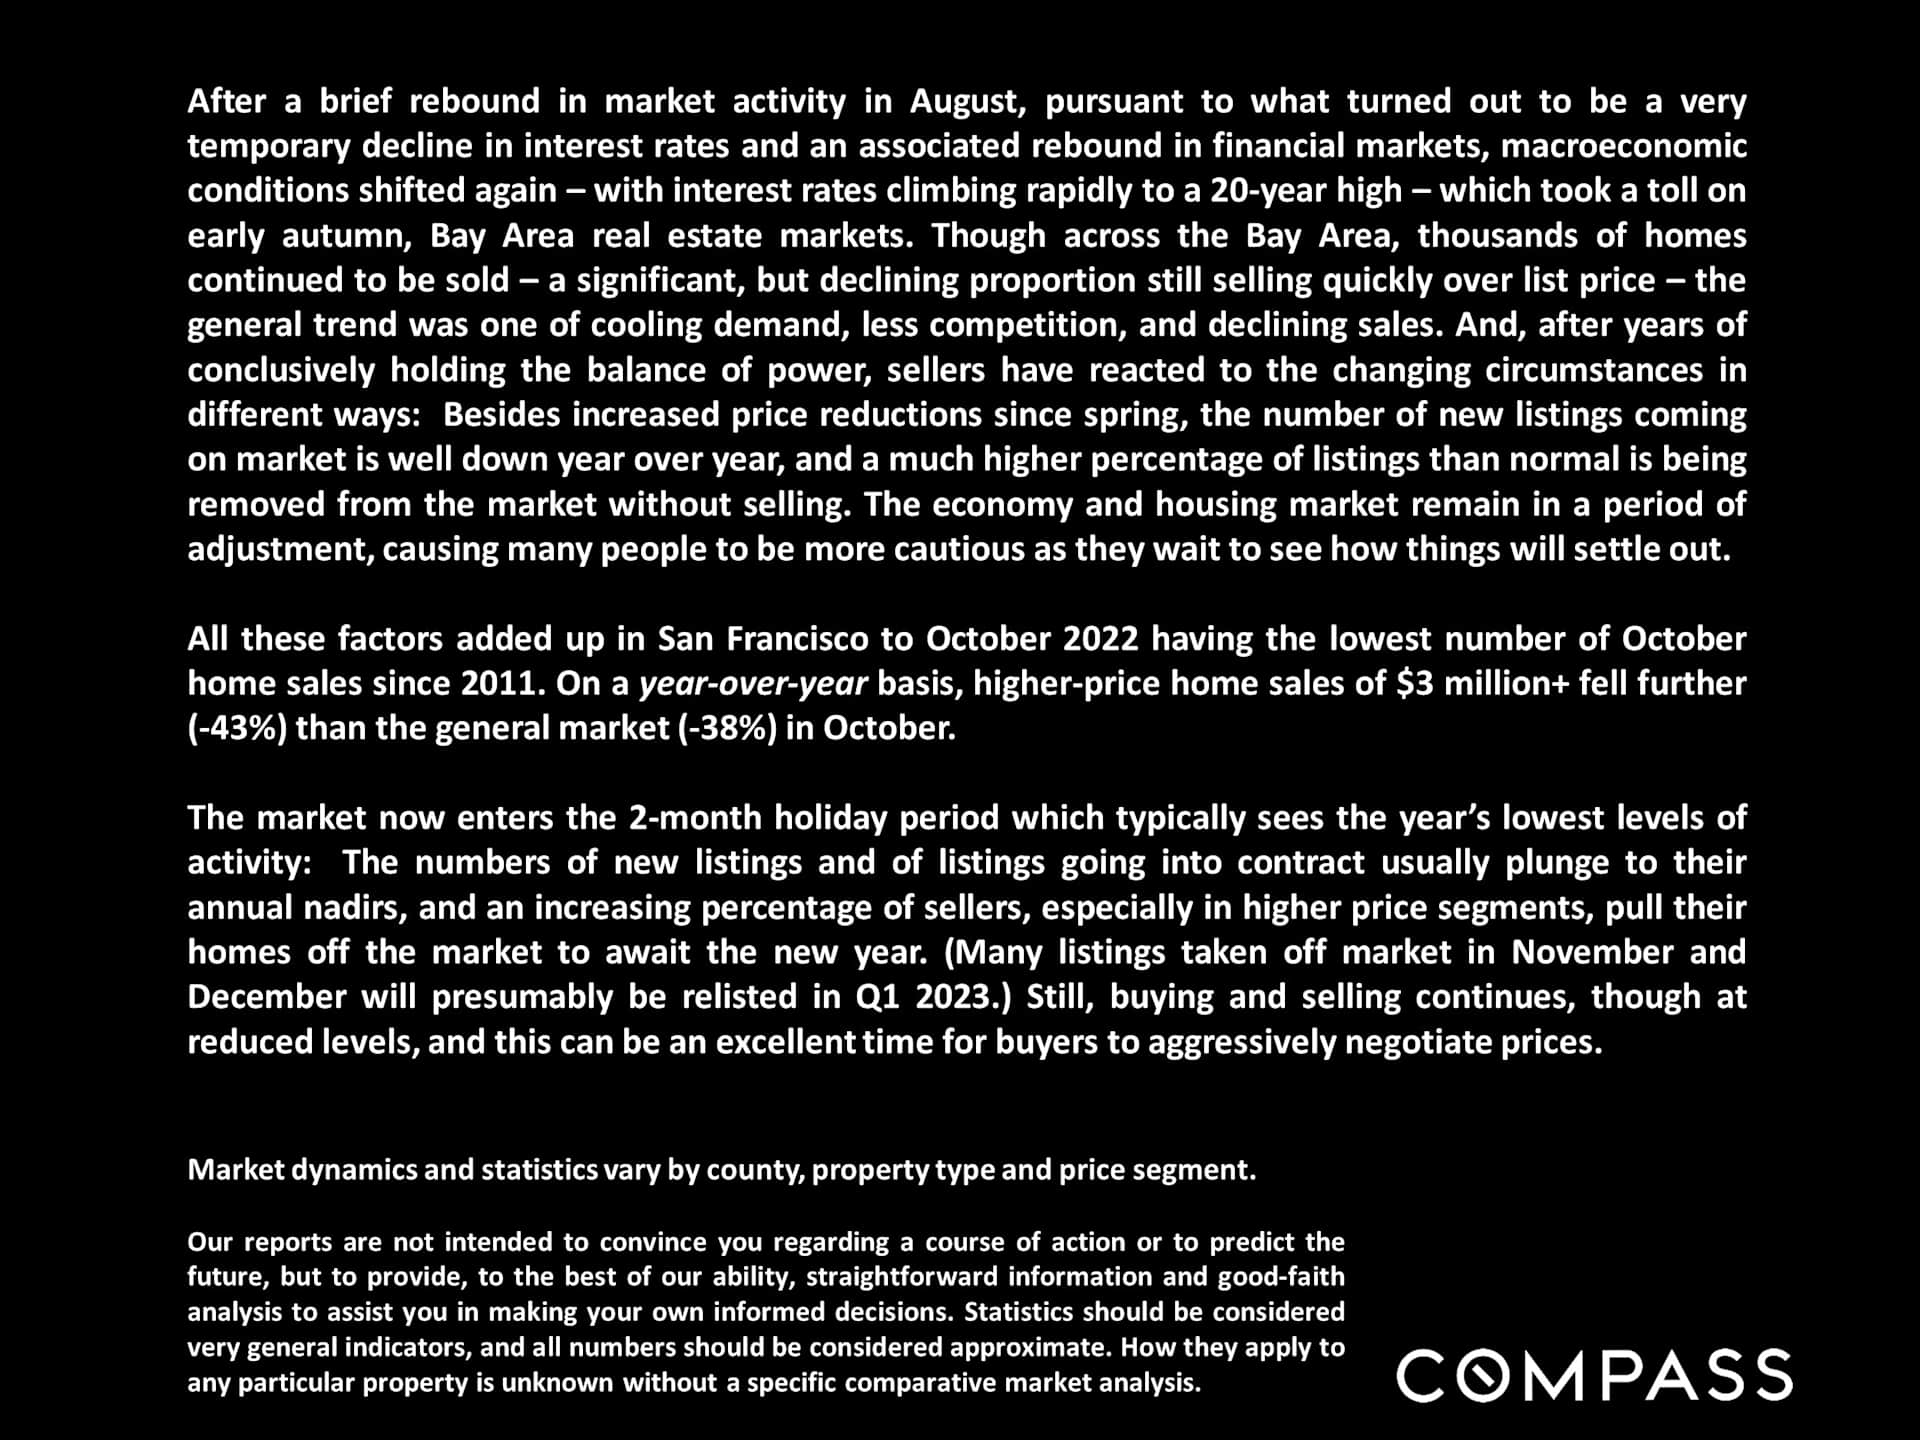
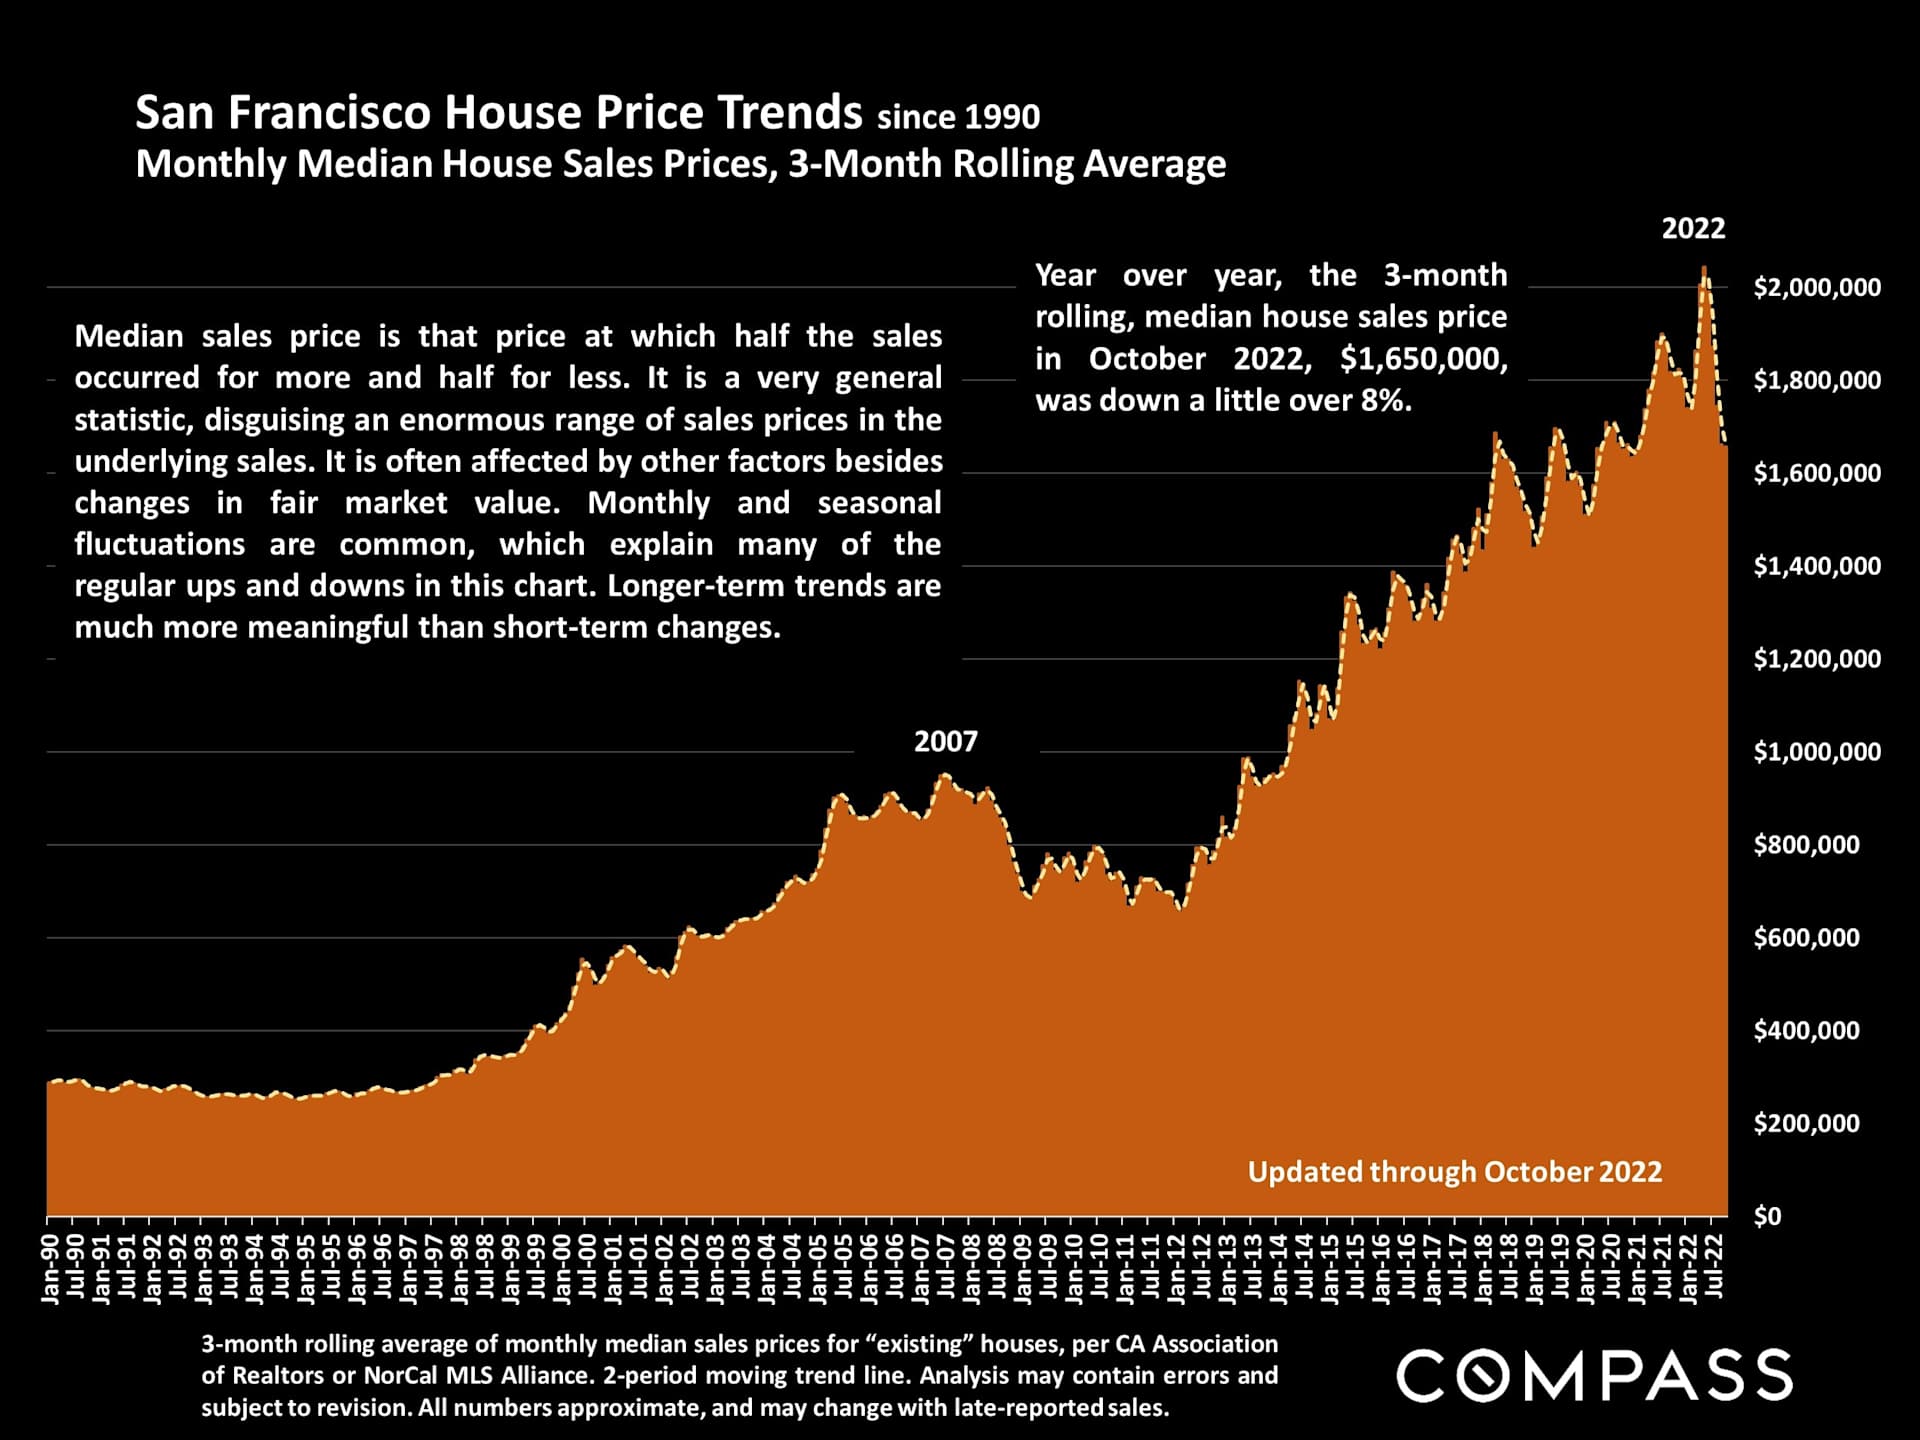
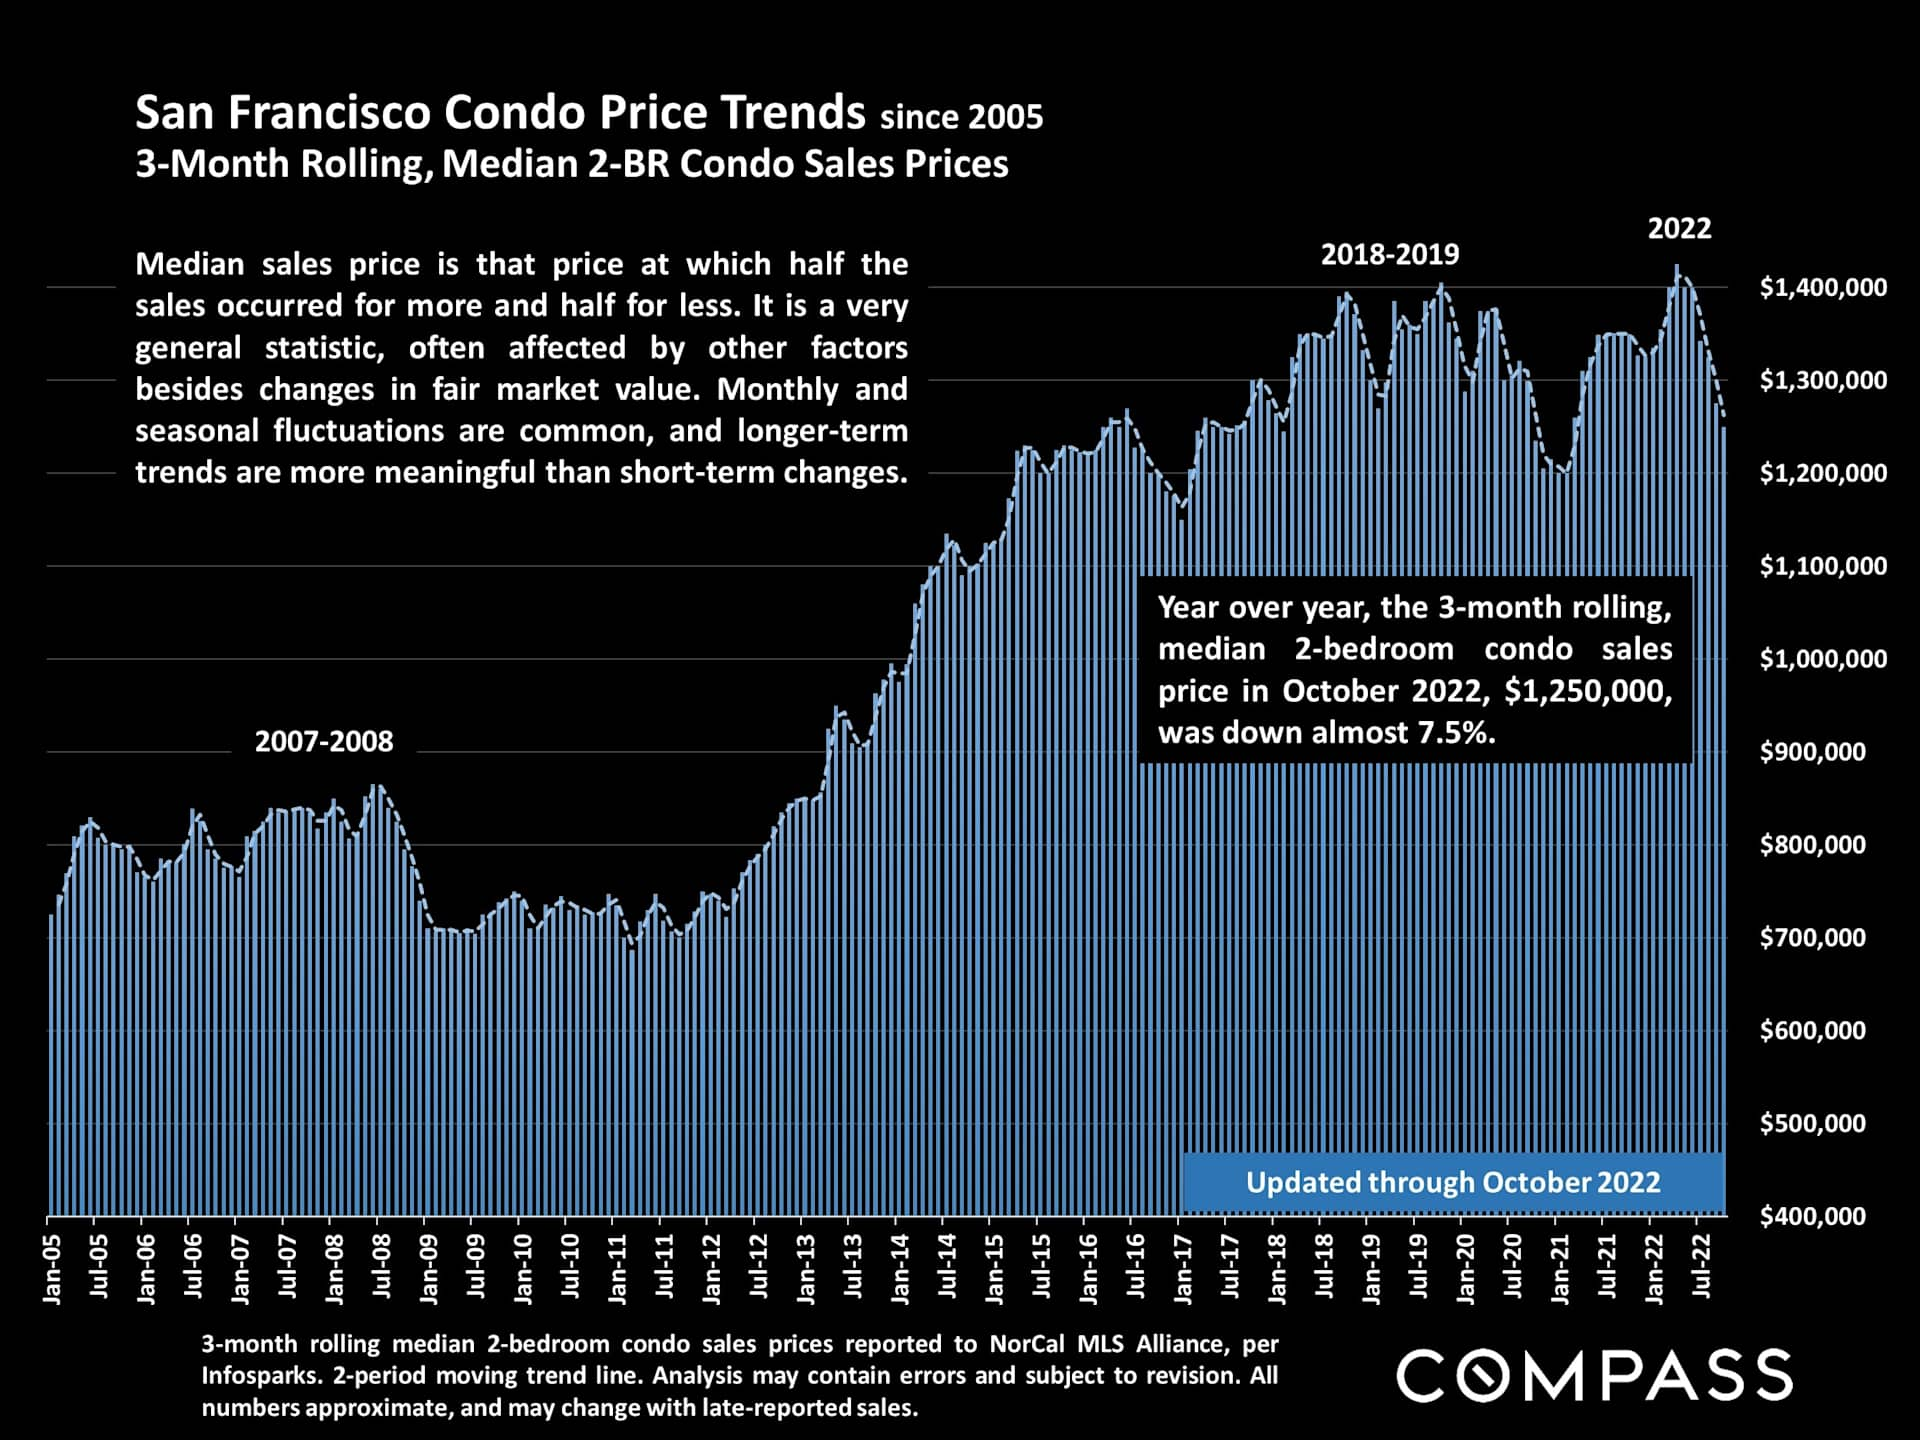
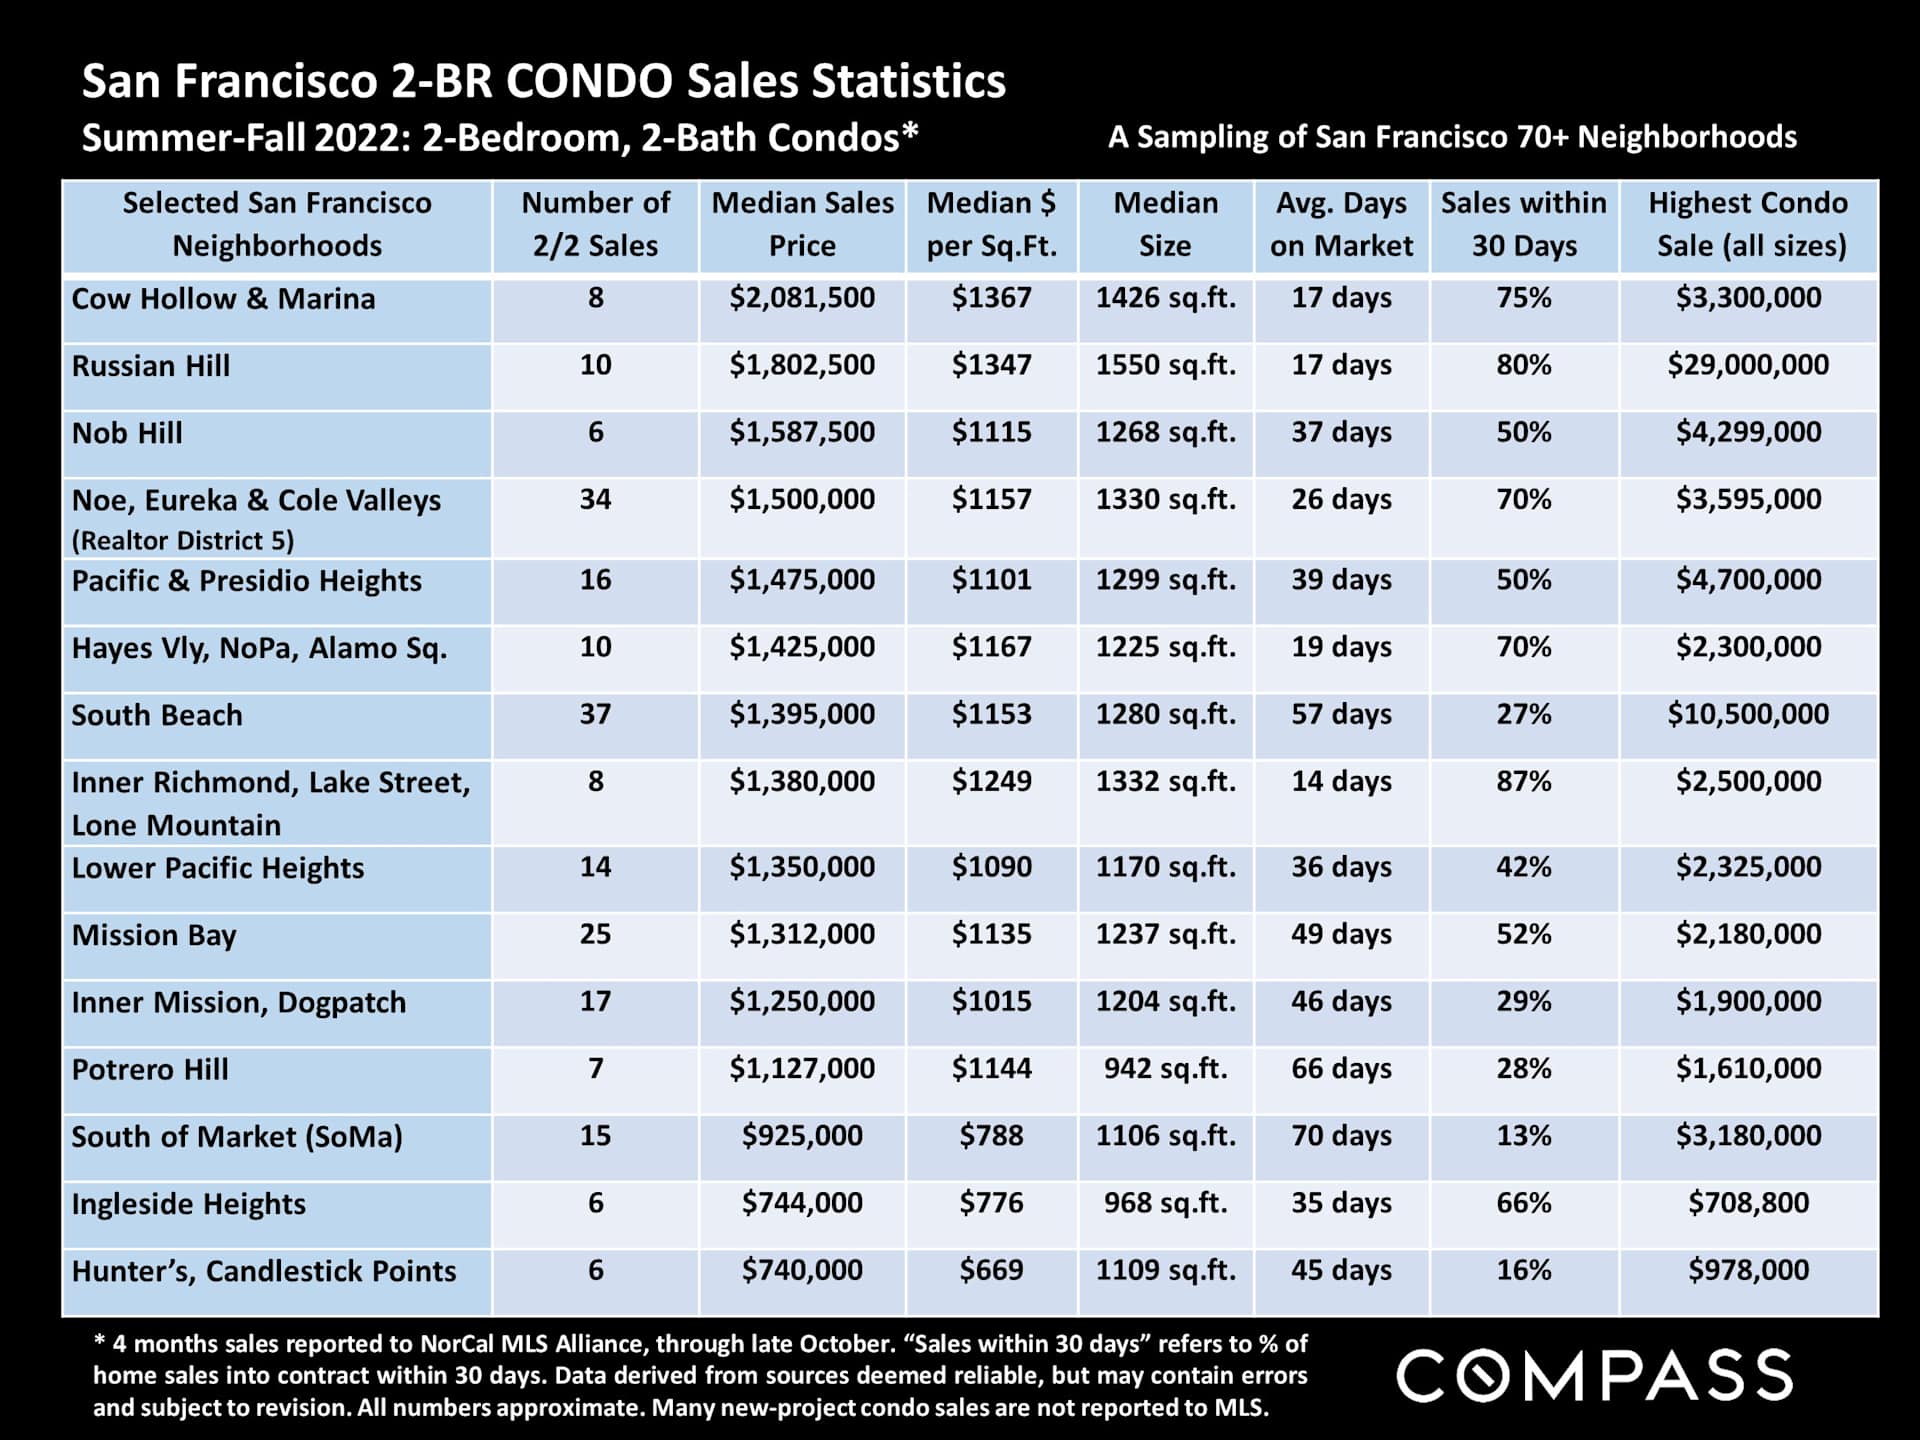
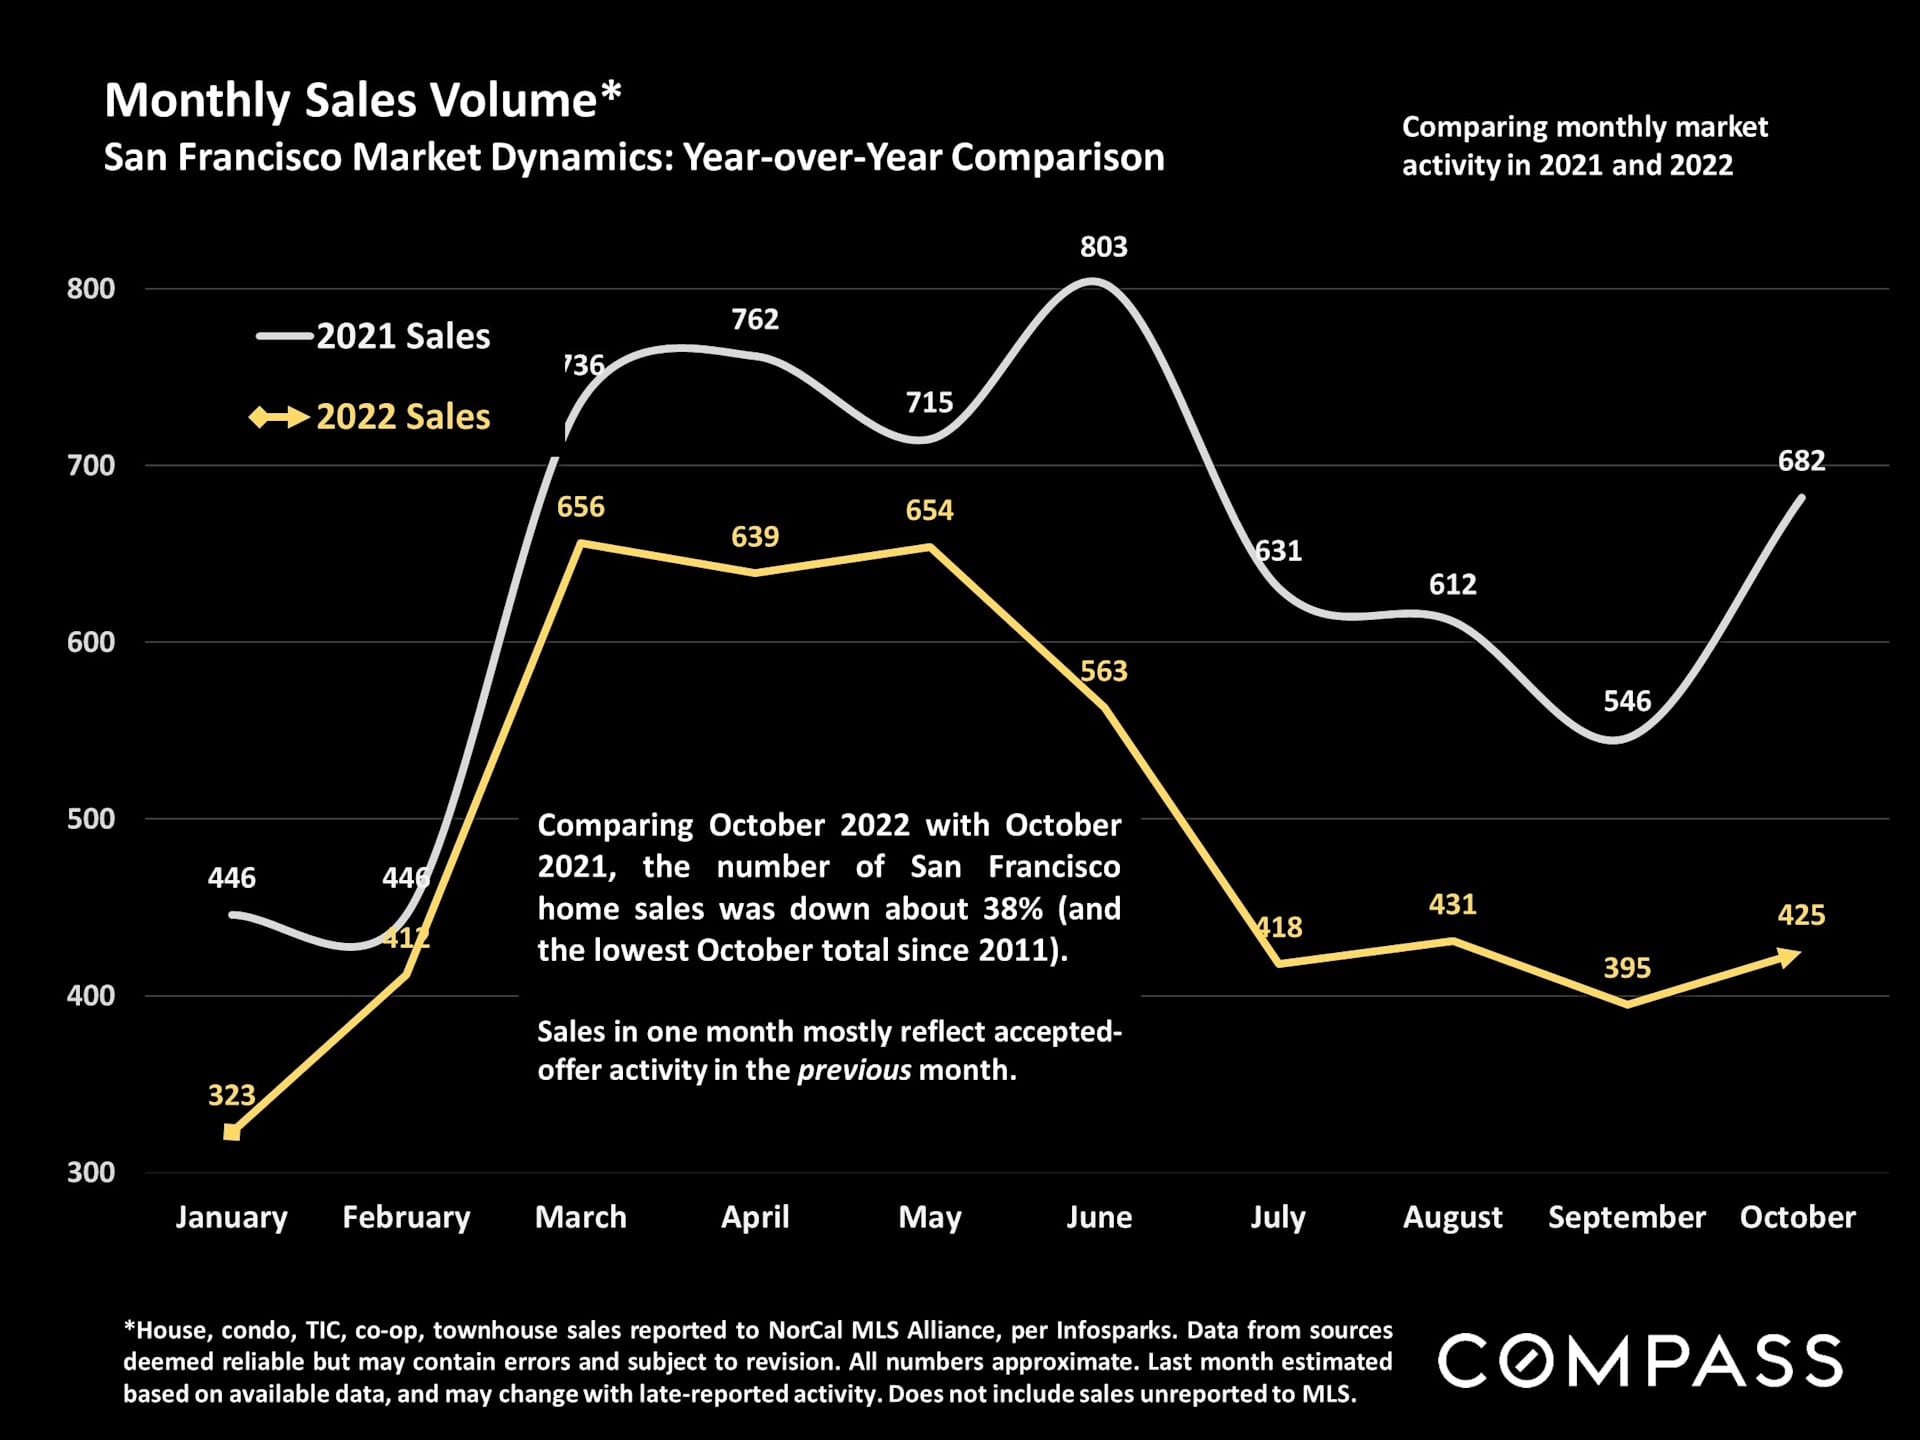
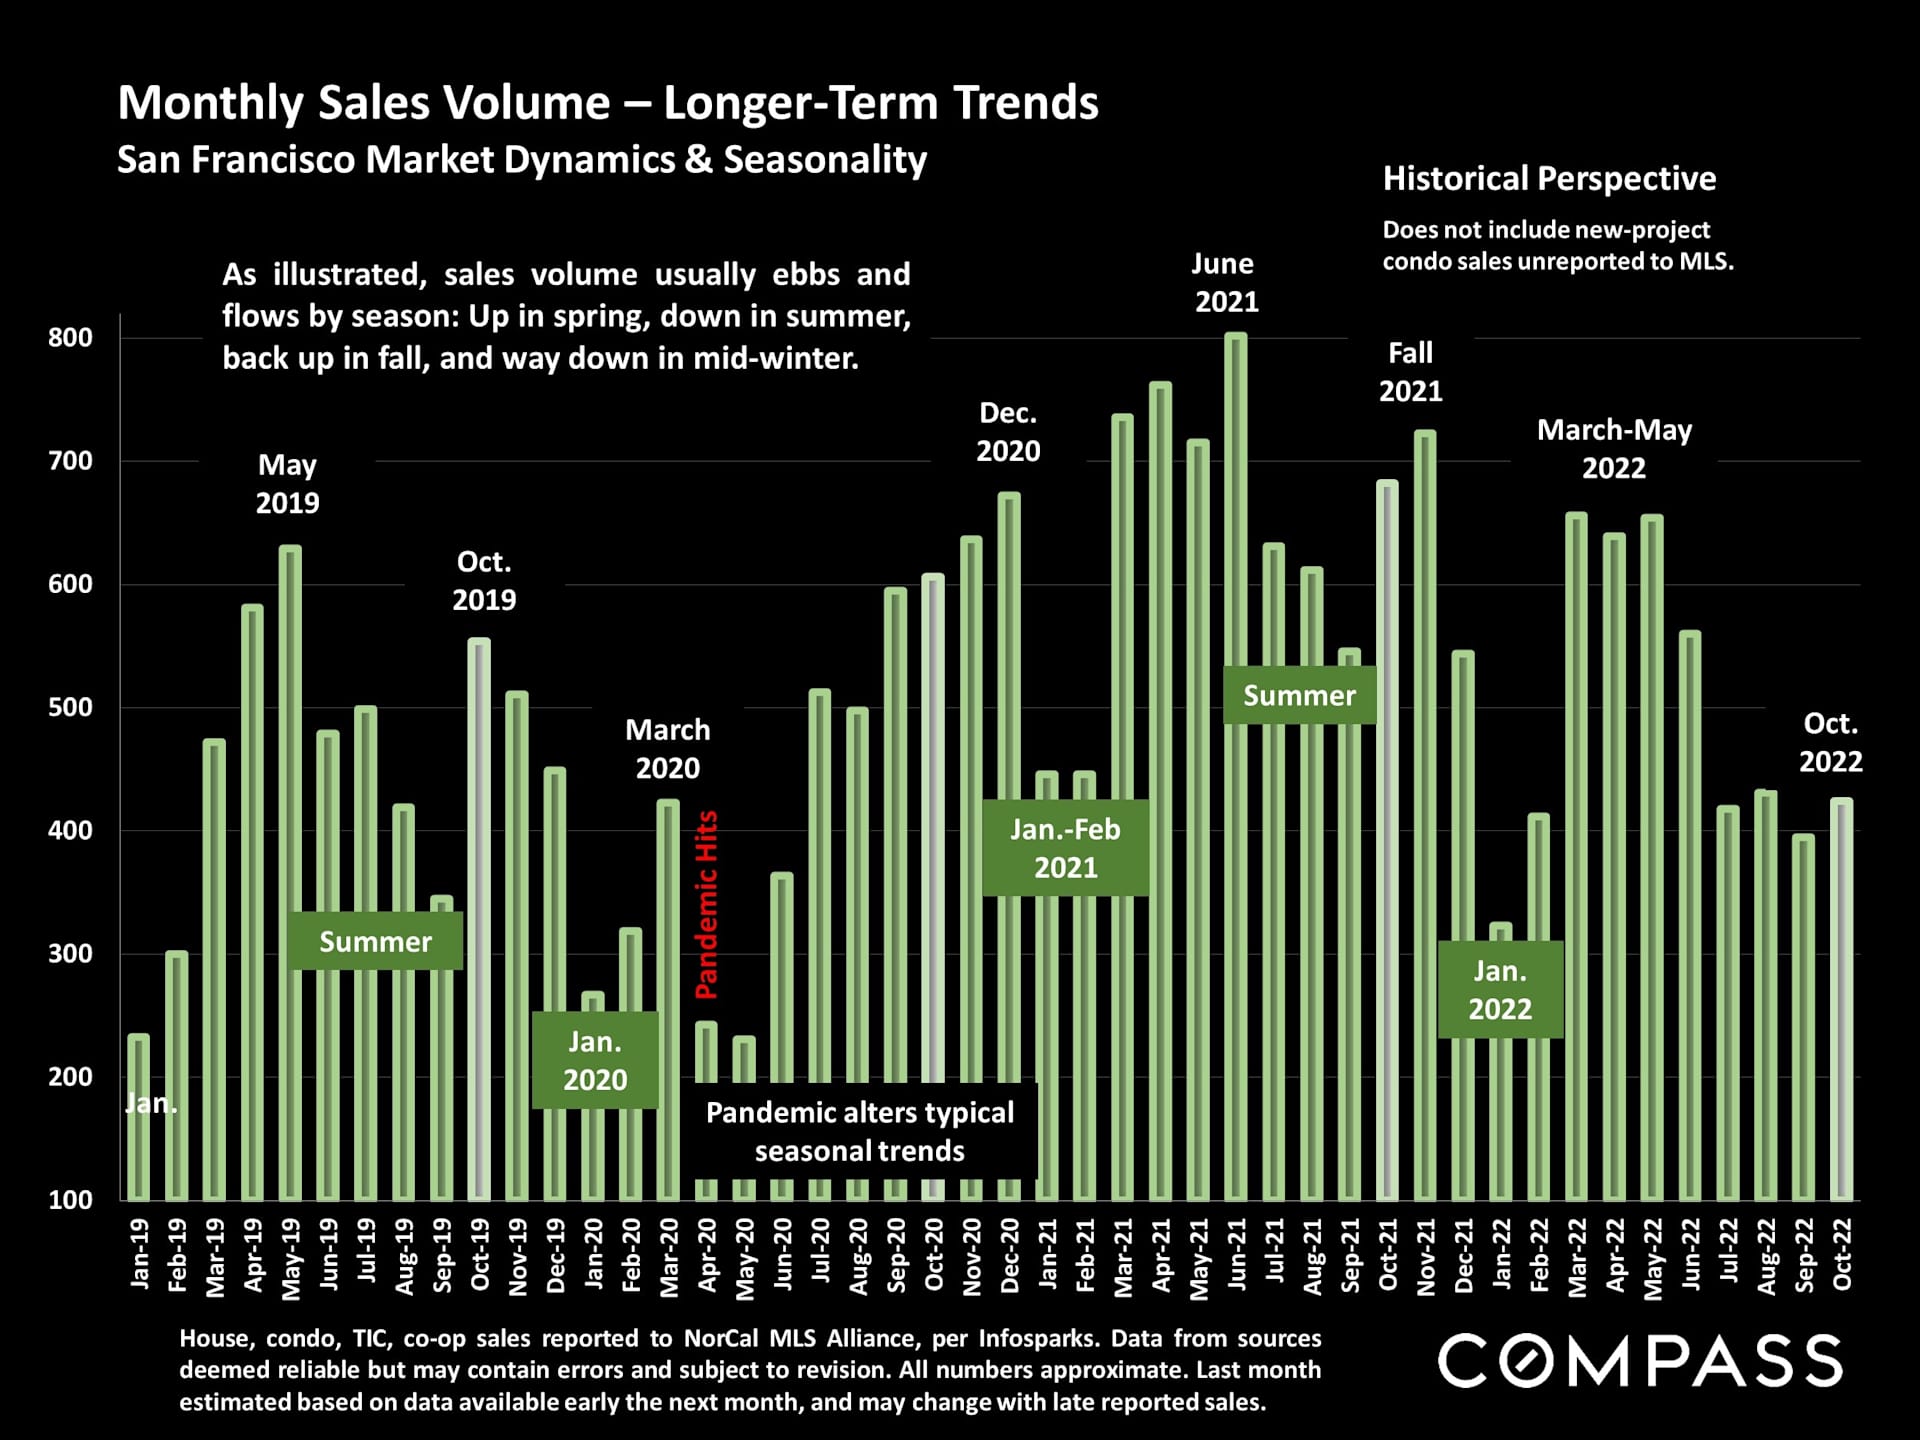
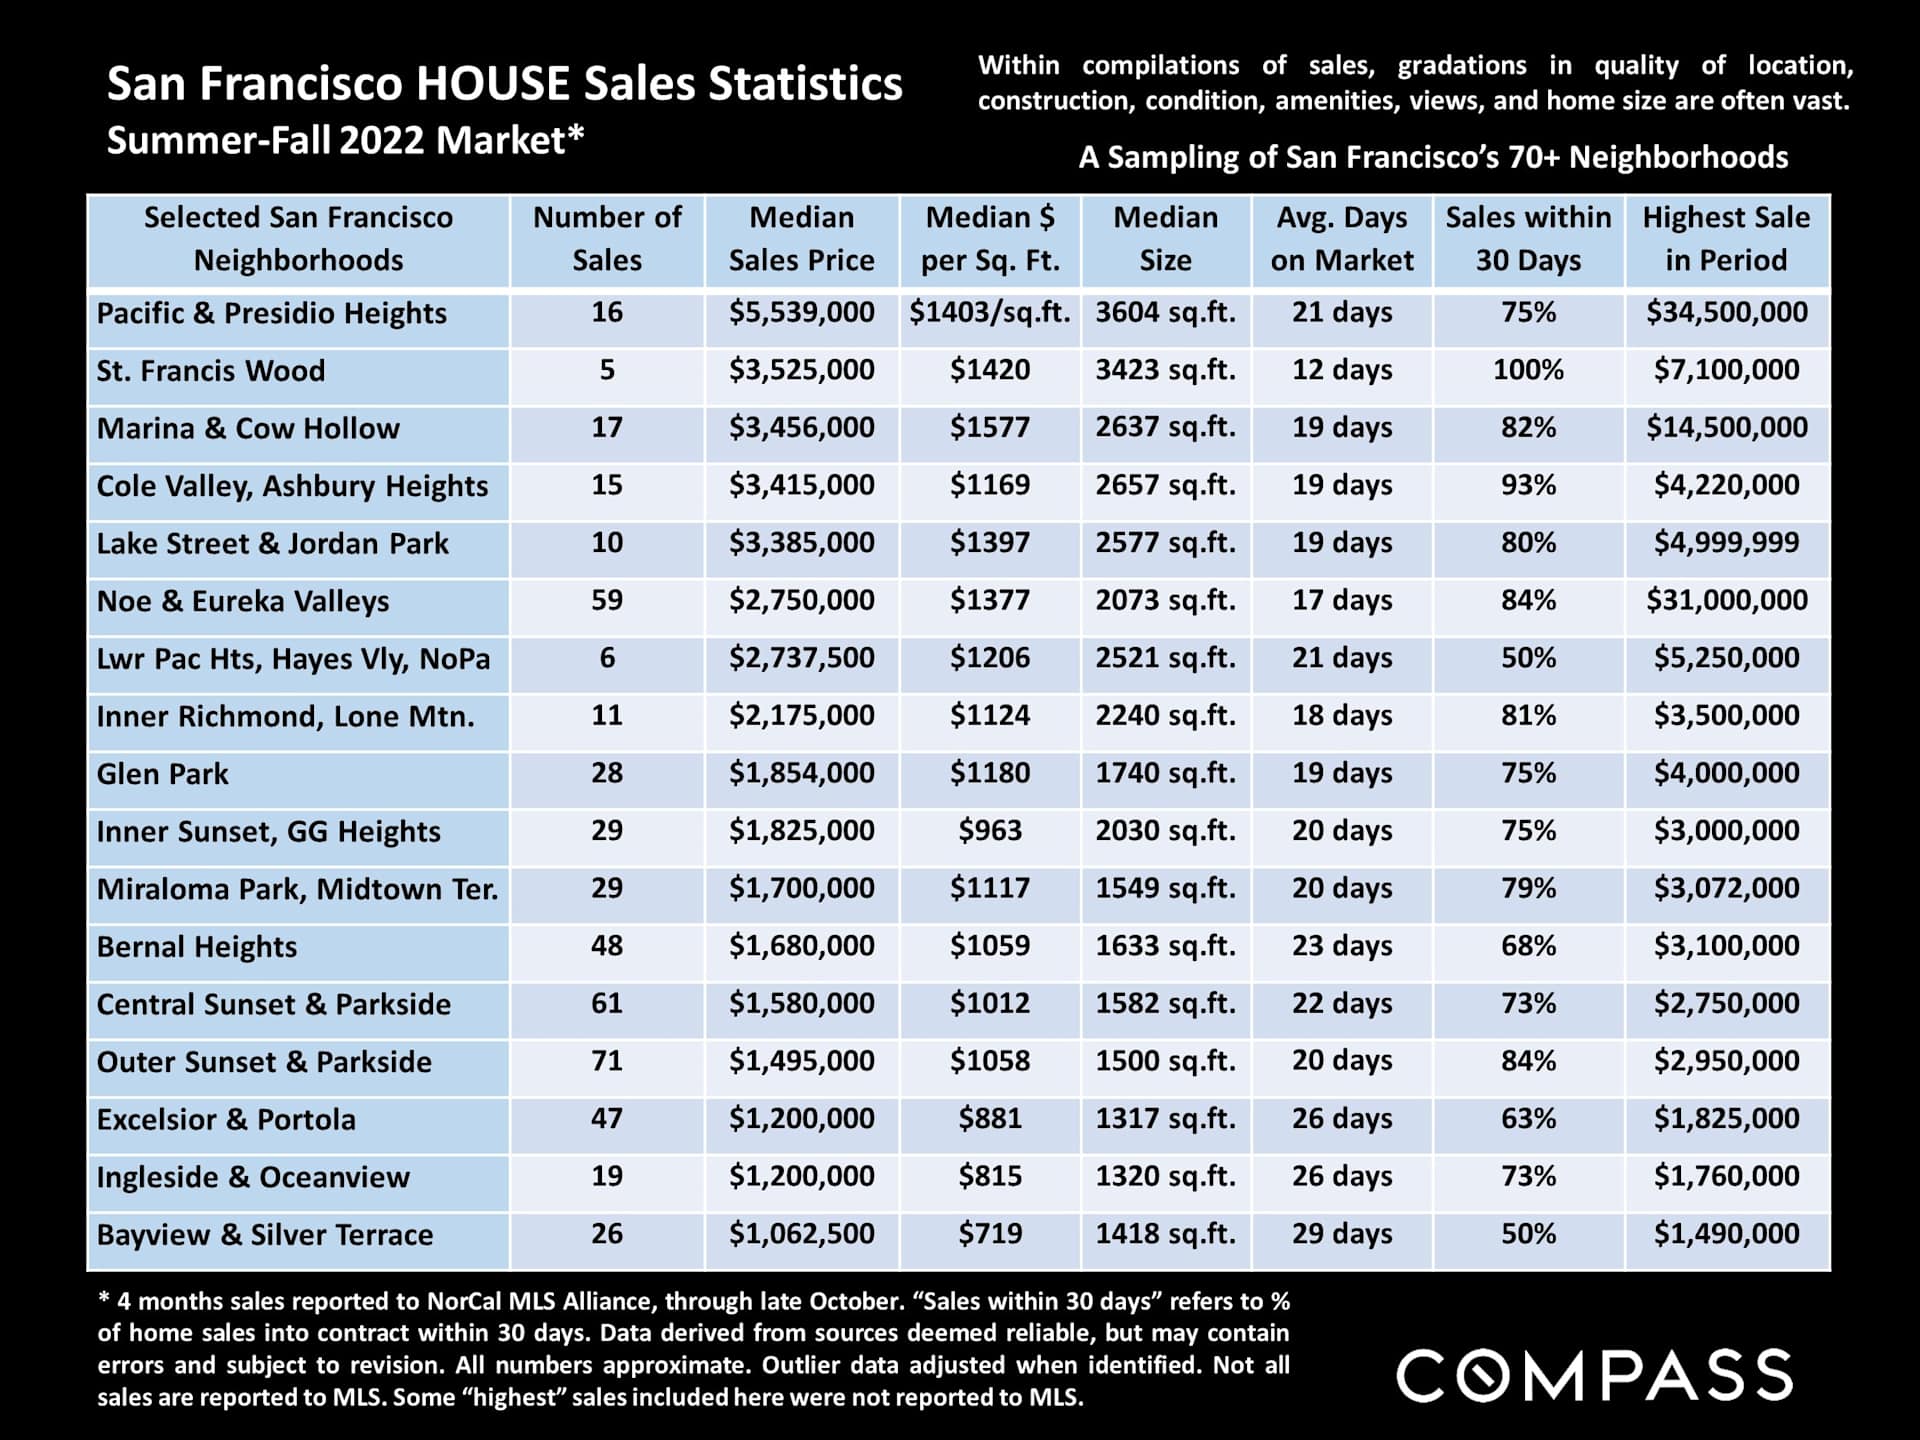
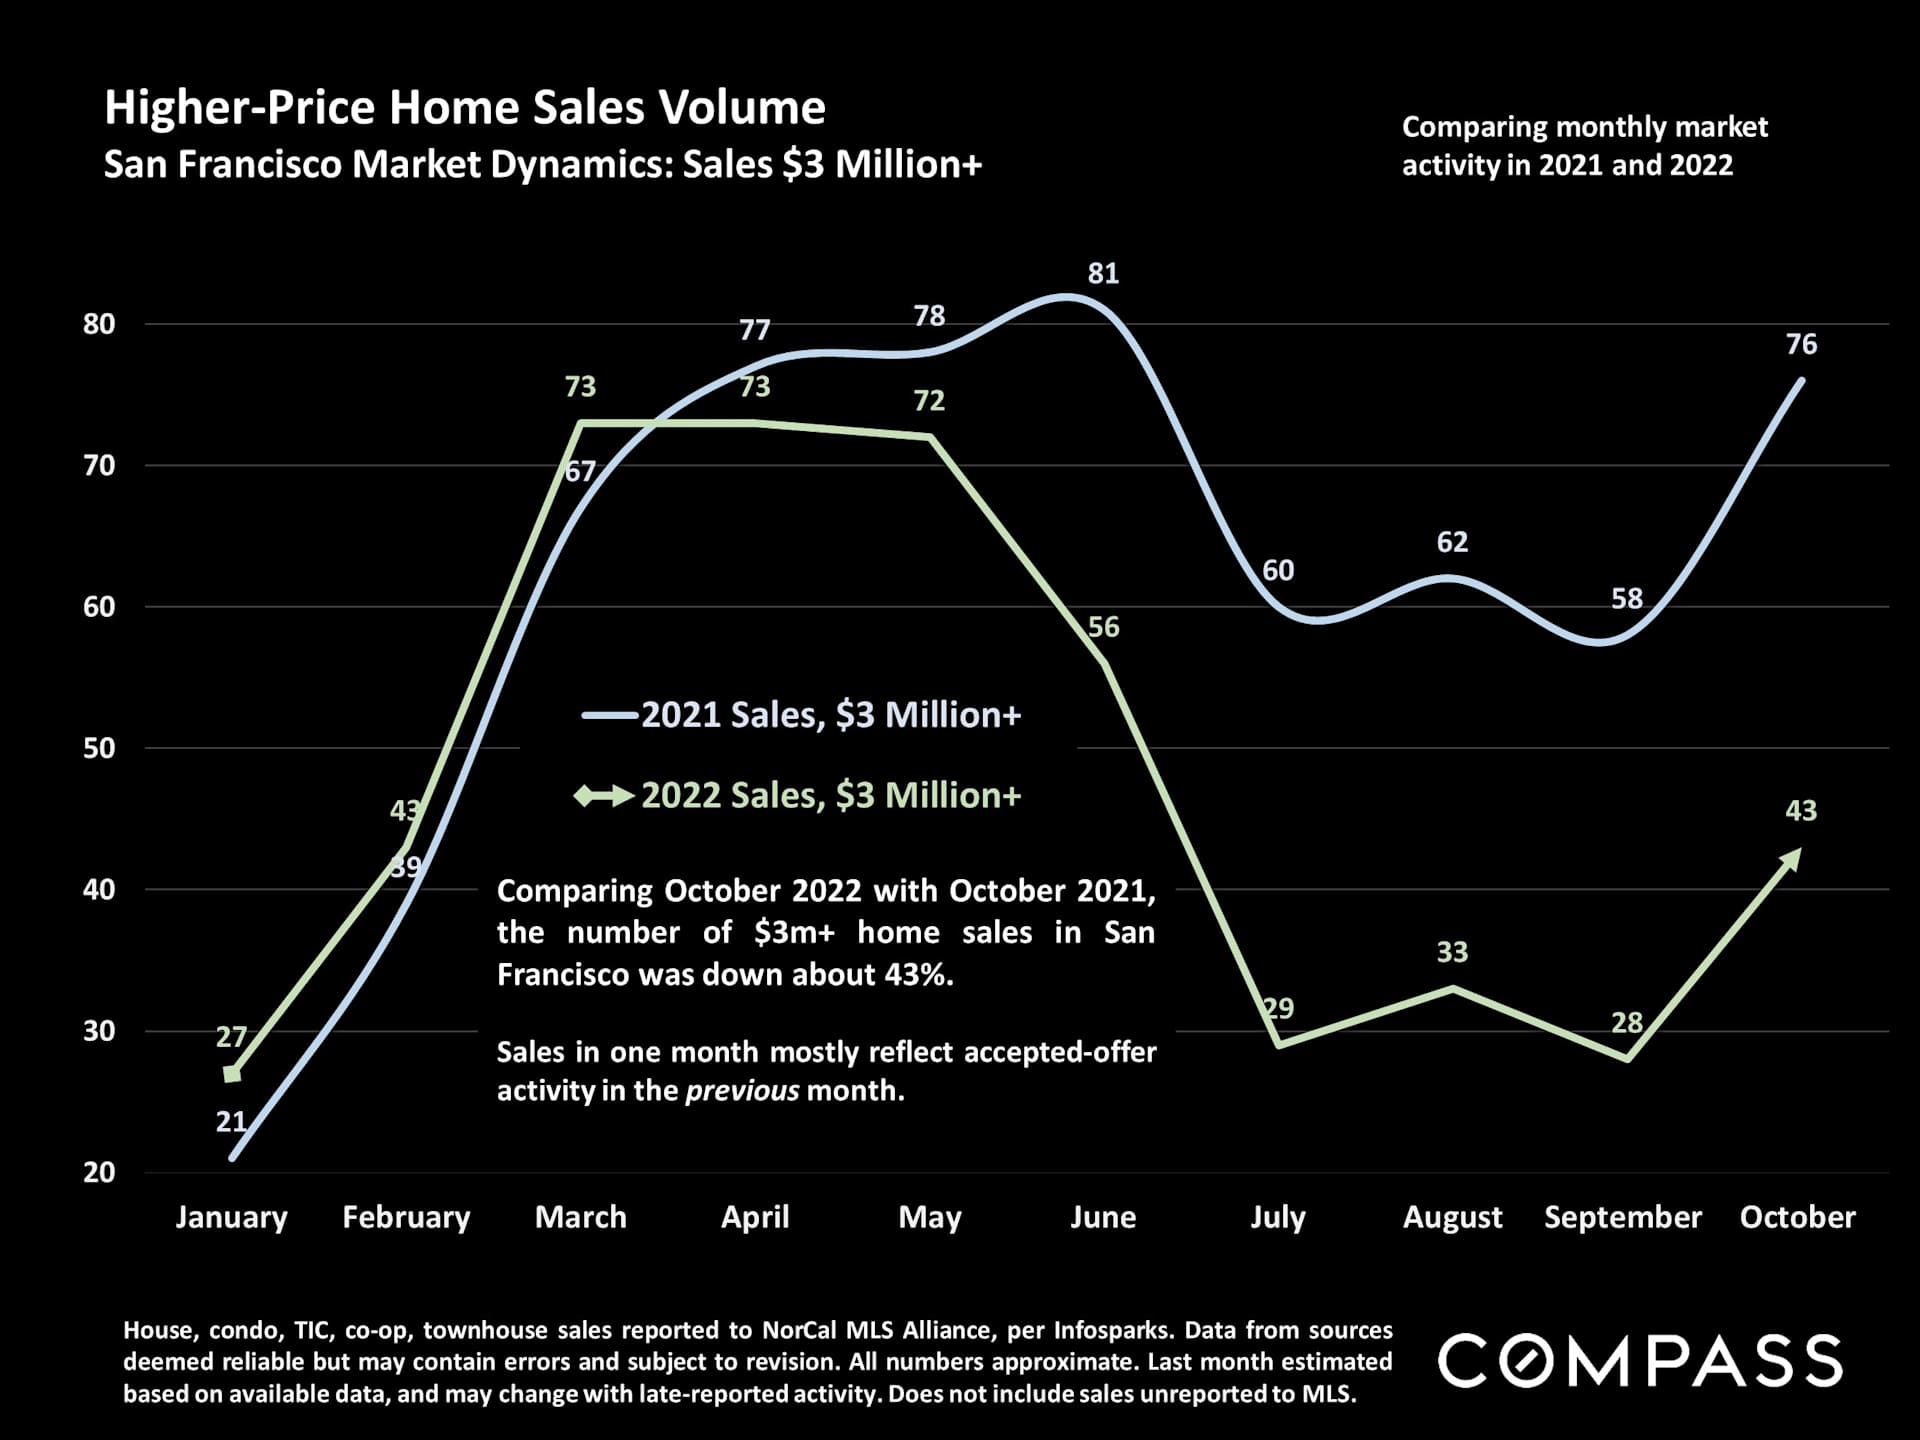
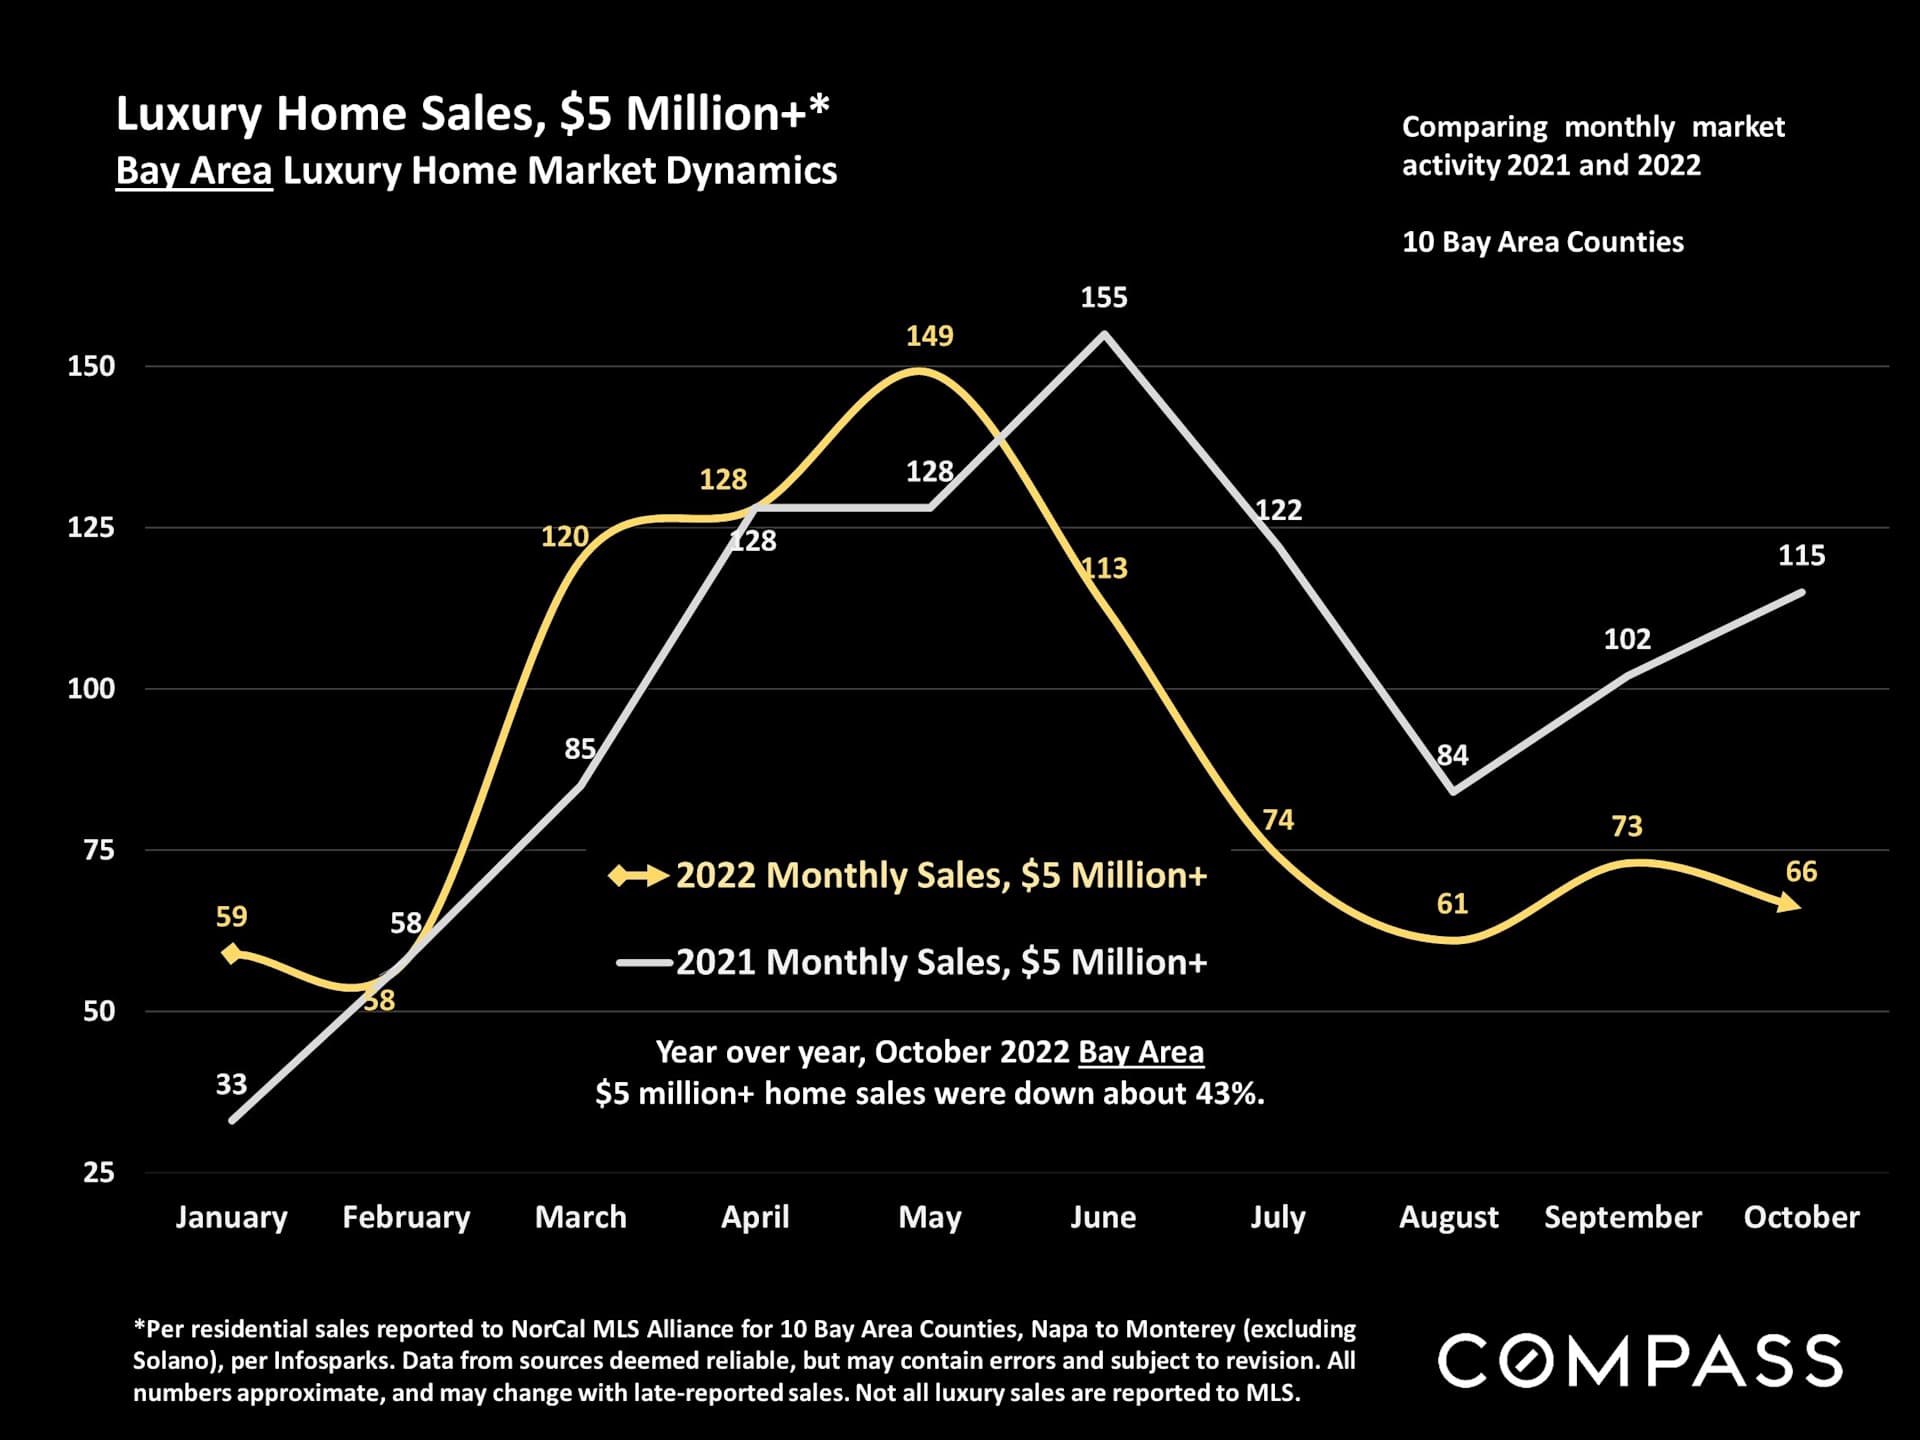
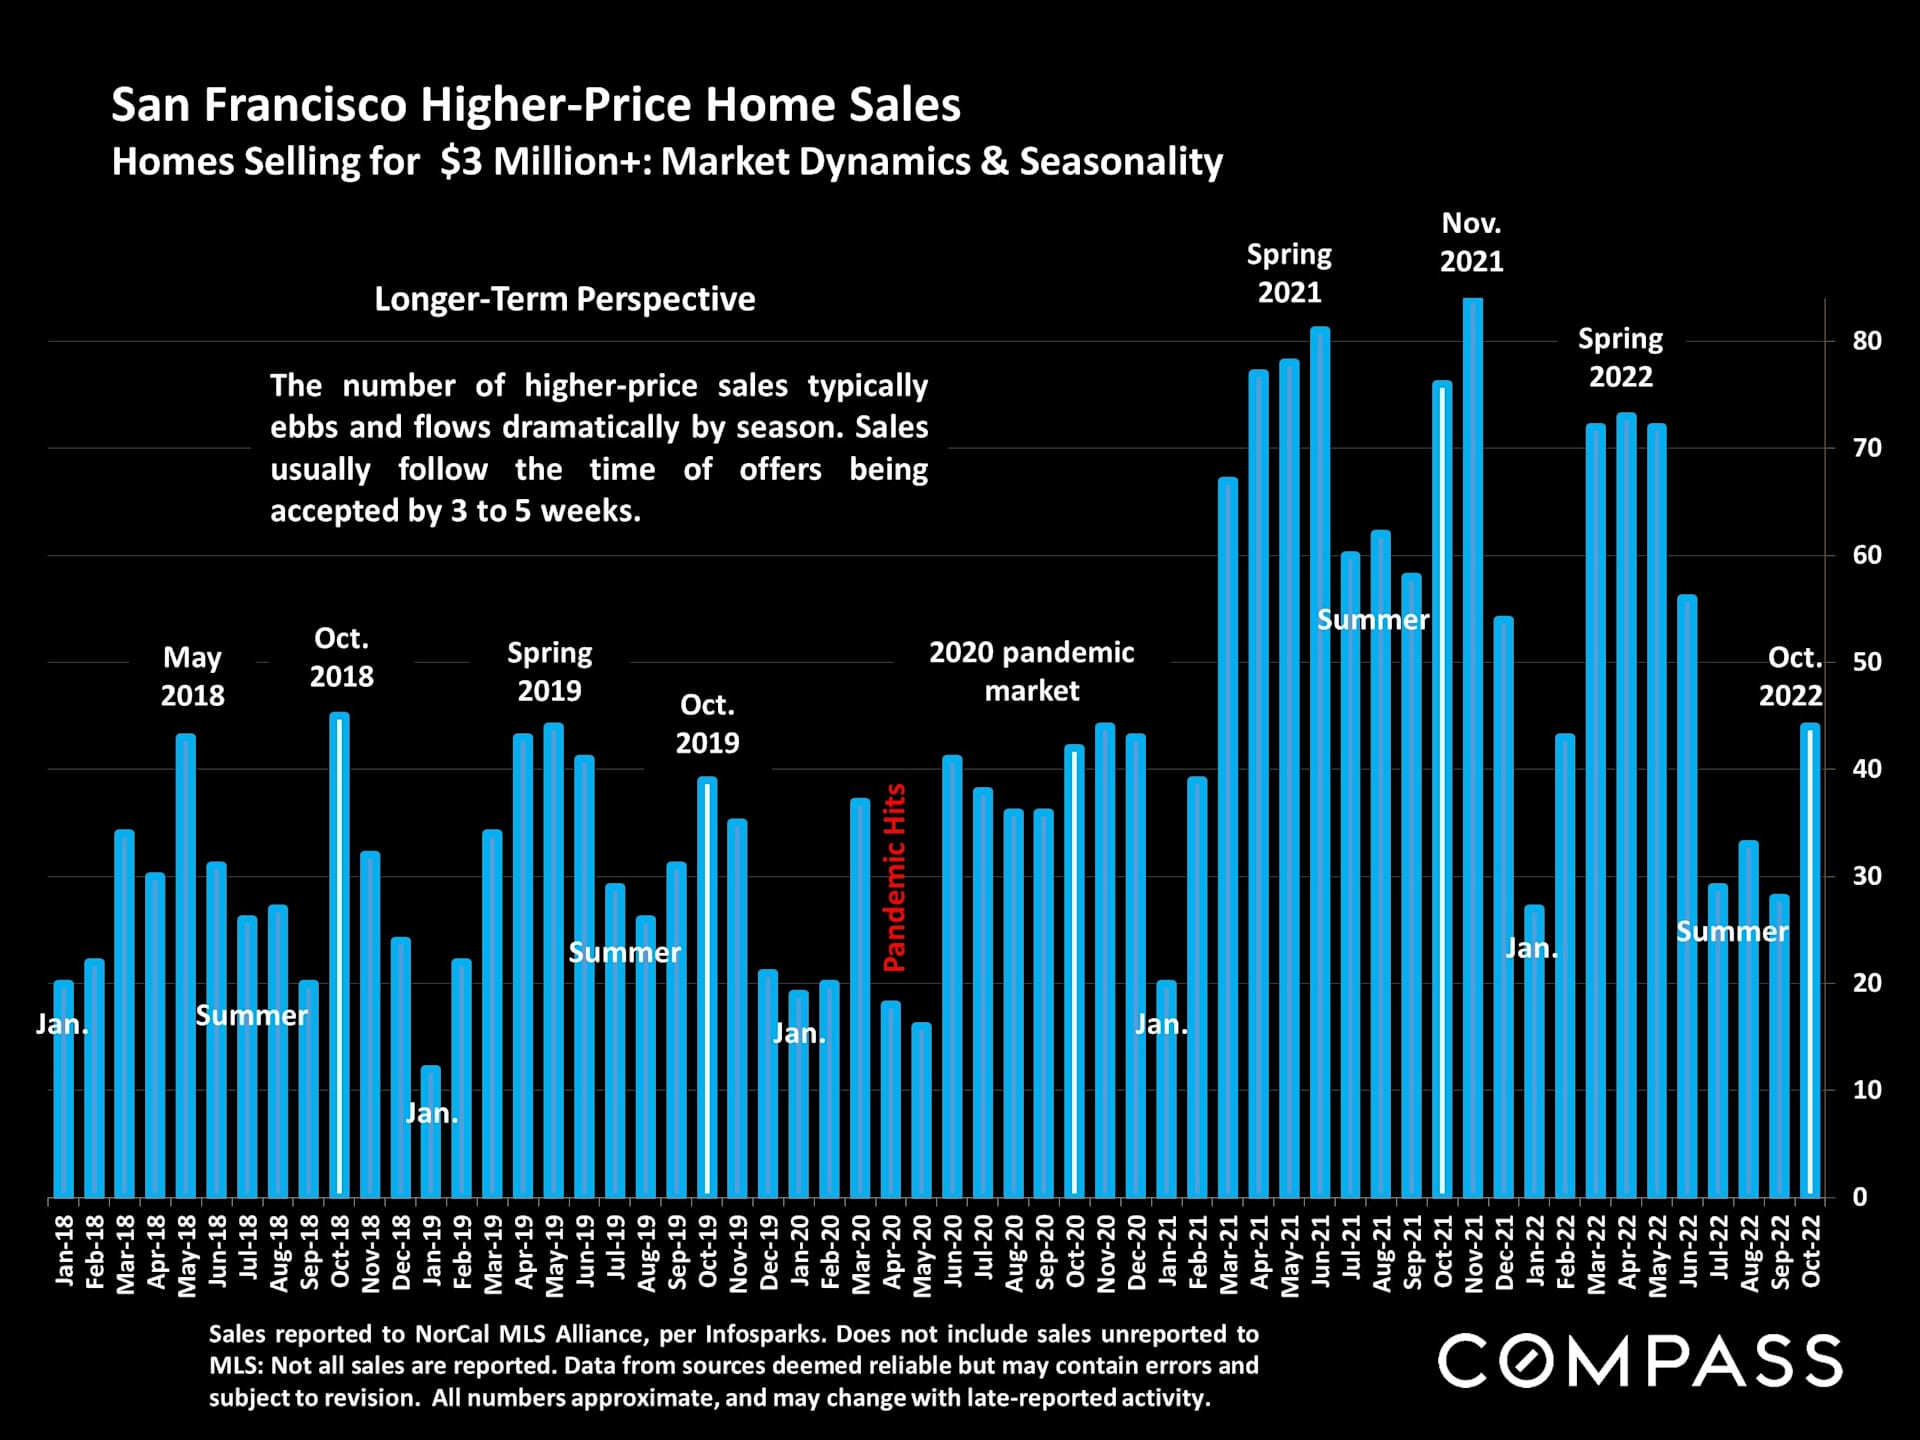
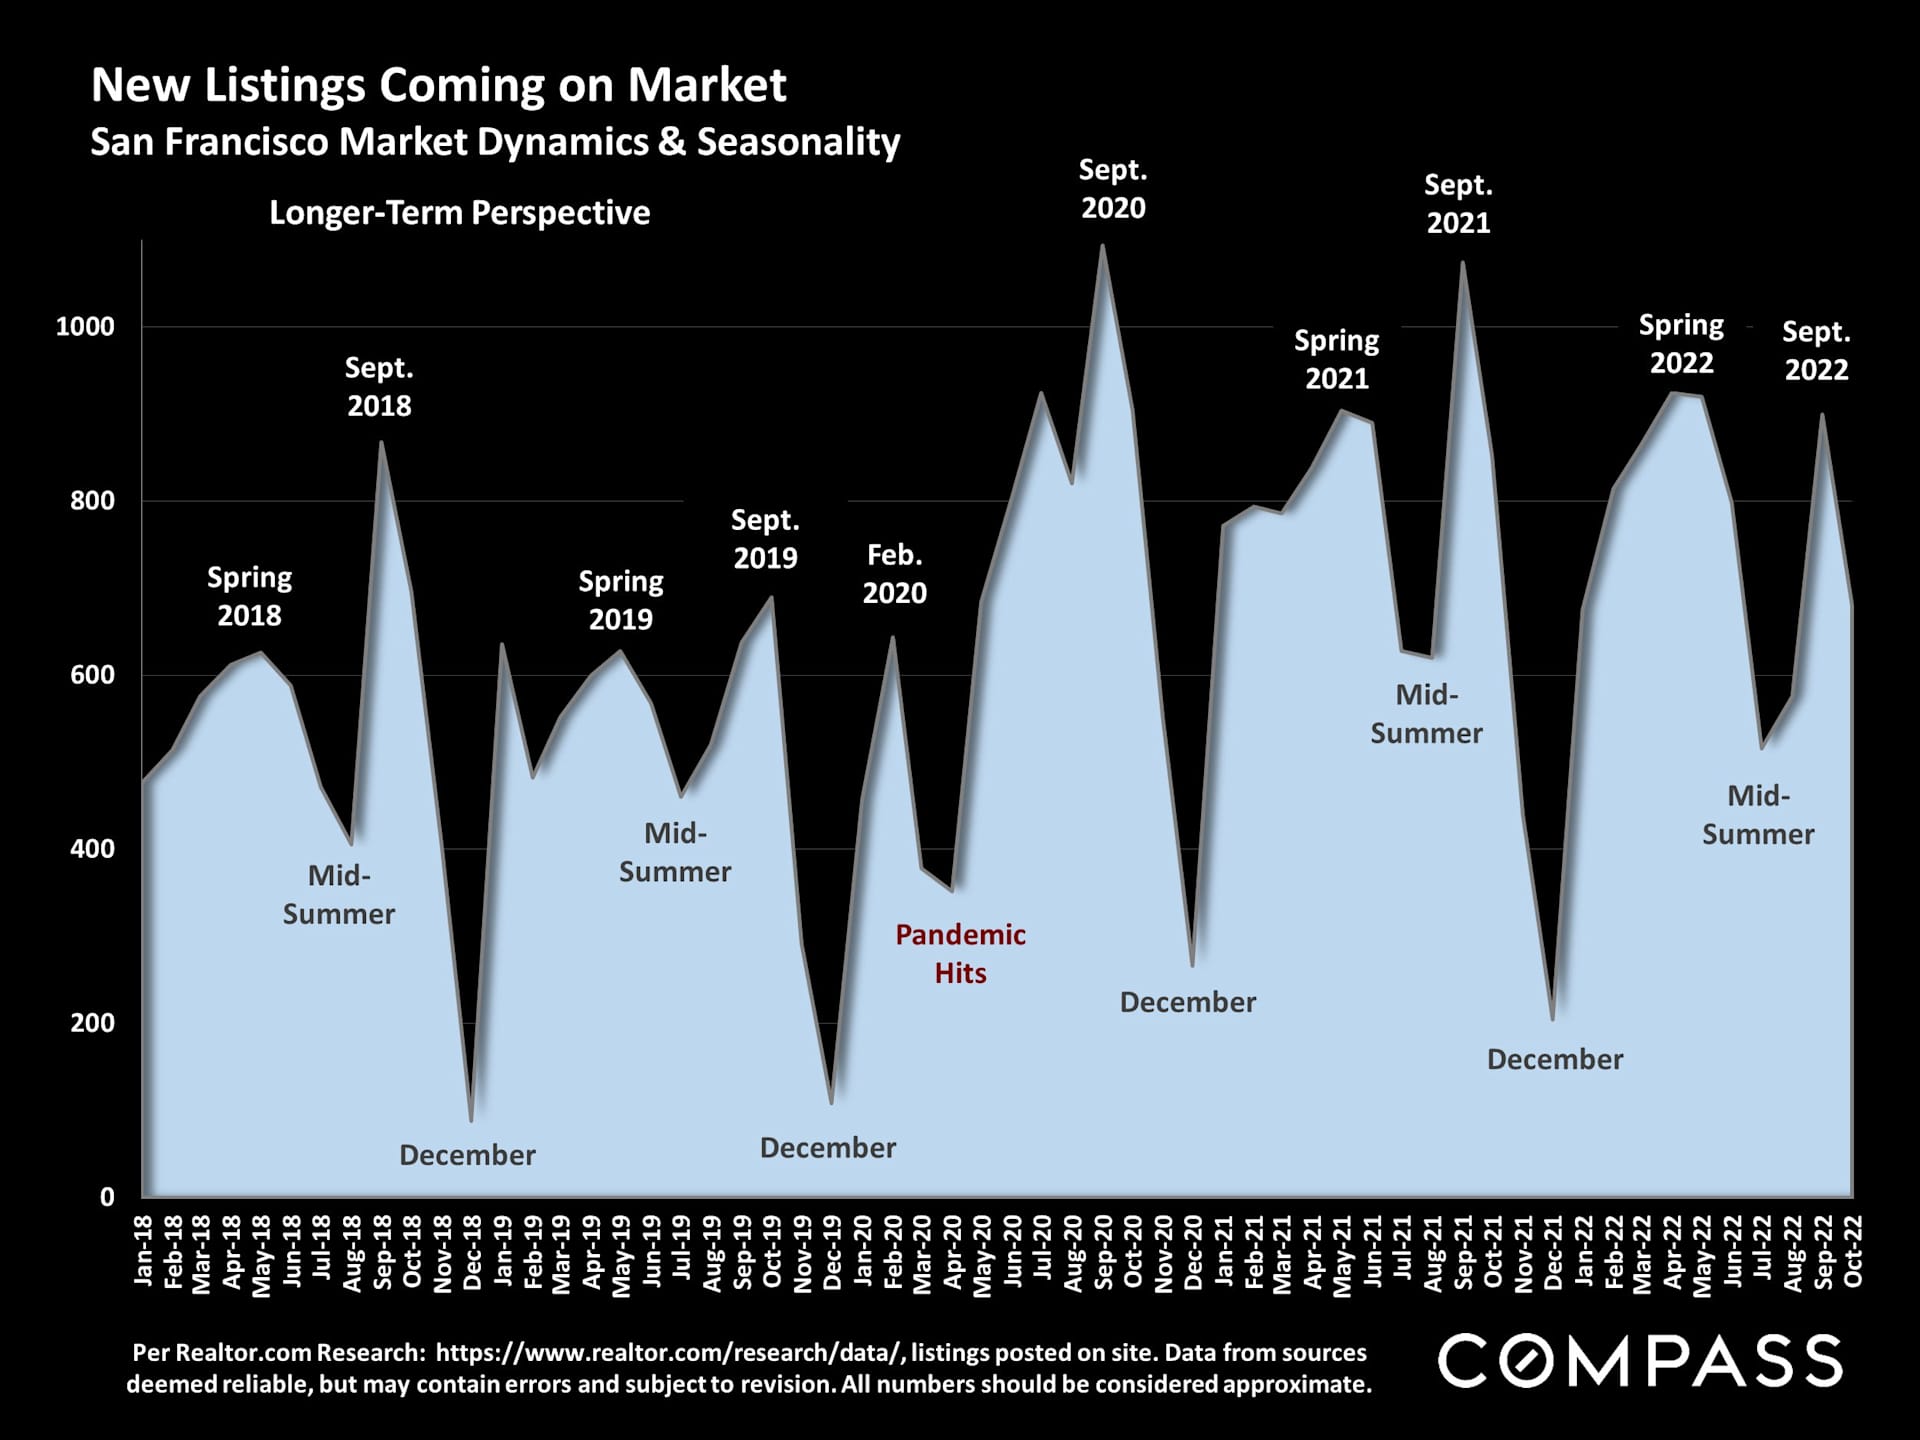
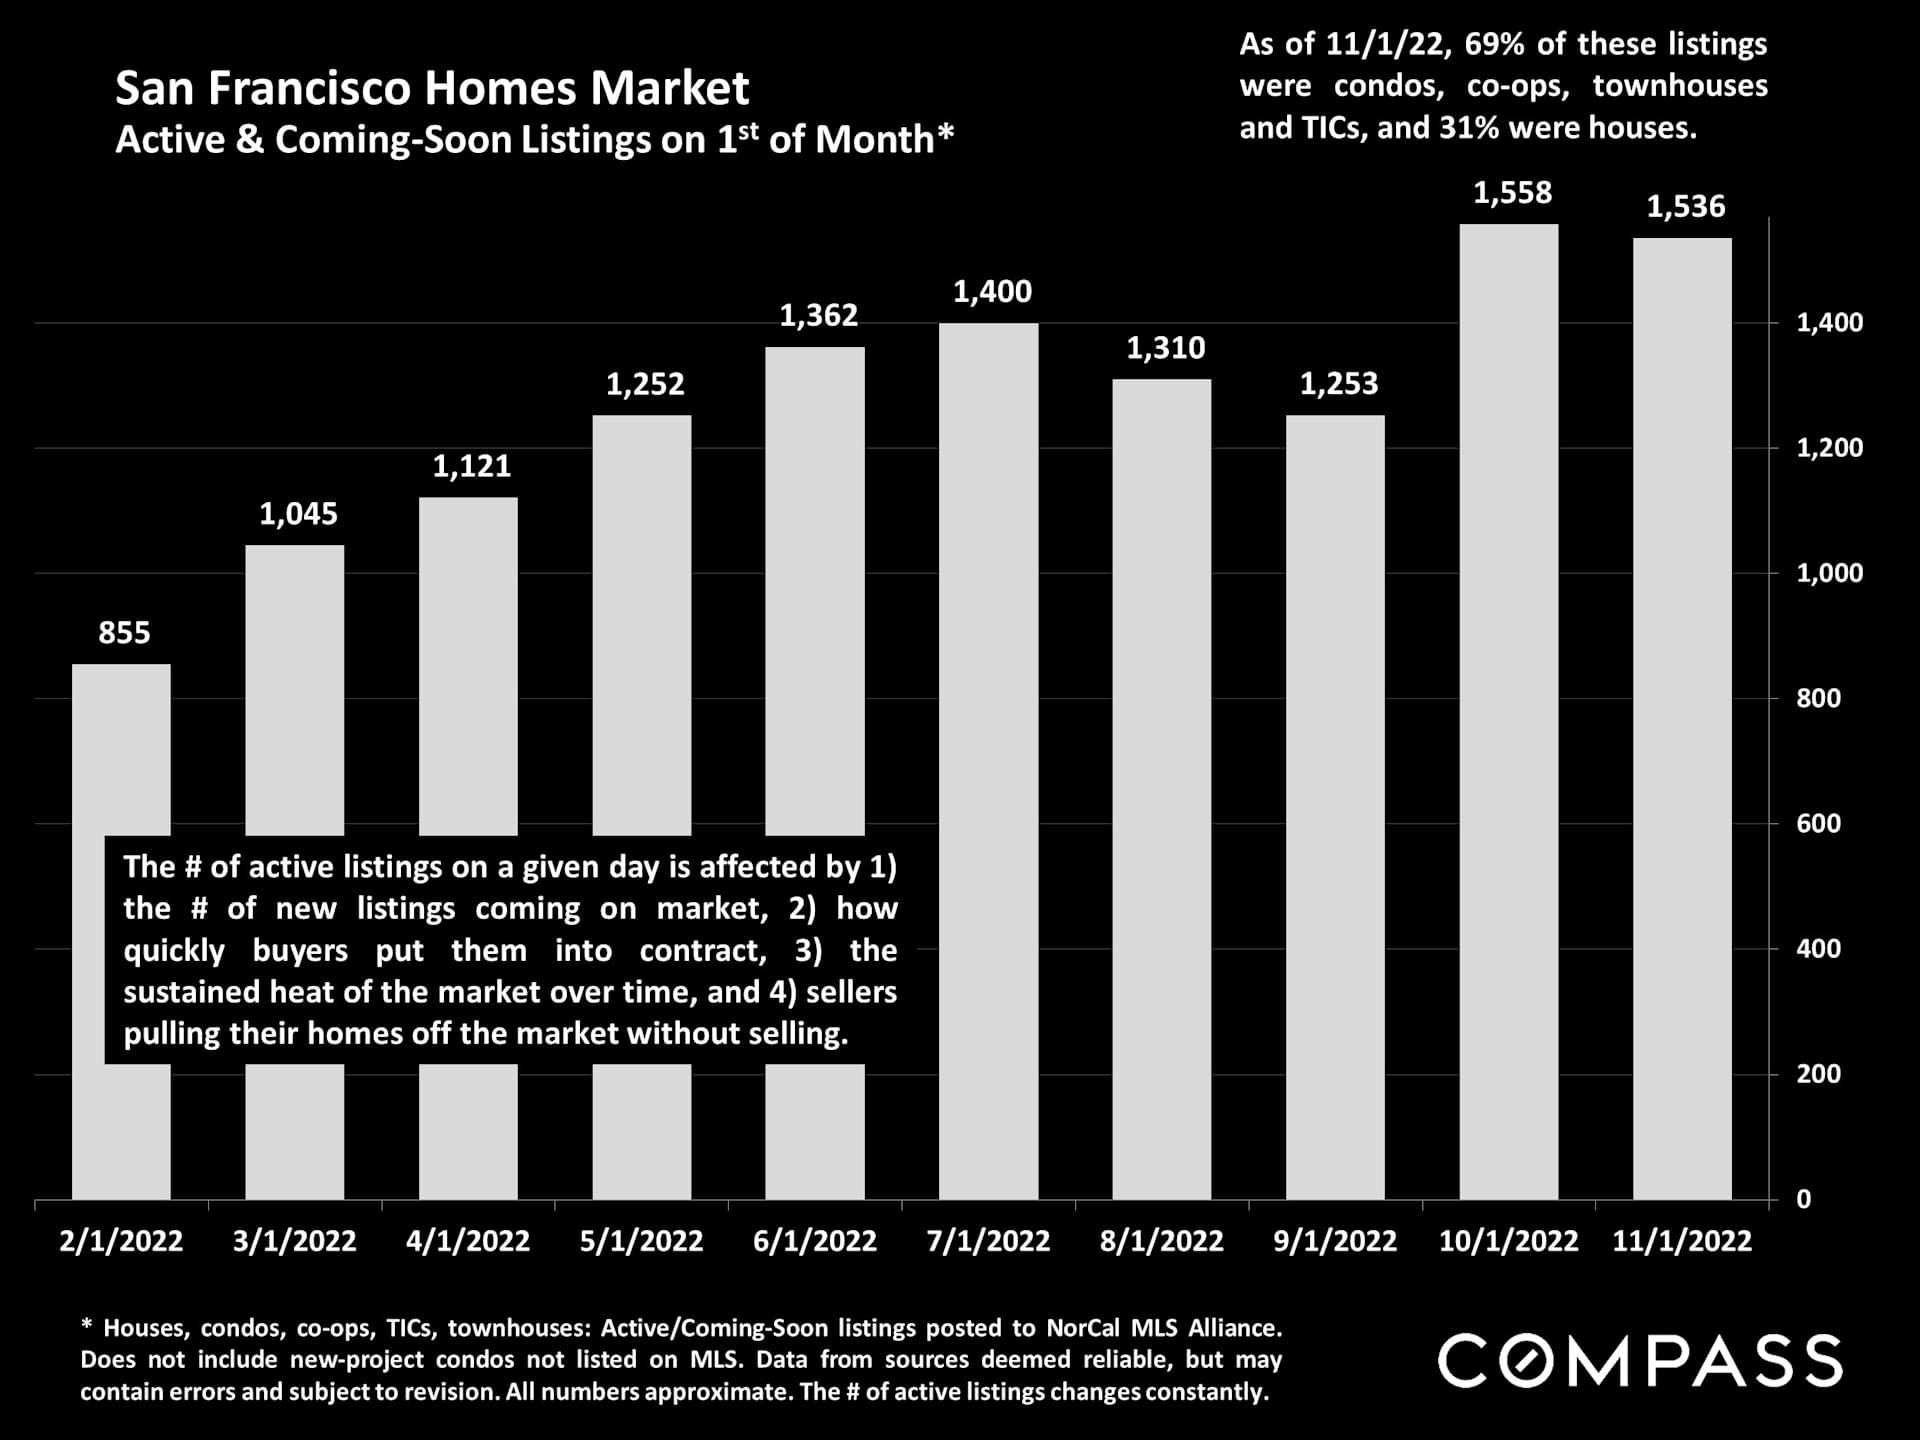
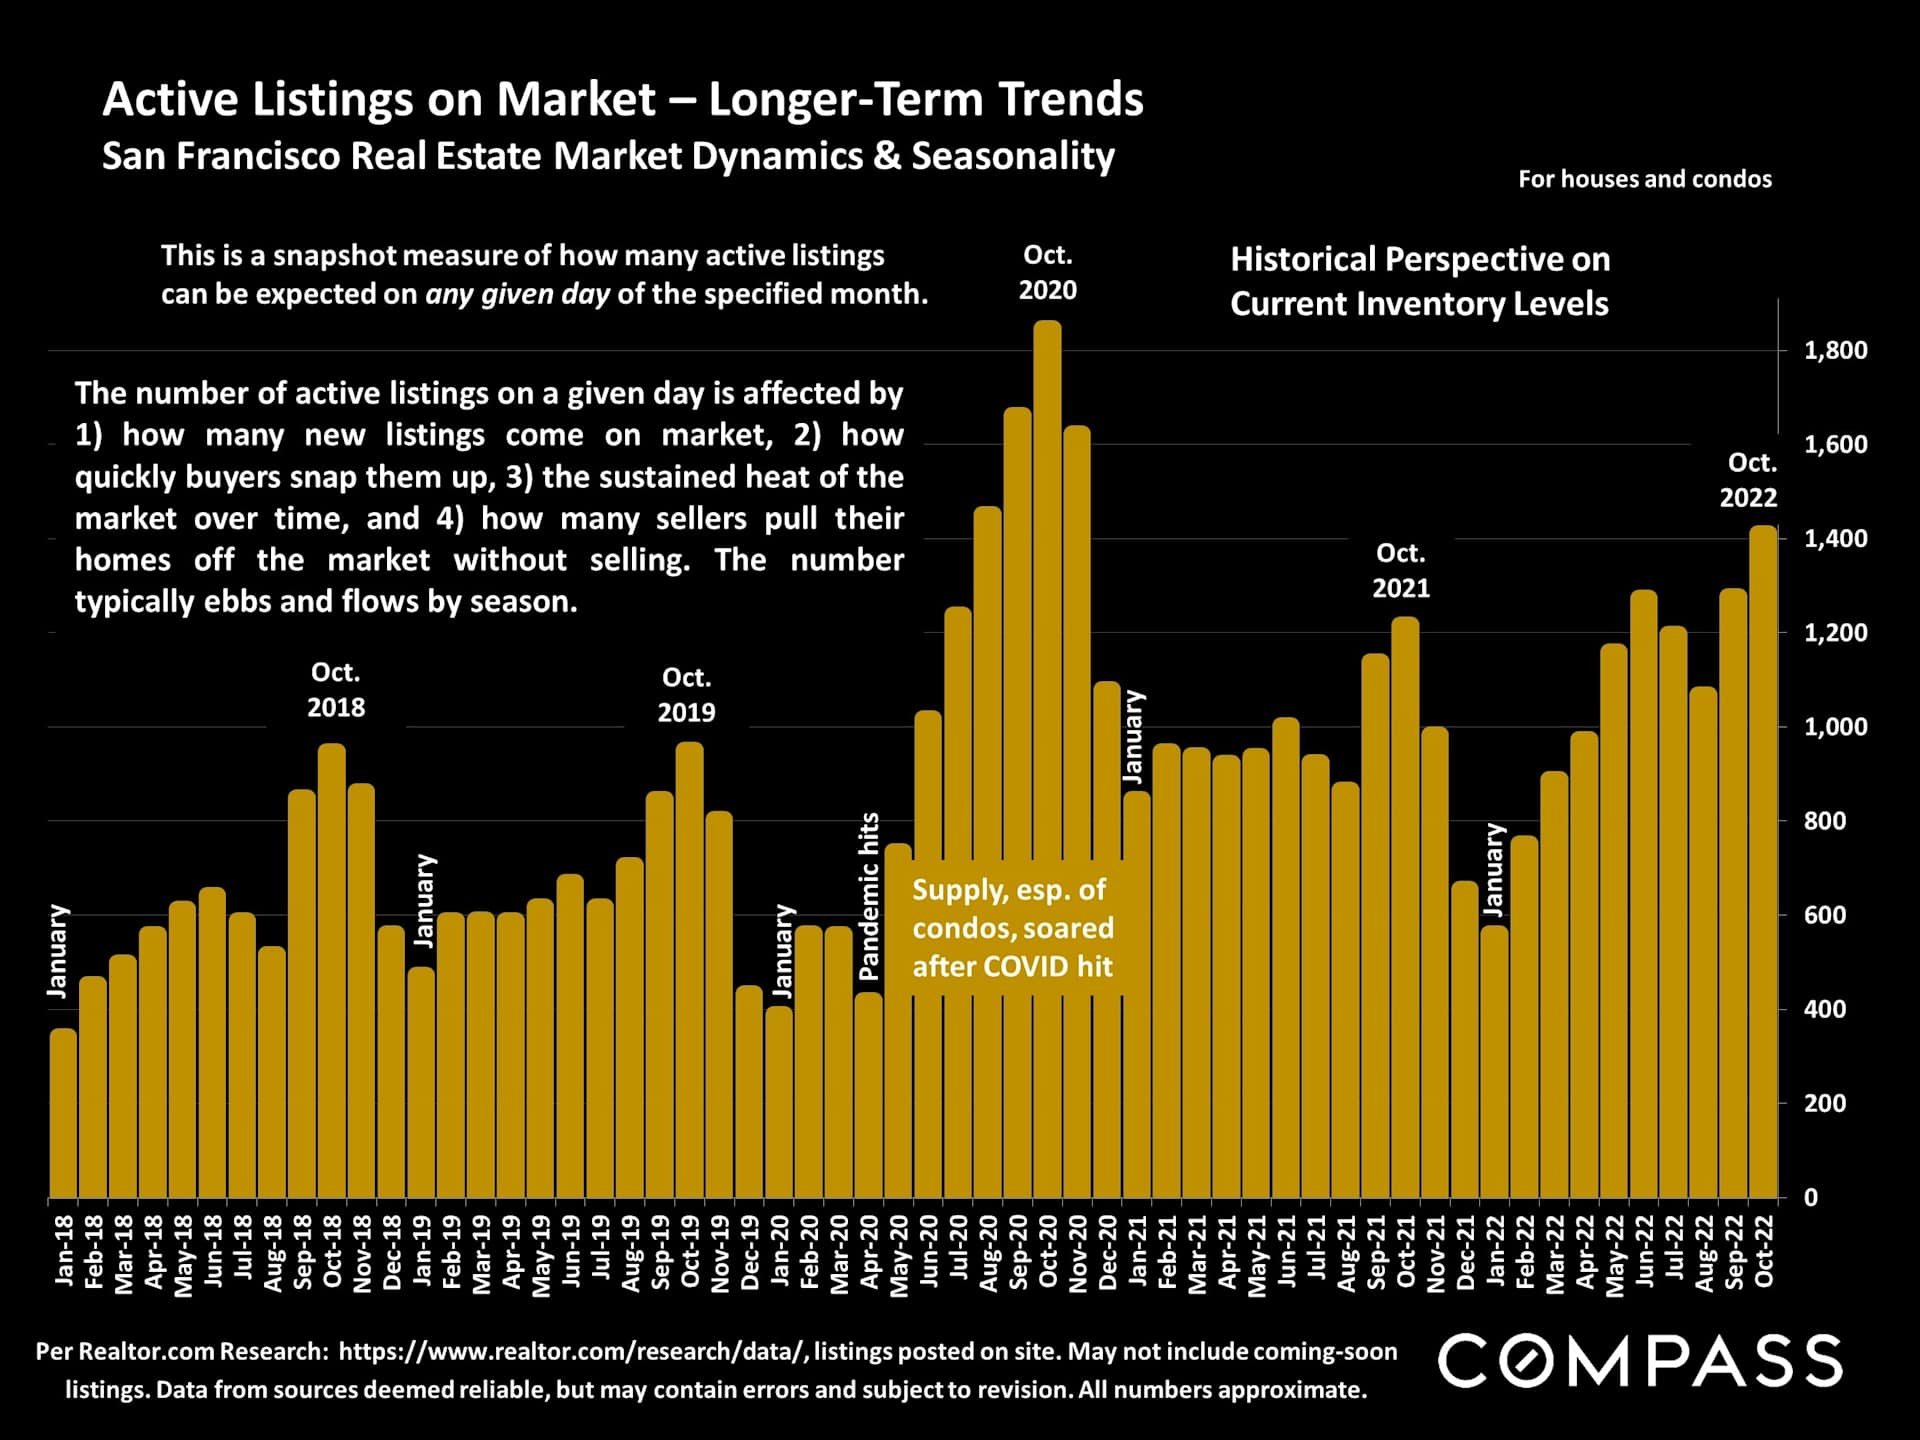
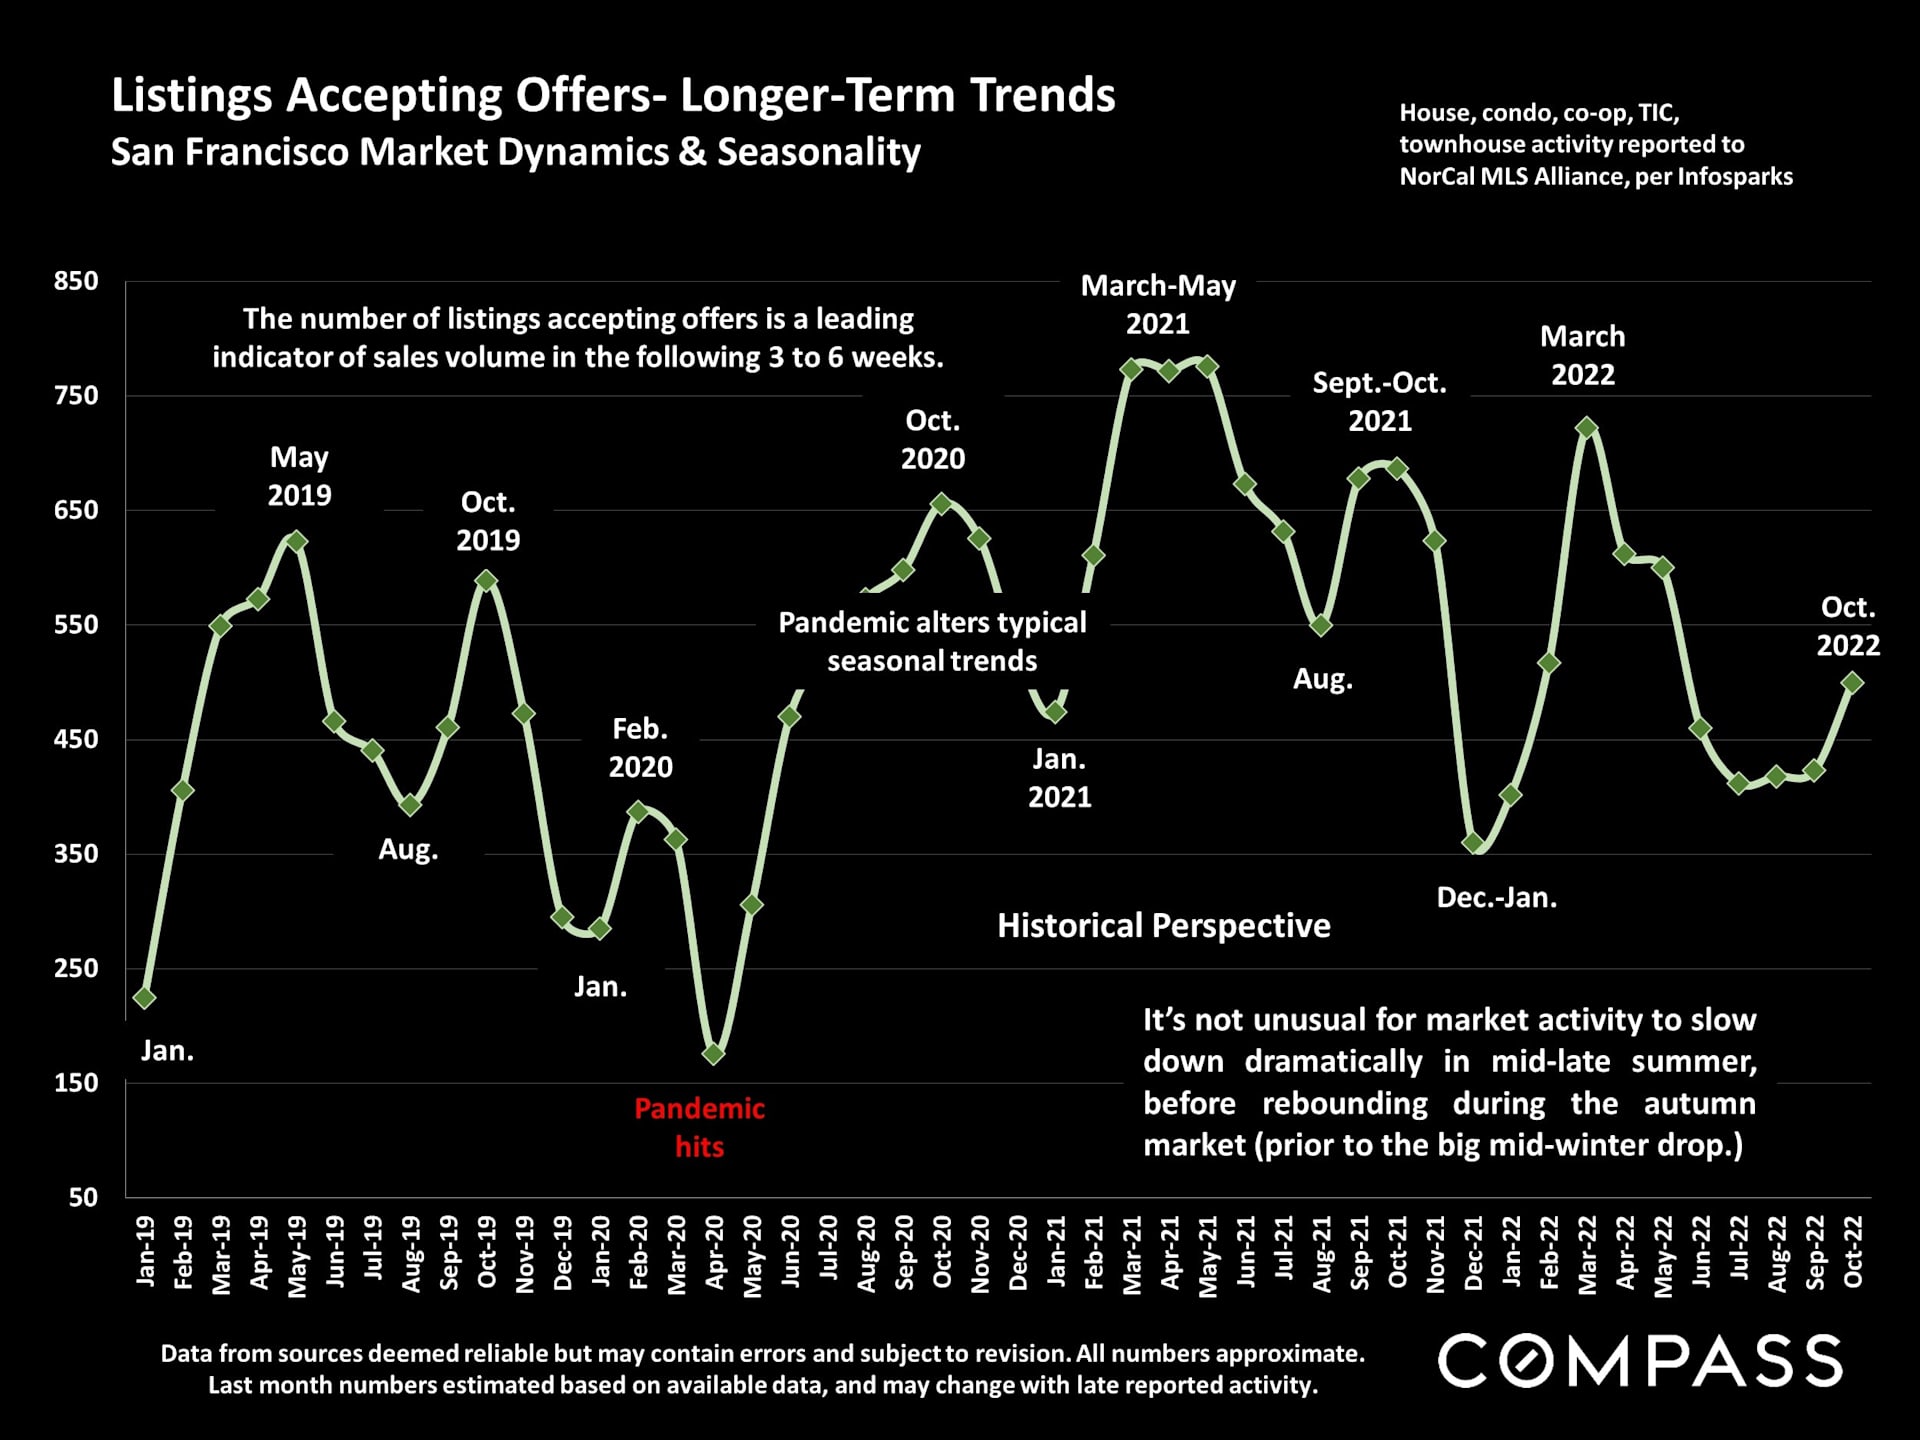
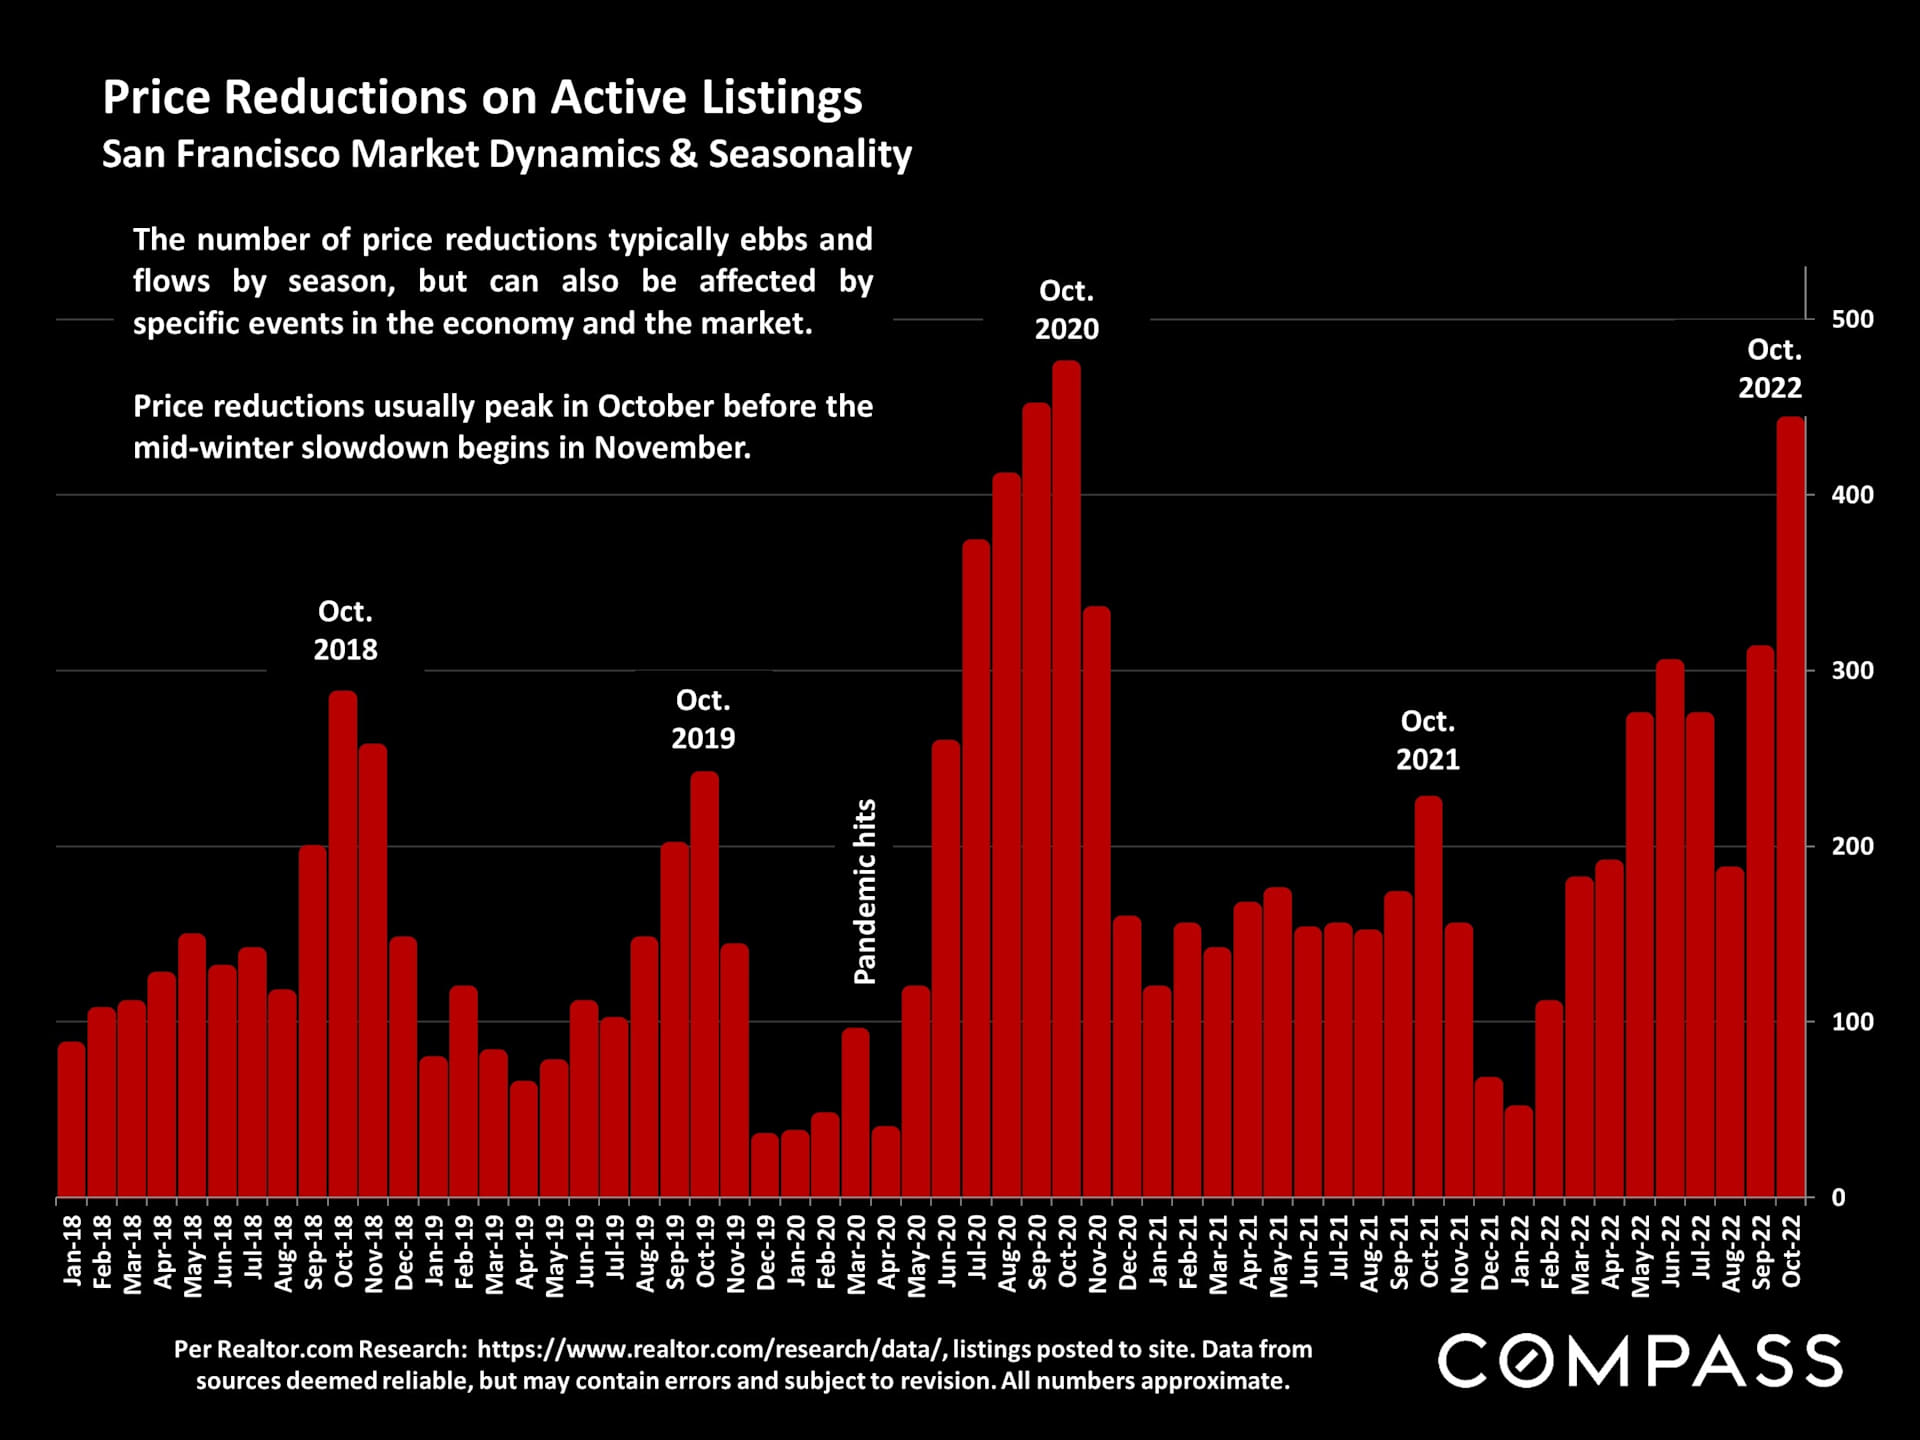
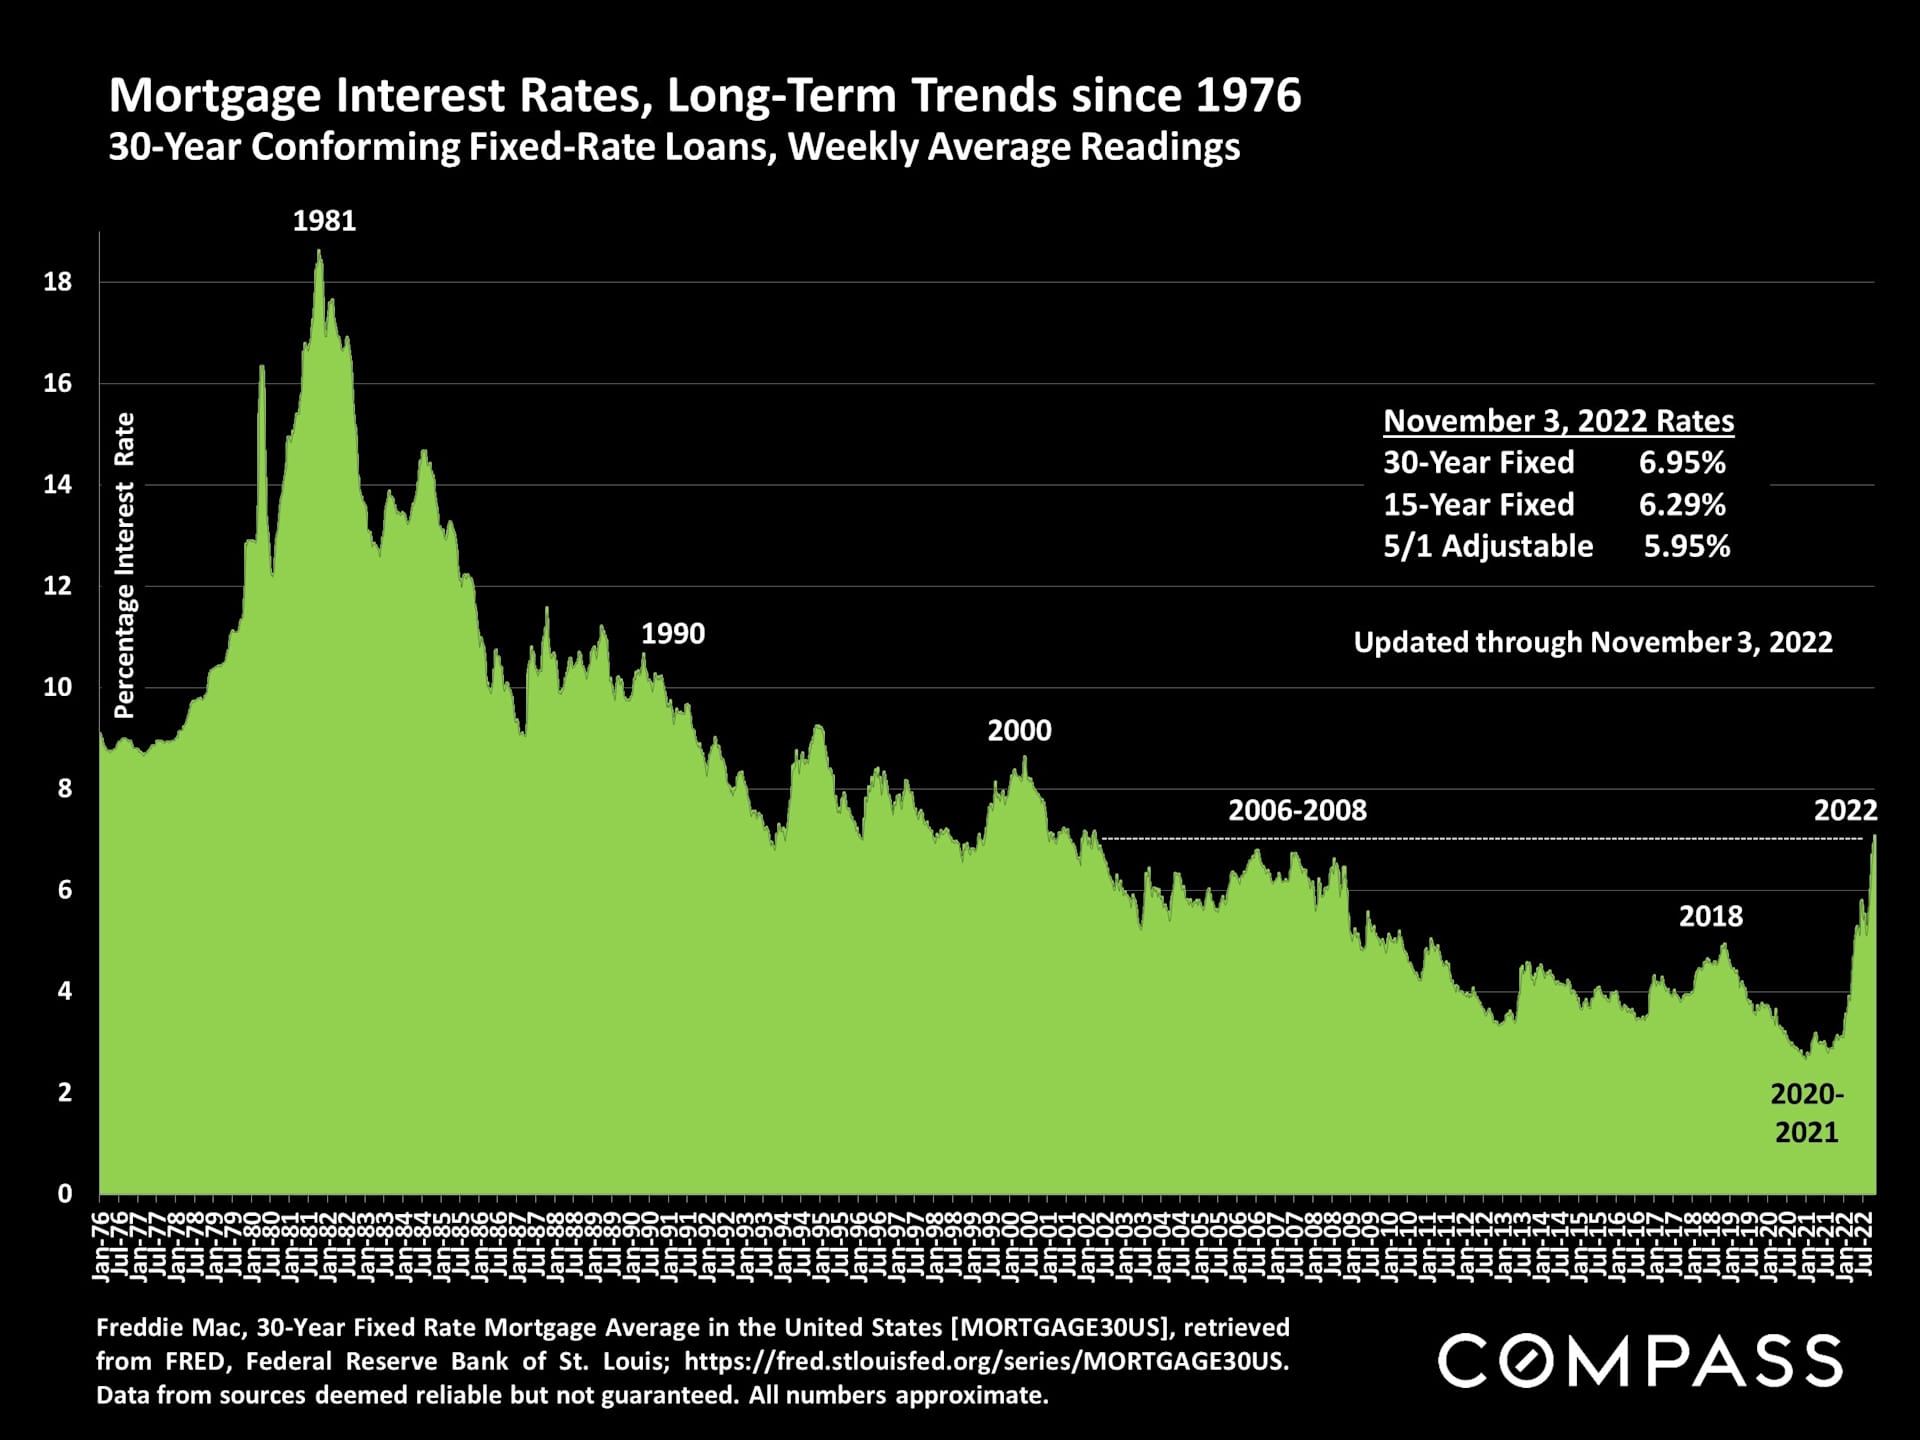
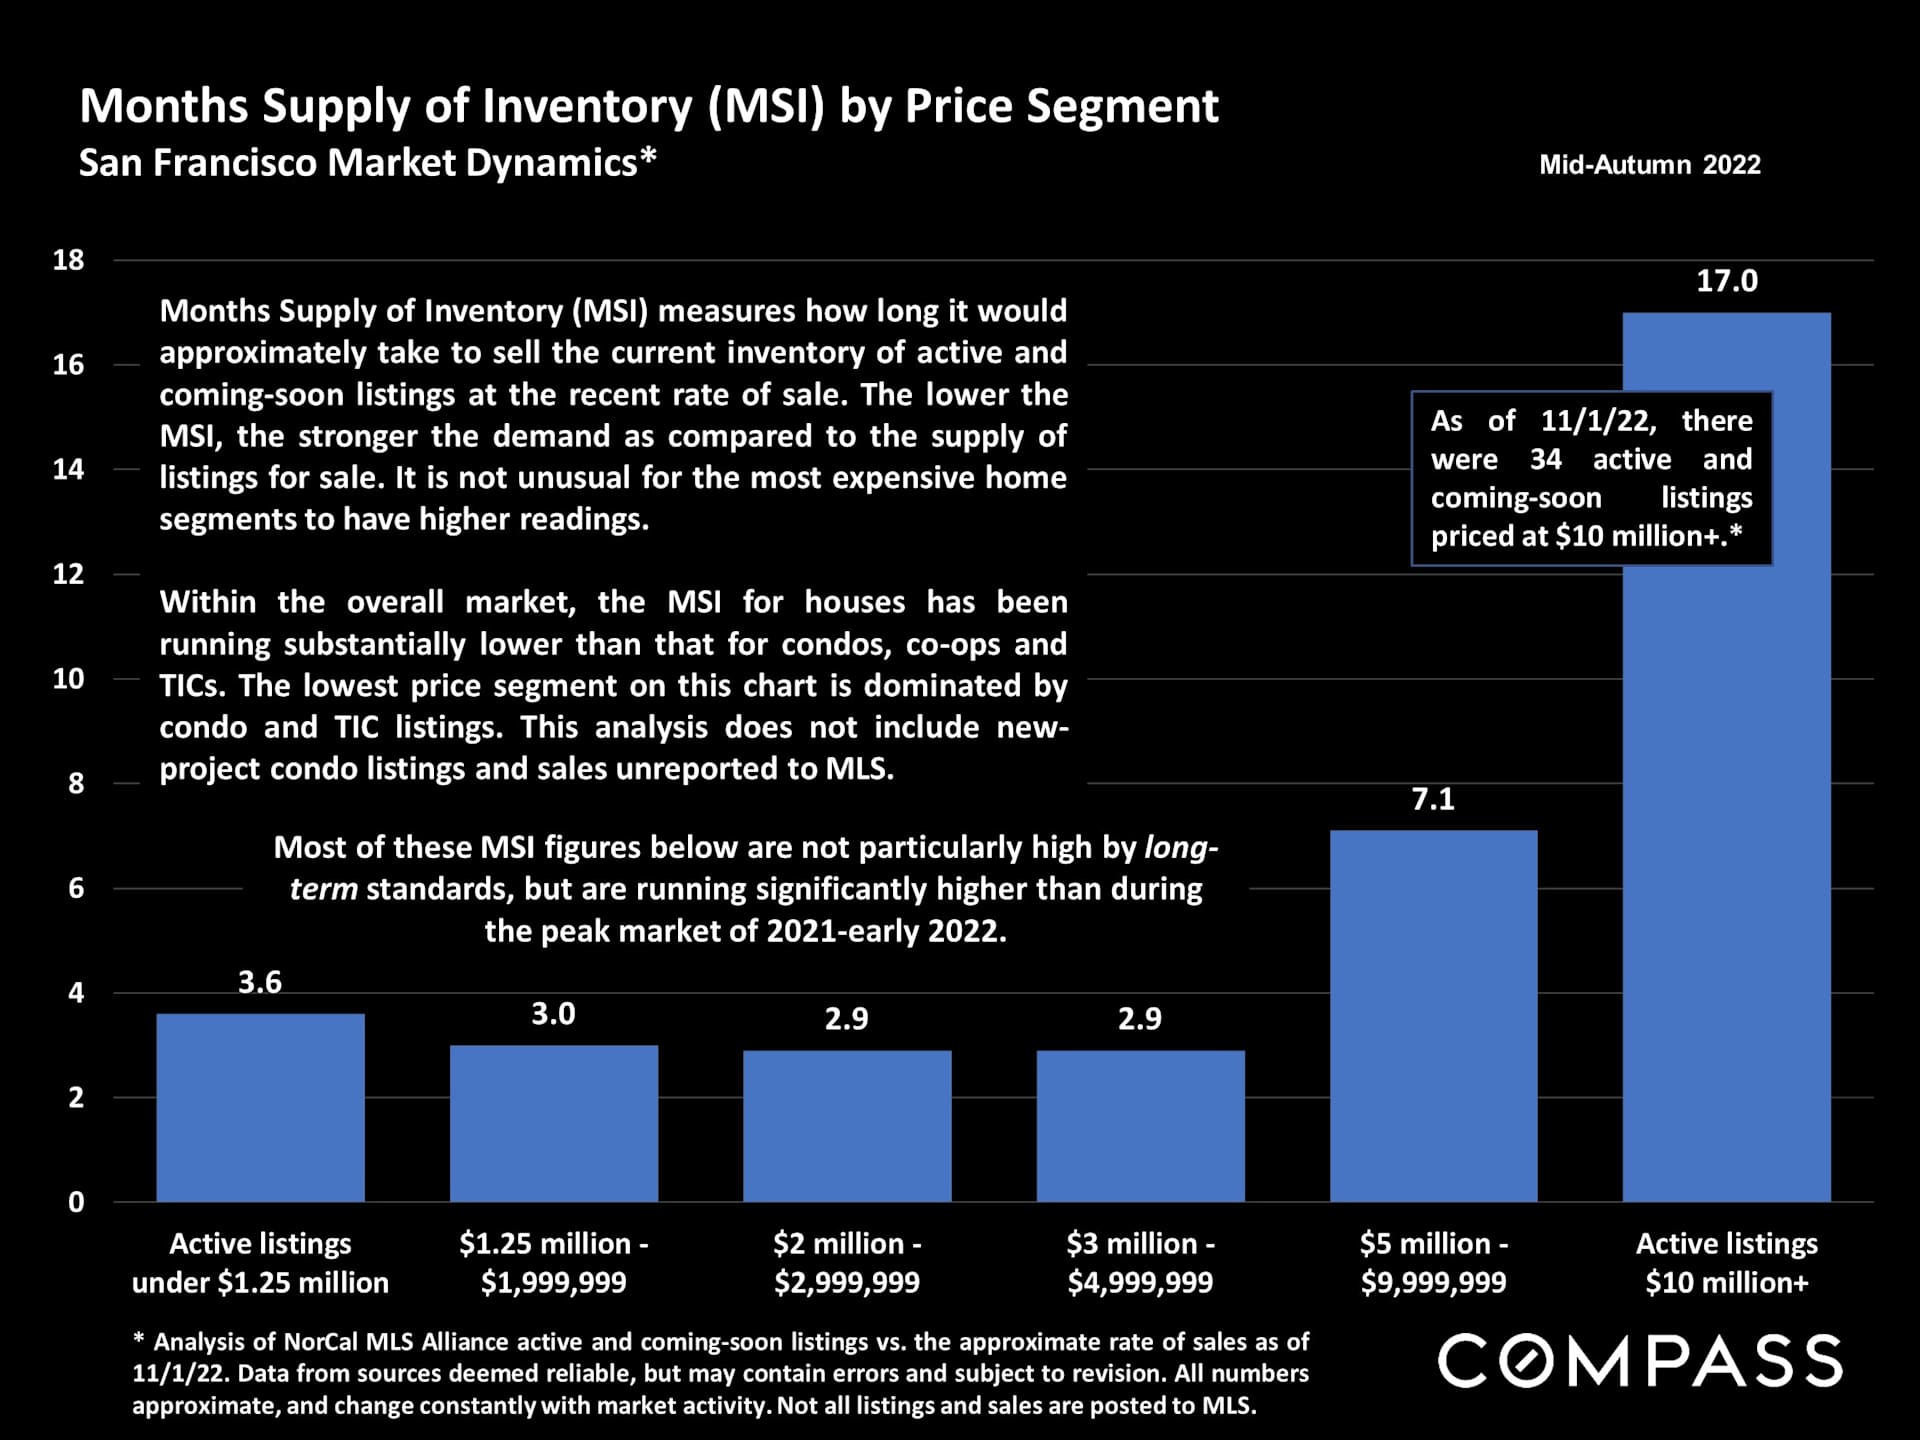
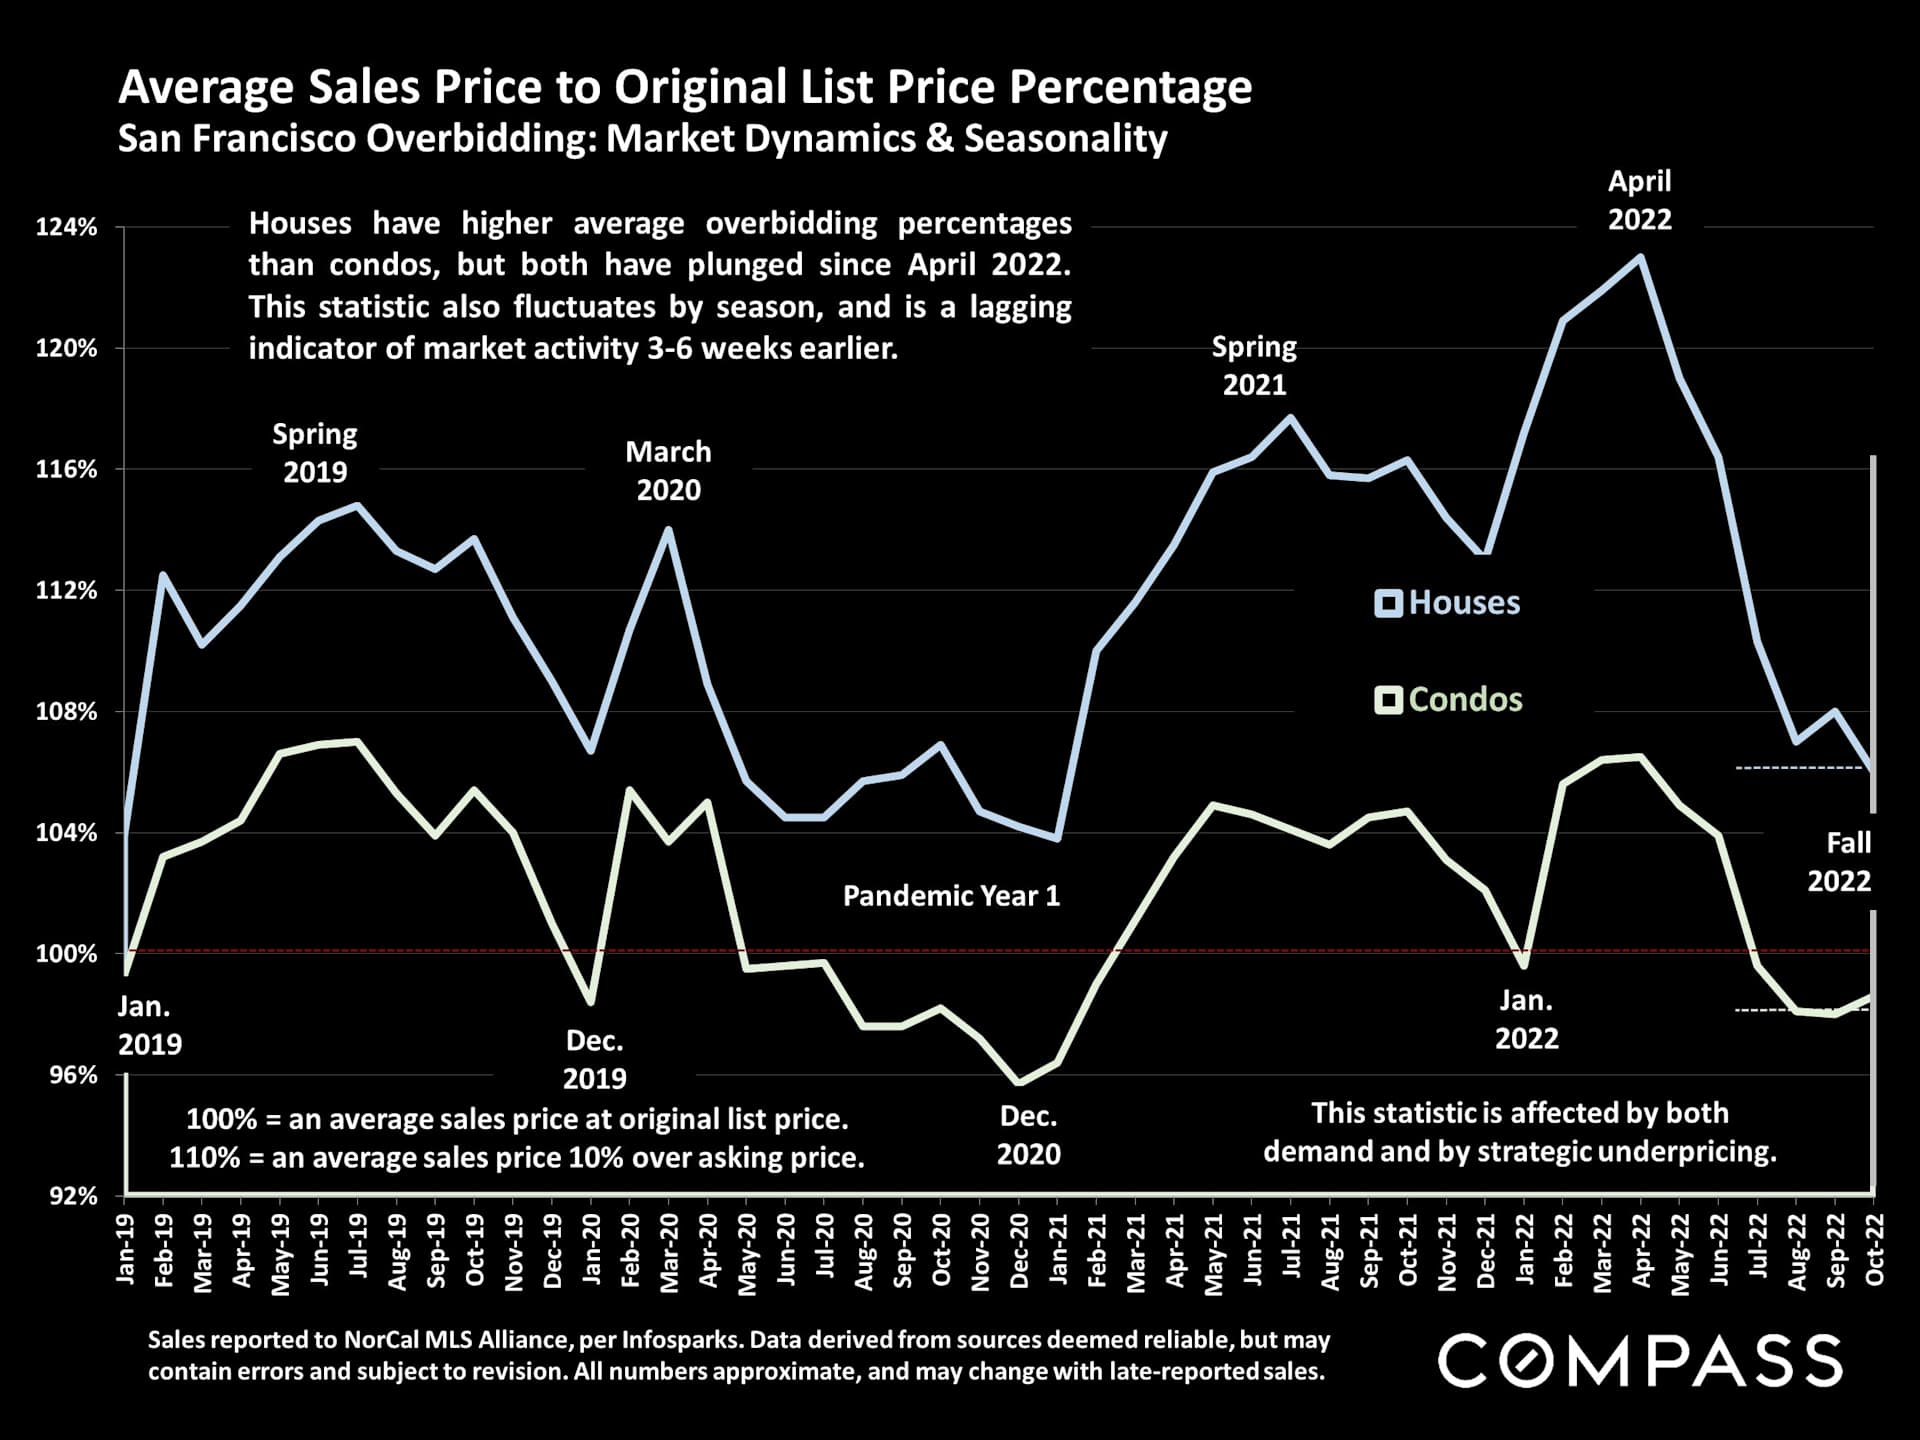
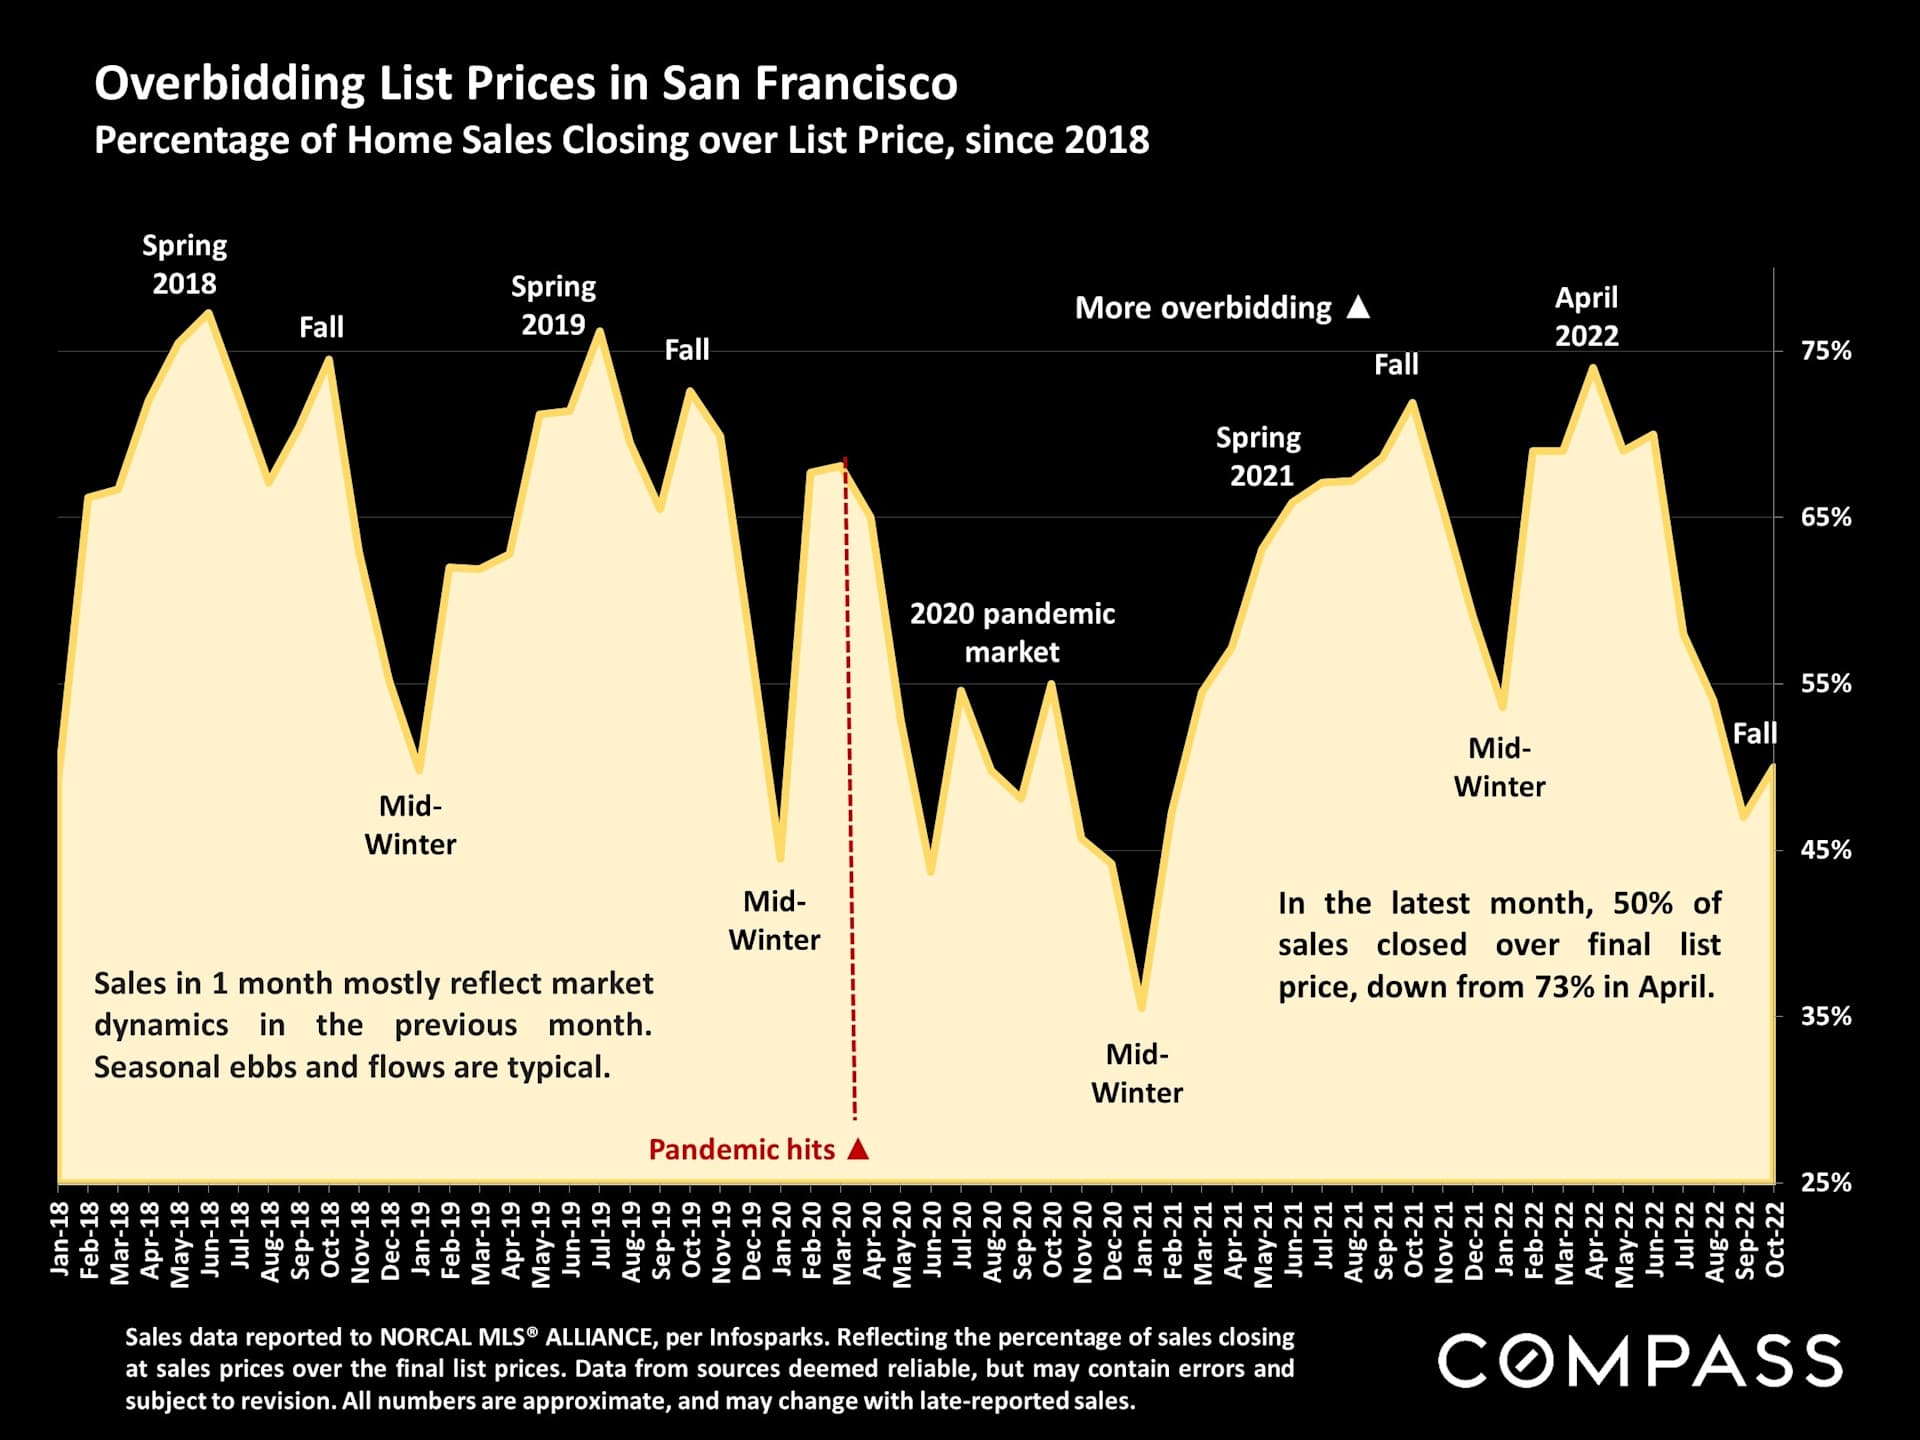
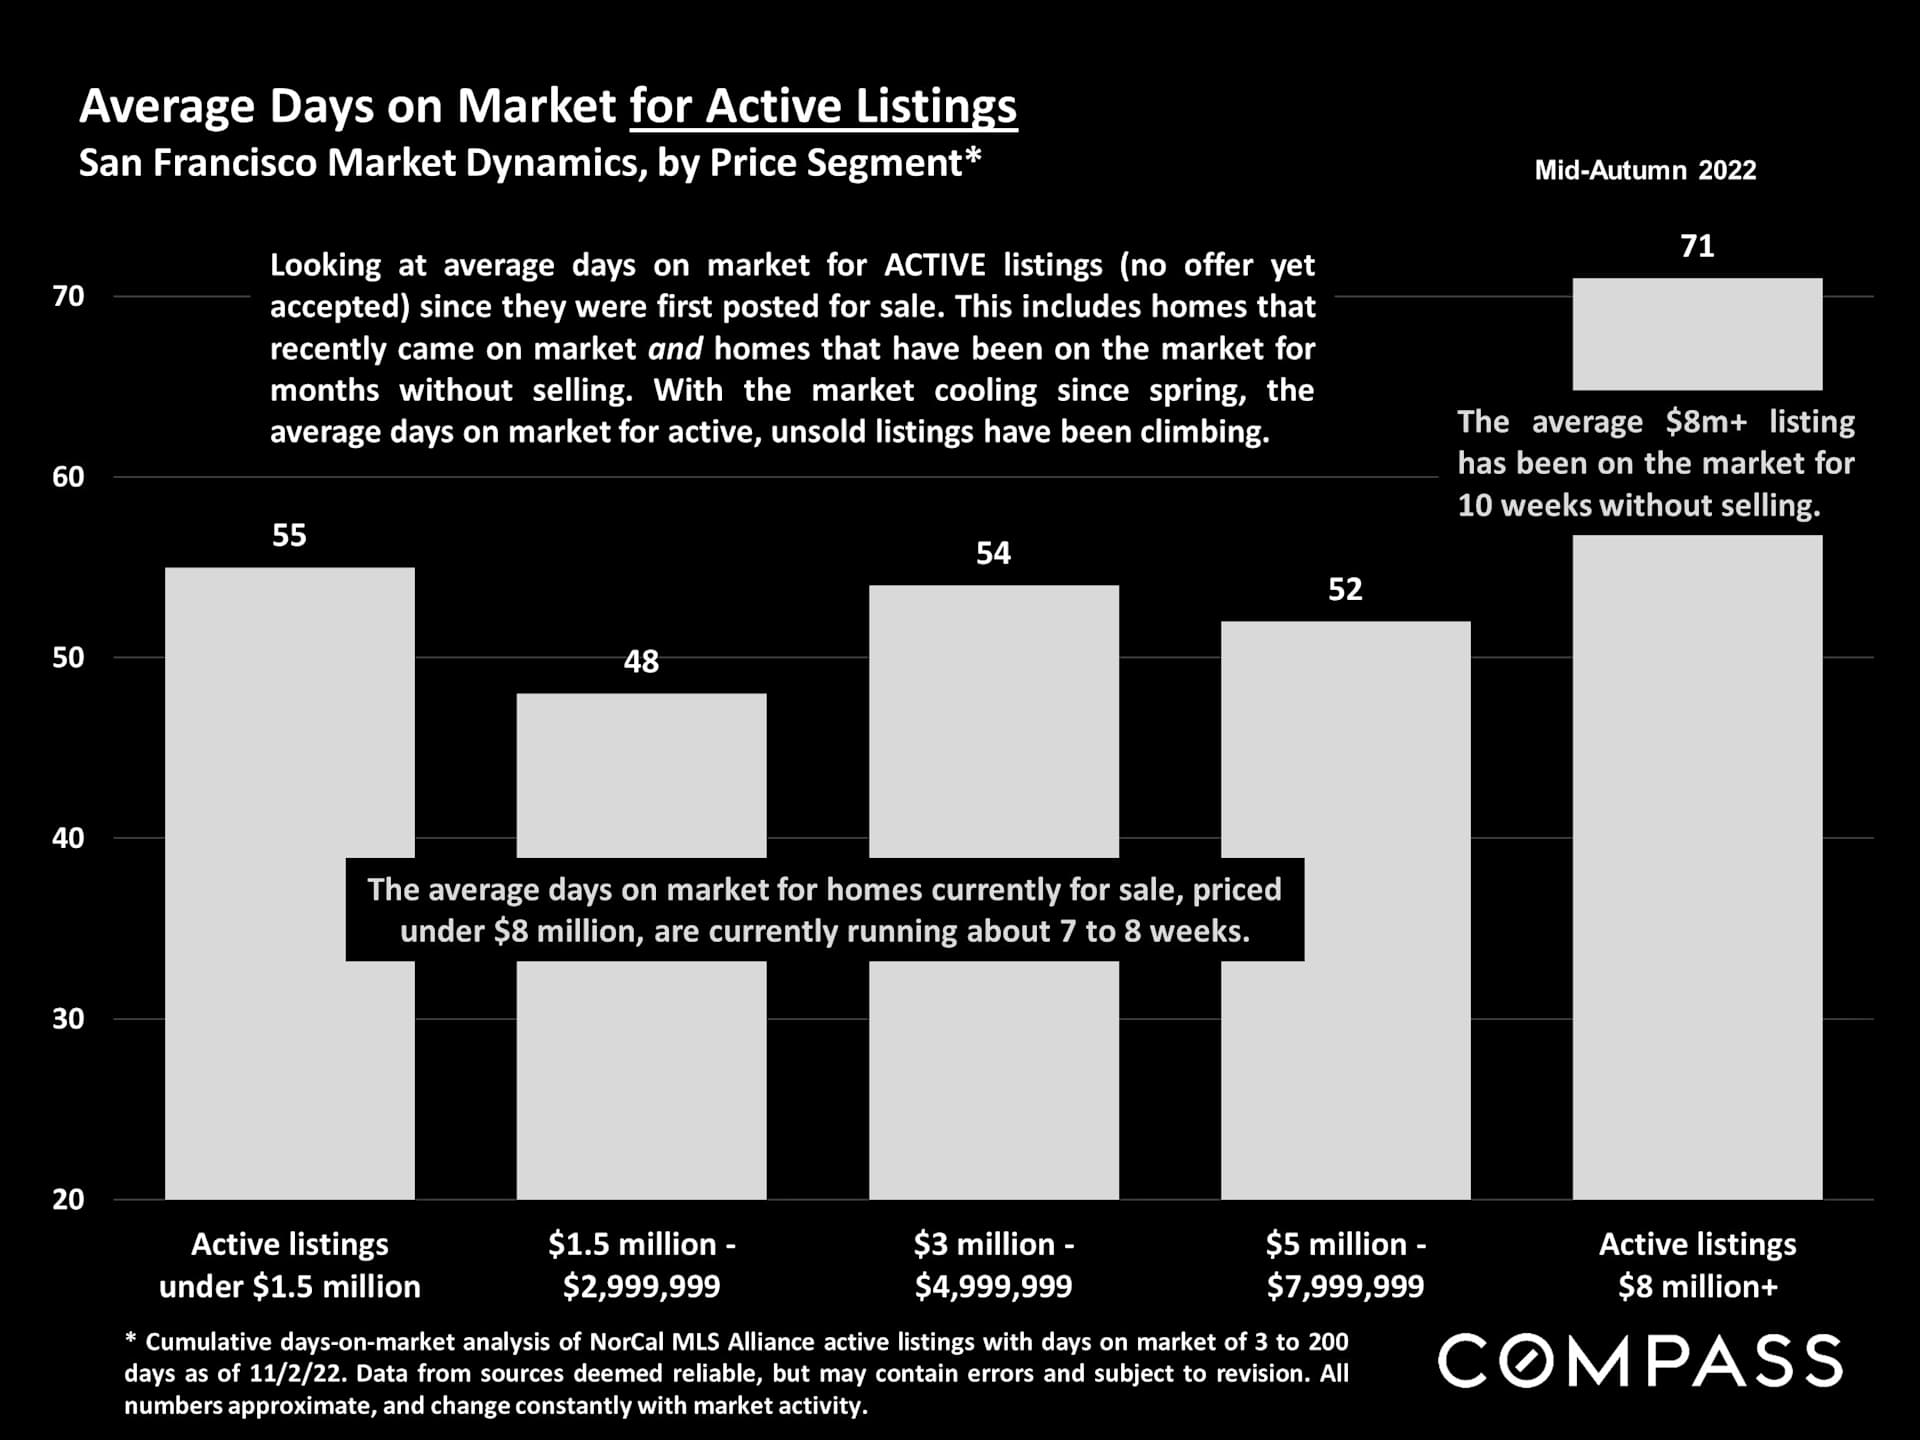
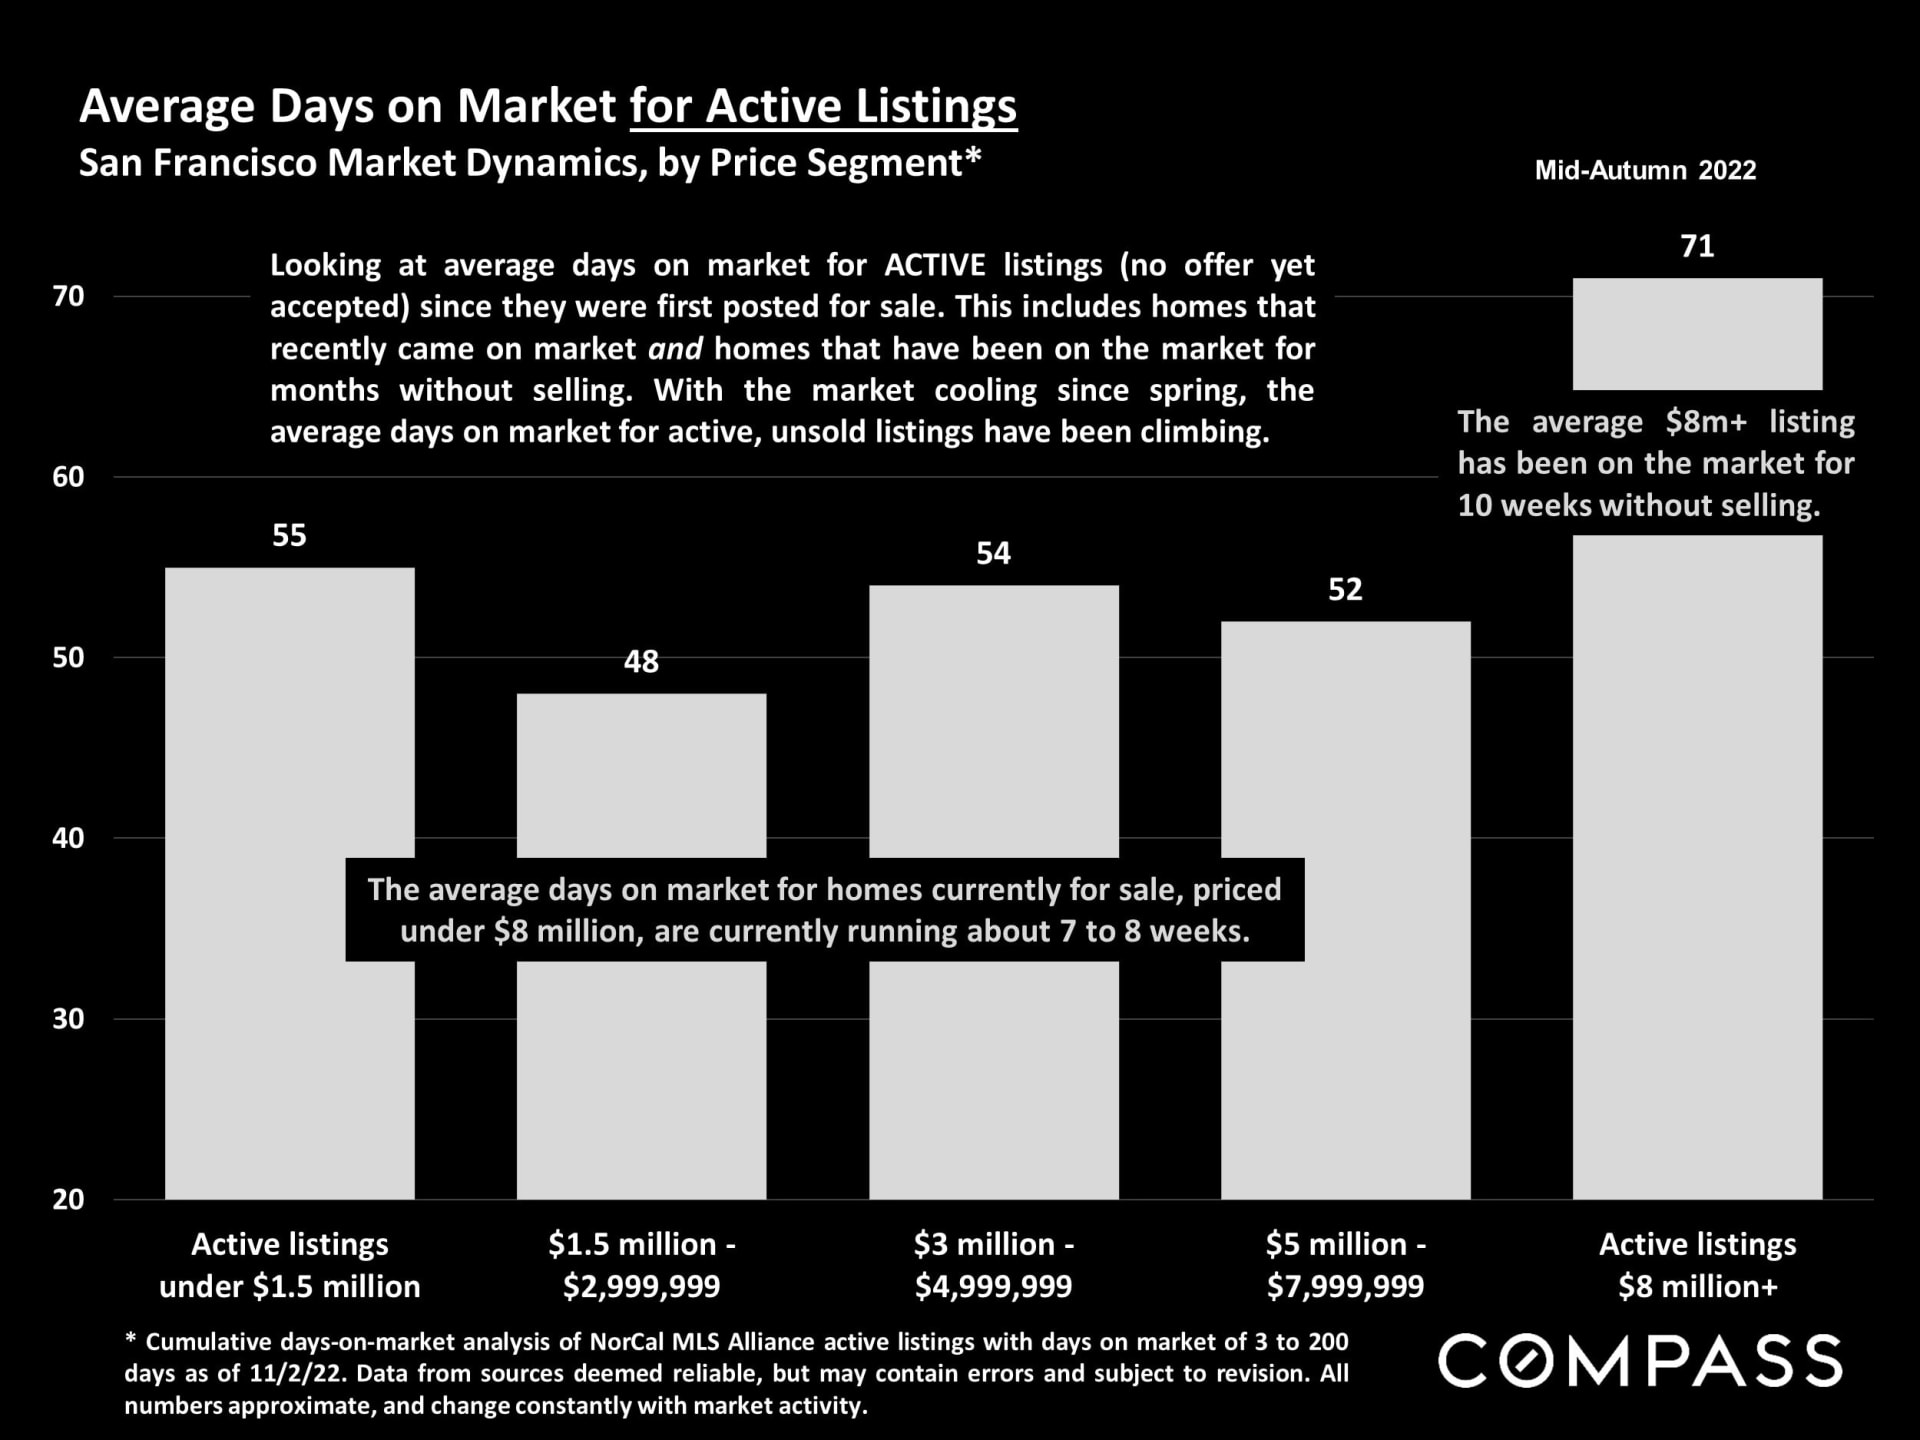
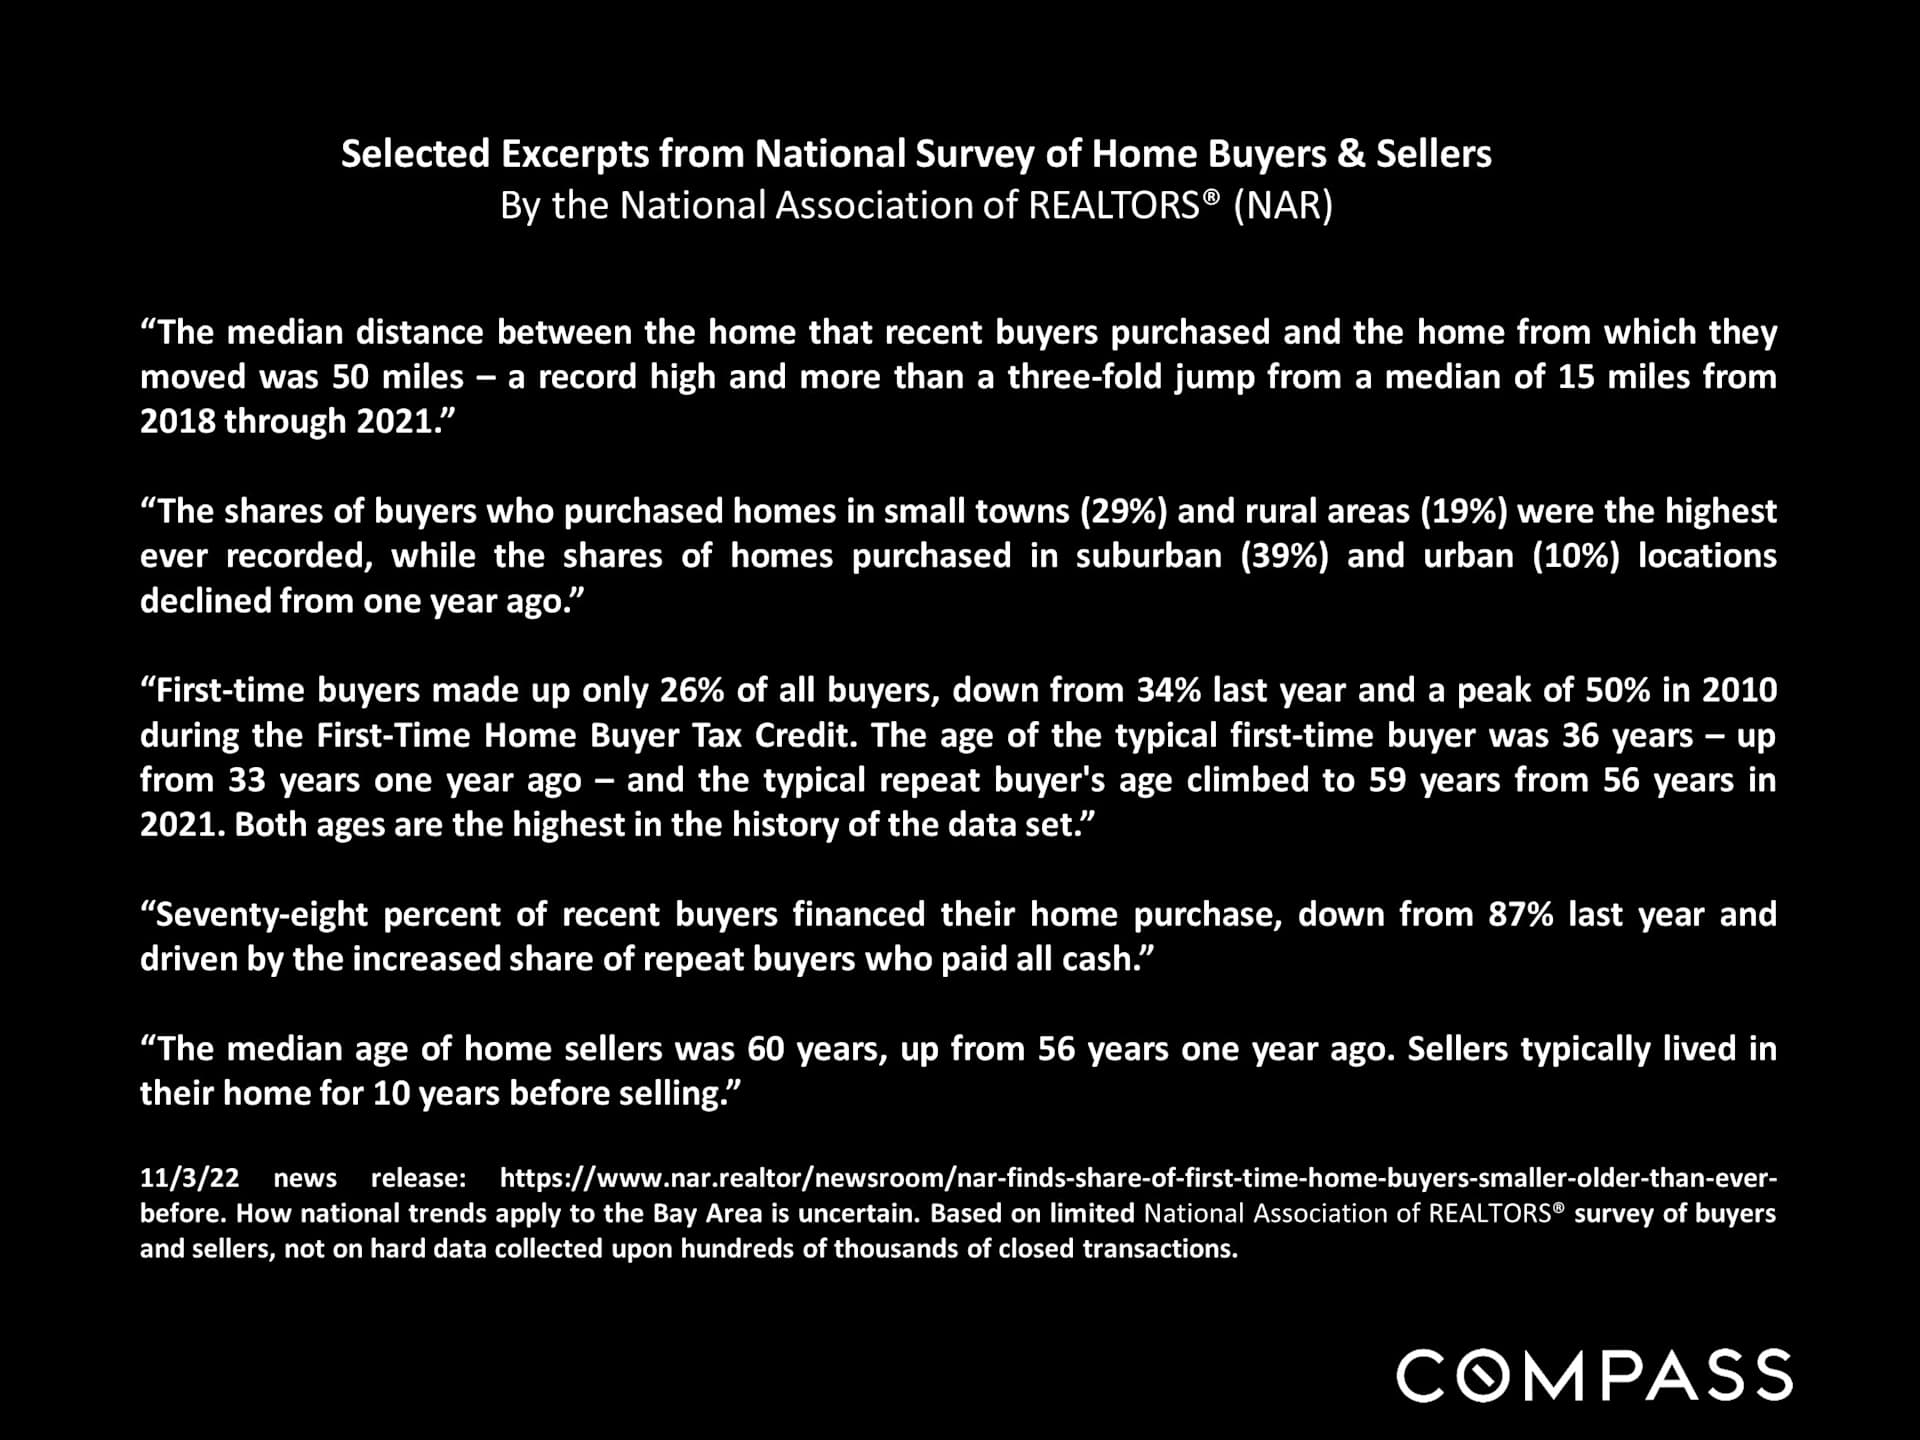
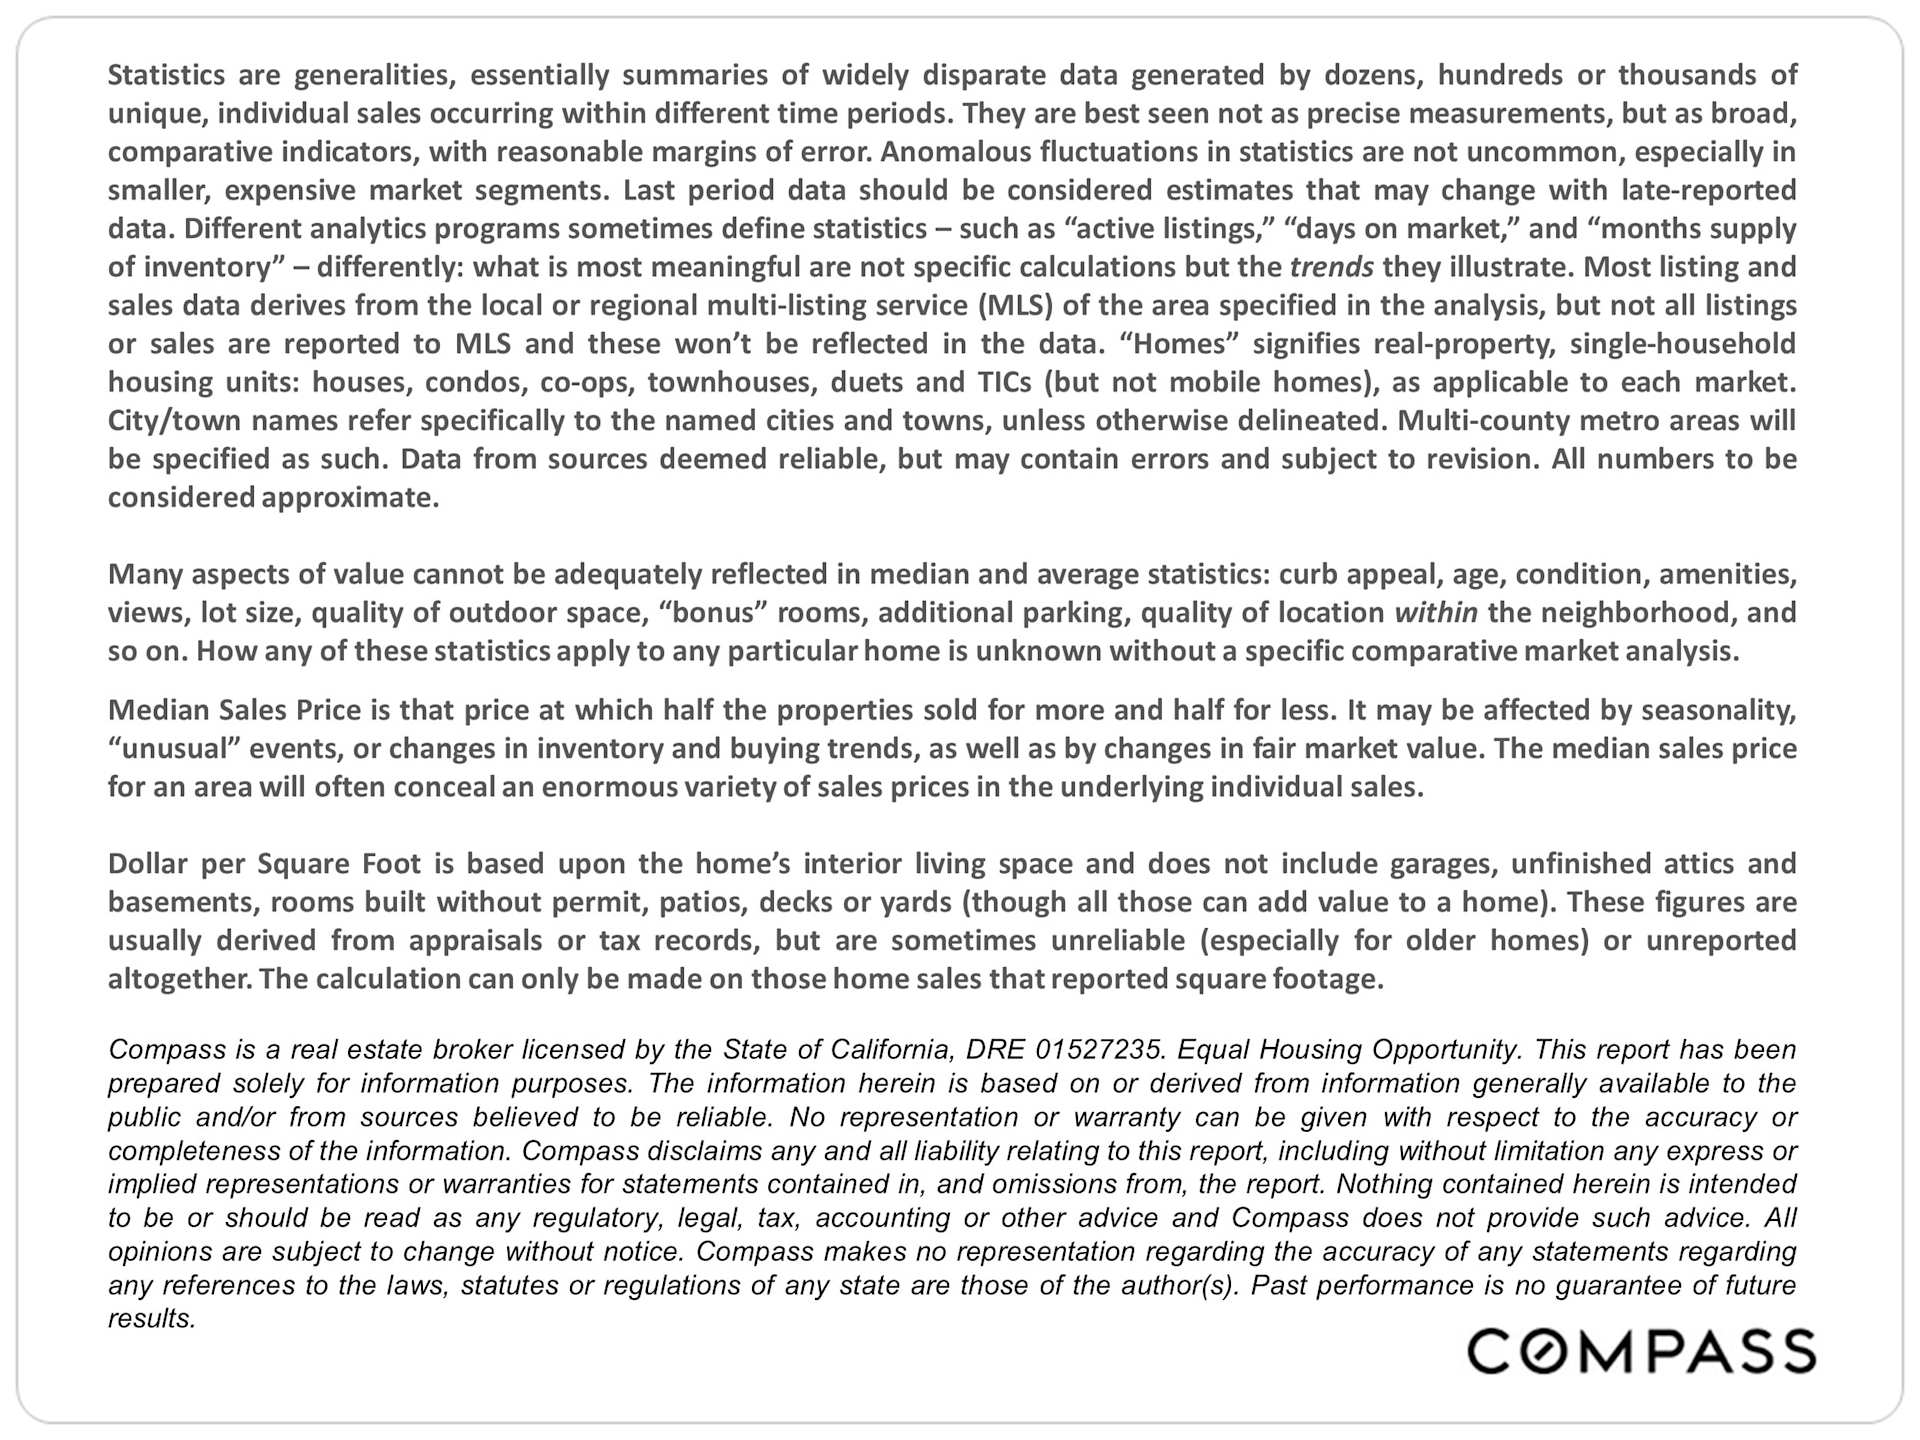
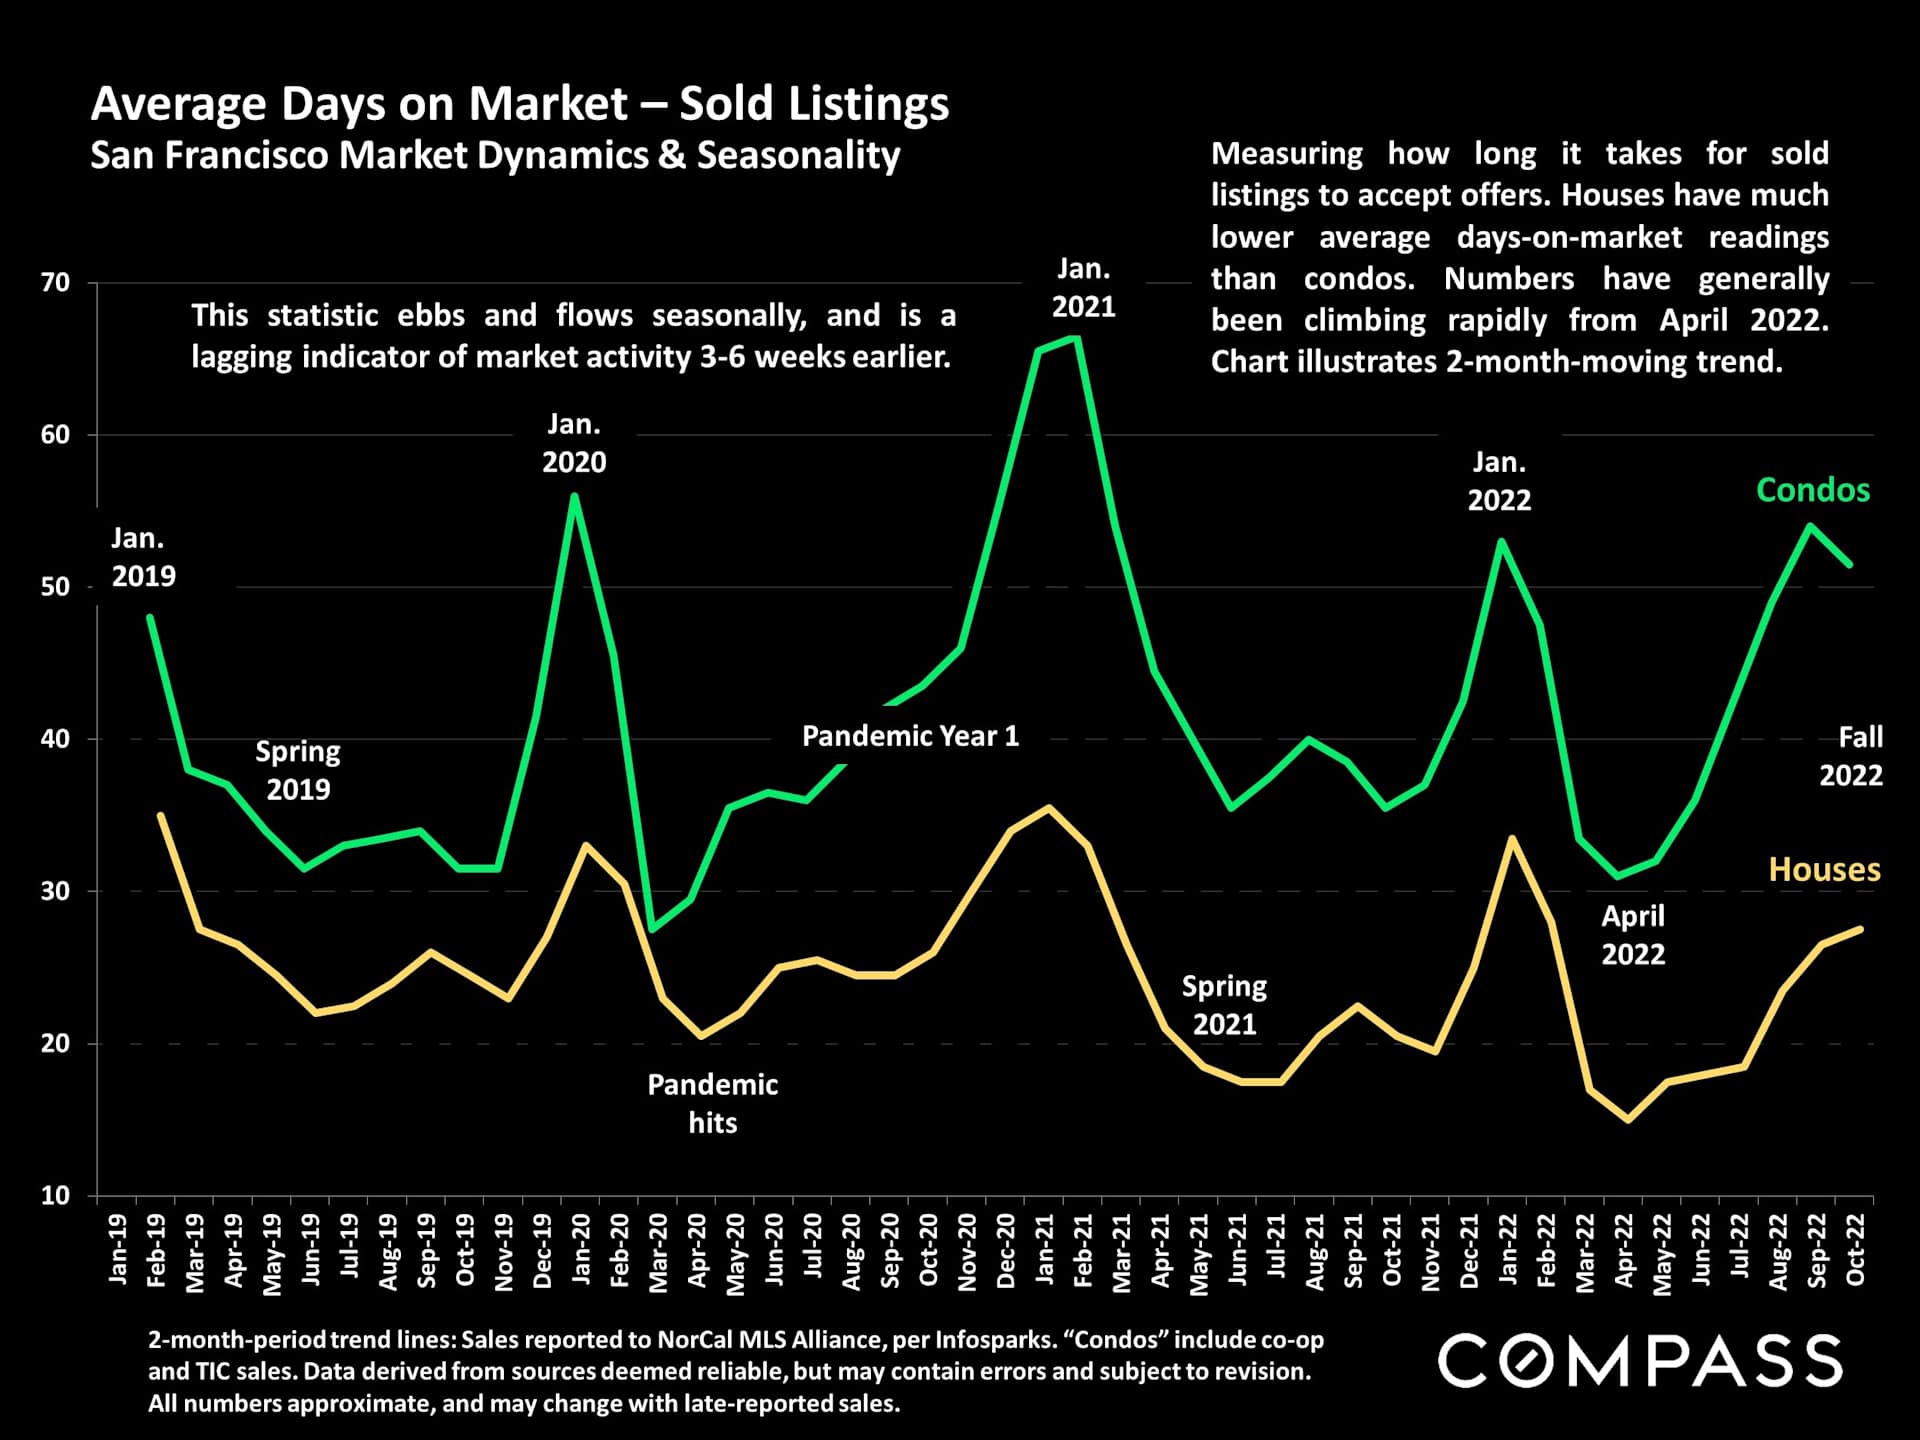
San Francisco housing market report on October 2022 sales and seasonal real estate trends.Chart of San Francisco house prices since 1990, showing the October 2022 median at $1.65 million.Chart of San Francisco two-bedroom condo prices since 2005, showing a $1.25 million median in October 2022.San Francisco two-bedroom condo sales statistics by neighborhood for summer–fall 2022.Chart comparing monthly San Francisco home sales in 2021 and 2022, with 2022 sales down 38% in October.Chart of San Francisco monthly home sales from 2019 to 2022, with seasonal and pandemic trends annotated.San Francisco neighborhood home sales statistics for the Summer-Fall 2022 market, presented in a detailed table.Chart comparing monthly San Francisco home sales over $3 million in 2021 and 2022; October sales fell 43% year over year.Line chart compares monthly Bay Area home sales over $5 million in 2021 and 2022.Chart of San Francisco home sales over $3 million, showing monthly sales from 2018 to 2022 and seasonal fluctuations.Chart of San Francisco new listings from 2018 to 2022, with seasonal peaks and a marked pandemic impact.Chart of San Francisco active and coming-soon listings, rising to 1,536 in November 2022.Chart of San Francisco active home listings from 2018 to October 2022, with a post-COVID inventory spike.Line chart of San Francisco listings accepting offers from January 2019 through October 2022, with seasonal and pandemic annotations.Chart of monthly active-listing price reductions from January 2018 to October 2022, with a sharp increase in October 2022.Chart of mortgage rates from 1976 to 2022, with rates peaking in 1981 and rising sharply in 2022.San Francisco inventory supply by price segment: bar chart ranges from 2.9 months to 17.0 months.San Francisco houses and condos overbidding chart, showing monthly sale-to-list price percentages from 2019 through October 2022.Chart of San Francisco overbidding rates, showing 50% of sales over list price in October 2022, down from 73% in April.San Francisco active listings days-on-market chart, with averages from 48 to 71 days across five price segments.Bar chart of San Francisco active-listing days on market by price segment, ranging from 48 to 71 days.National Association of REALTORS® survey excerpts on home buyers and sellers, with a Compass wordmark.Real estate report notes on statistics, home values, price-per-square-foot calculations, and Compass disclosures.Chart comparing San Francisco house and condo days on market from 2019 to 2022.

Work With Us

We will help you understand the complex aspects of the transaction and share our expertise so that you can make the best decisions possible. We are experienced, market savvy, and energetic. With both of us working for our clients, you get twice the amount of attention and insight.