
The SF Team, Eva + James, Compass

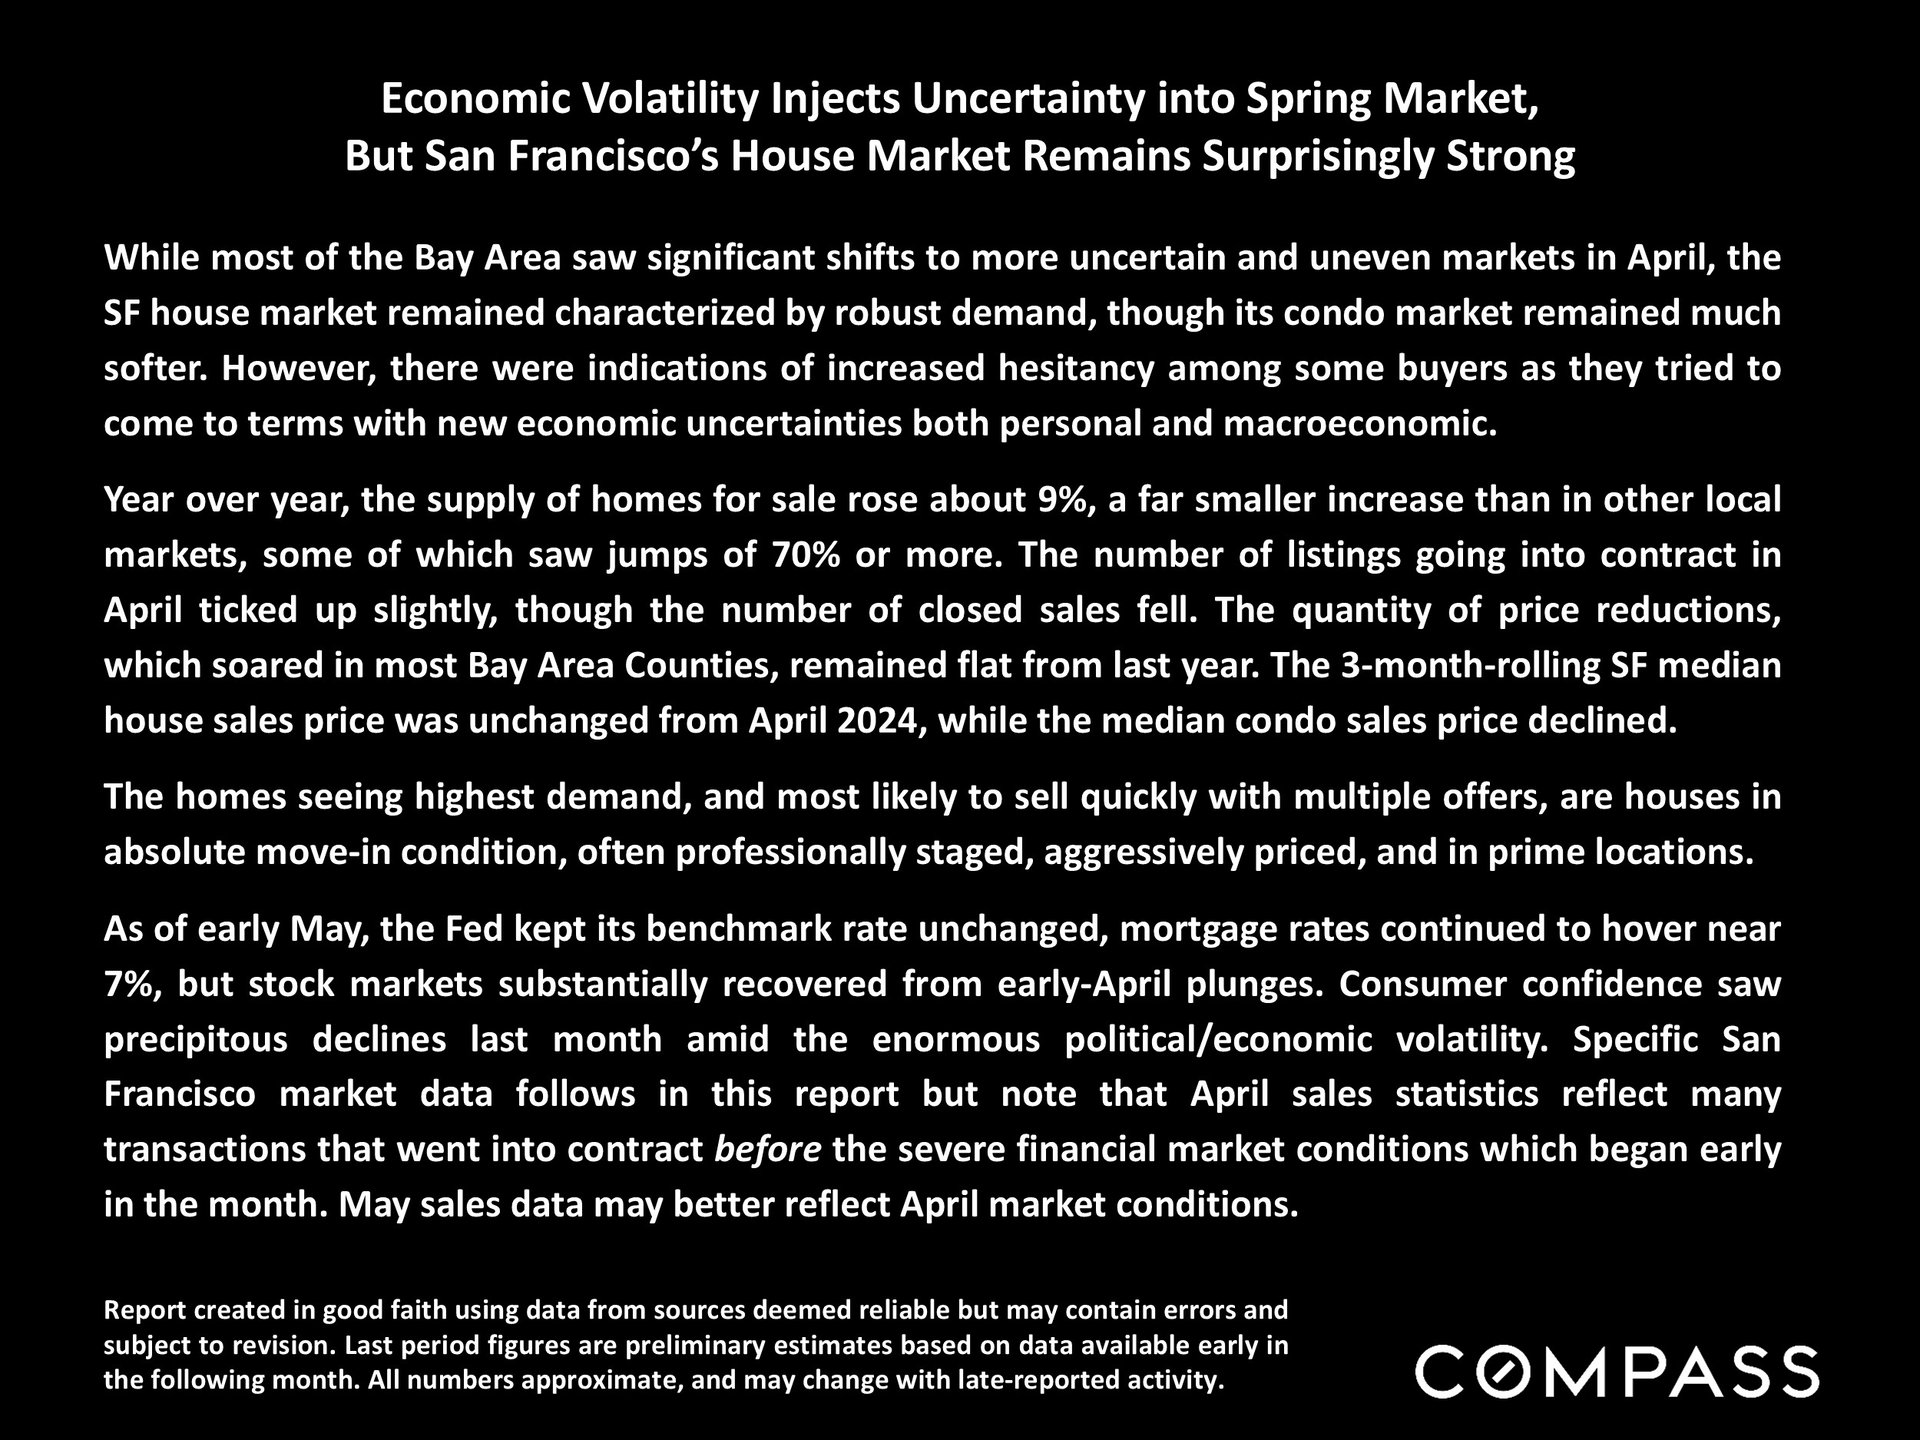
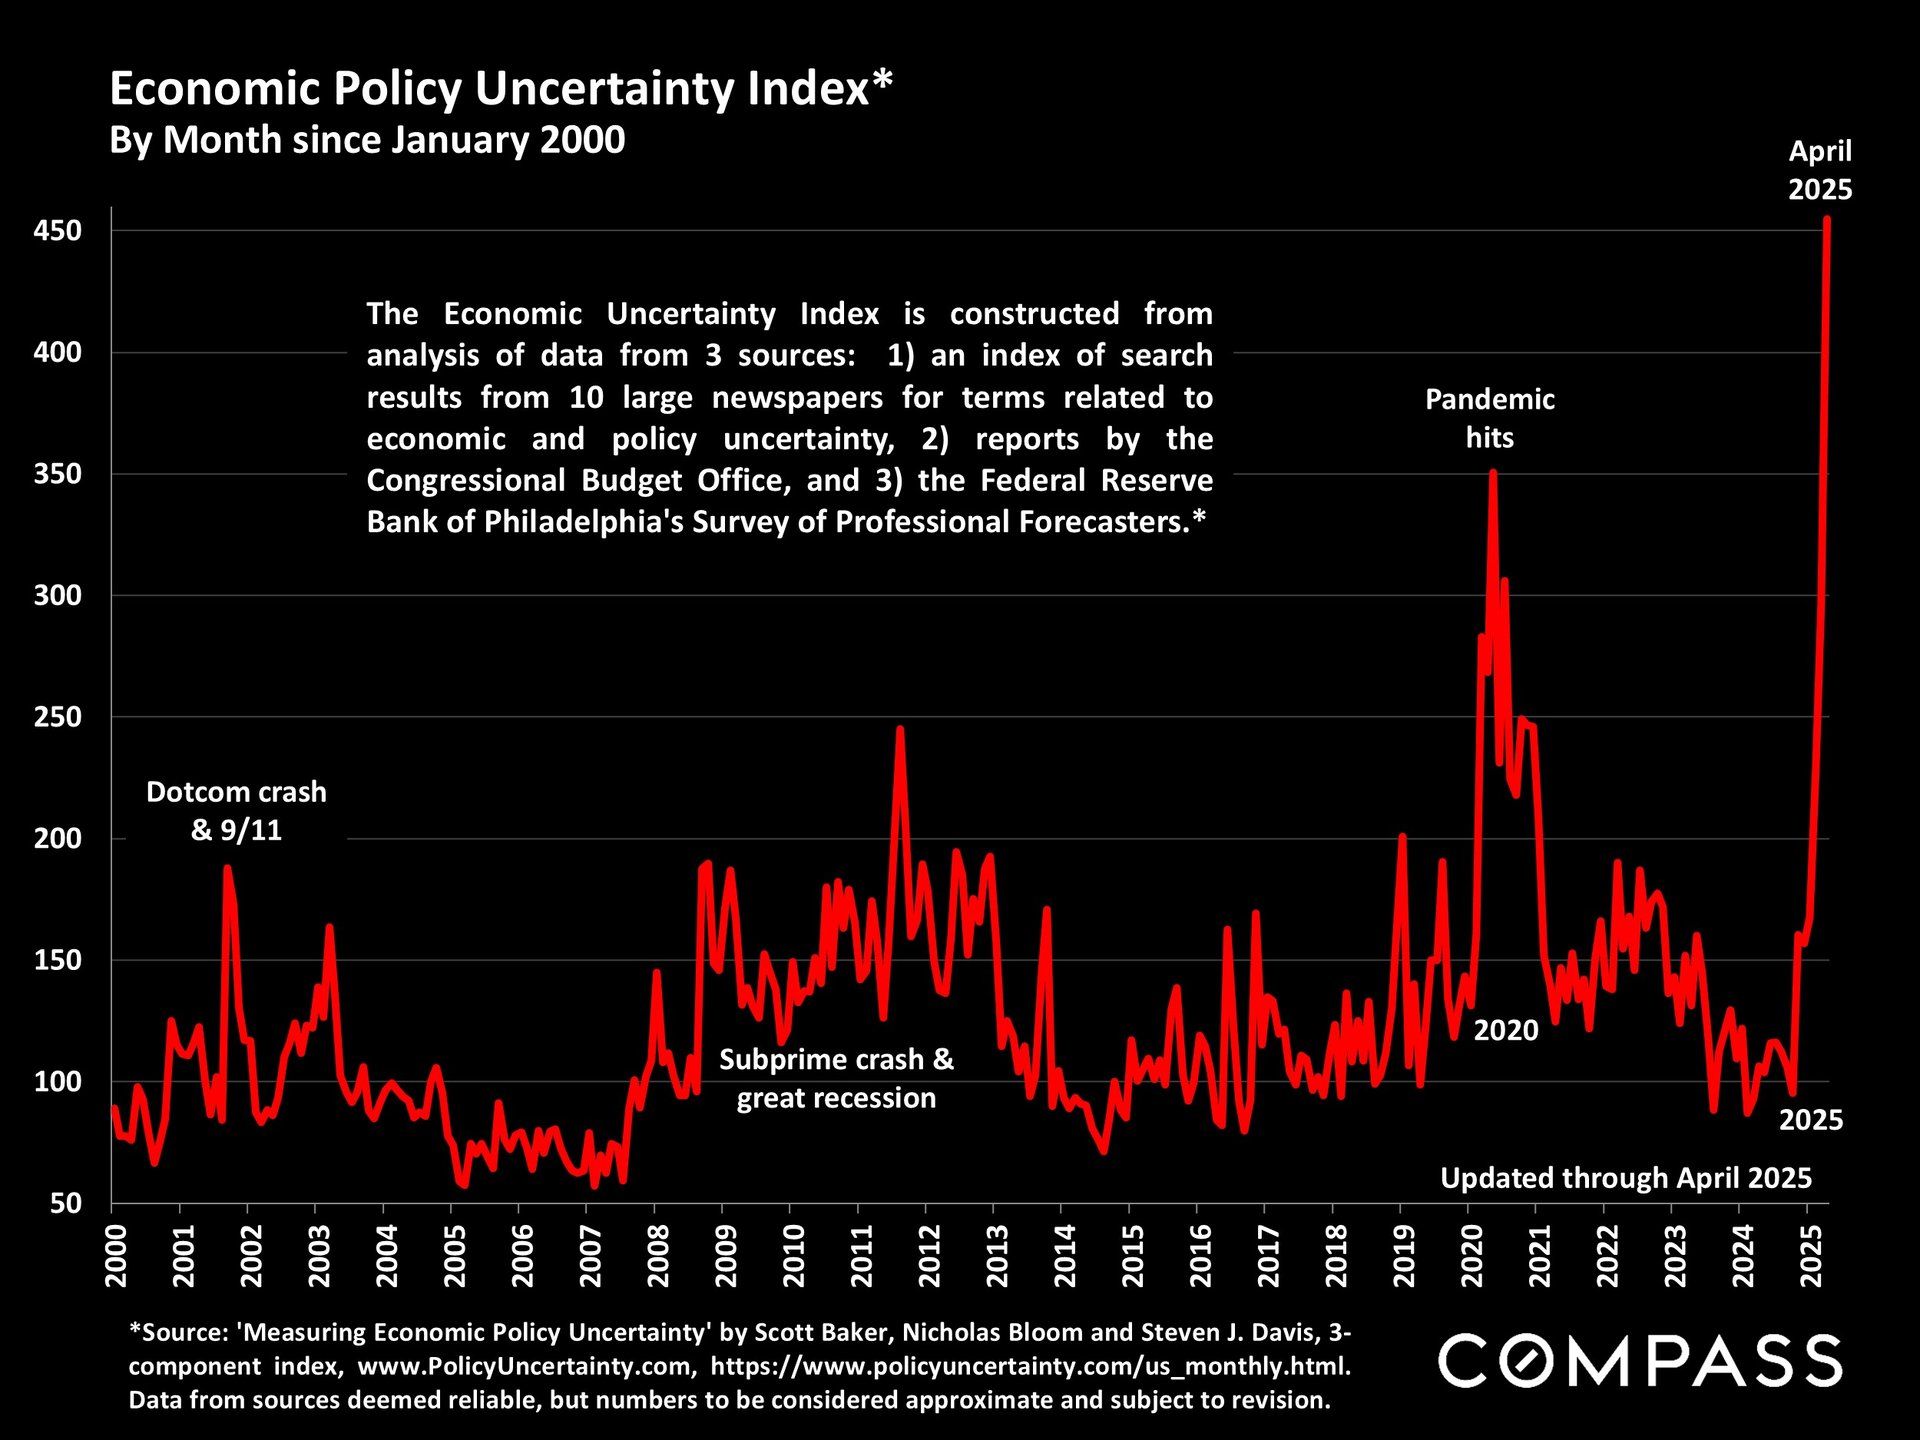
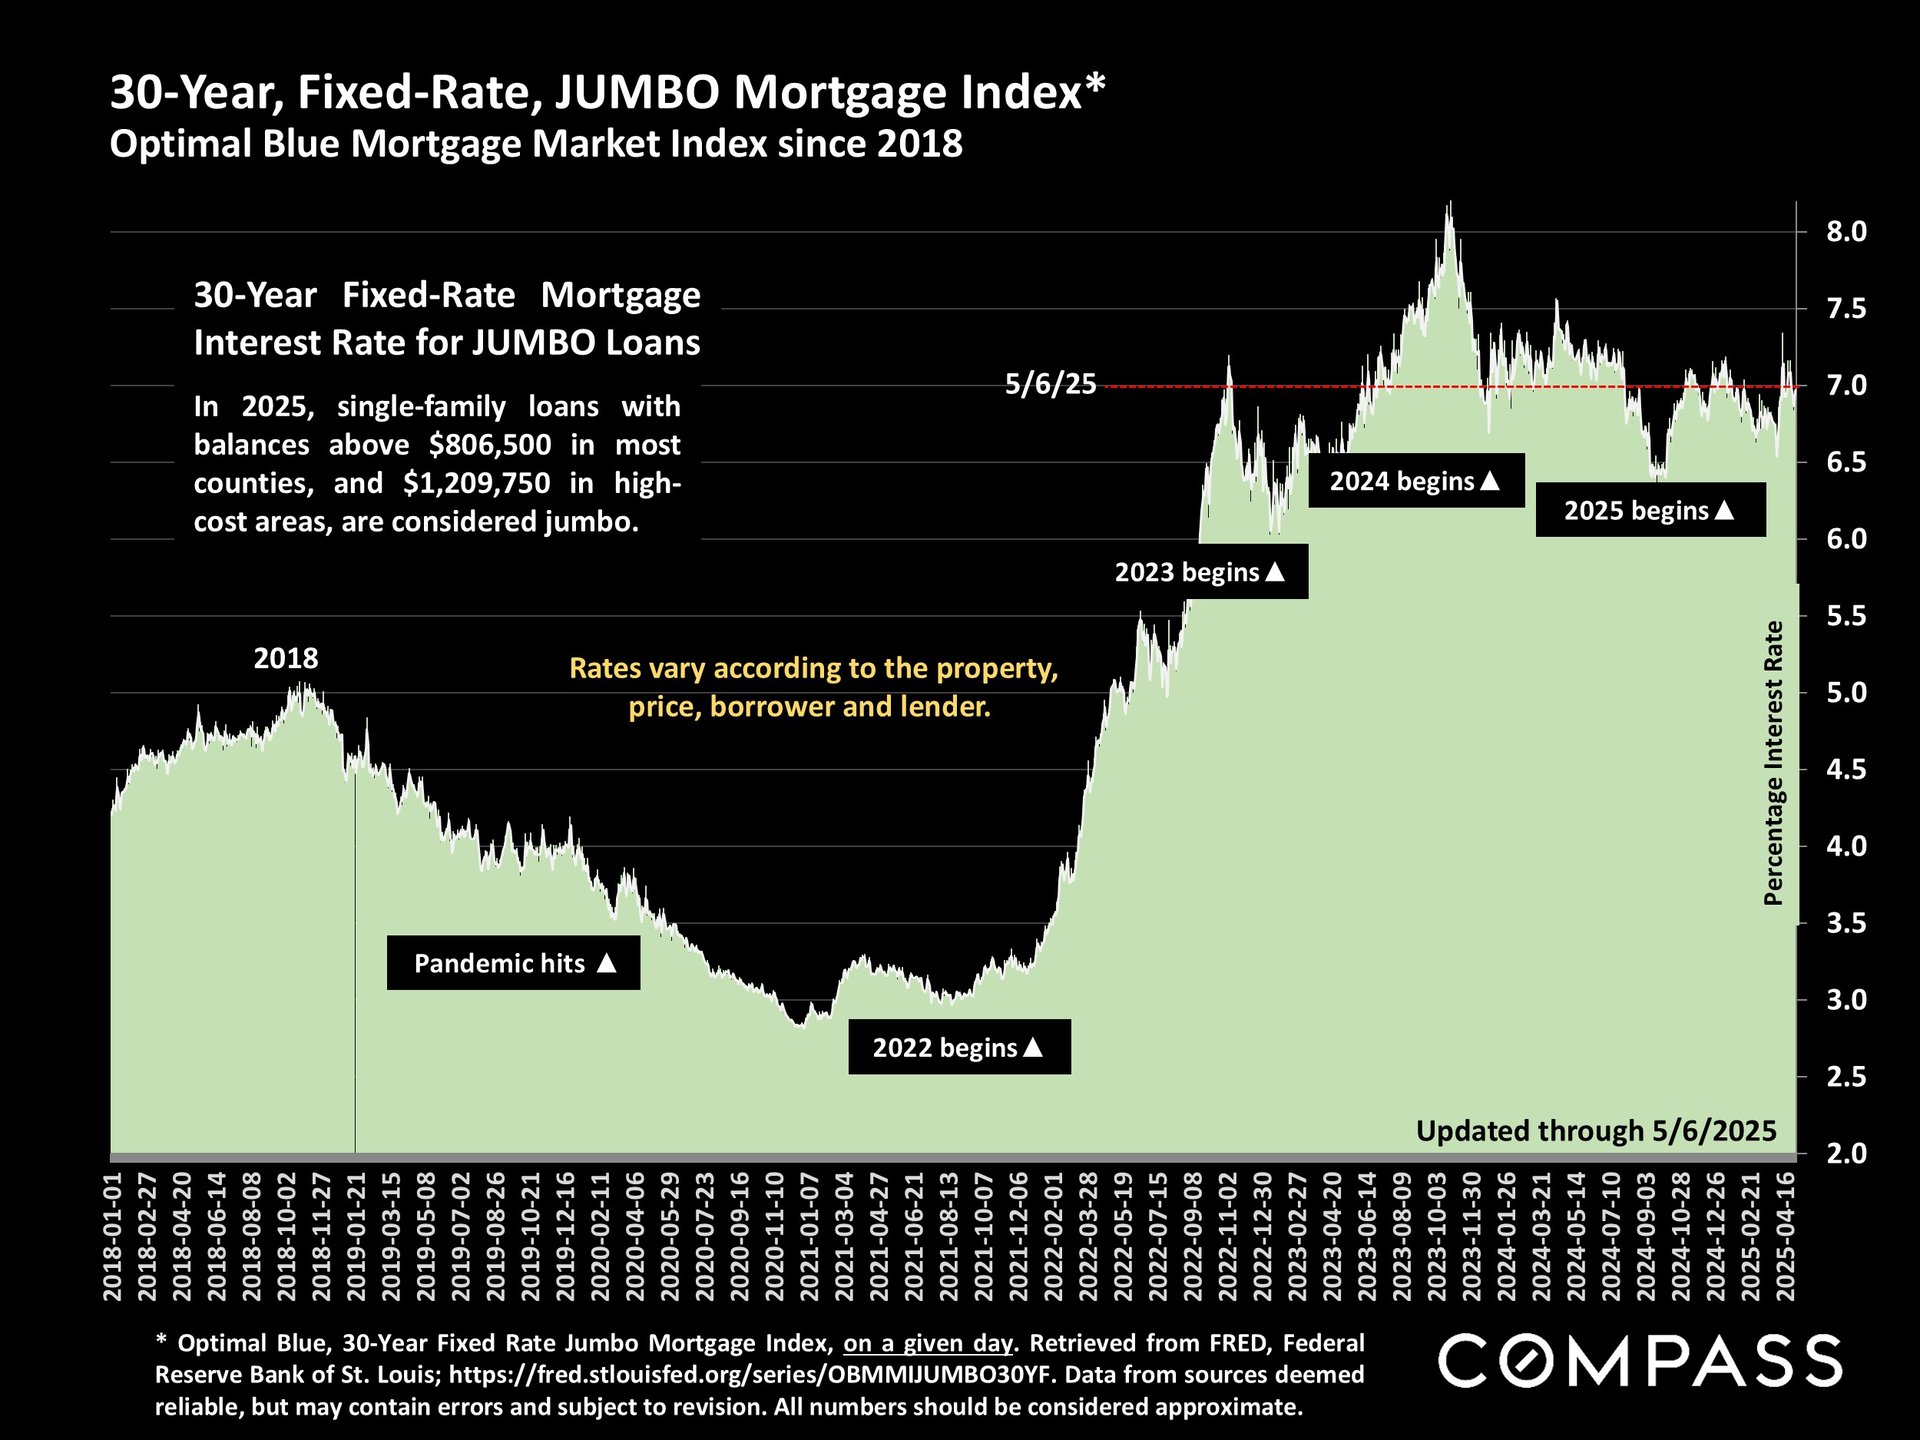
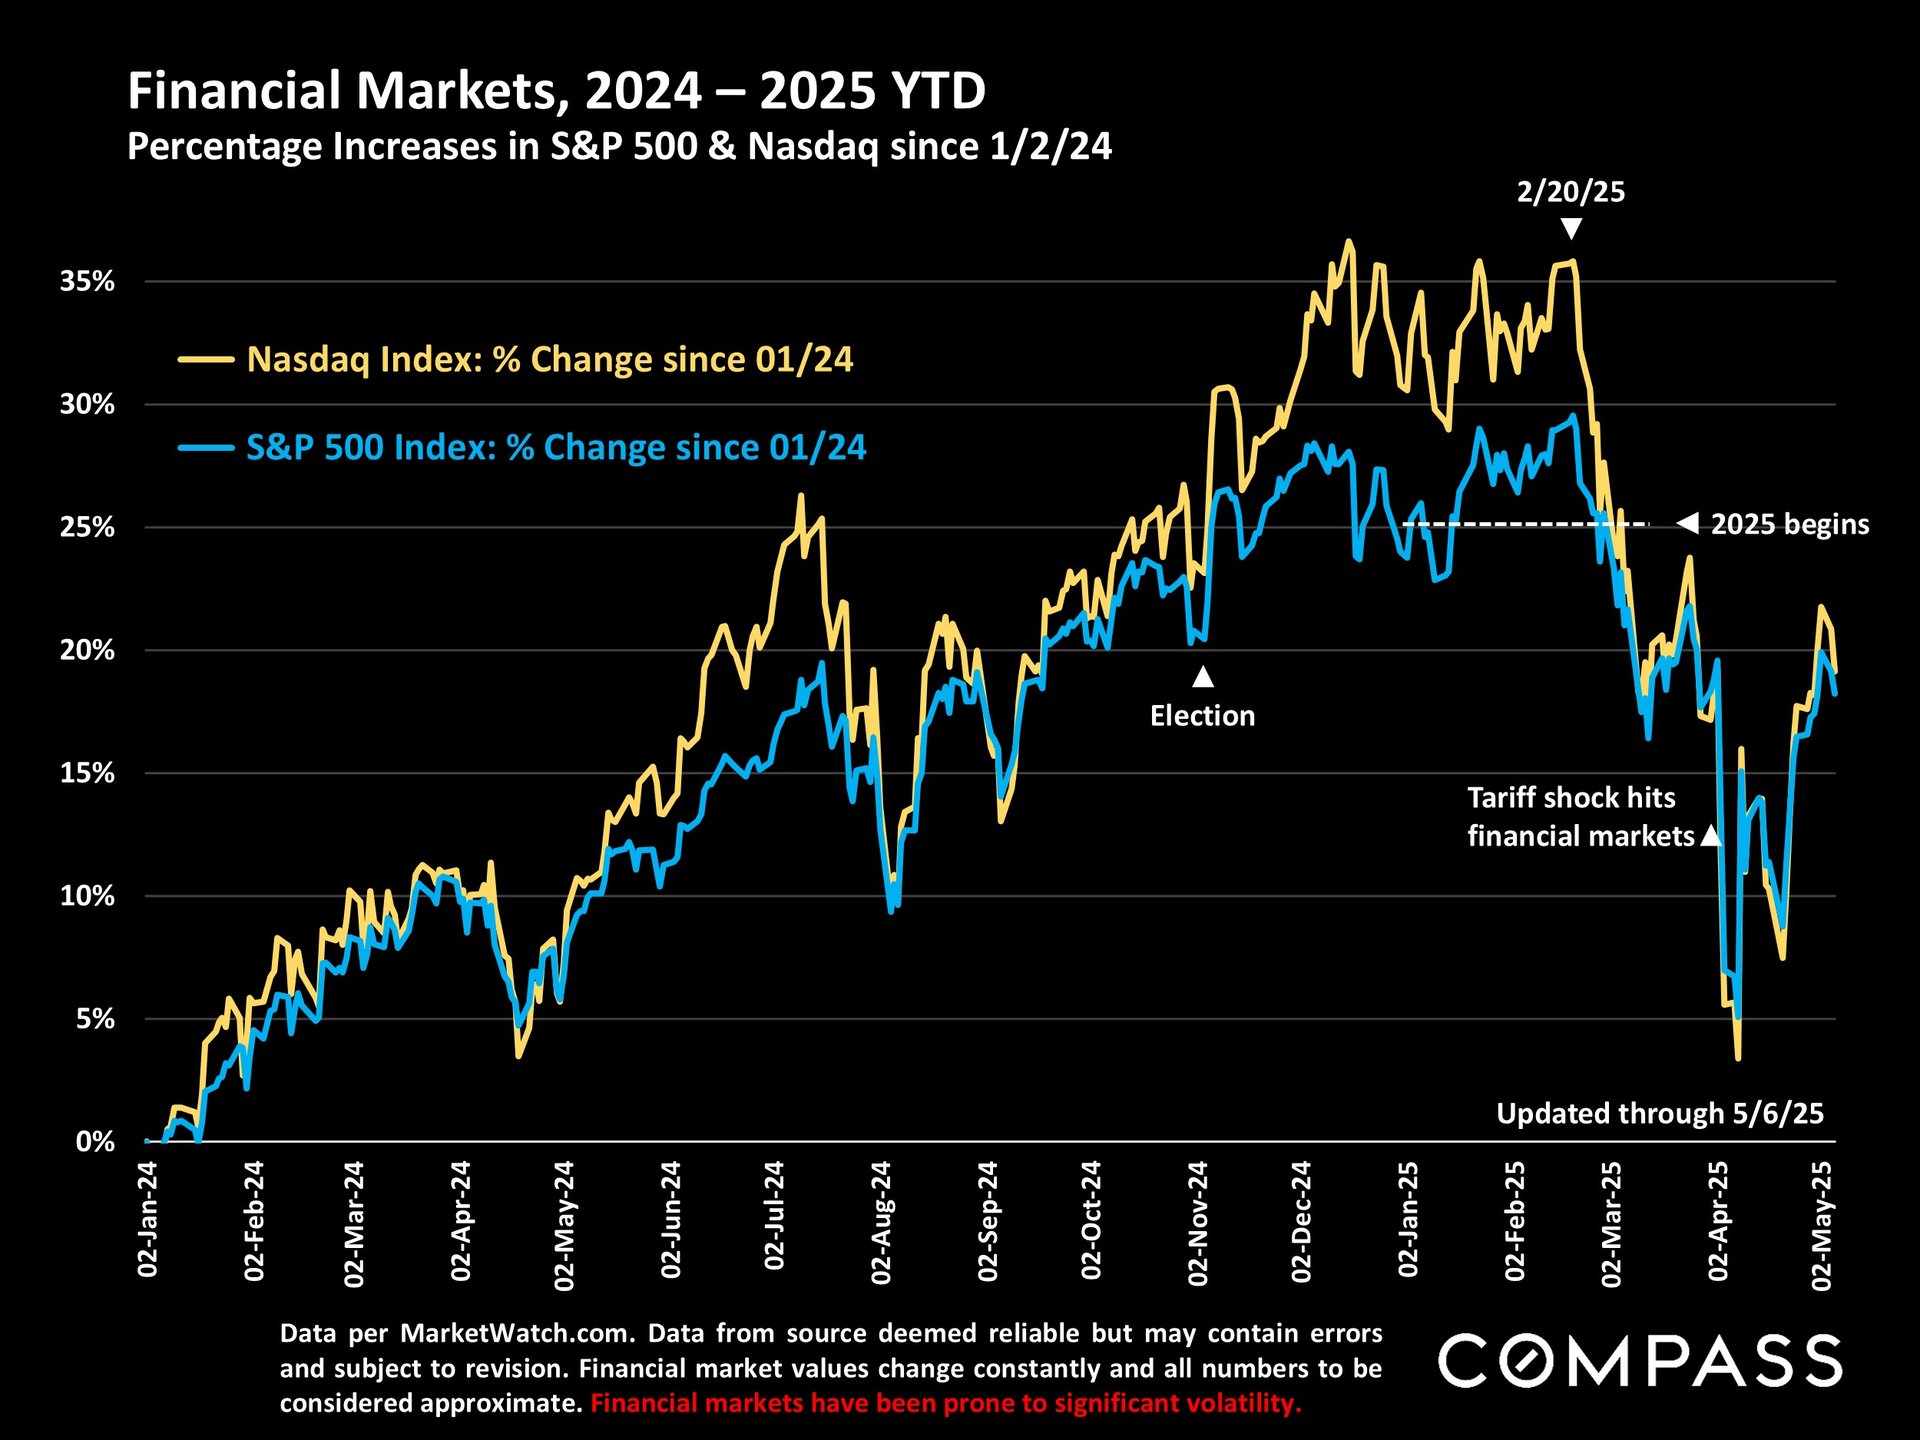
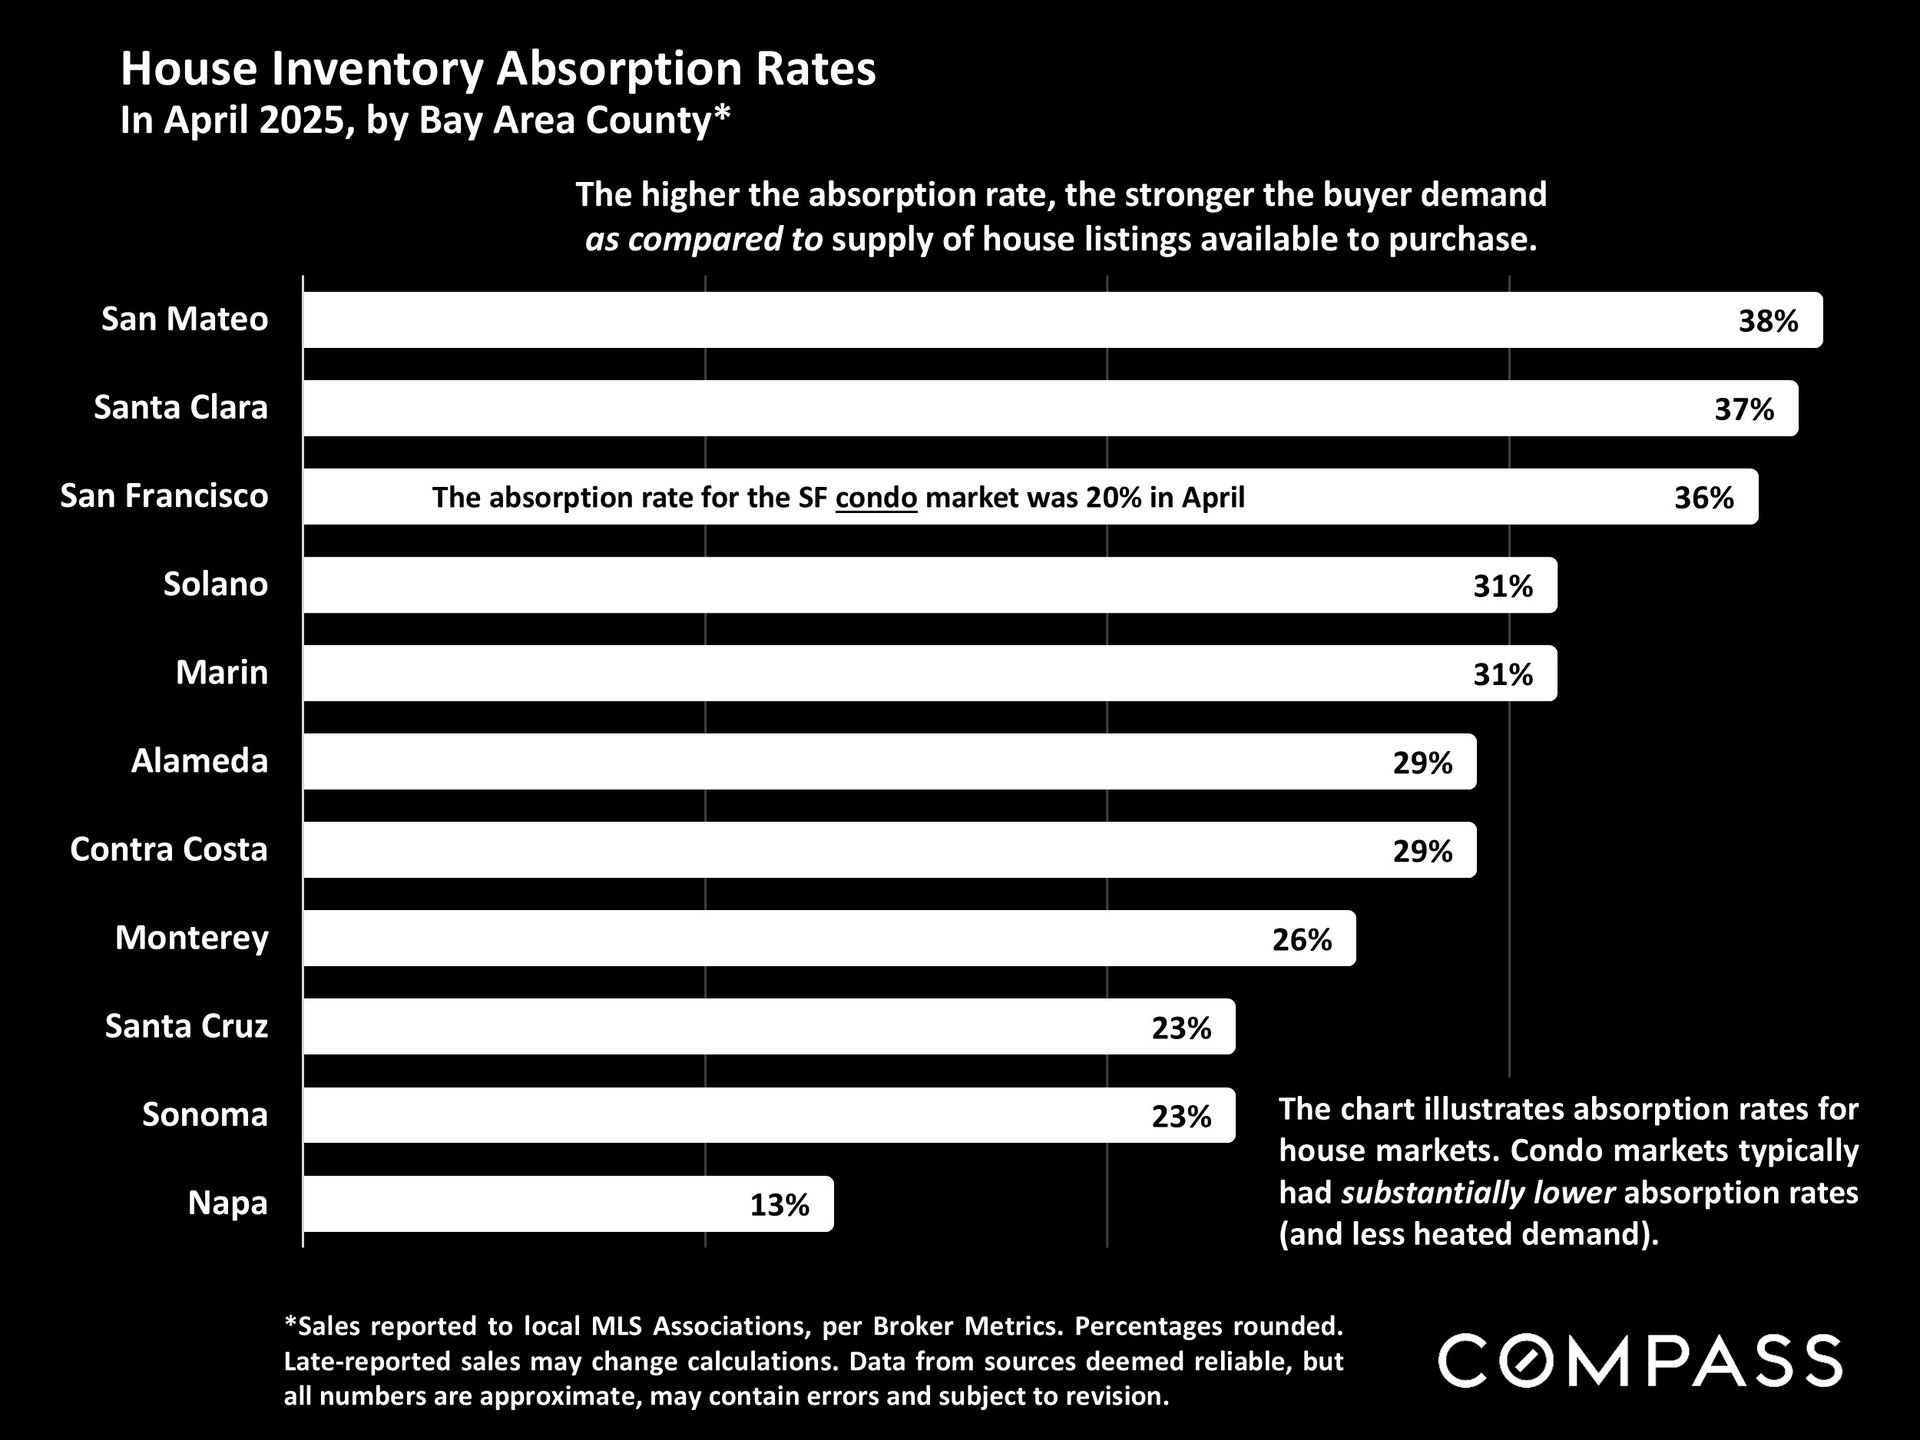
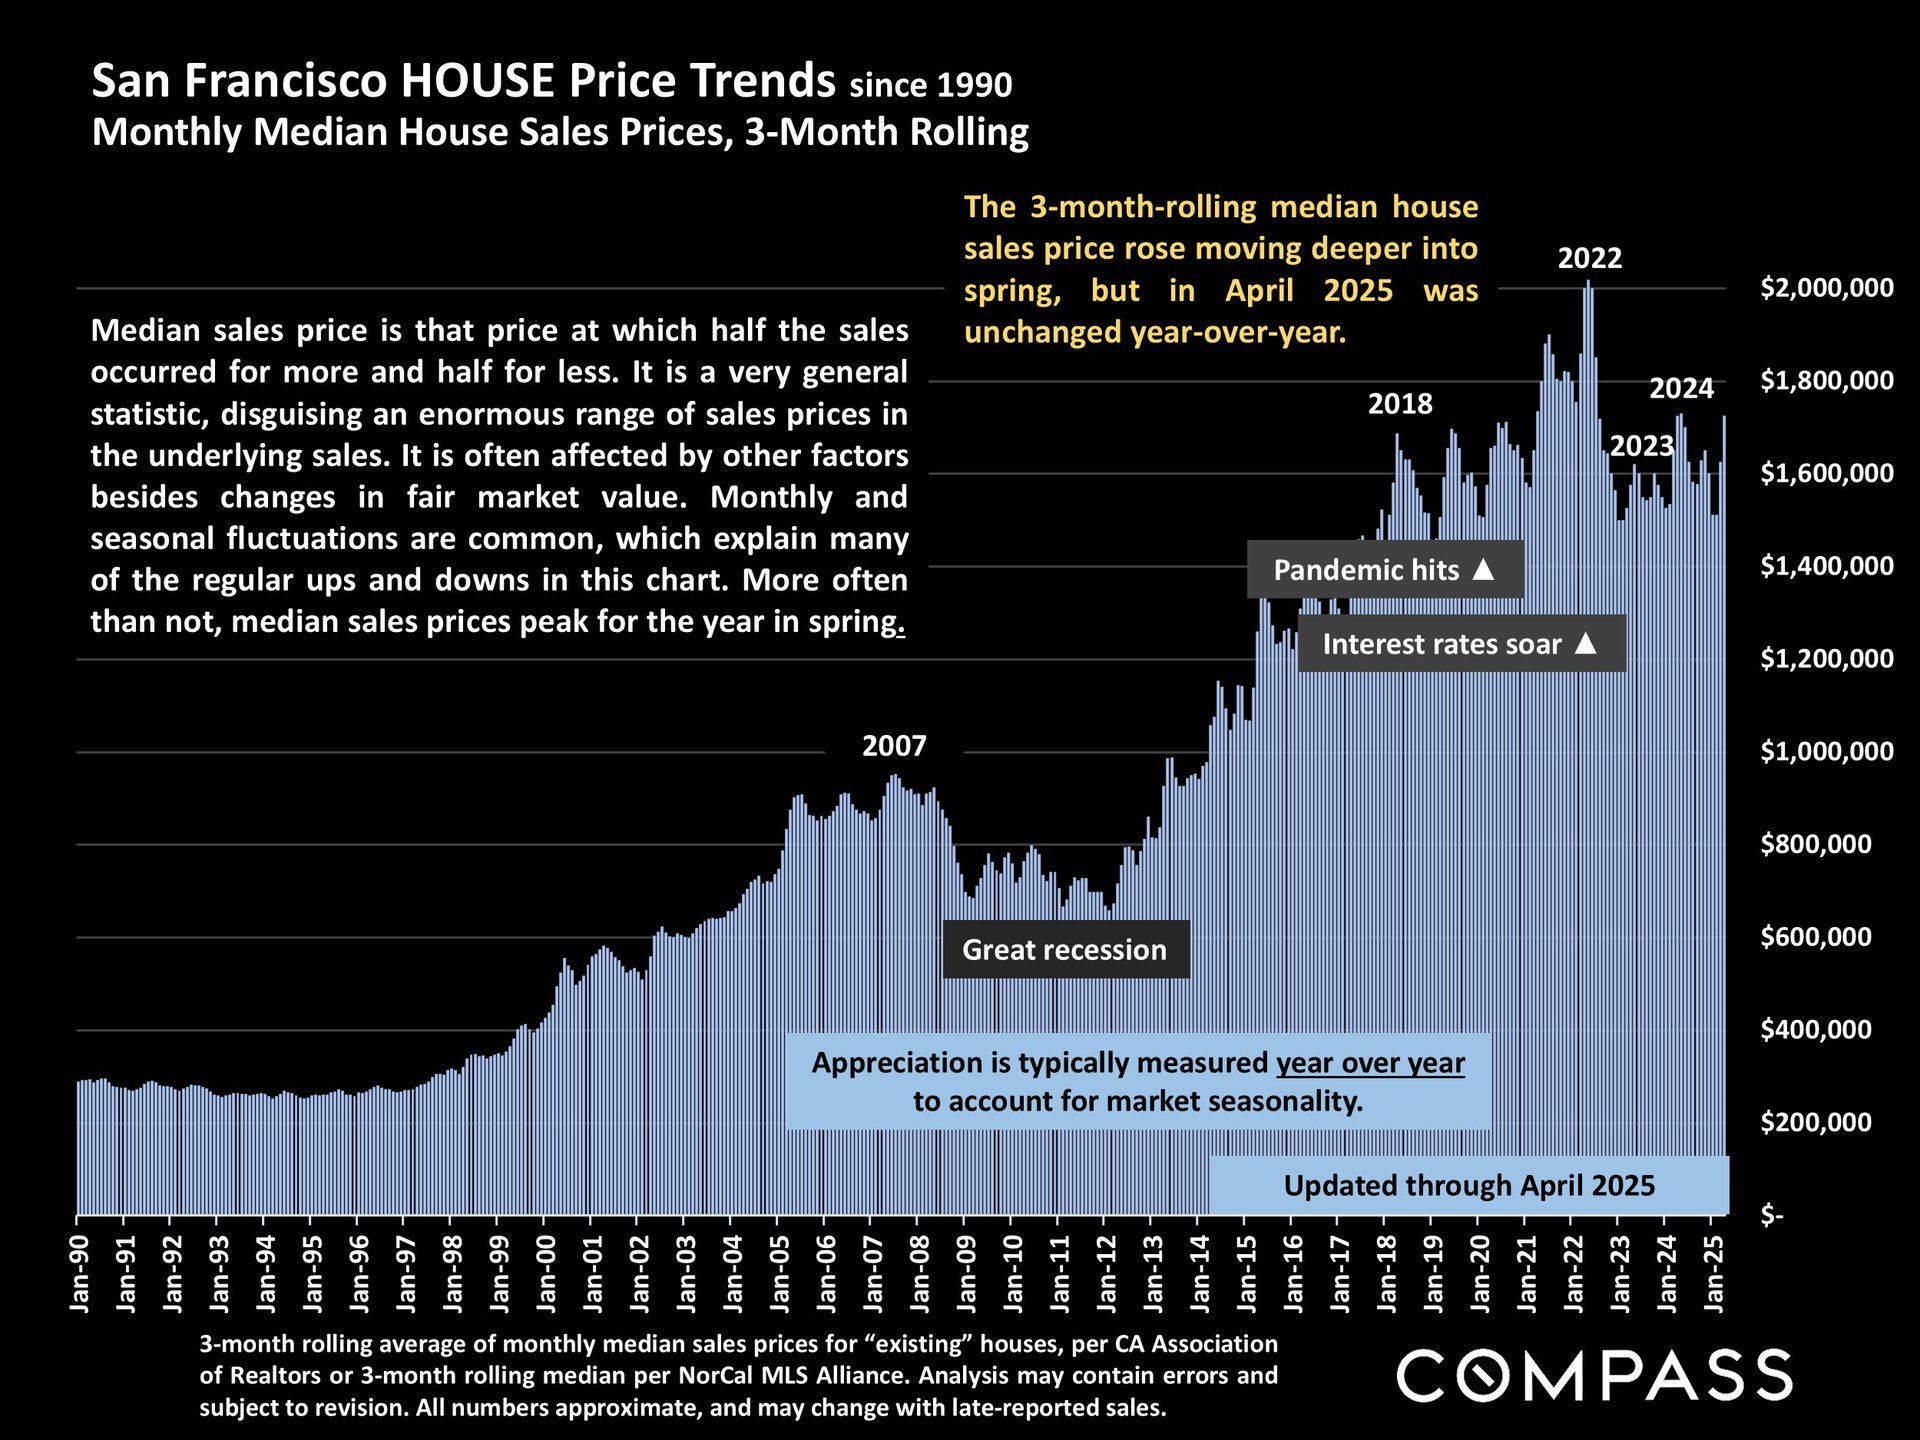
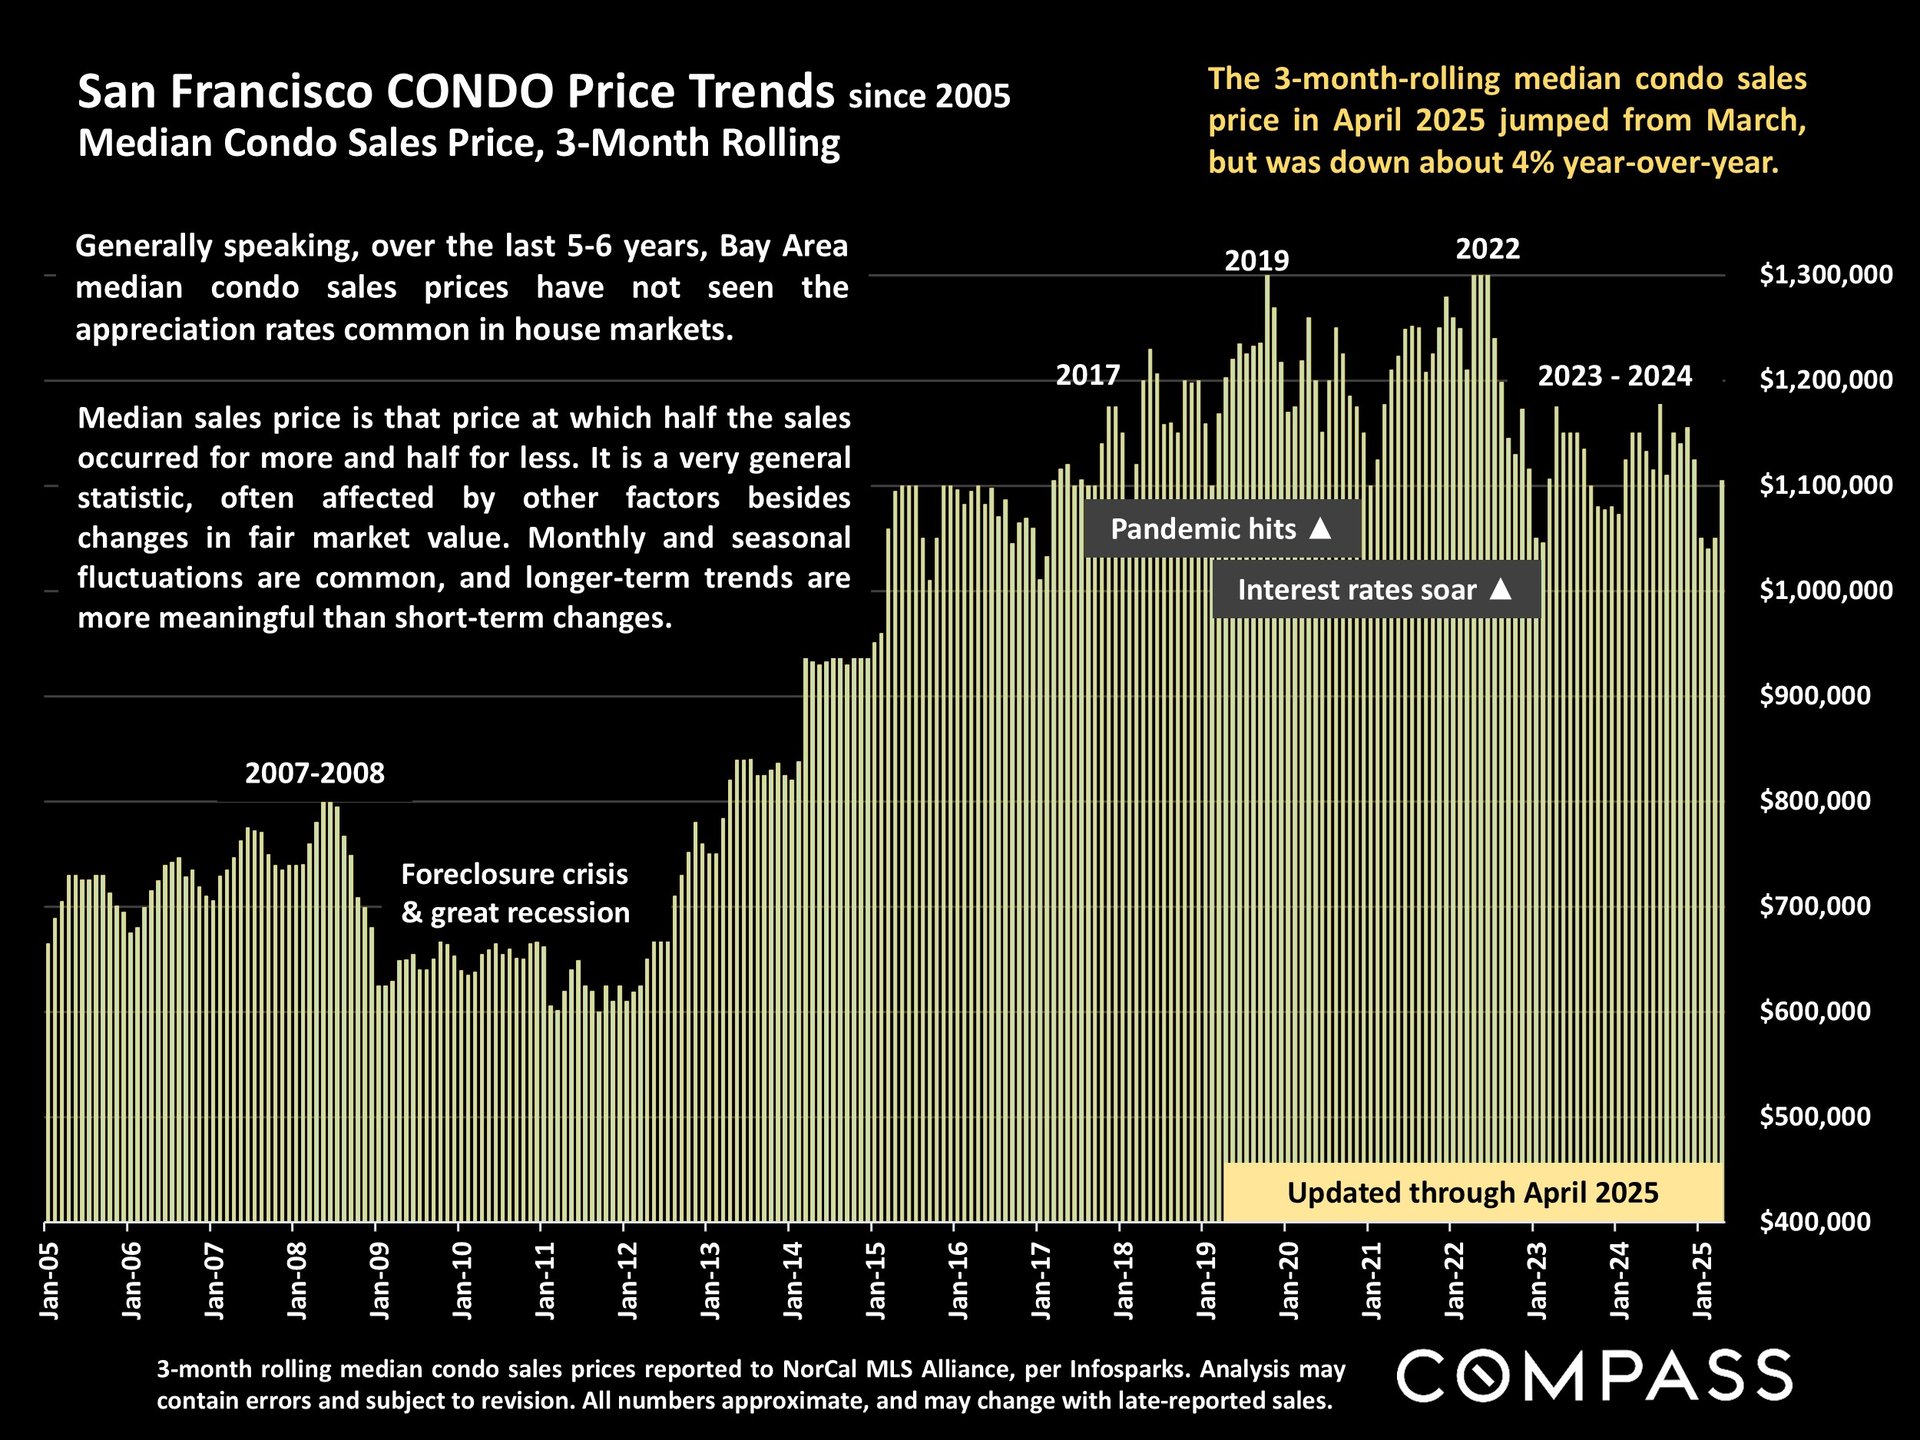
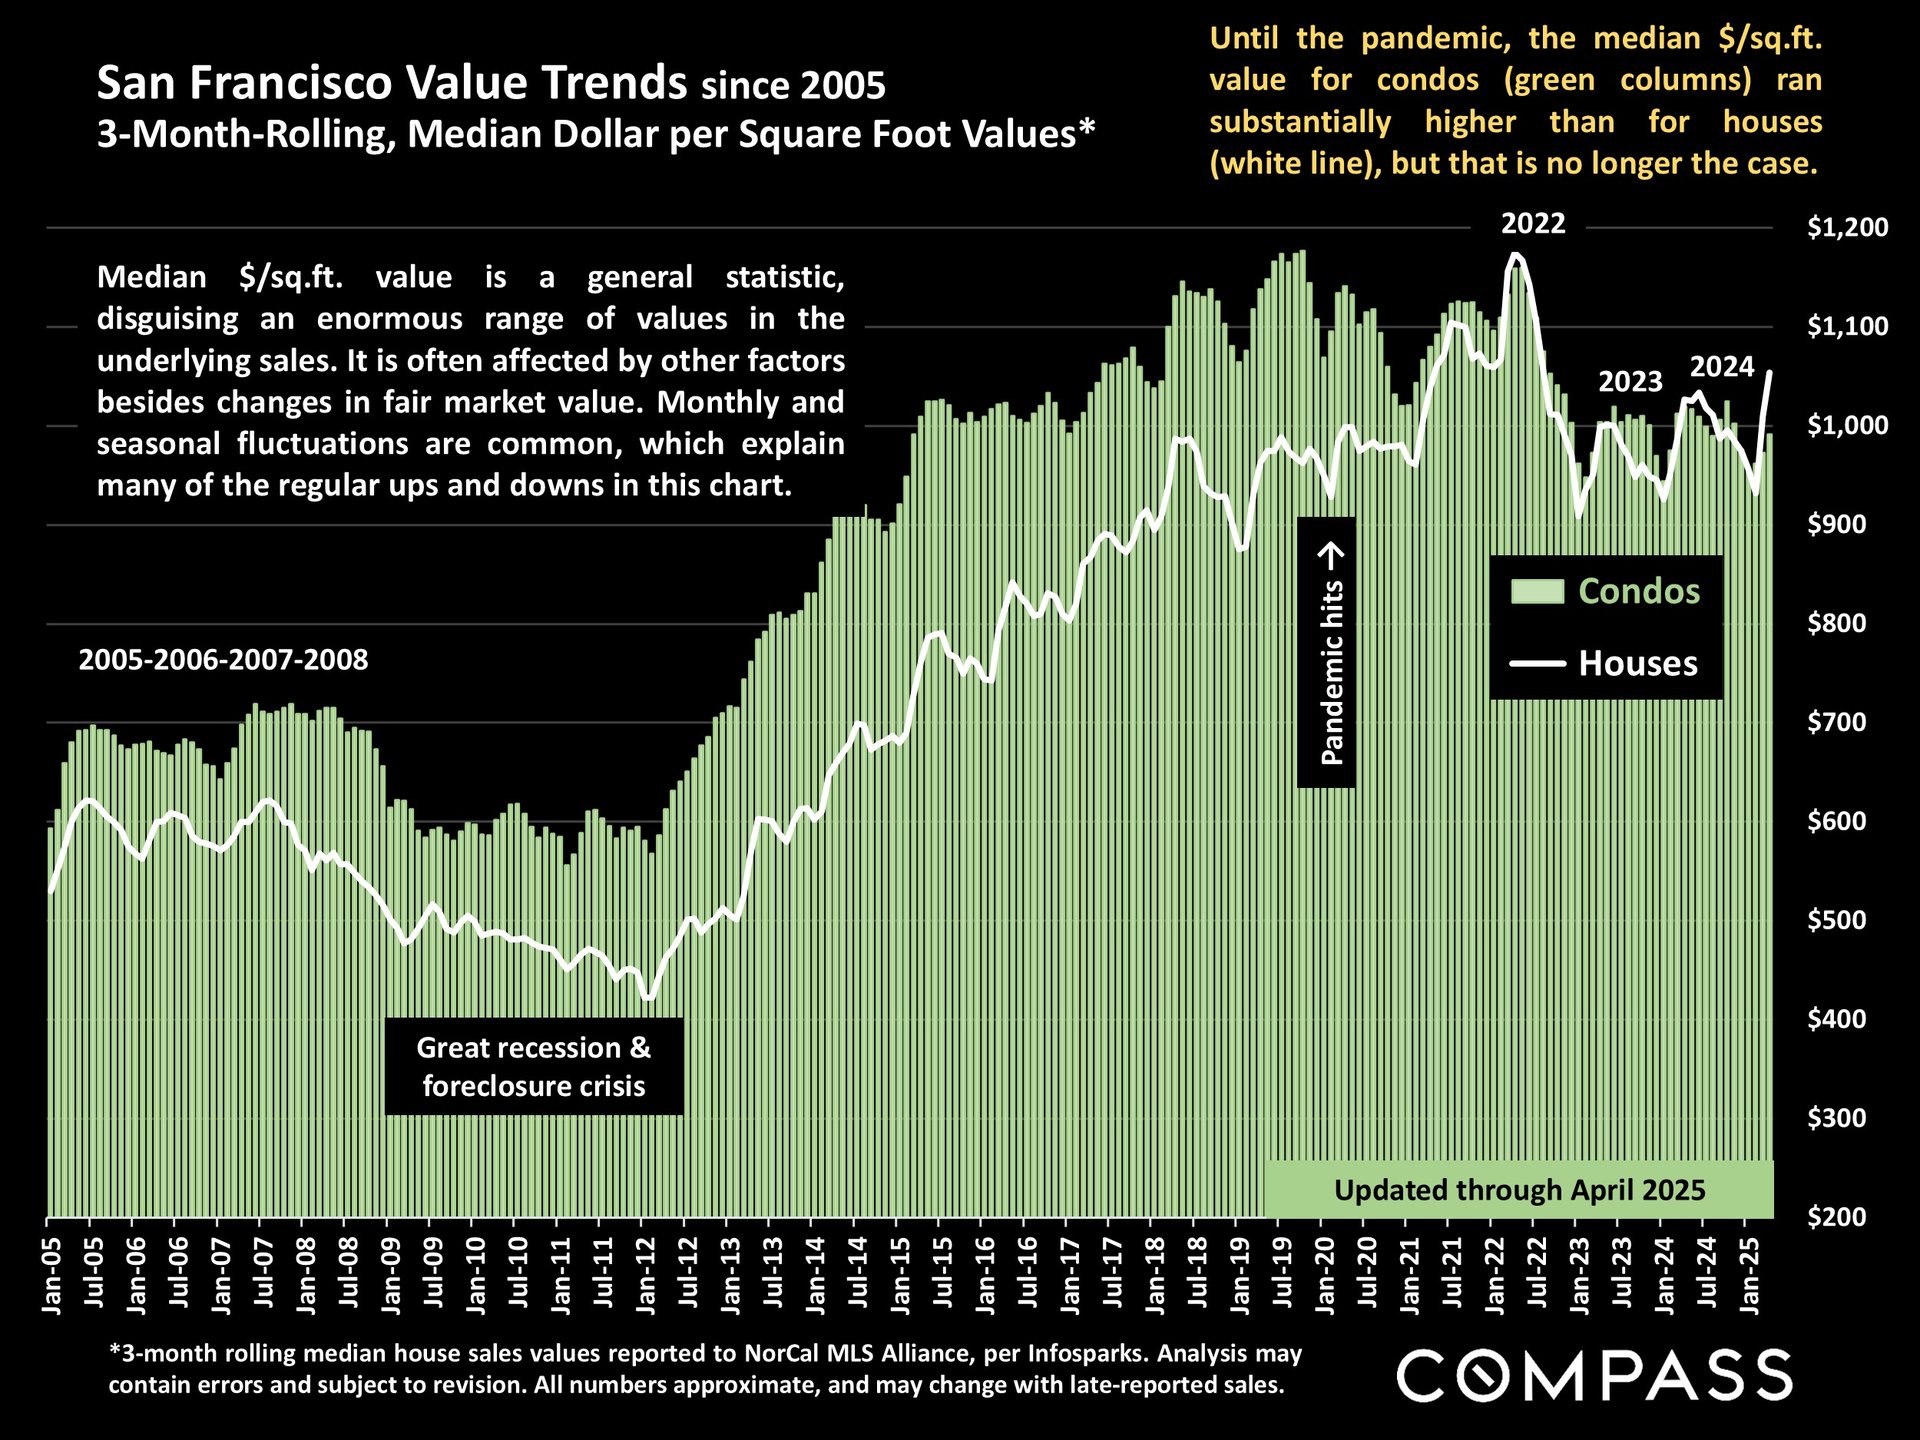
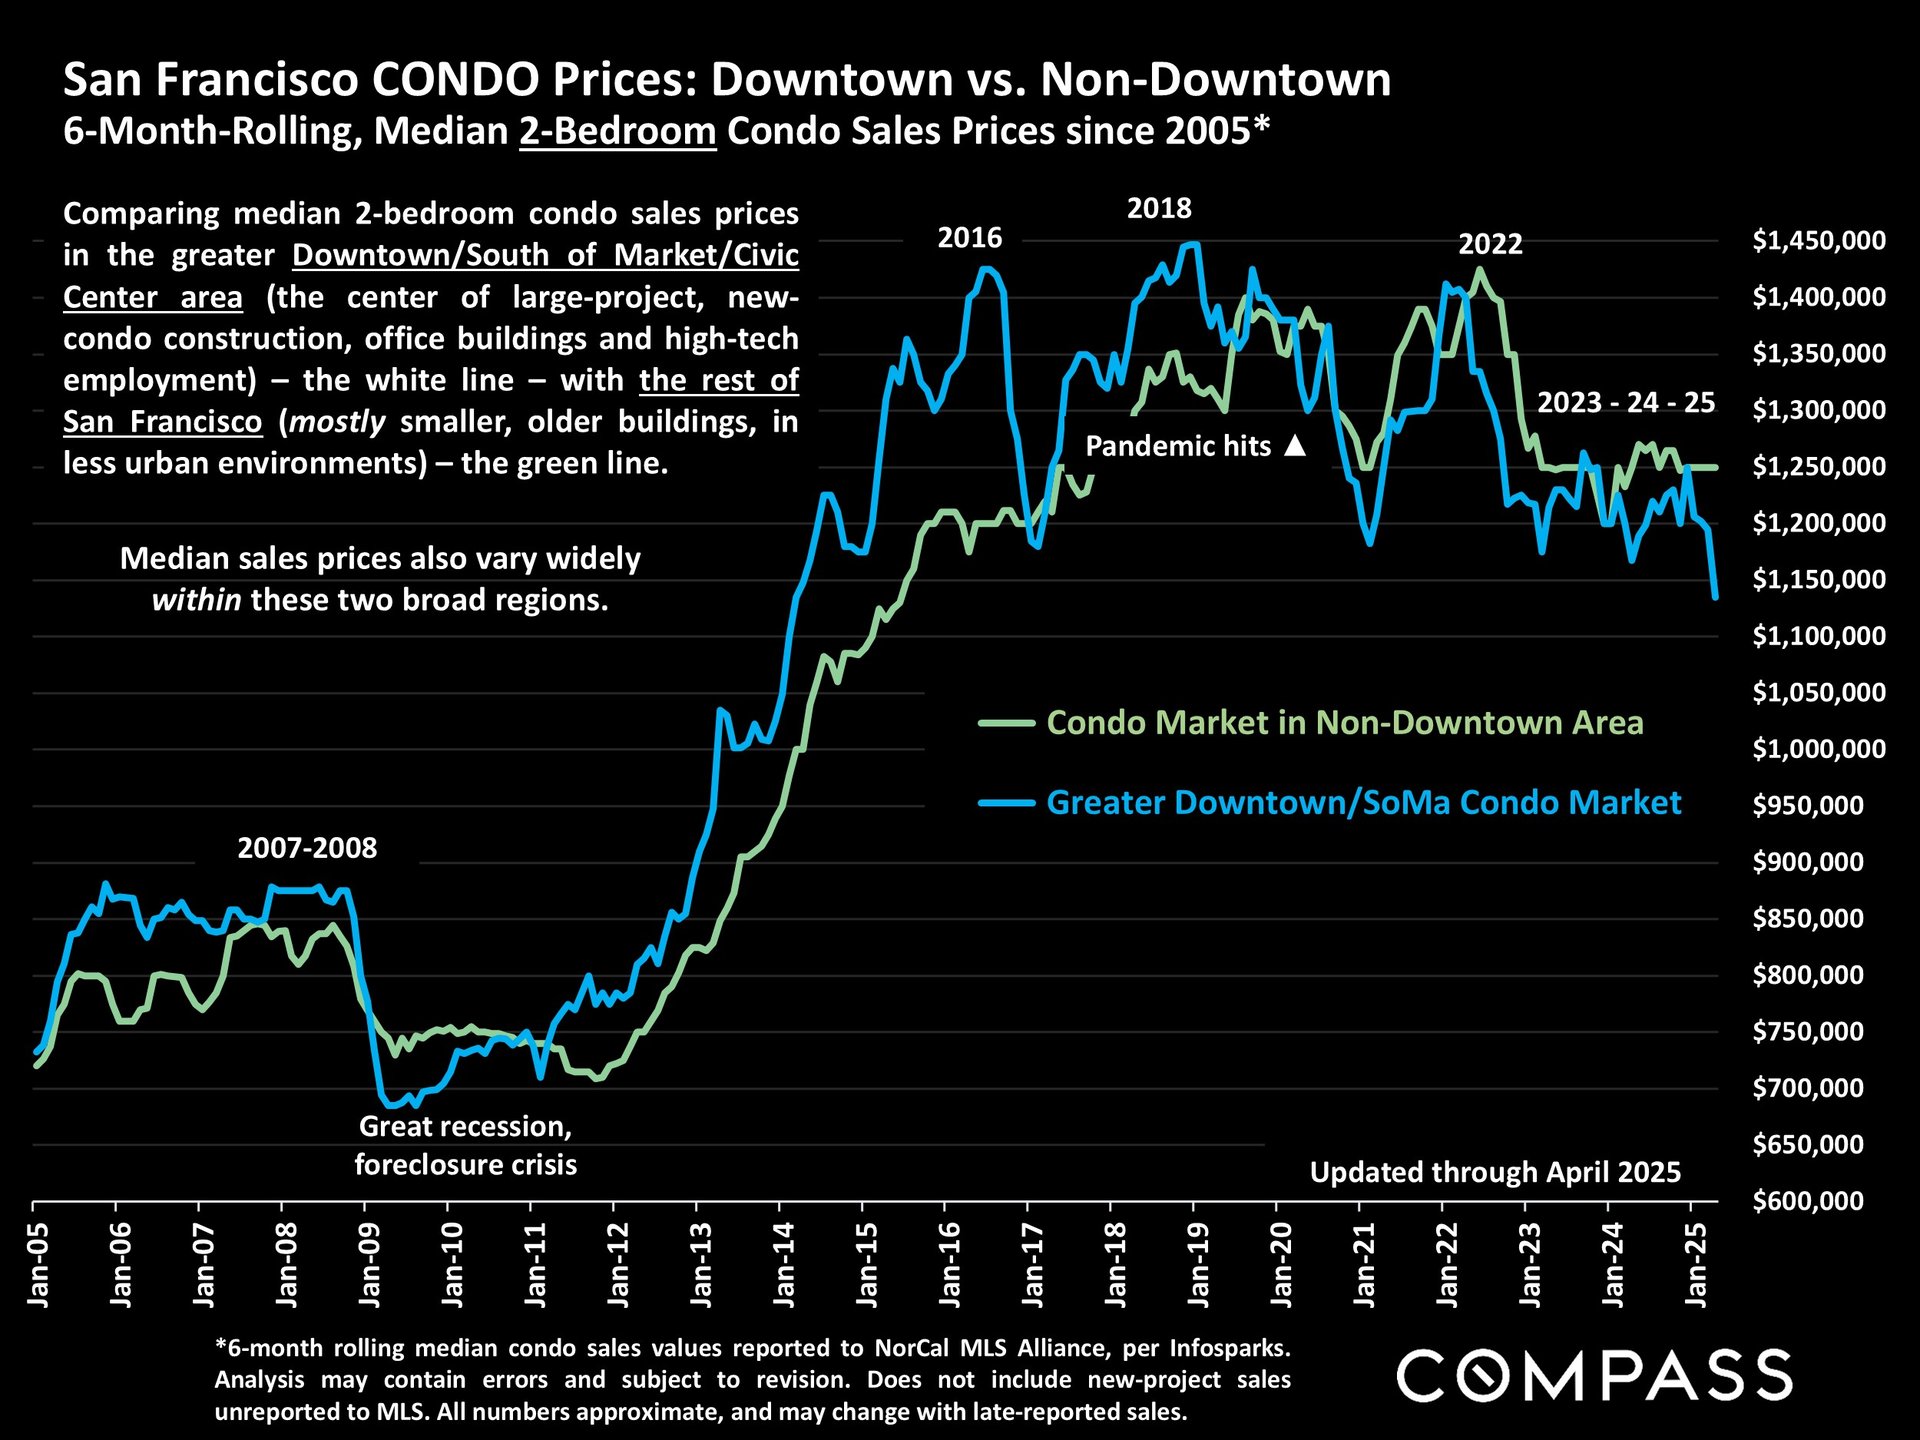
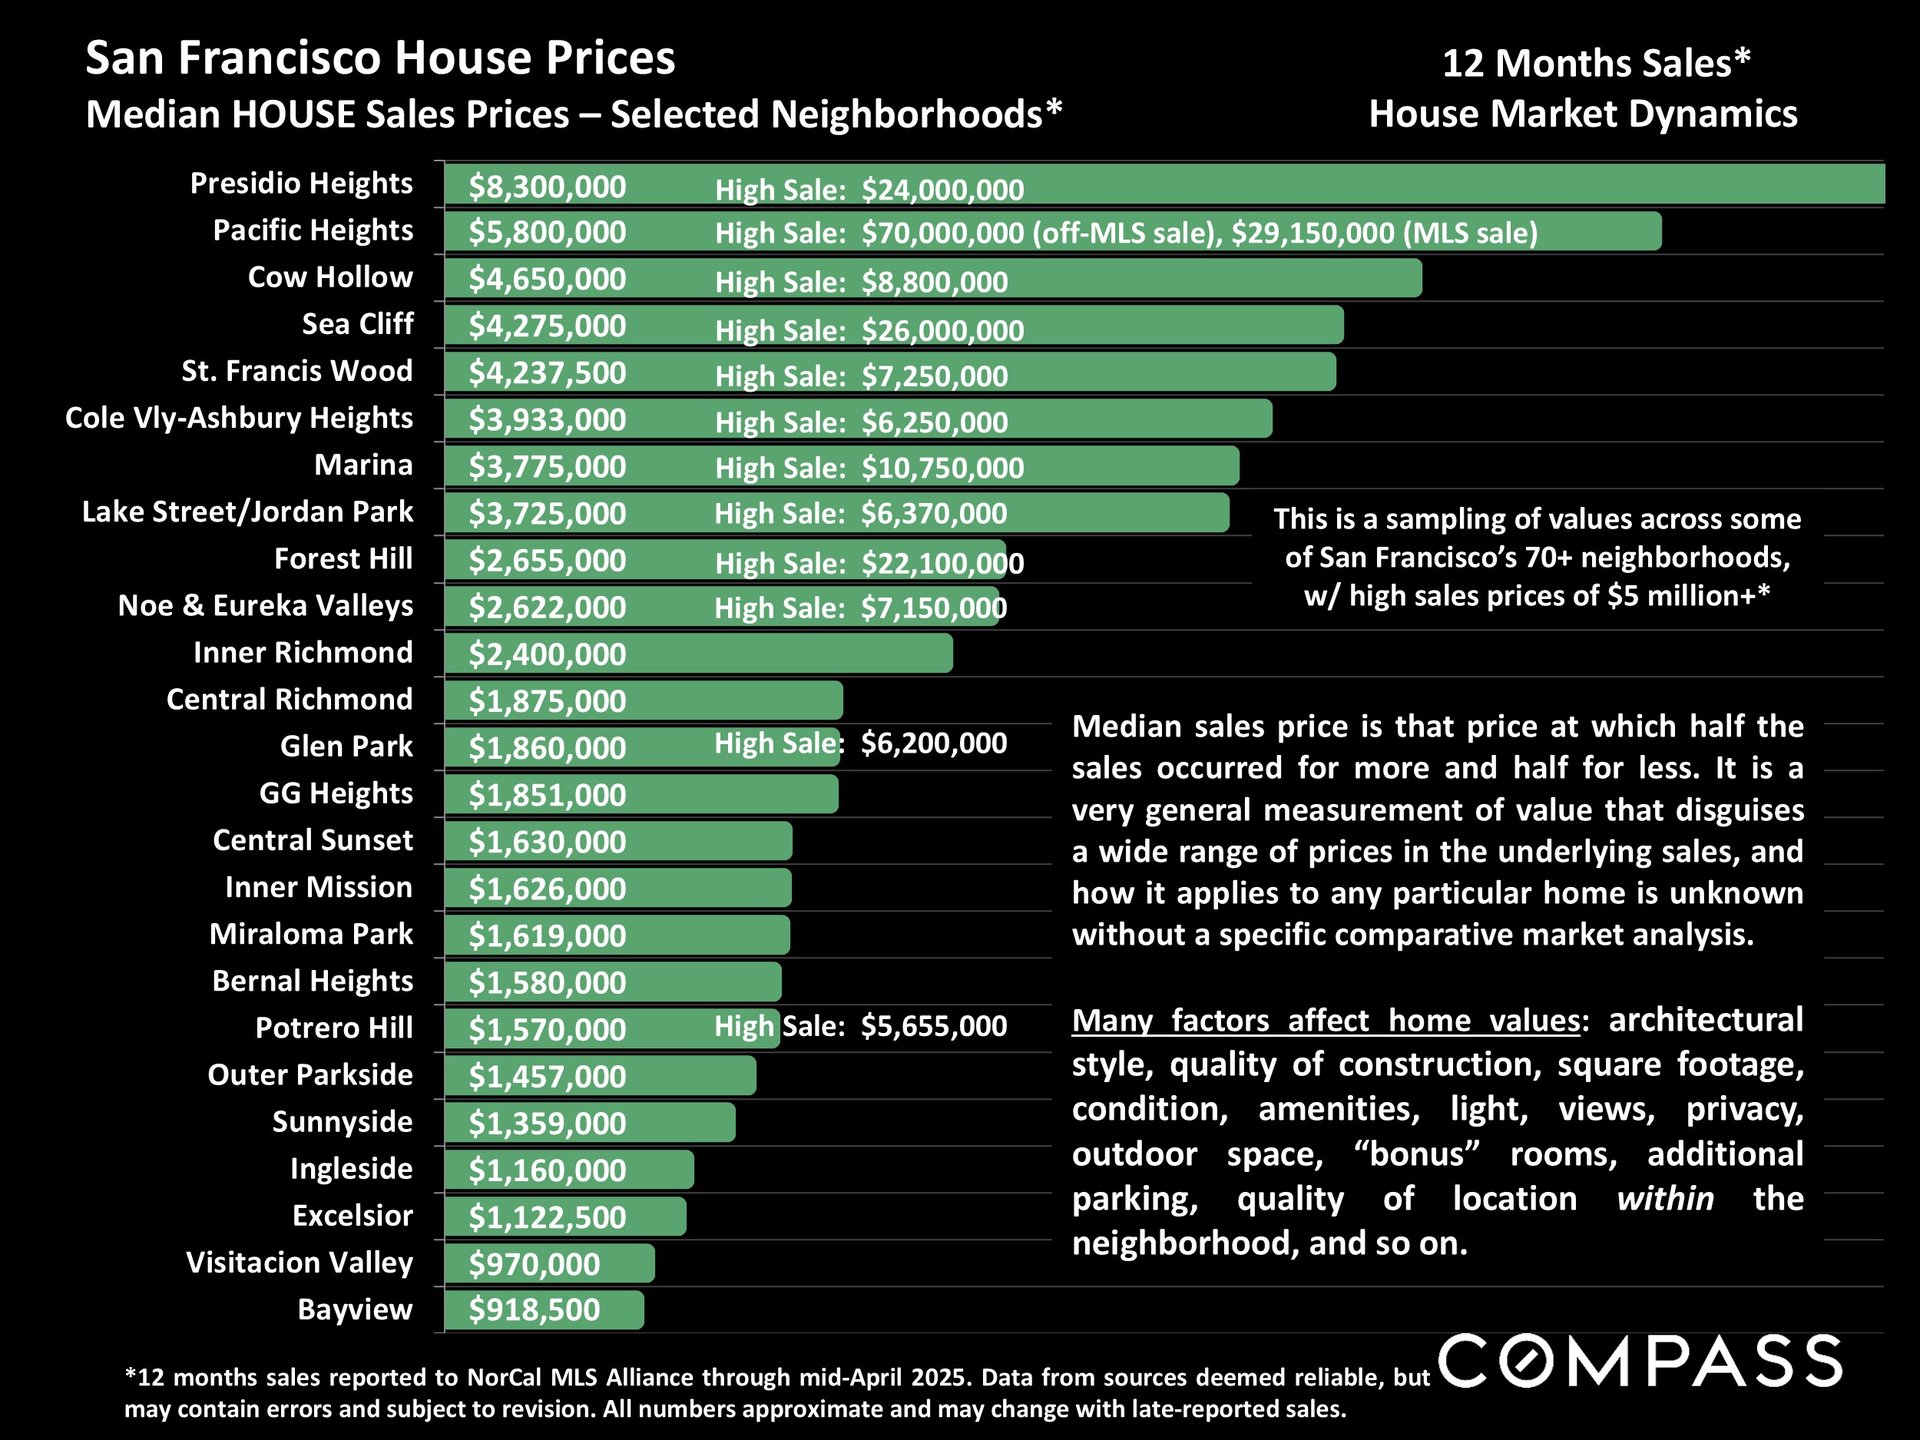
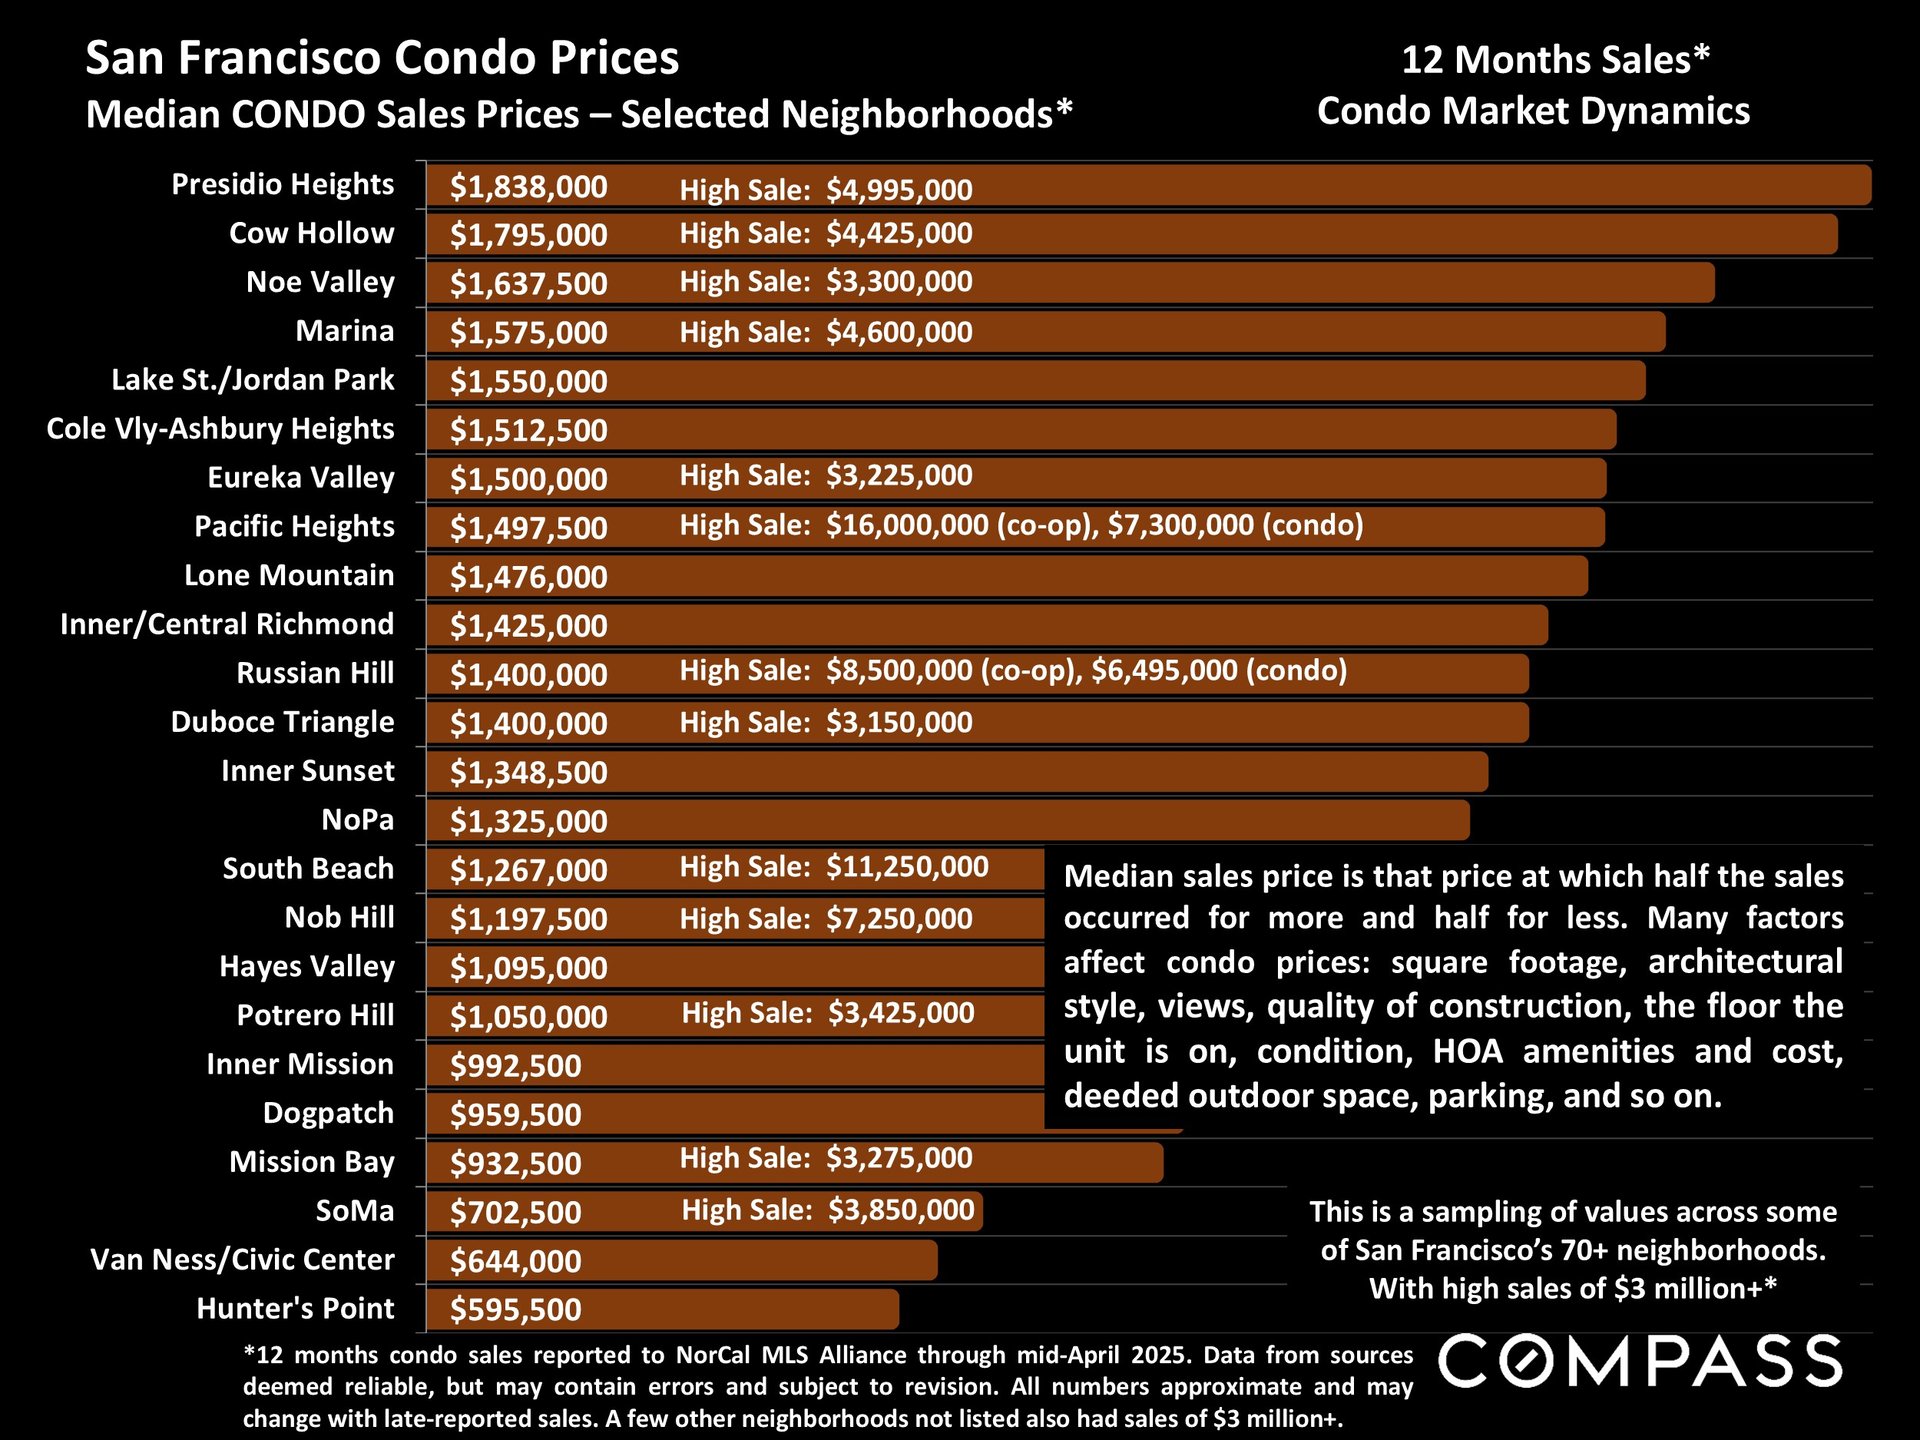
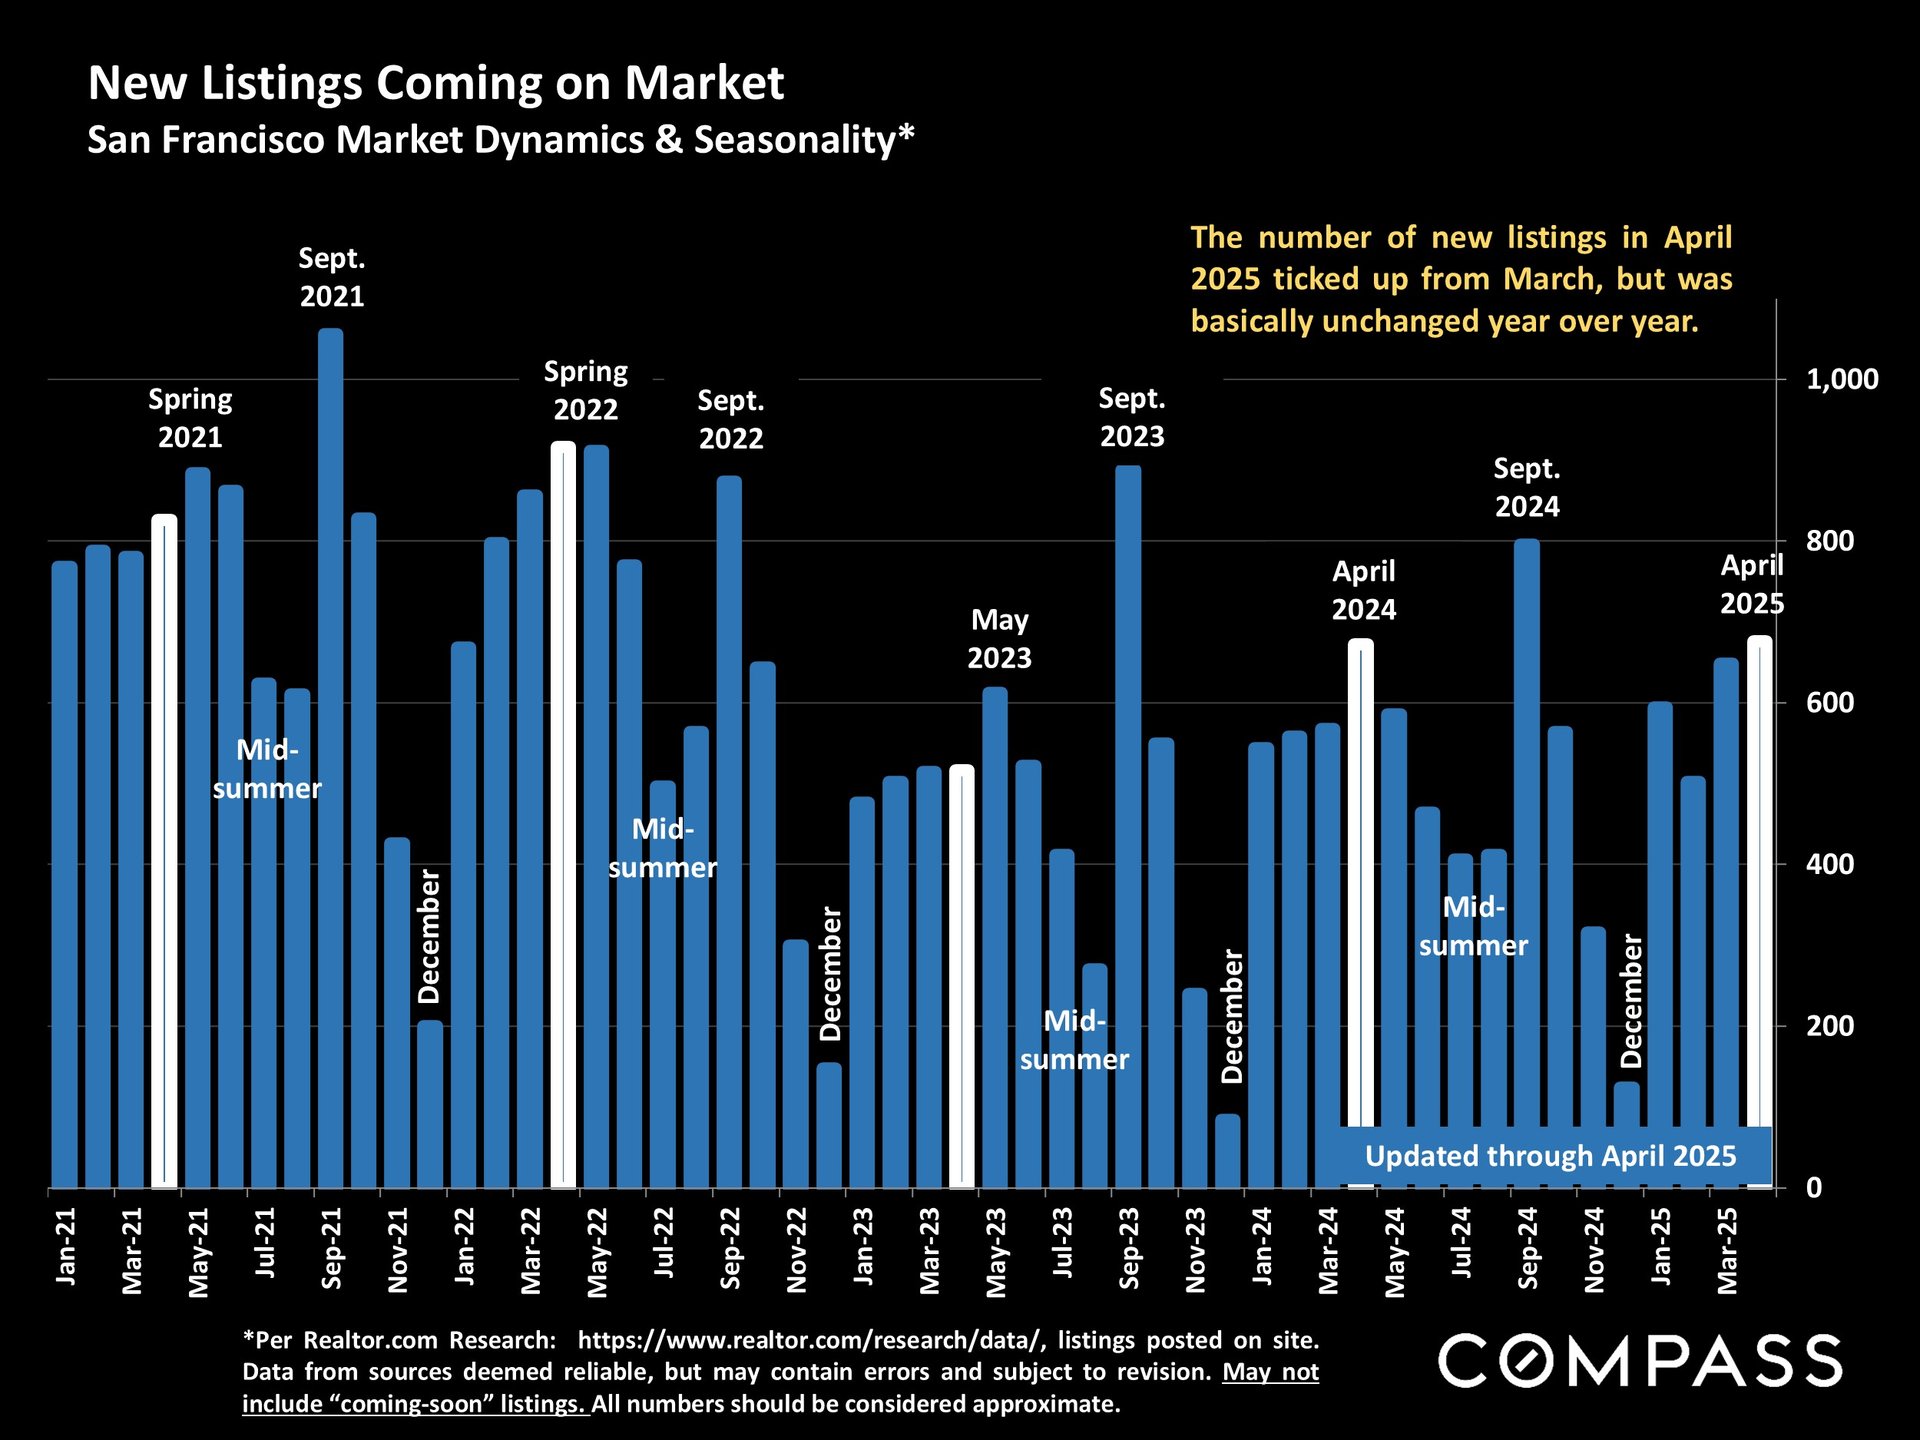
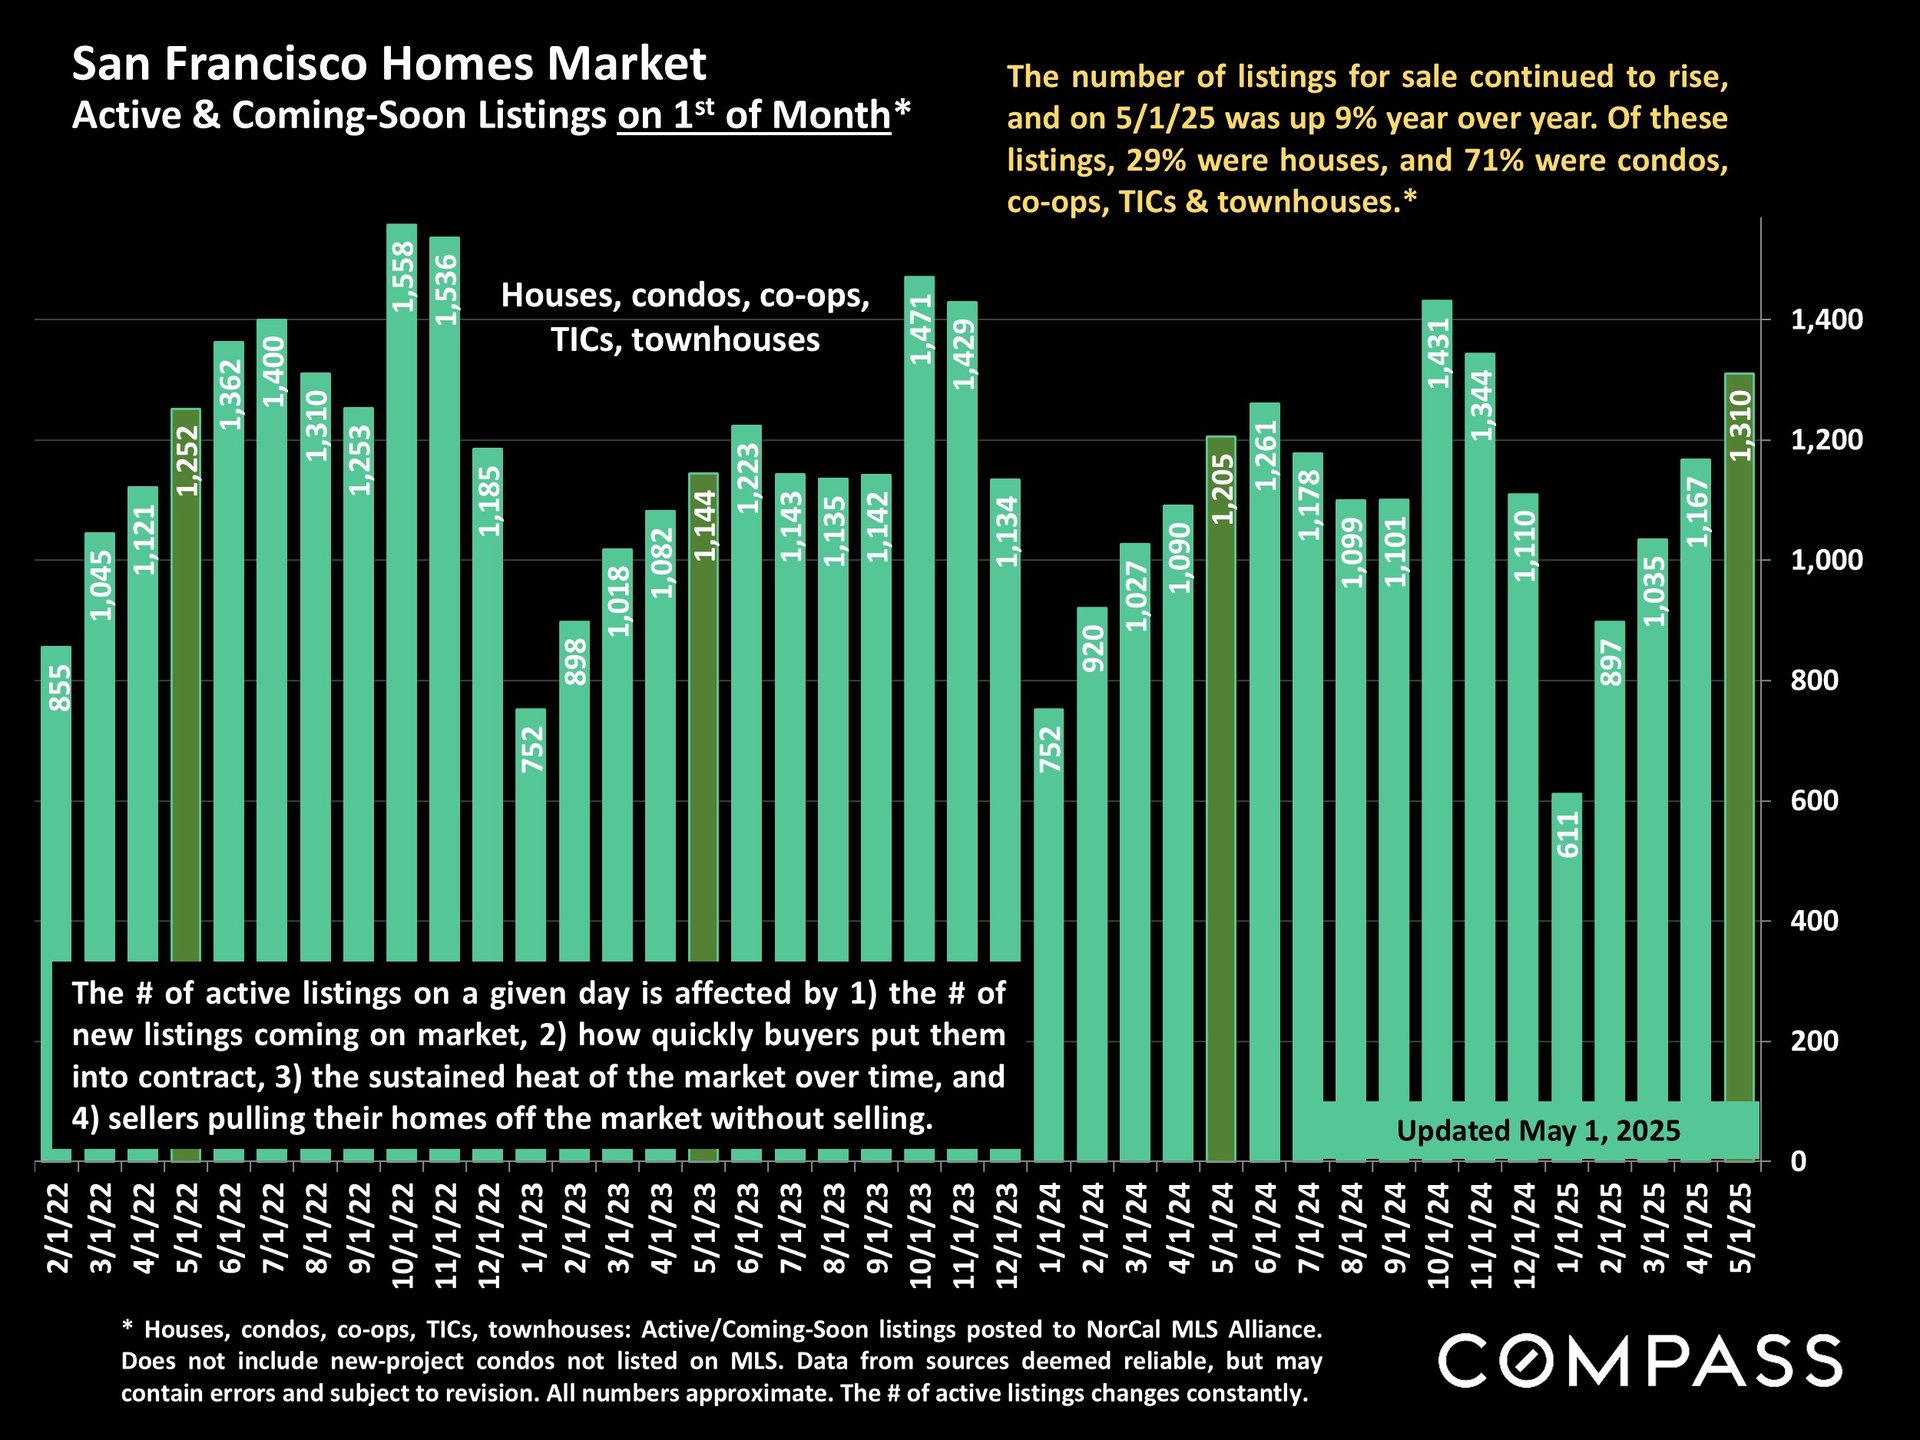
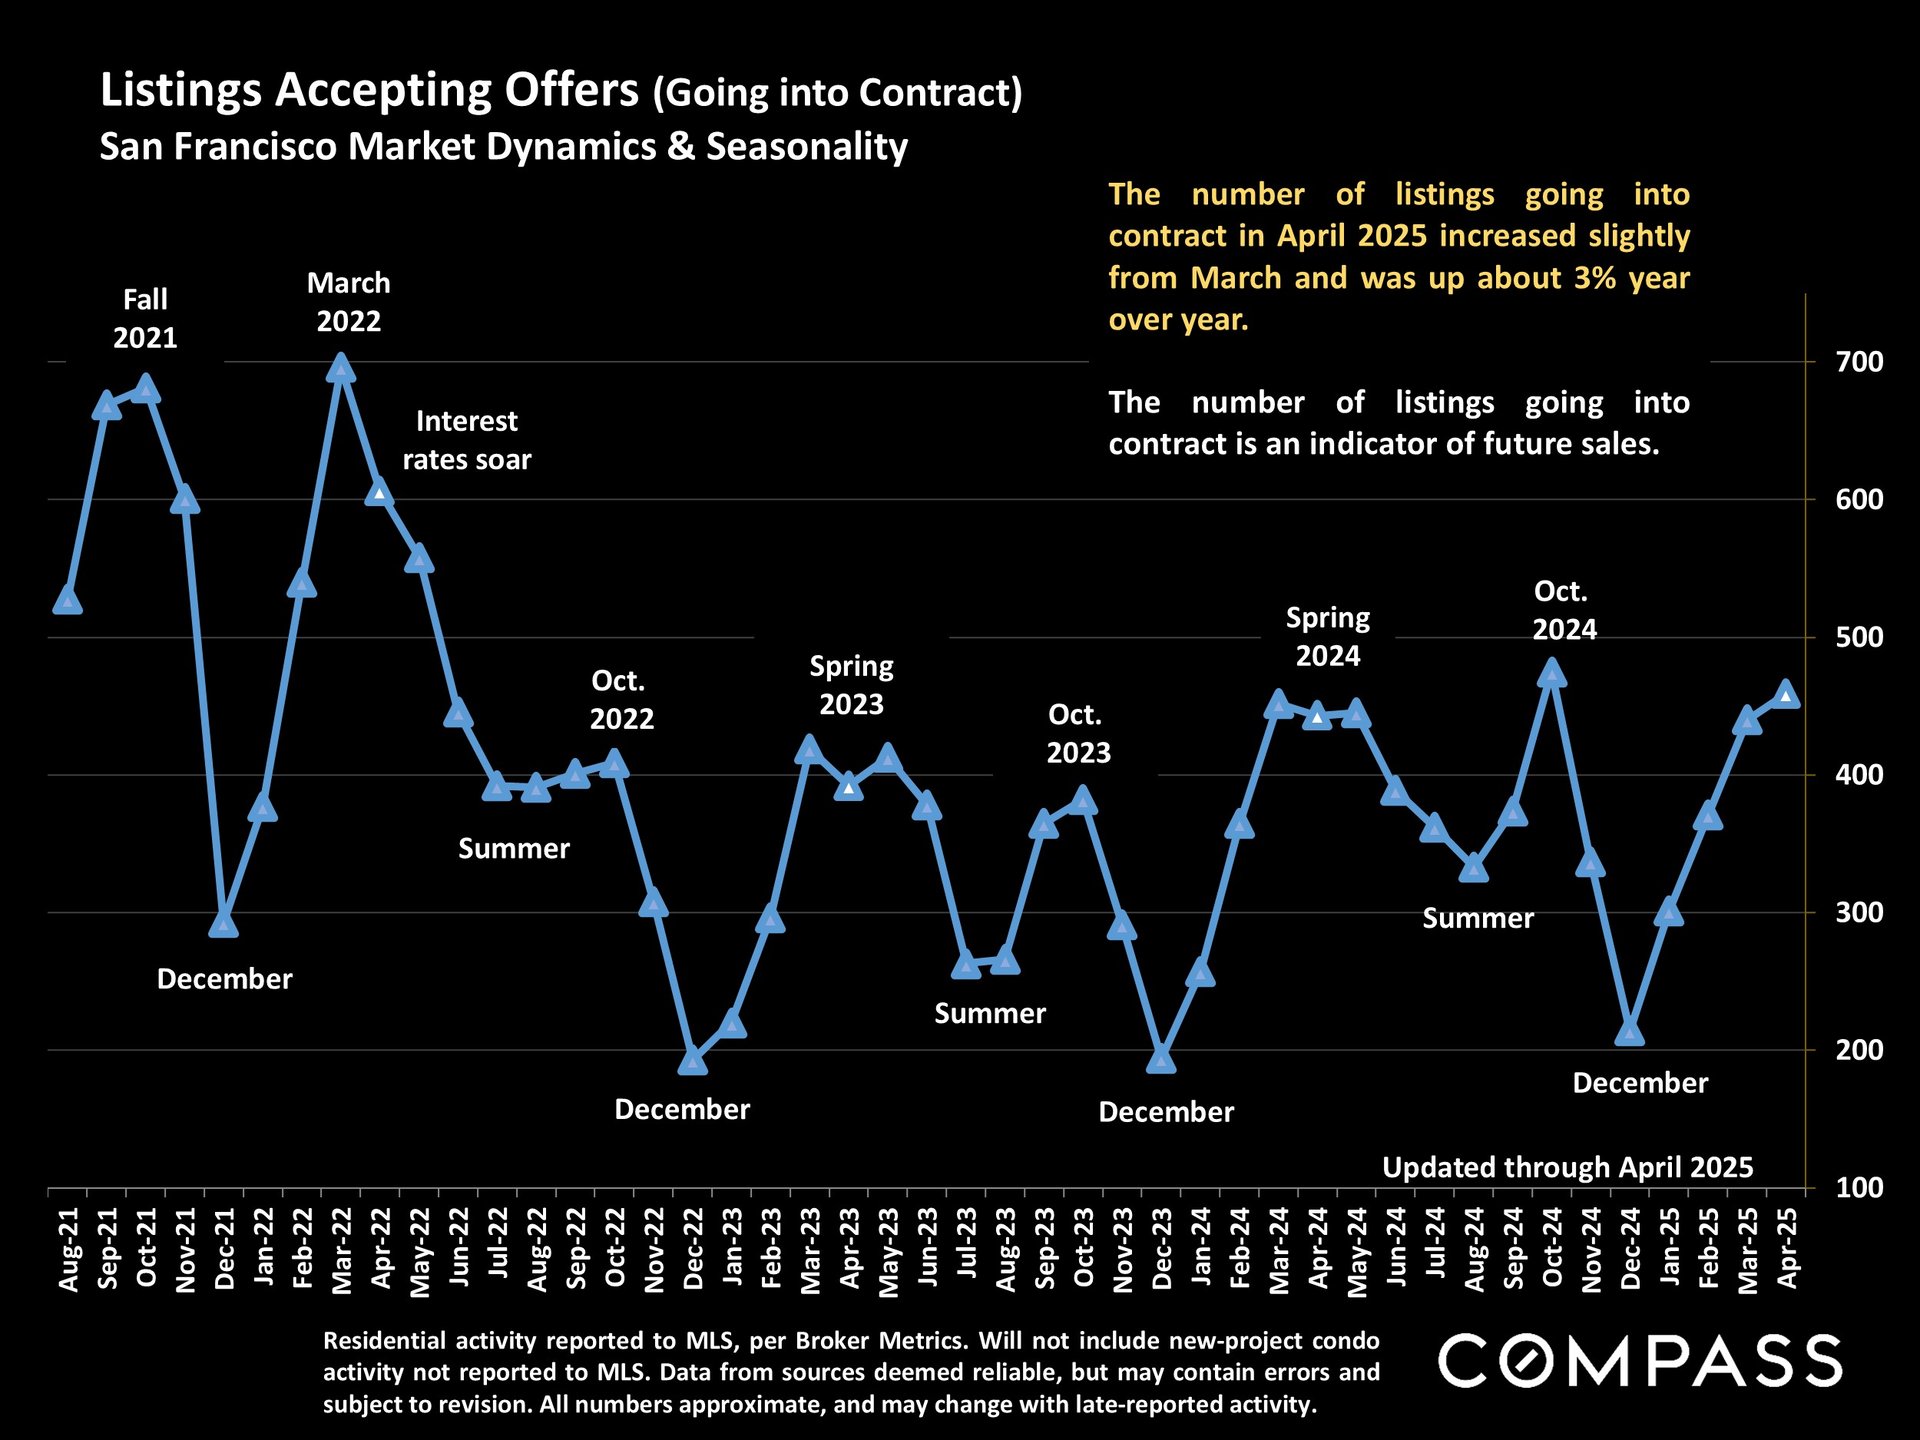
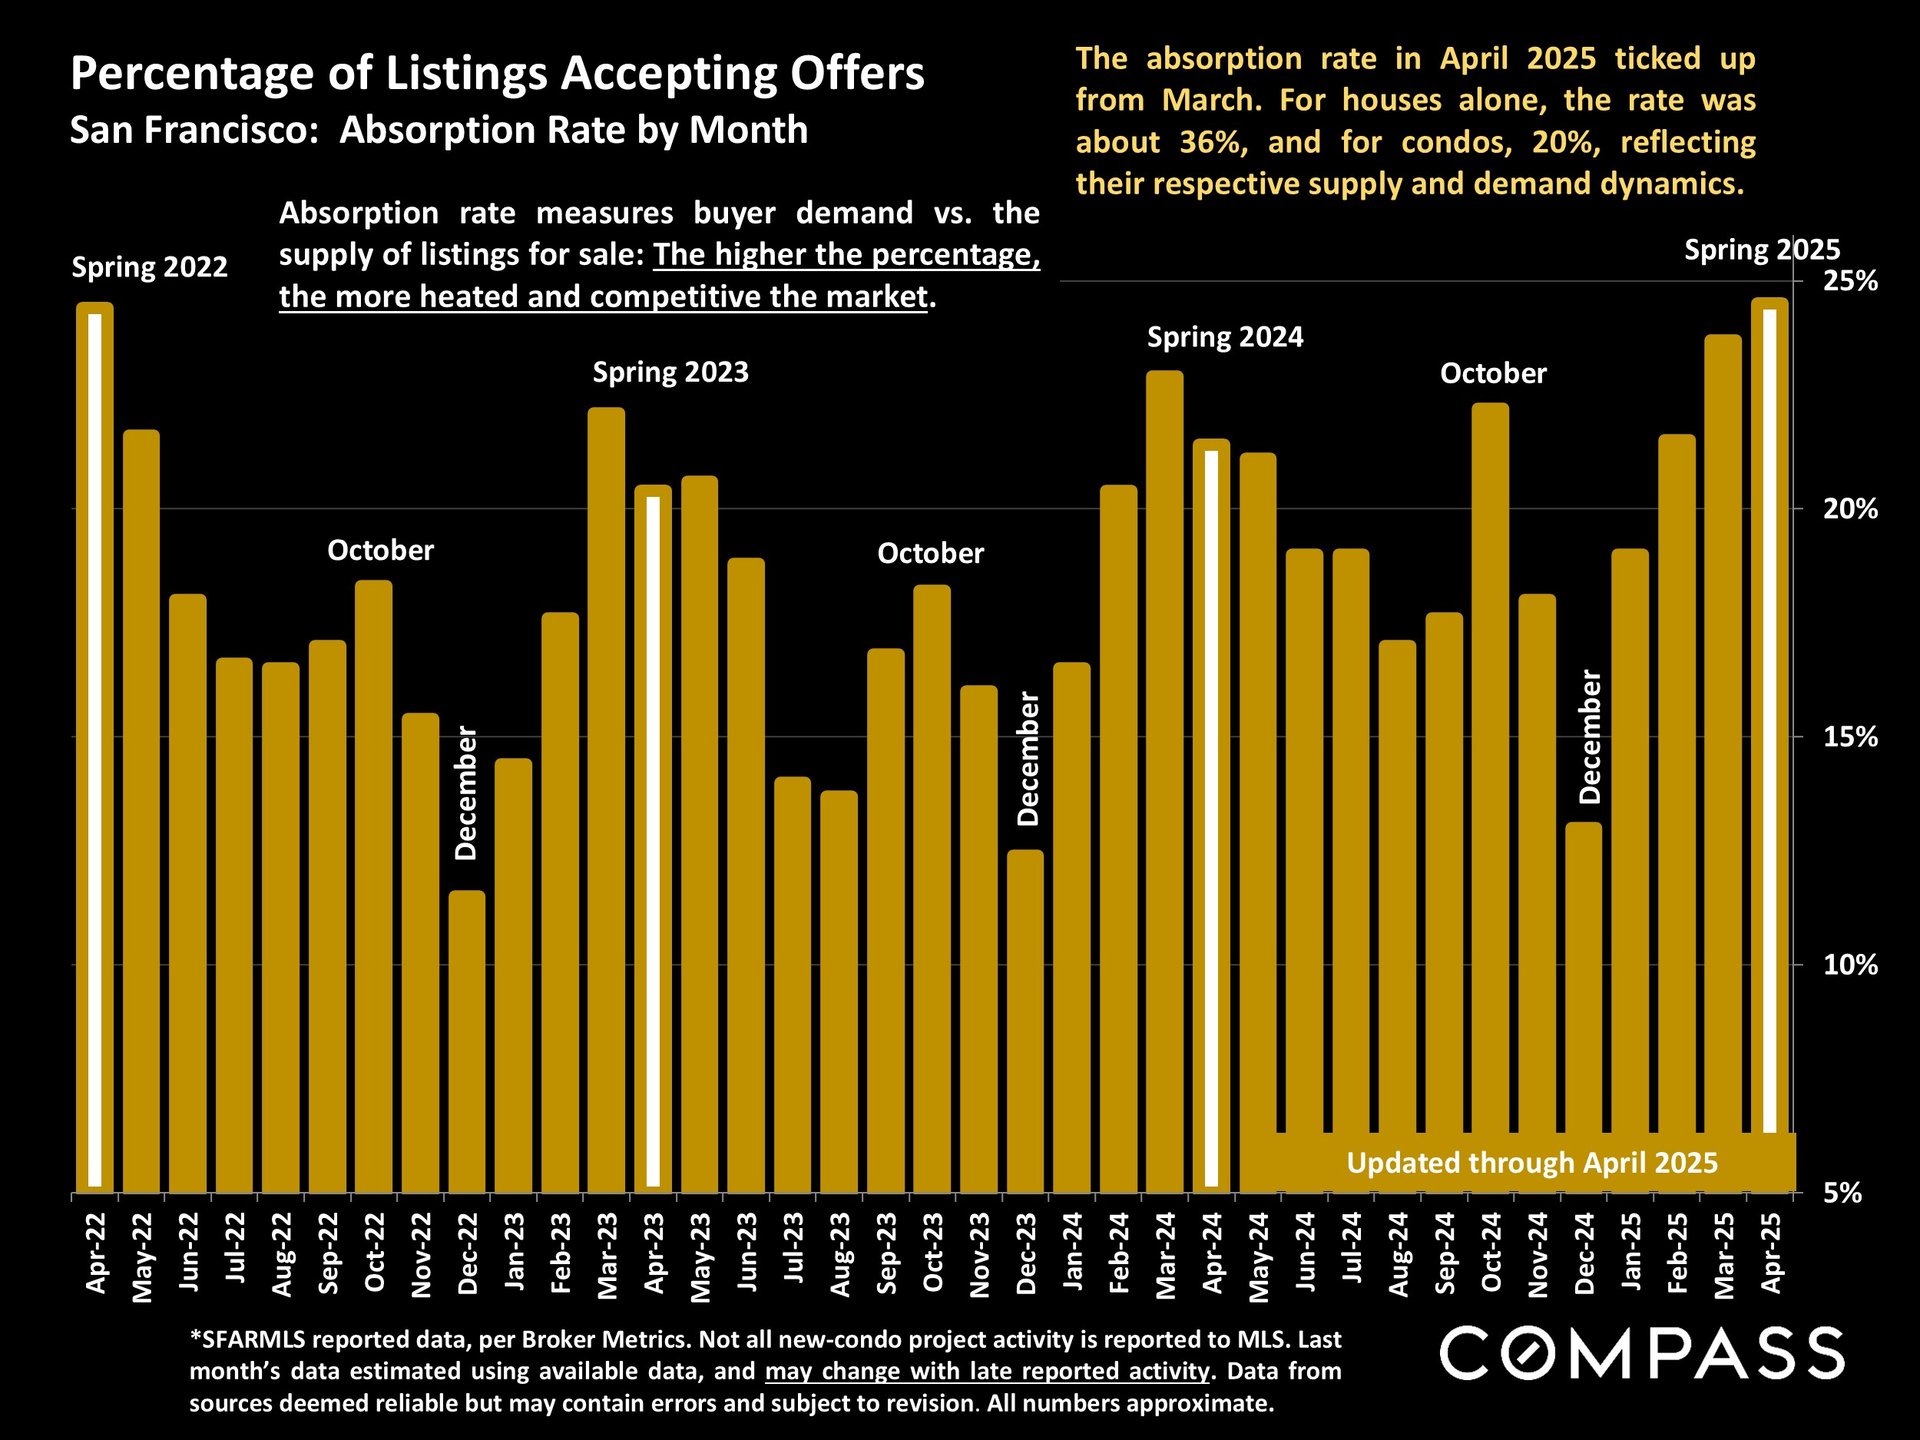
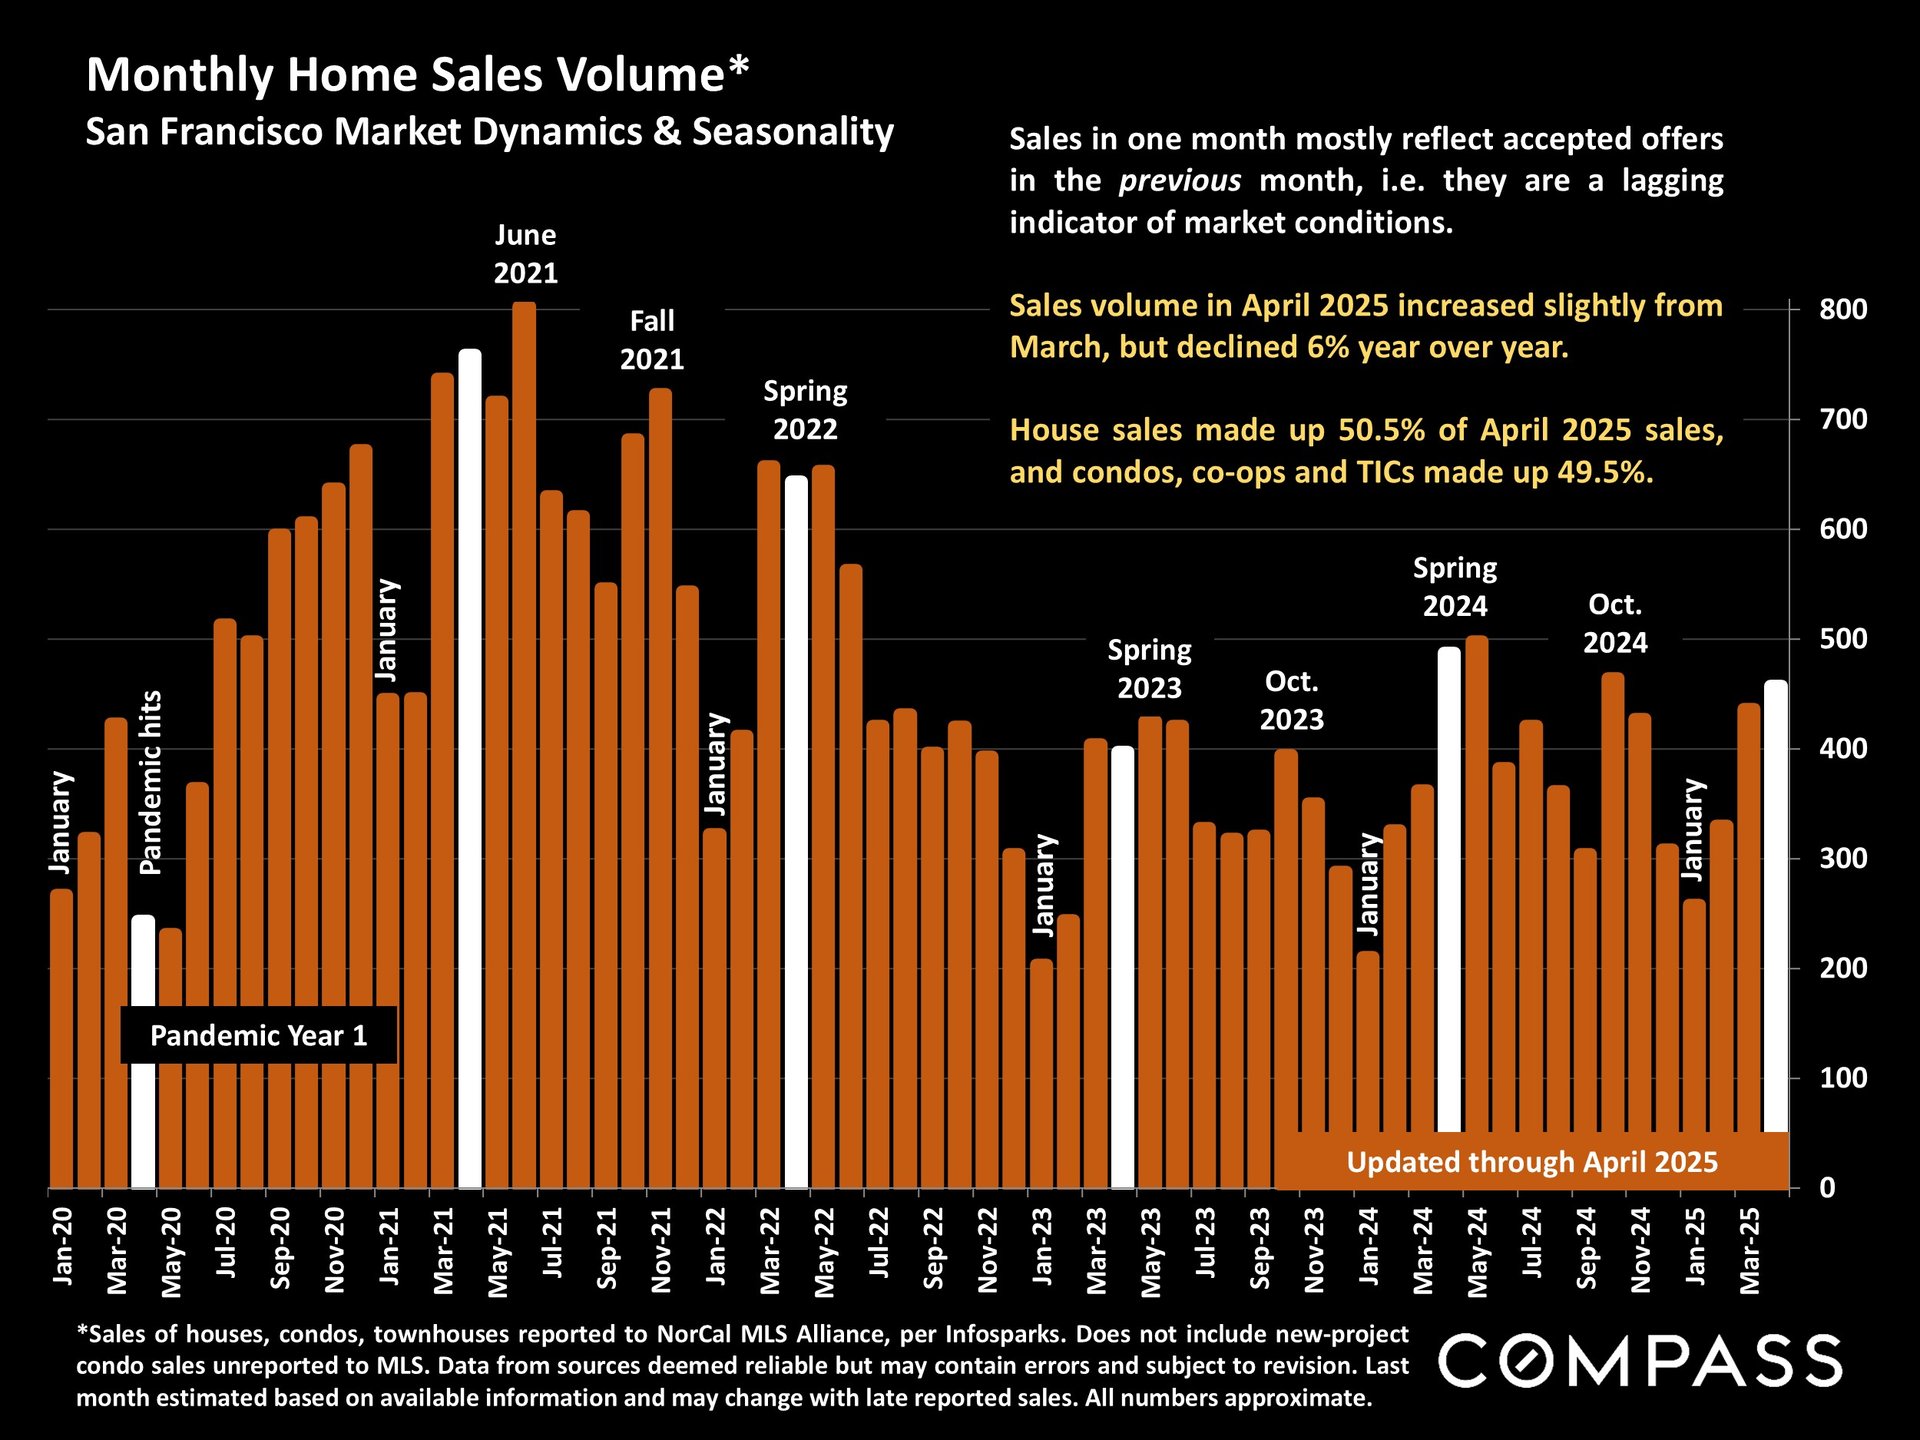
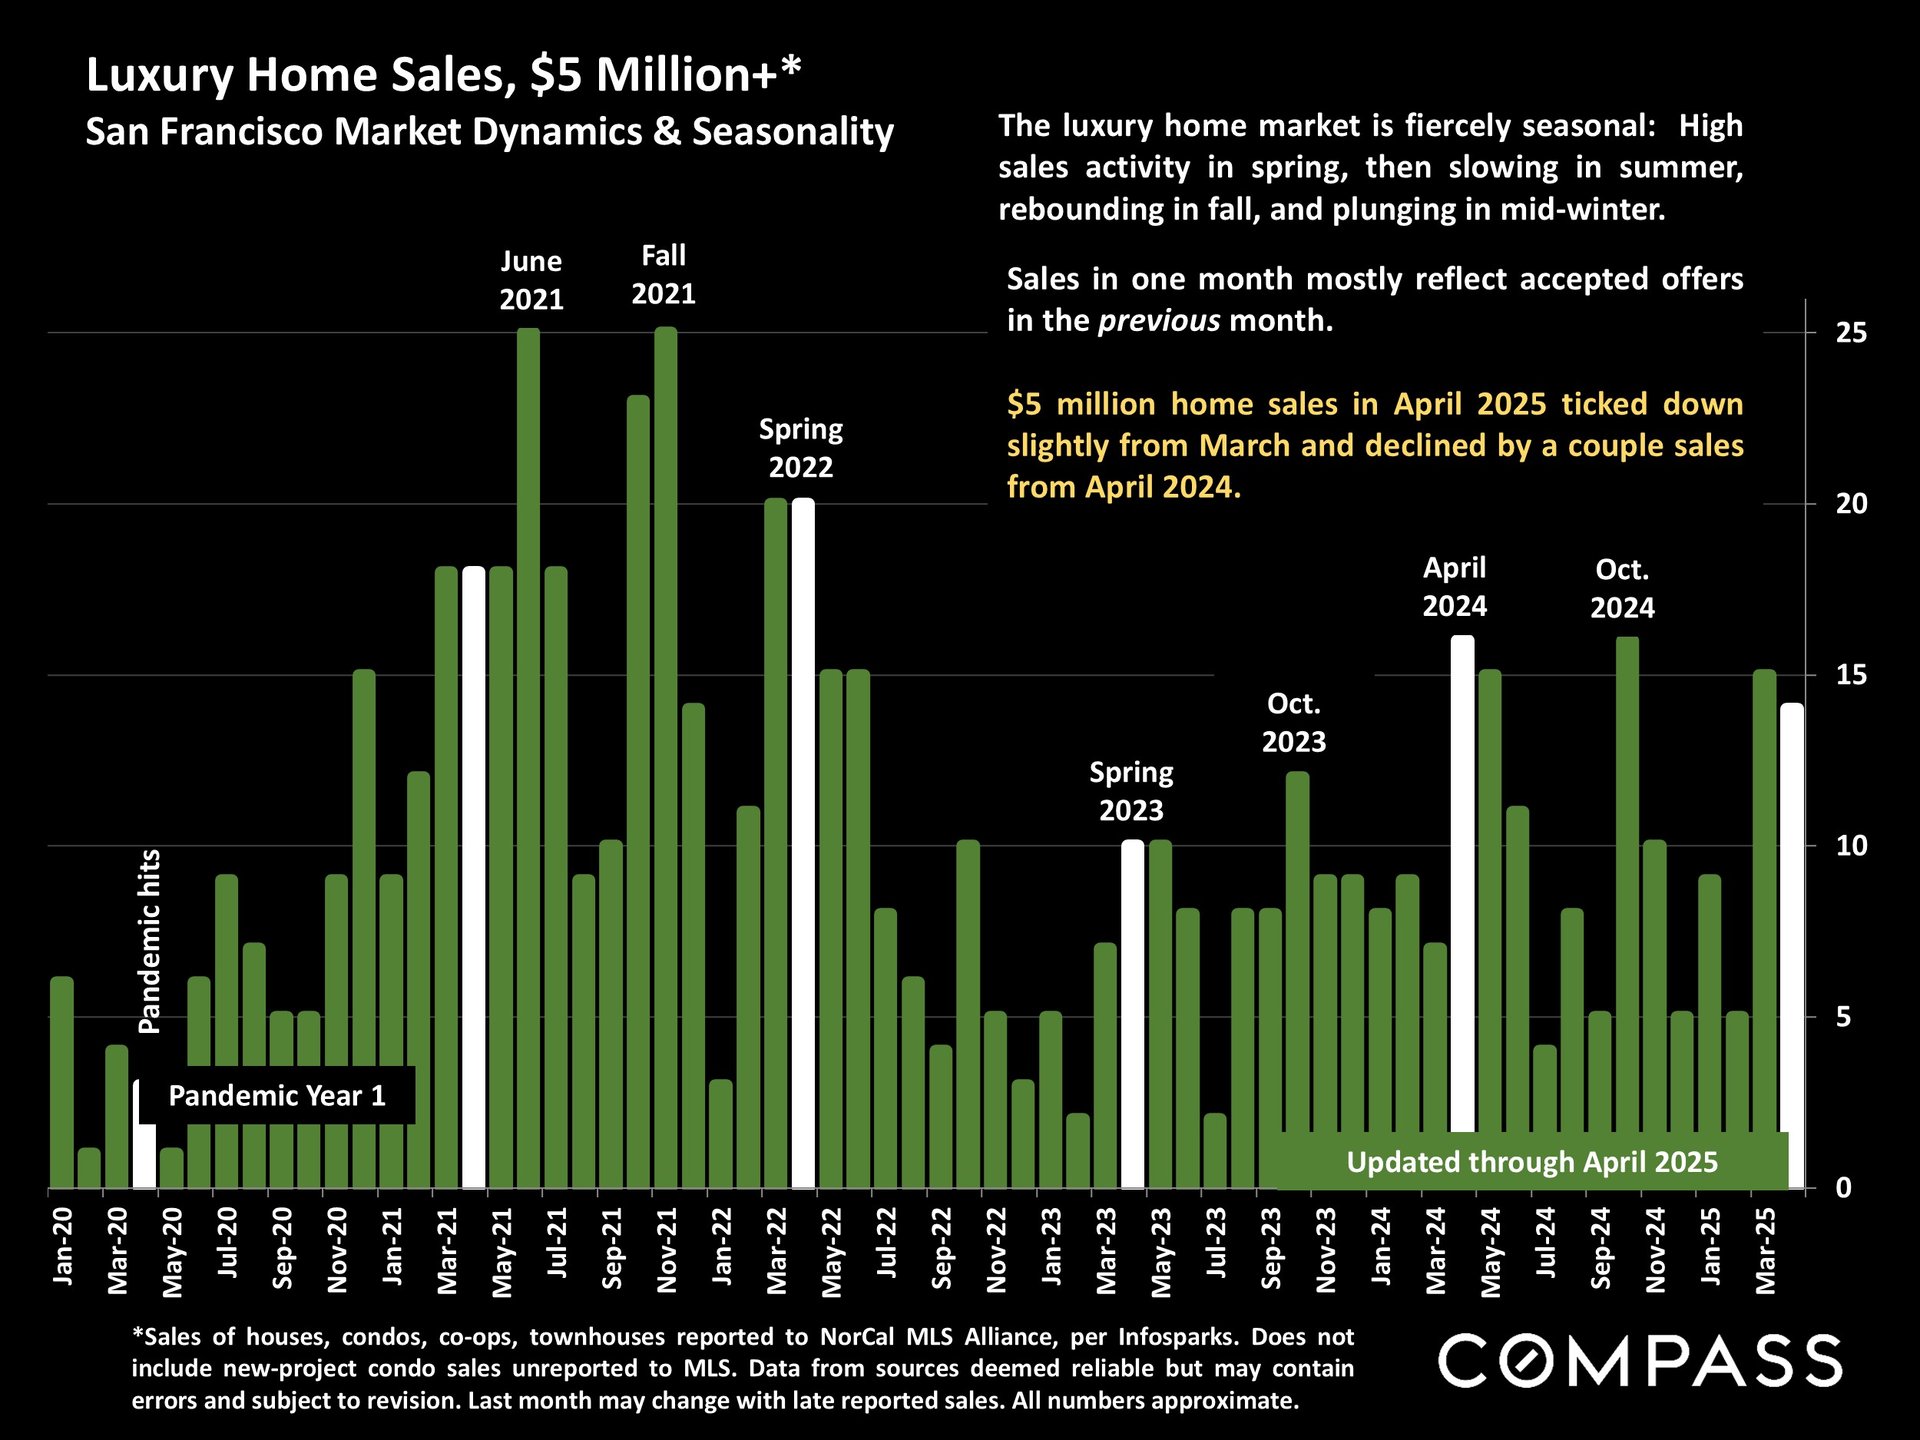
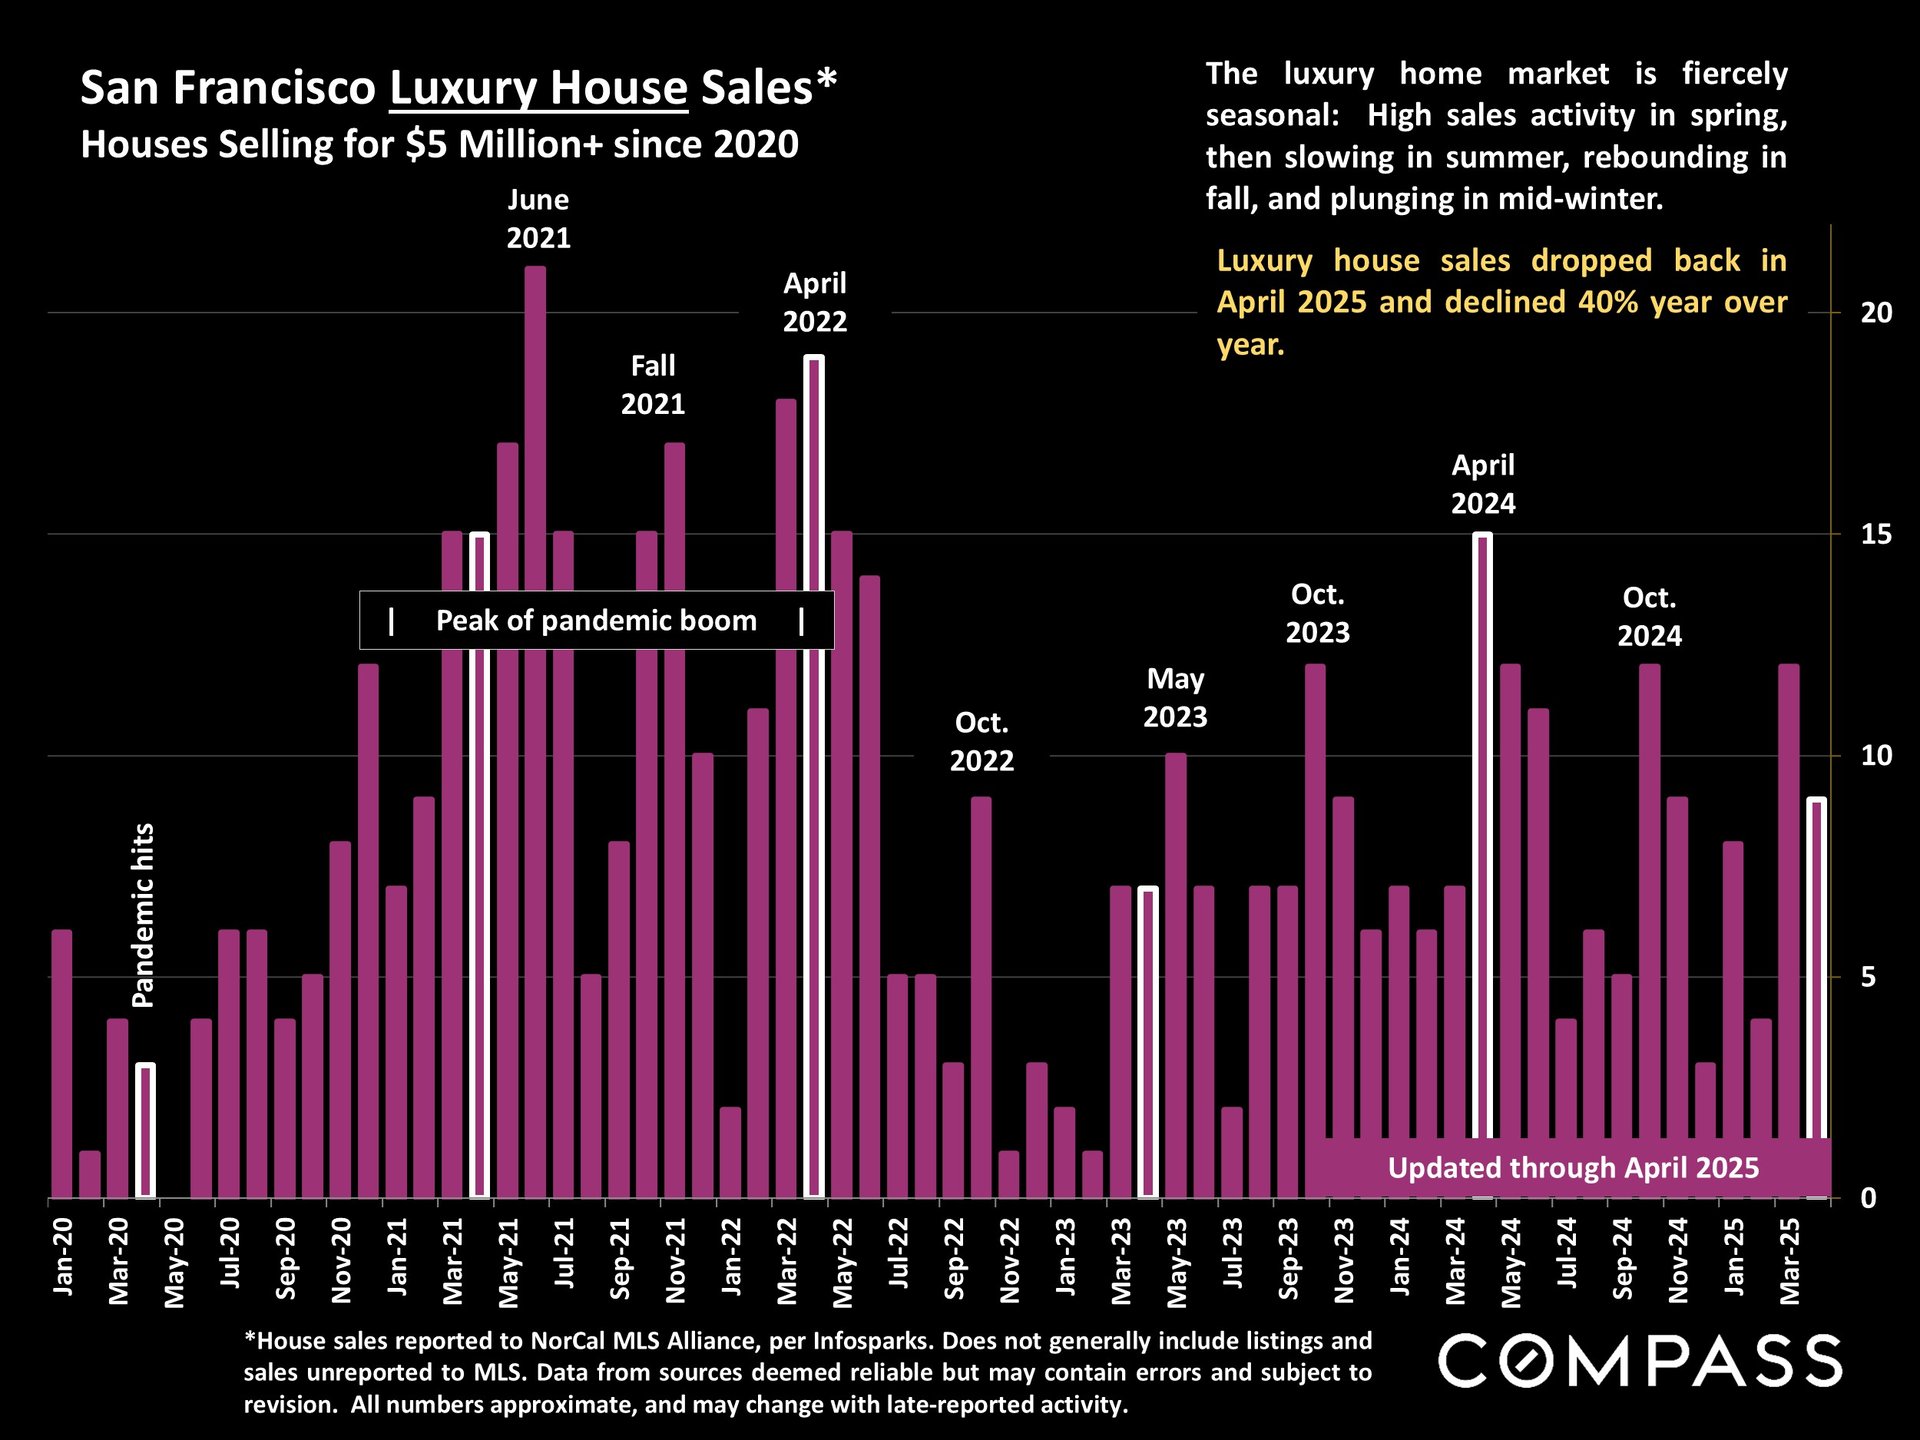
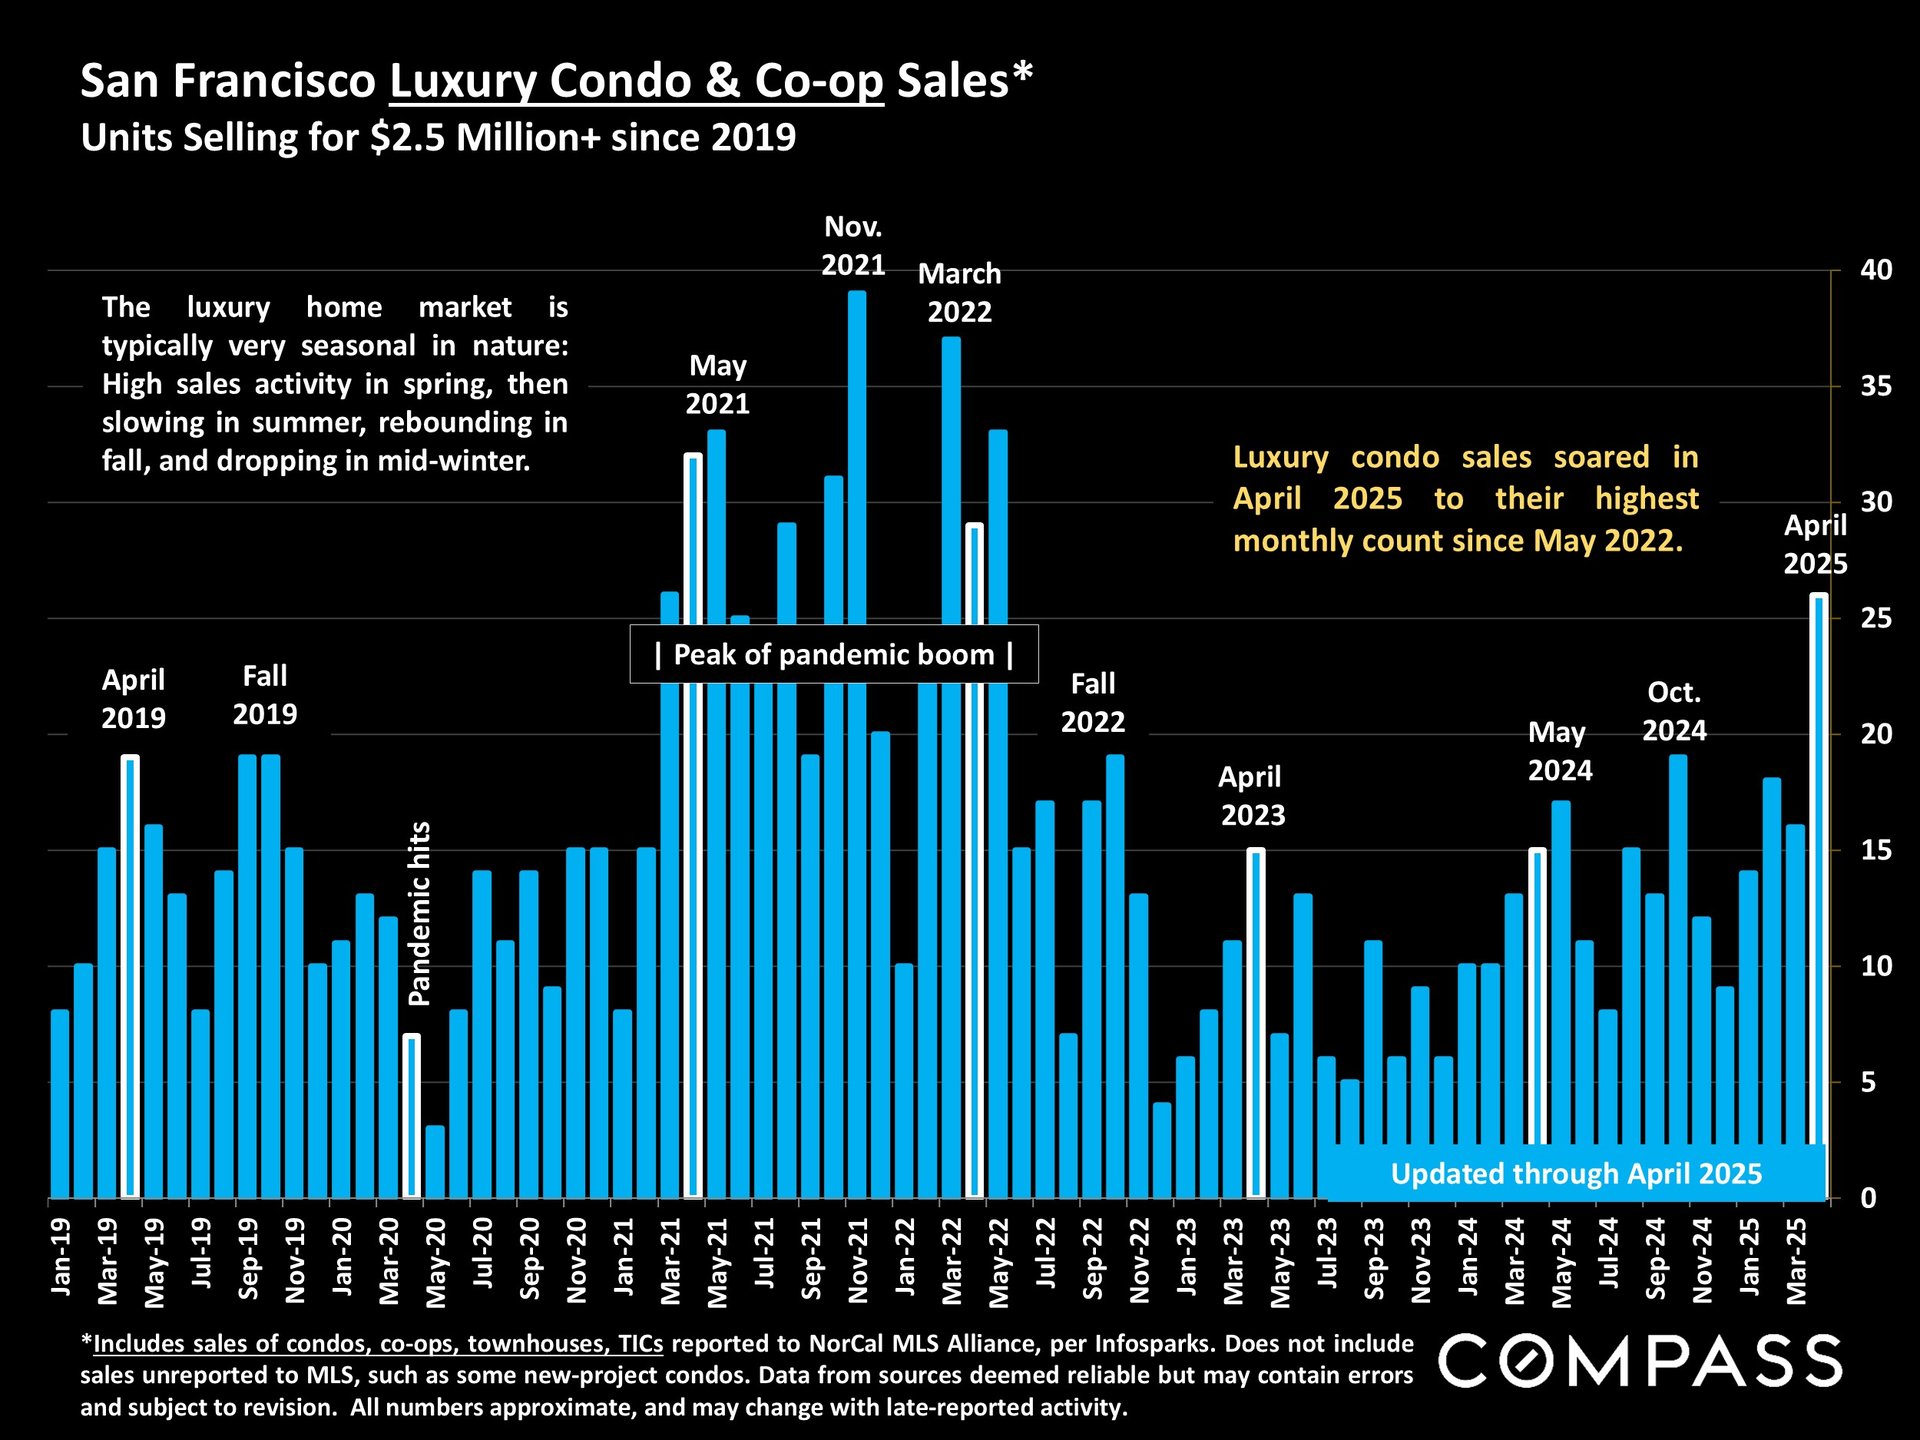
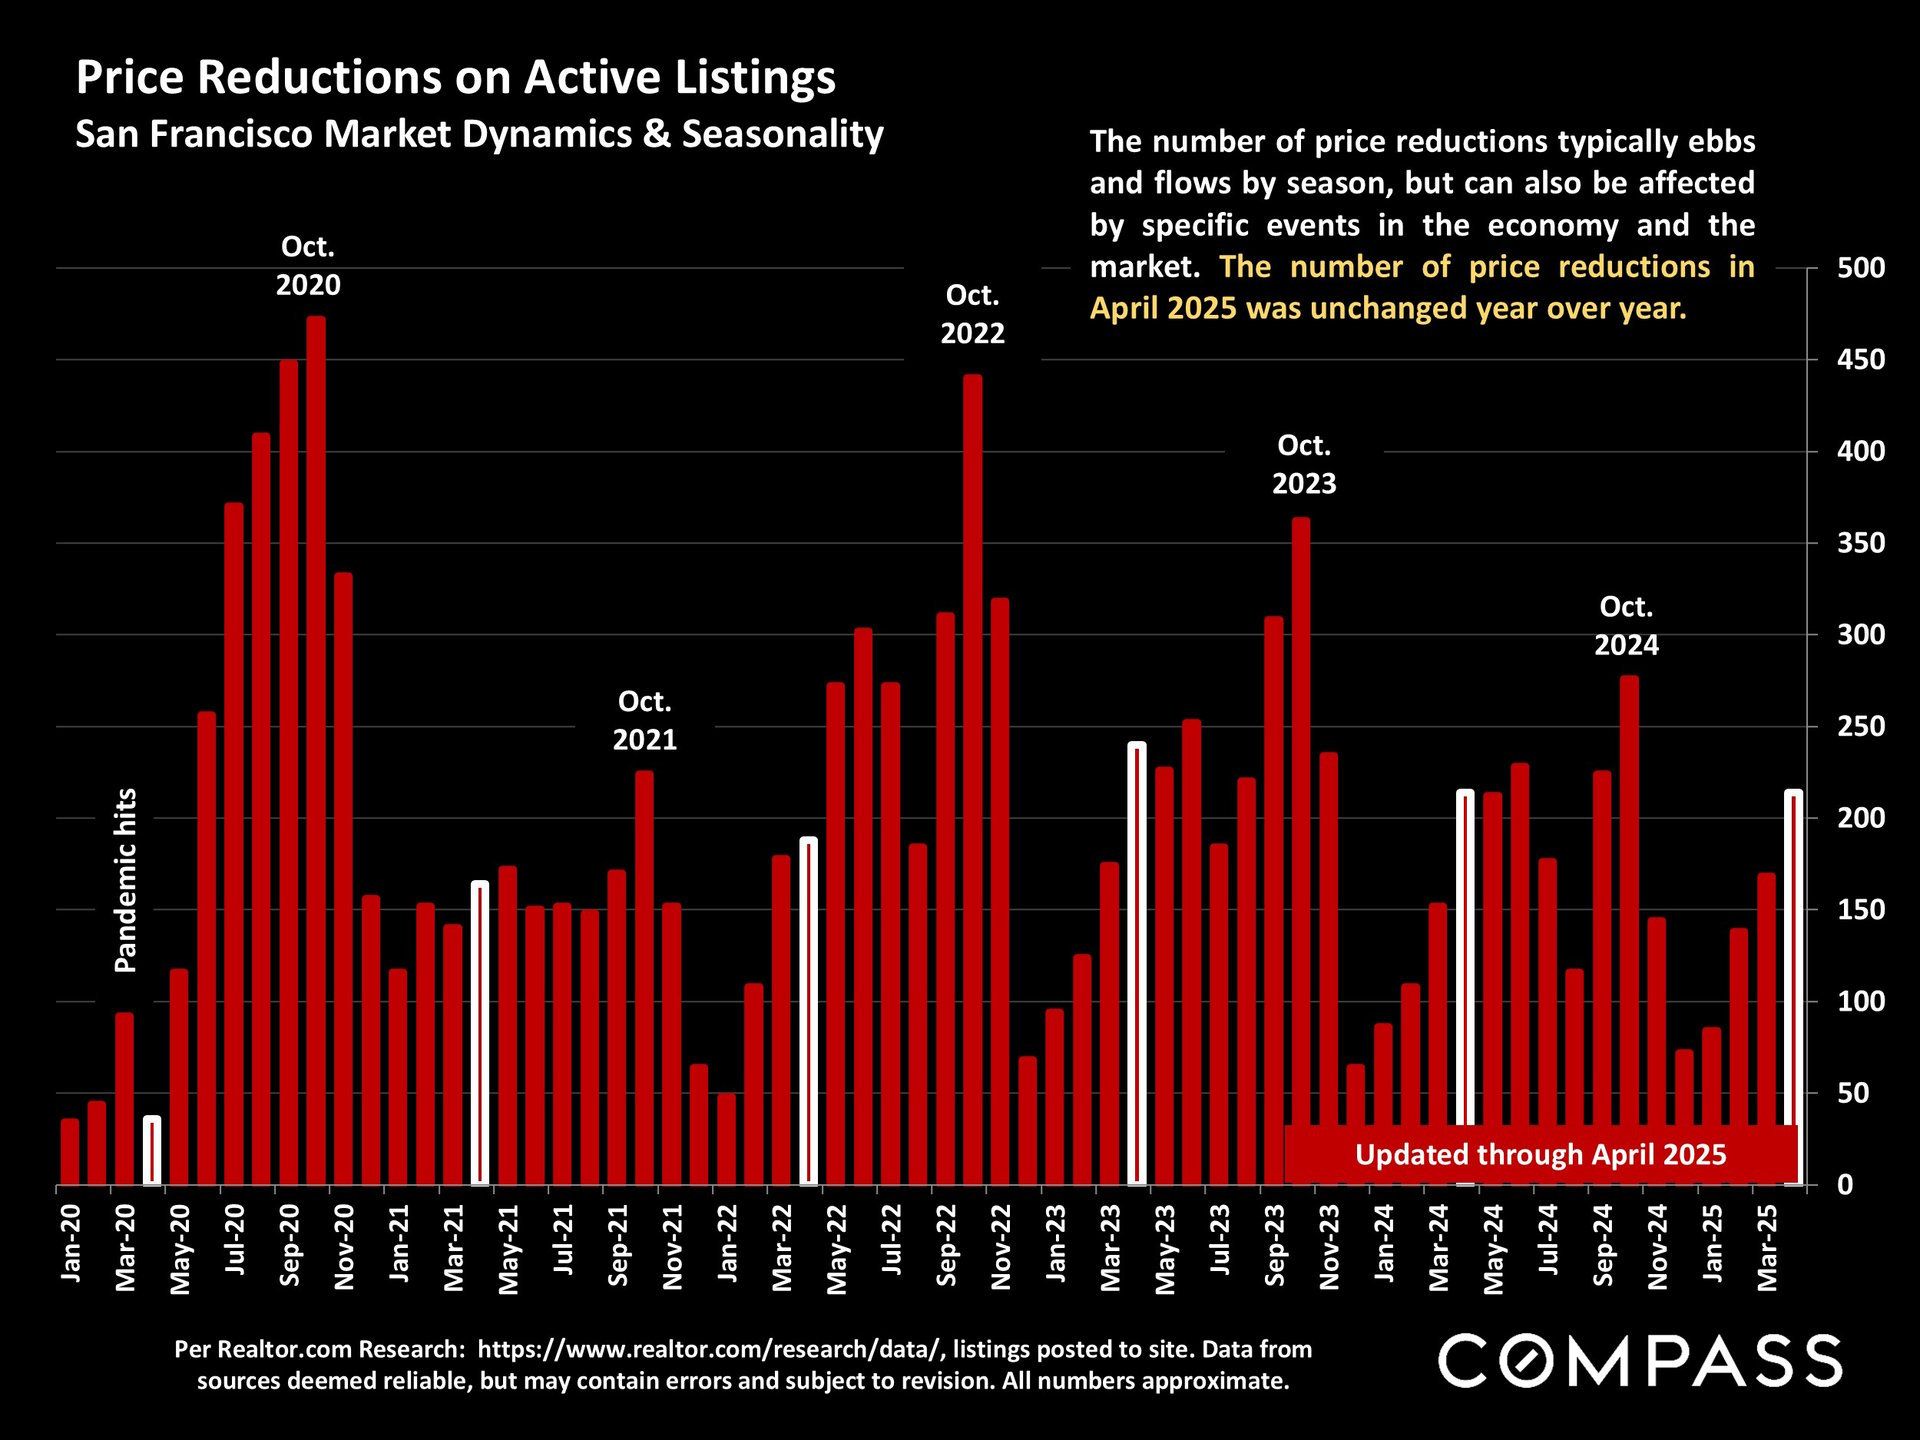
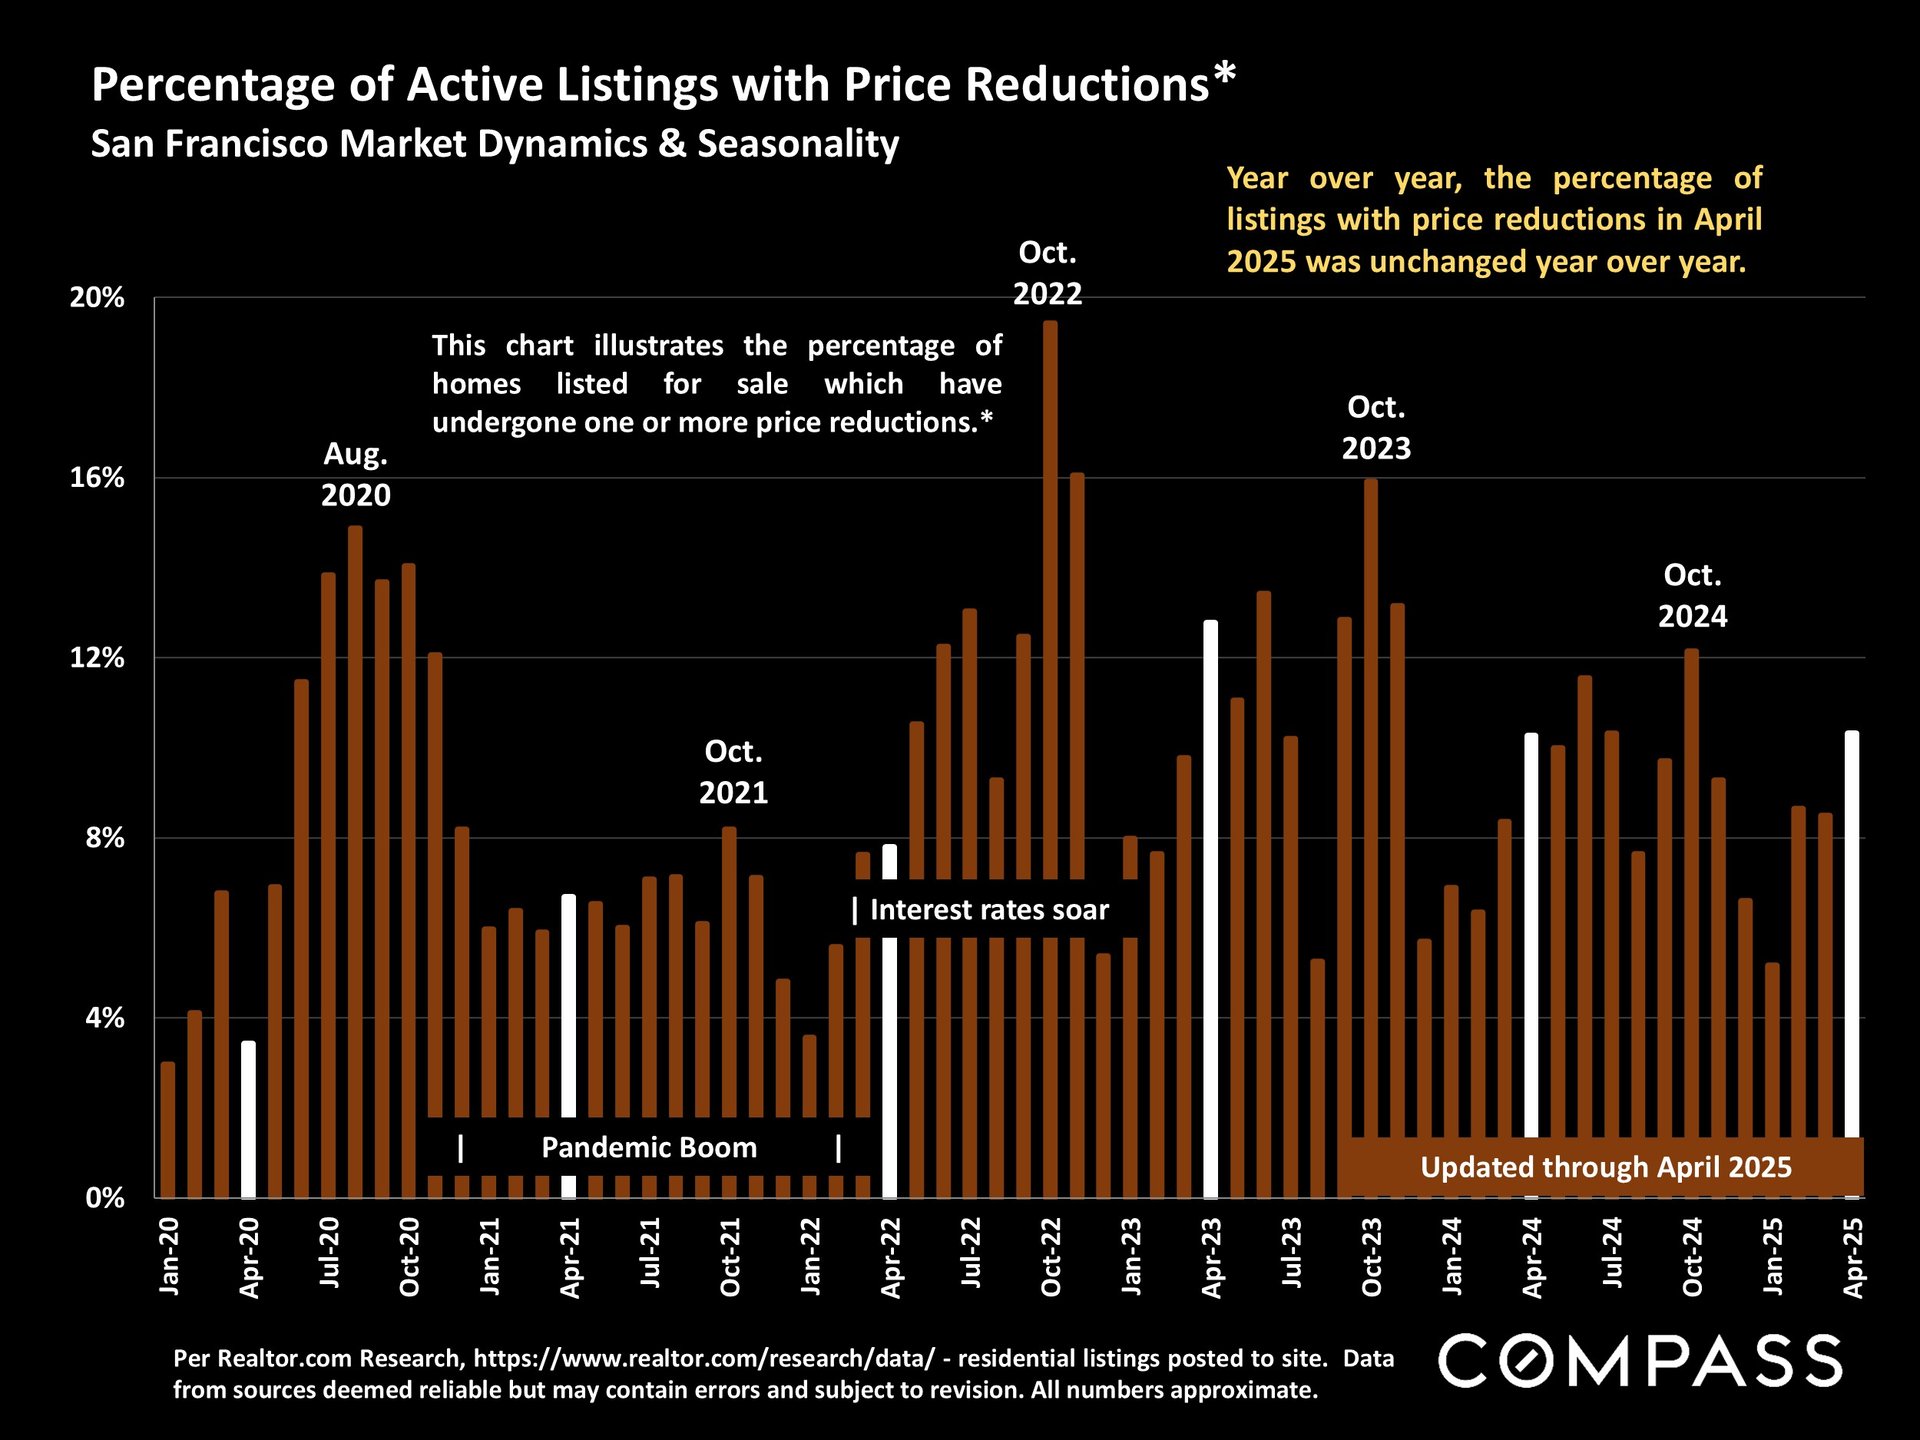
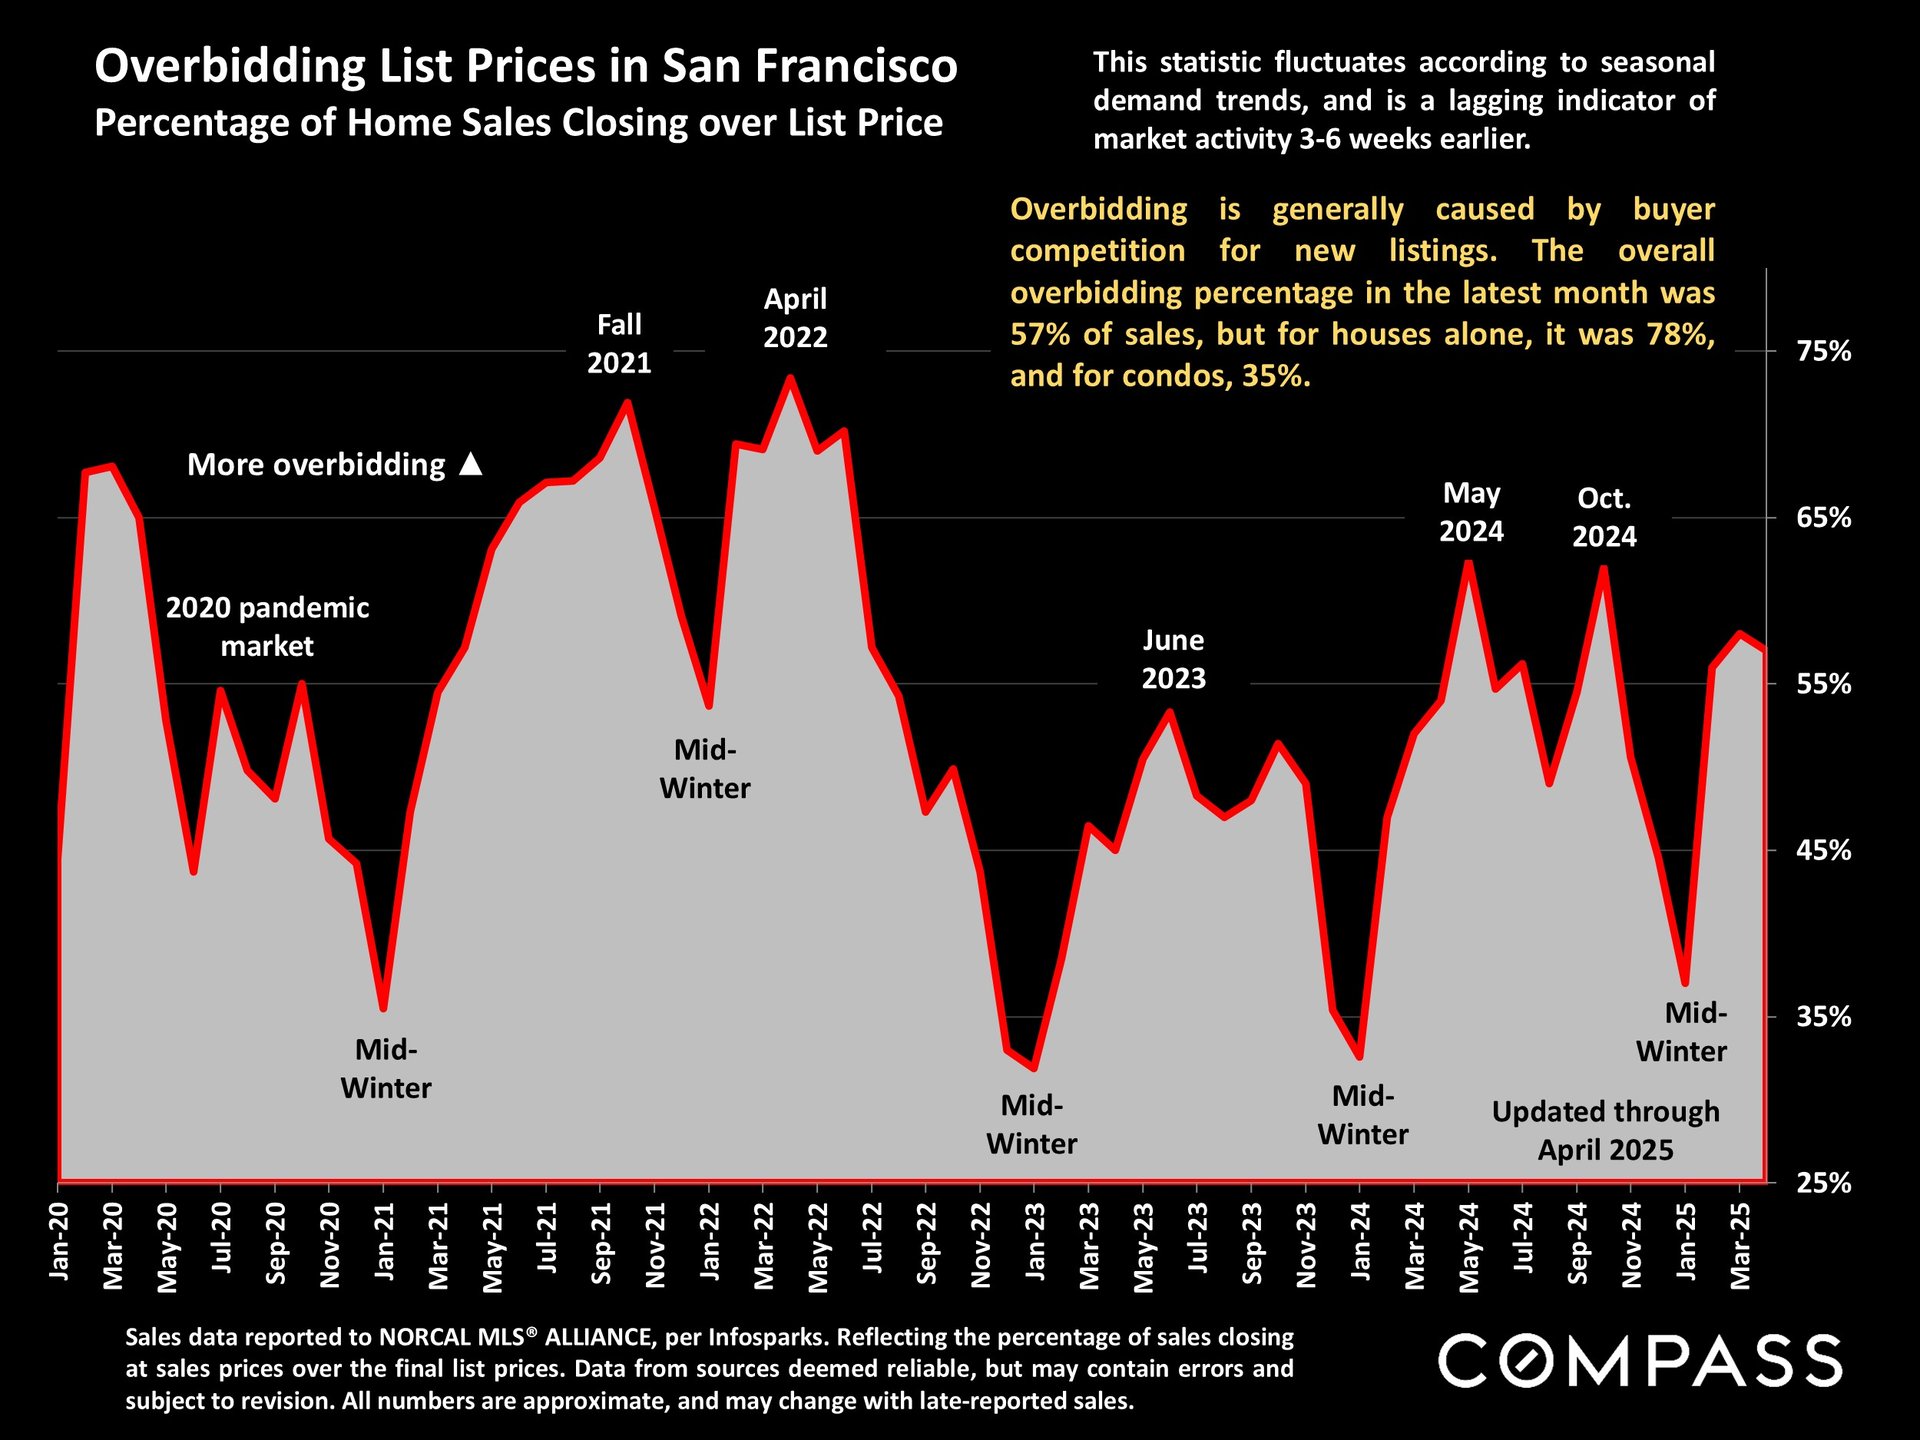
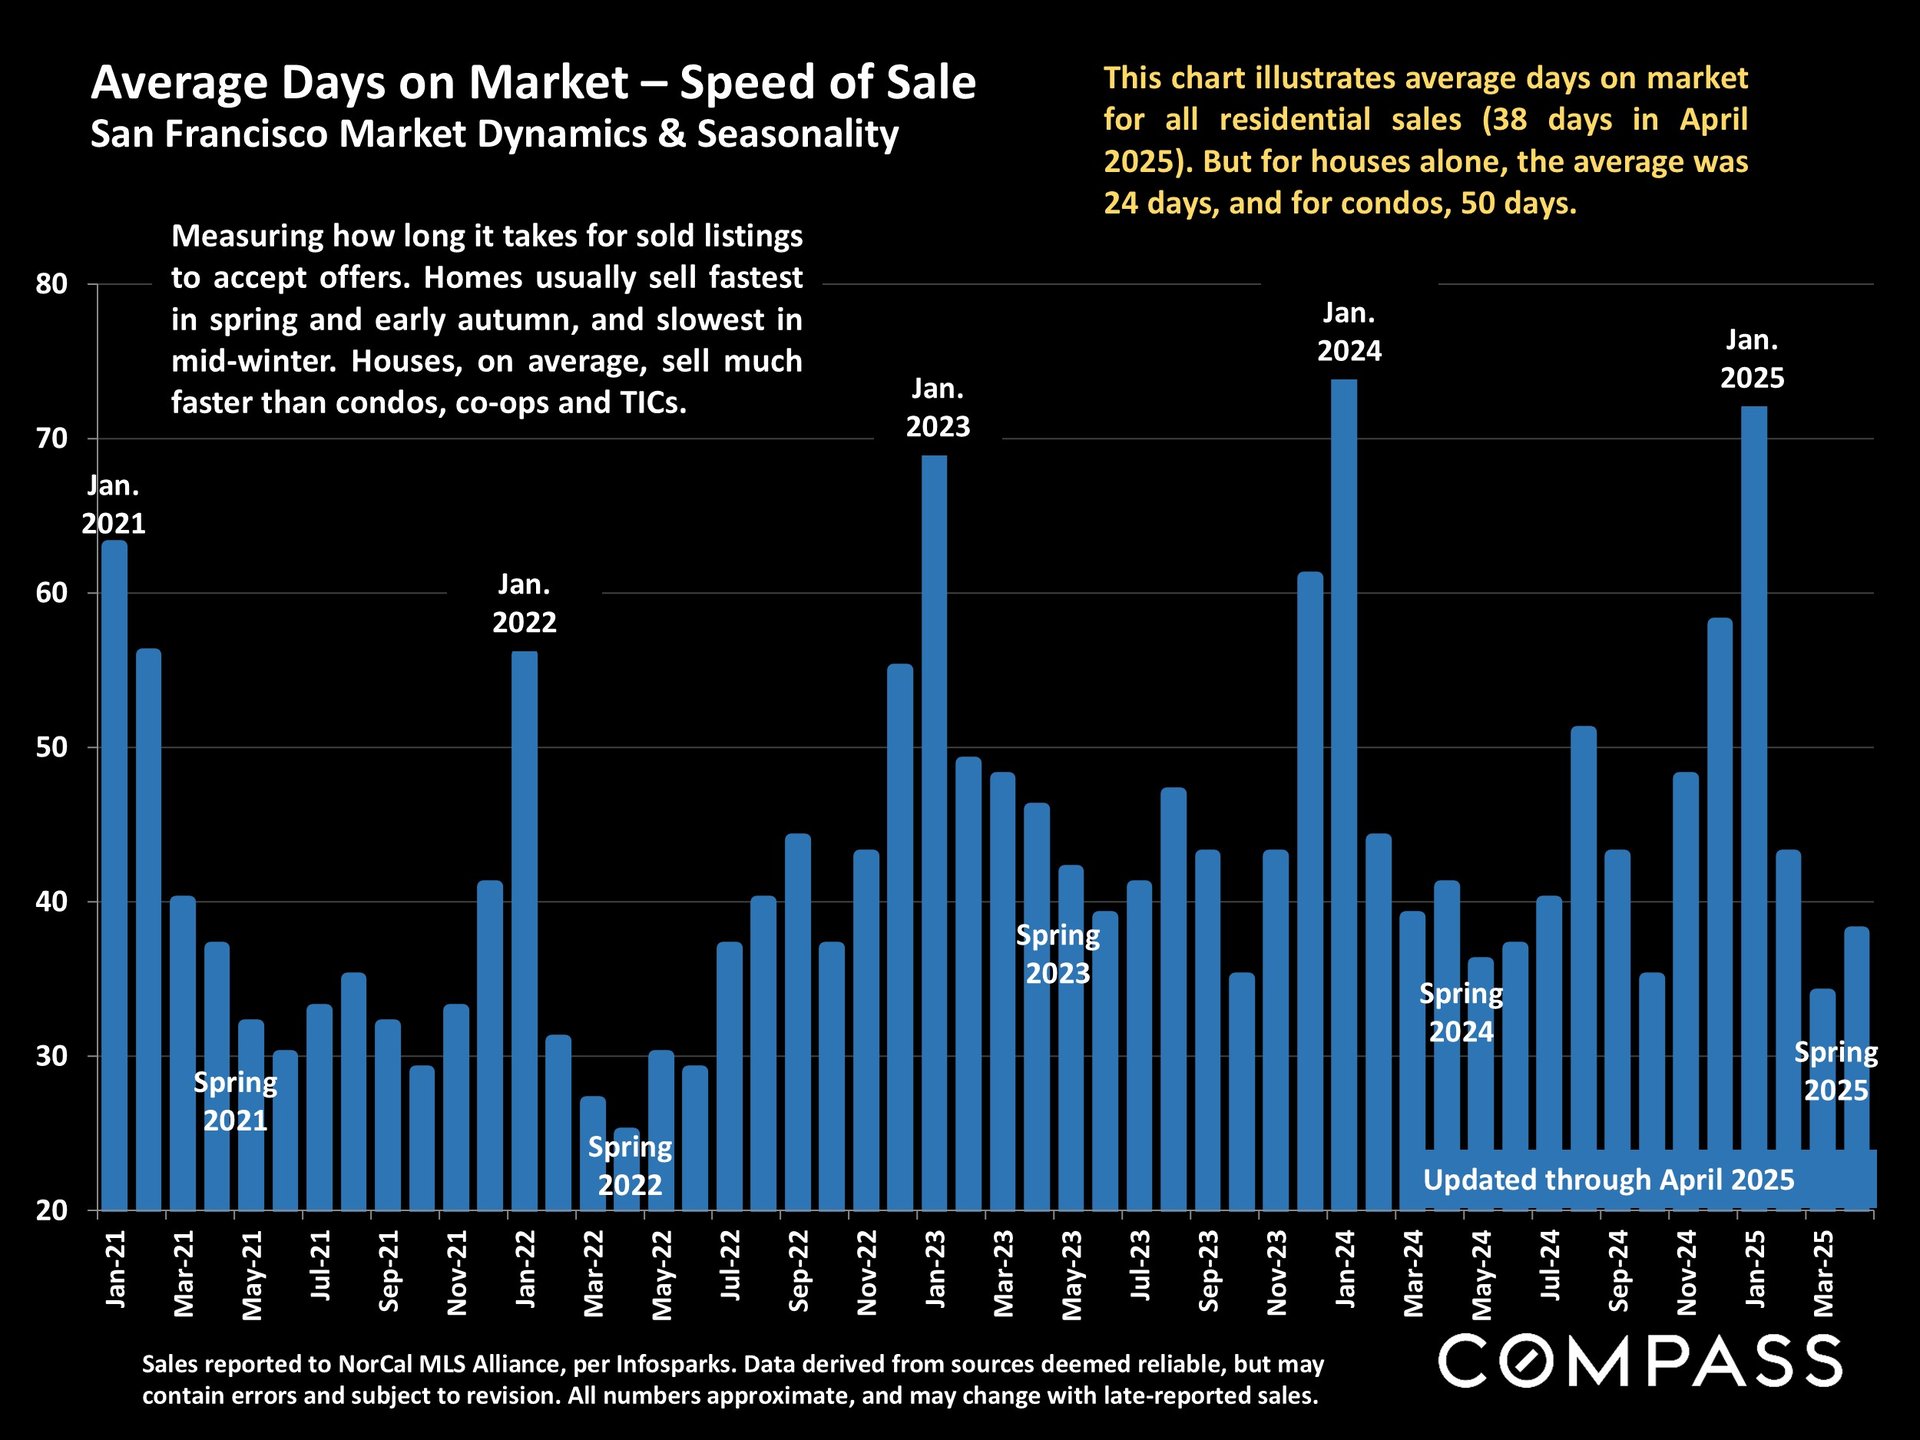
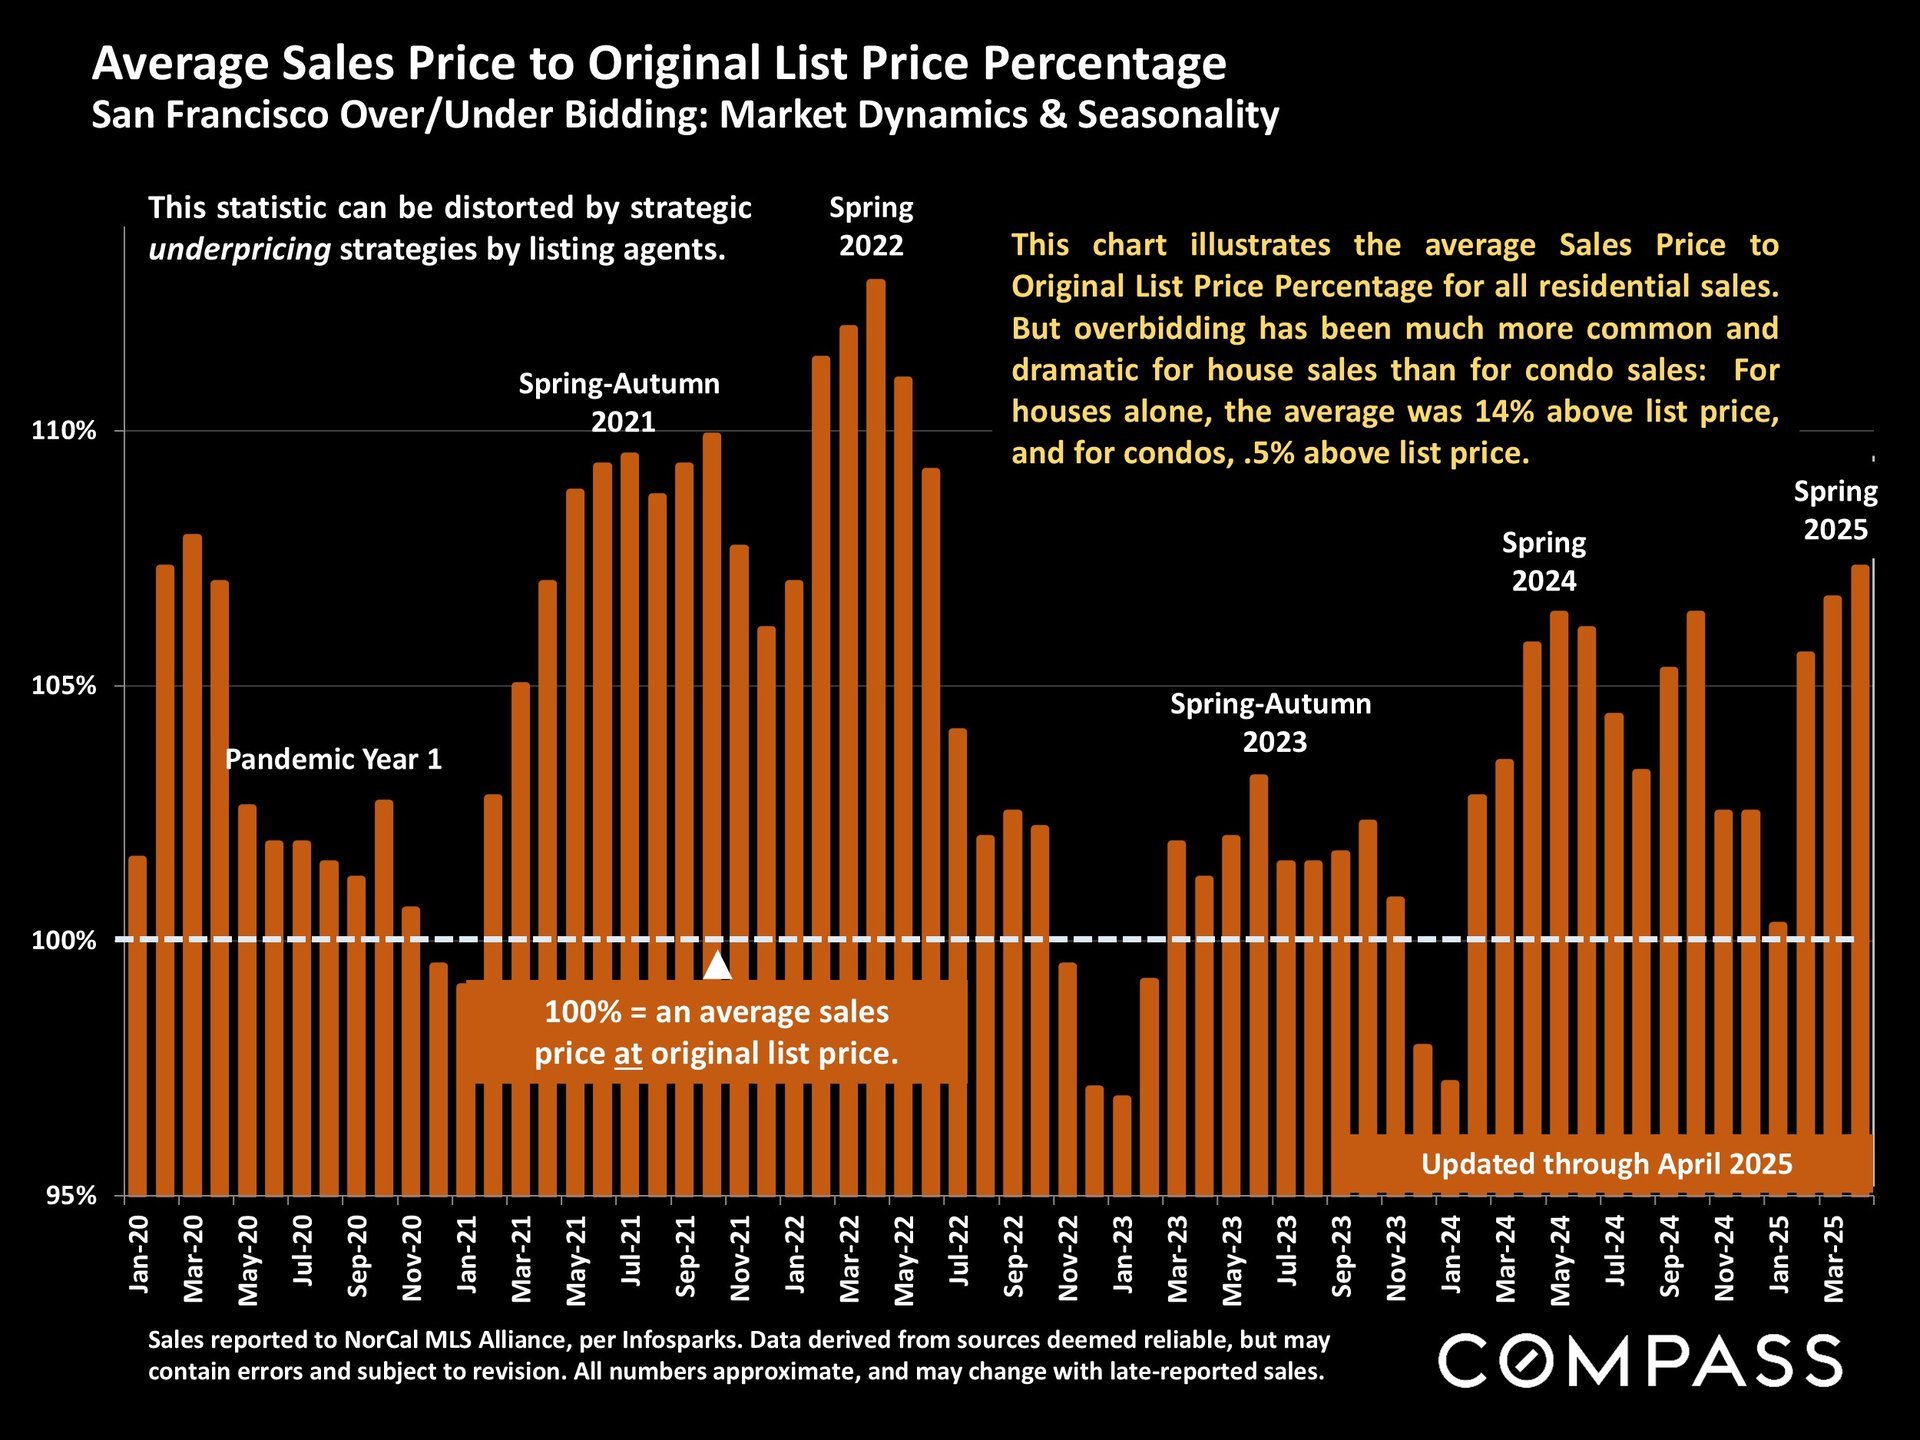
San Francisco May 2025 real estate market report on economic uncertainty, housing demand, sales, and prices.Chart of the Economic Policy Uncertainty Index from 2000 to April 2025, with a record spike in April 2025.Chart of jumbo mortgage rates from 2018 to May 2025, showing a 2023 peak above 8%.Line chart comparing Nasdaq and S&P 500 percentage changes from January 2024 through May 6, 2025.Bar chart of April 2025 Bay Area house absorption rates by county, ranging from San Mateo at 38% to Napa at 13%.Chart of San Francisco median house prices from 1990 to April 2025, with market milestones and price labels.Chart of San Francisco condo prices, 2005–April 2025, showing a 4% year-over-year decline in April.Chart comparing San Francisco condo and house median values per square foot from 2005 through April 2025.Chart of San Francisco two-bedroom condo prices downtown and outside downtown, 2005–2025.Chart of median house prices in selected San Francisco neighborhoods, from $8.3 million in Presidio Heights to $918,500 in Bayview.Chart of median San Francisco condo prices by neighborhood, with selected high sales and Compass branding.Bar chart of San Francisco new listings from January 2021 to April 2025, with April 2025 highlighted and seasonal patterns labeled.Chart of San Francisco active and coming-soon listings, showing 1,310 listings on May 1, 2025, up 9% year over year.San Francisco listings-under-contract chart from August 2021 to April 2025, with an April 2025 year-over-year increase.Chart of San Francisco monthly listing absorption rates through April 2025, with gold bars and April 2025 rates highlighted.Chart of San Francisco monthly home sales, January 2020–April 2025, highlighting seasonality and April 2025 figures.Chart of San Francisco sales of homes priced at $5 million or more, updated through April 2025.Bar chart of San Francisco $5 million-plus house sales, showing a pandemic-era peak and decline through April 2025.Bar chart of San Francisco luxury condo and co-op sales from 2019 to April 2025; April 2025 reached a high since May 2022.Bar chart of San Francisco active-listing price reductions from January 2020 through April 2025.Chart of San Francisco active listings with price reductions, January 2020 through April 2025.Chart of San Francisco home sales closing over list price, updated through April 2025.Bar chart of San Francisco average days on market from 2021 to 2025, updated through April 2025.Chart of San Francisco sale prices versus original list prices, with monthly data from 2020 through March 2025.Real estate report notes explain market statistics, valuation measures, data limitations, and Compass disclosures.

Work With Us

We will help you understand the complex aspects of the transaction and share our expertise so that you can make the best decisions possible. We are experienced, market savvy, and energetic. With both of us working for our clients, you get twice the amount of attention and insight.