
The SF Team, Eva + James, Compass

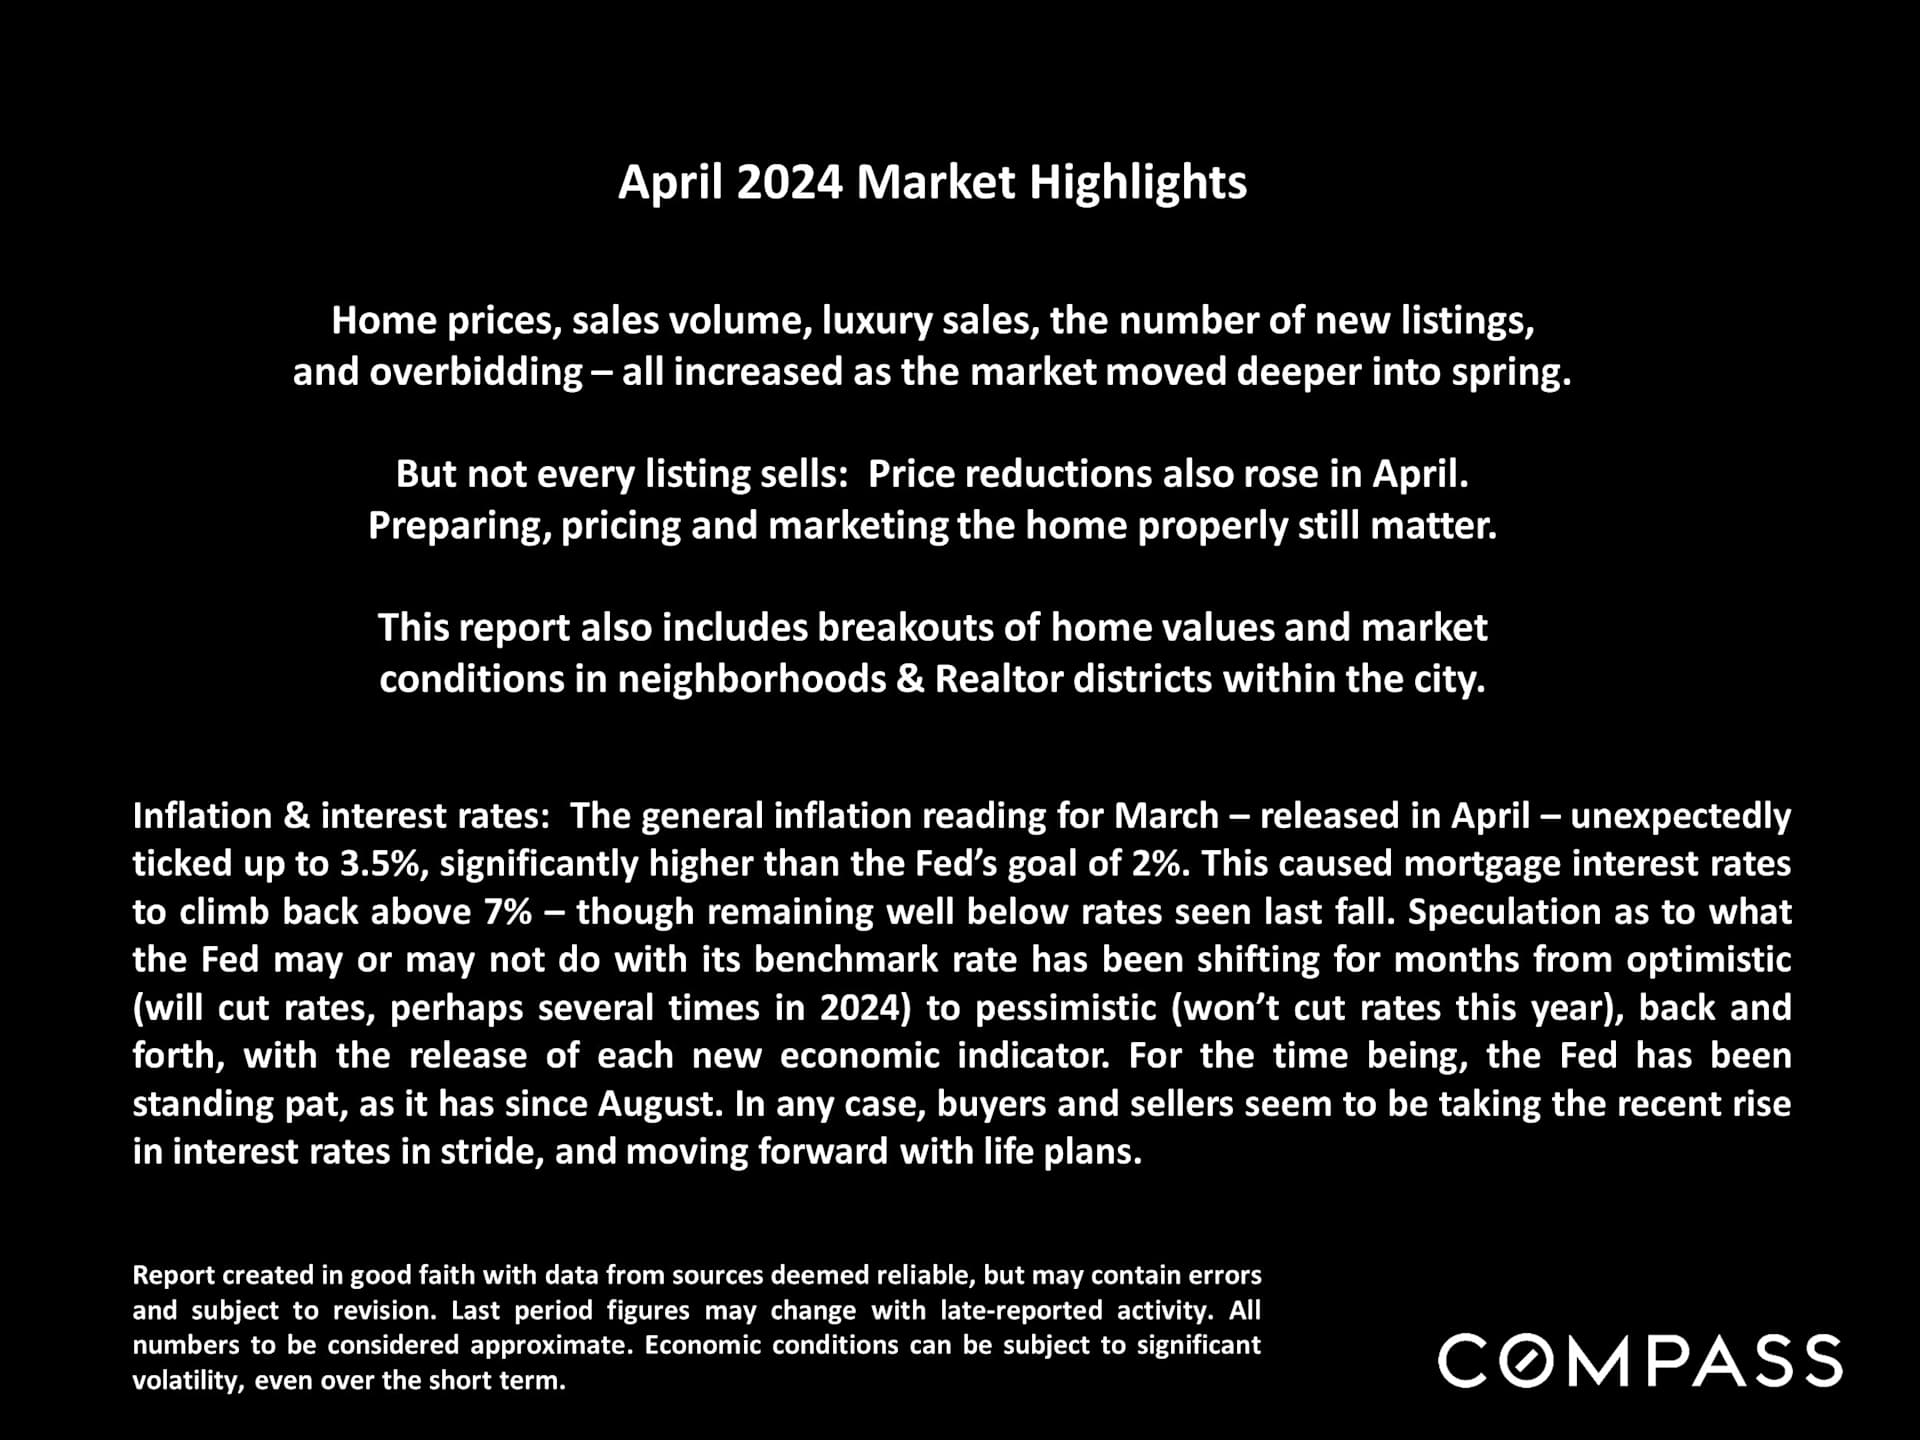
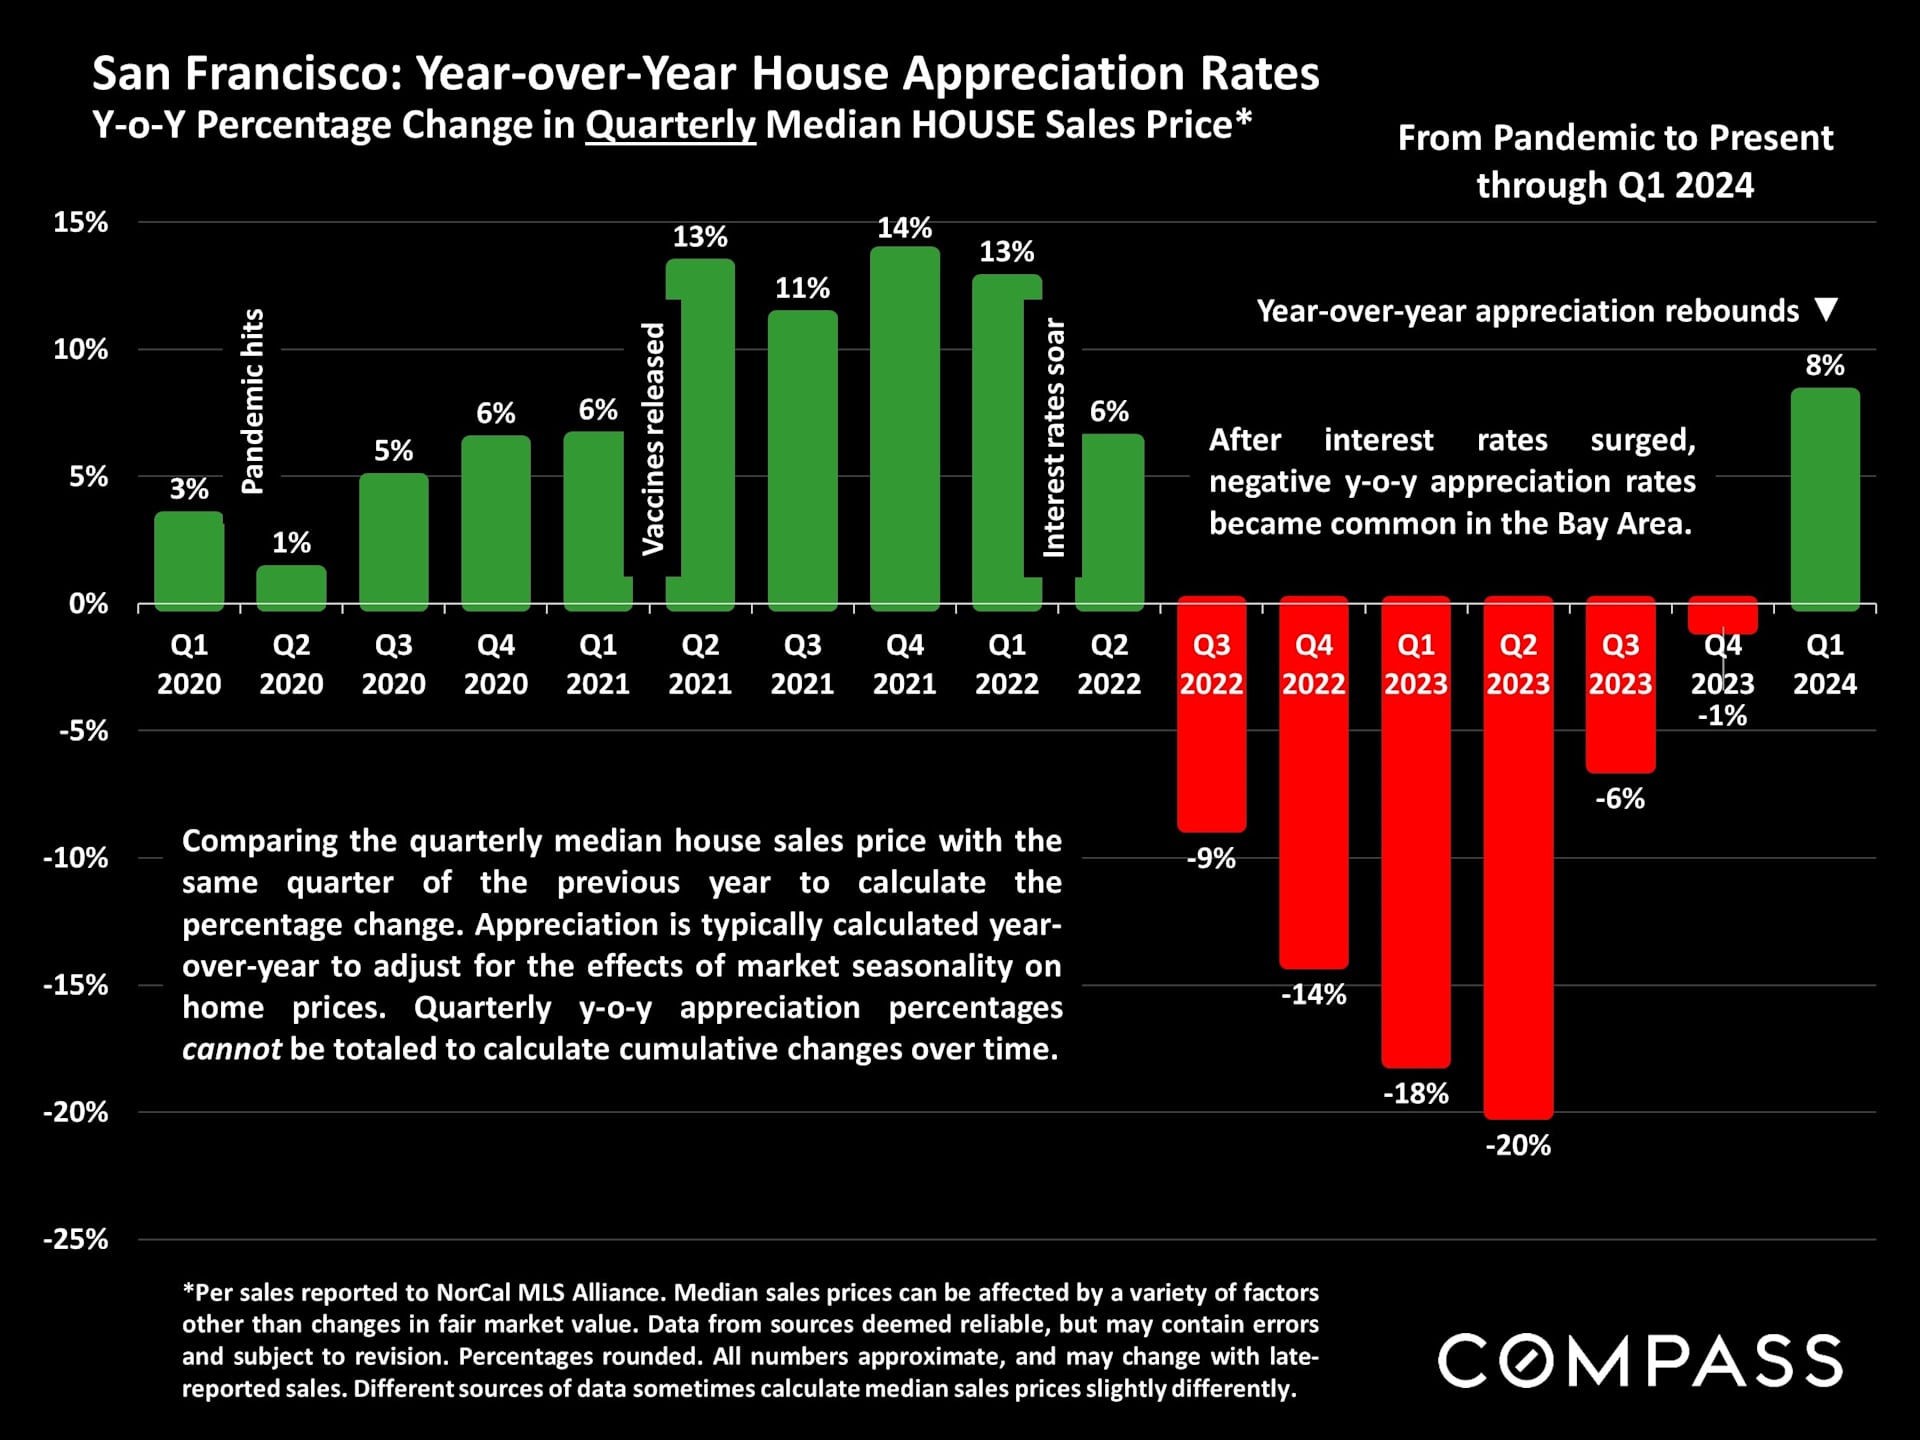
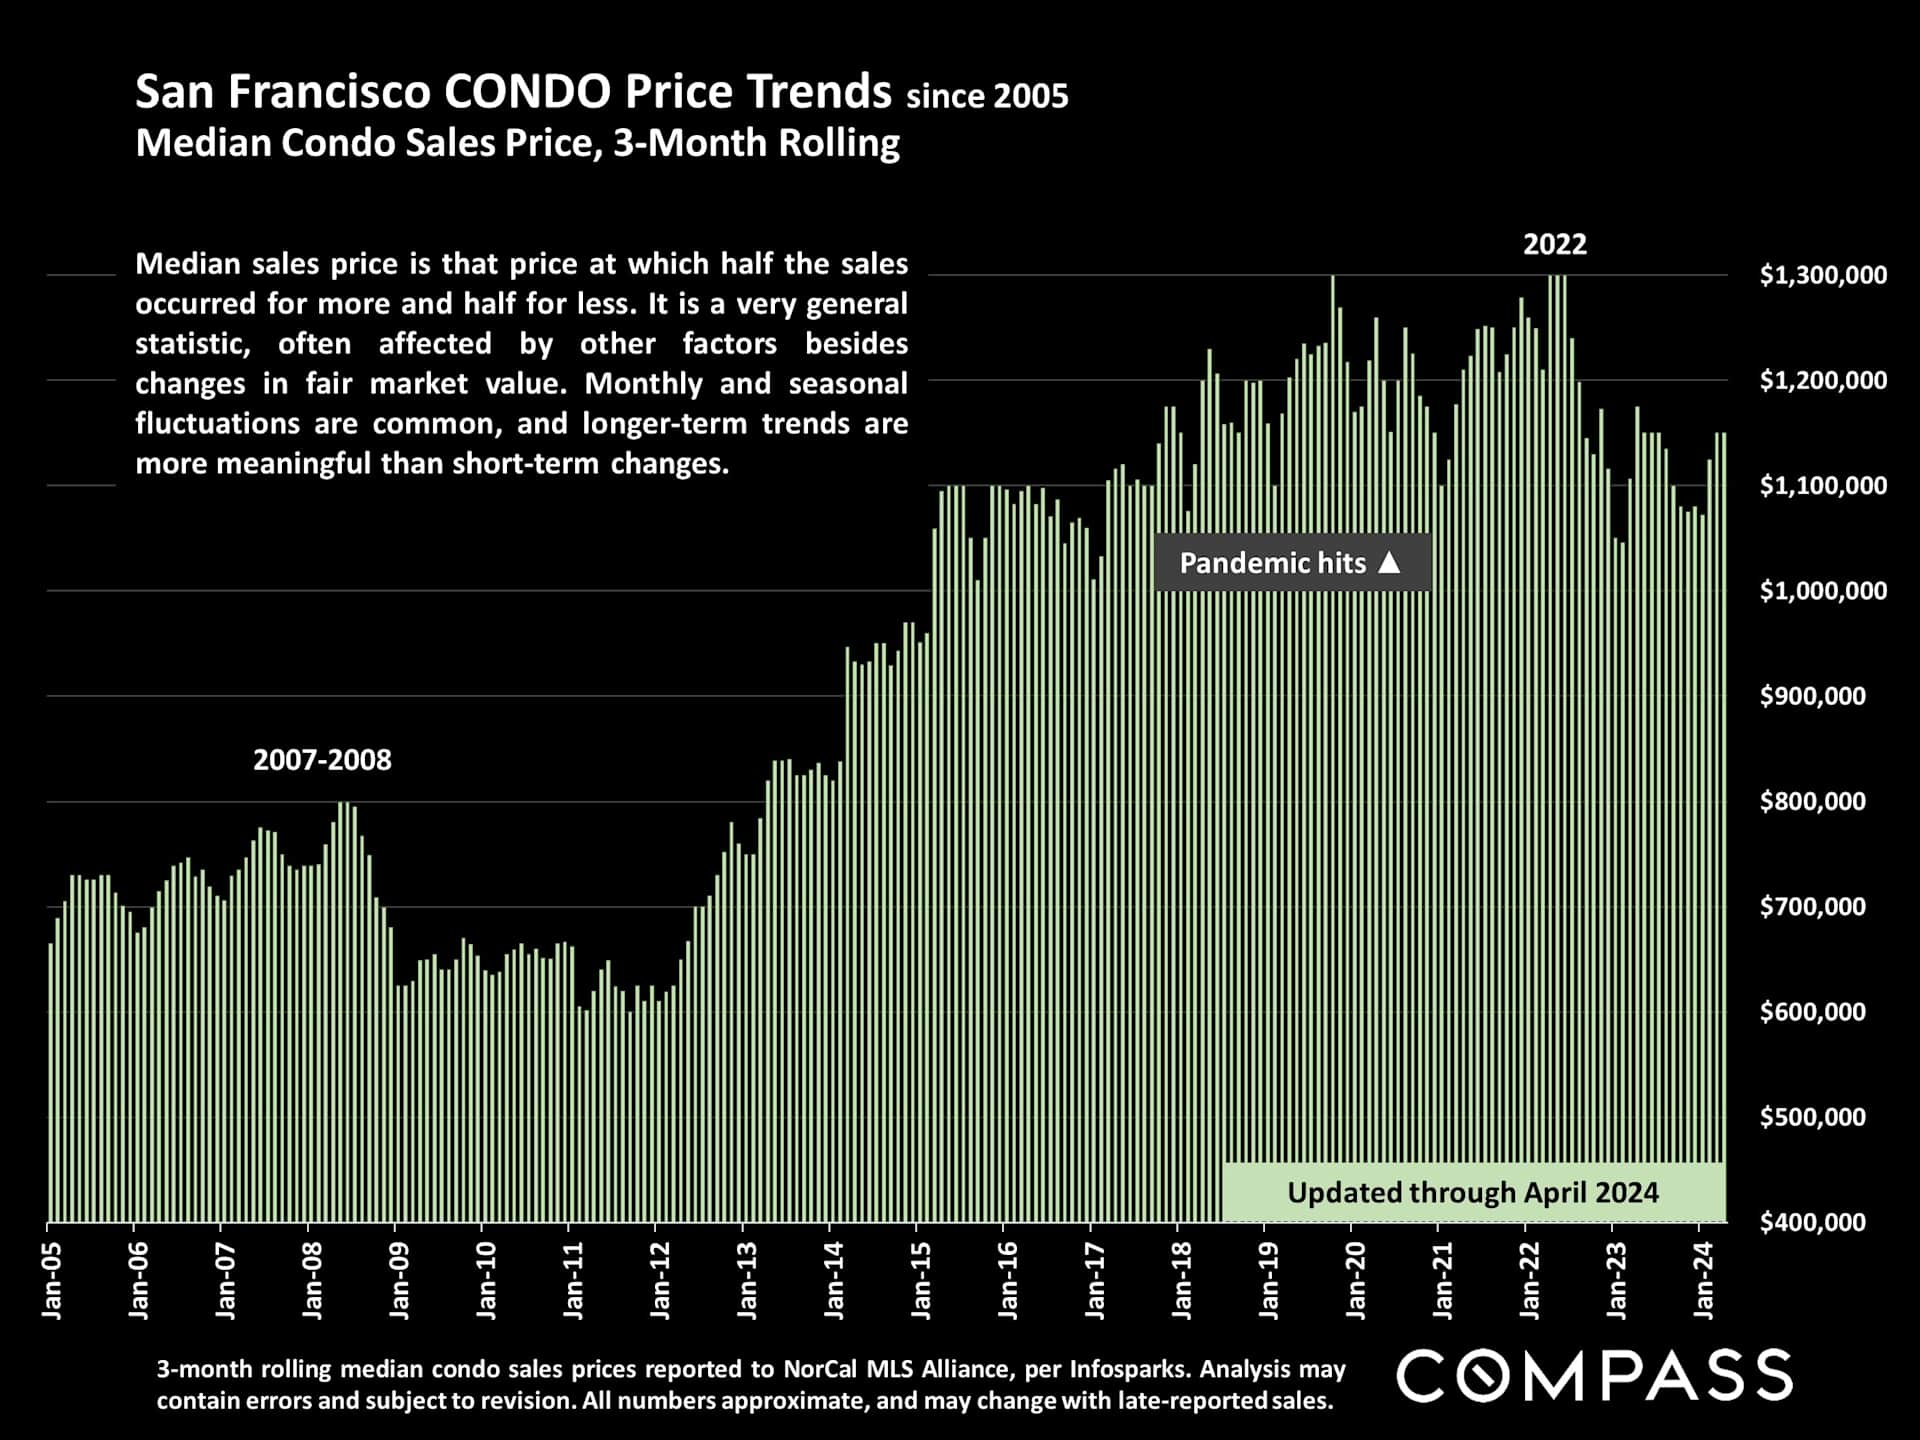
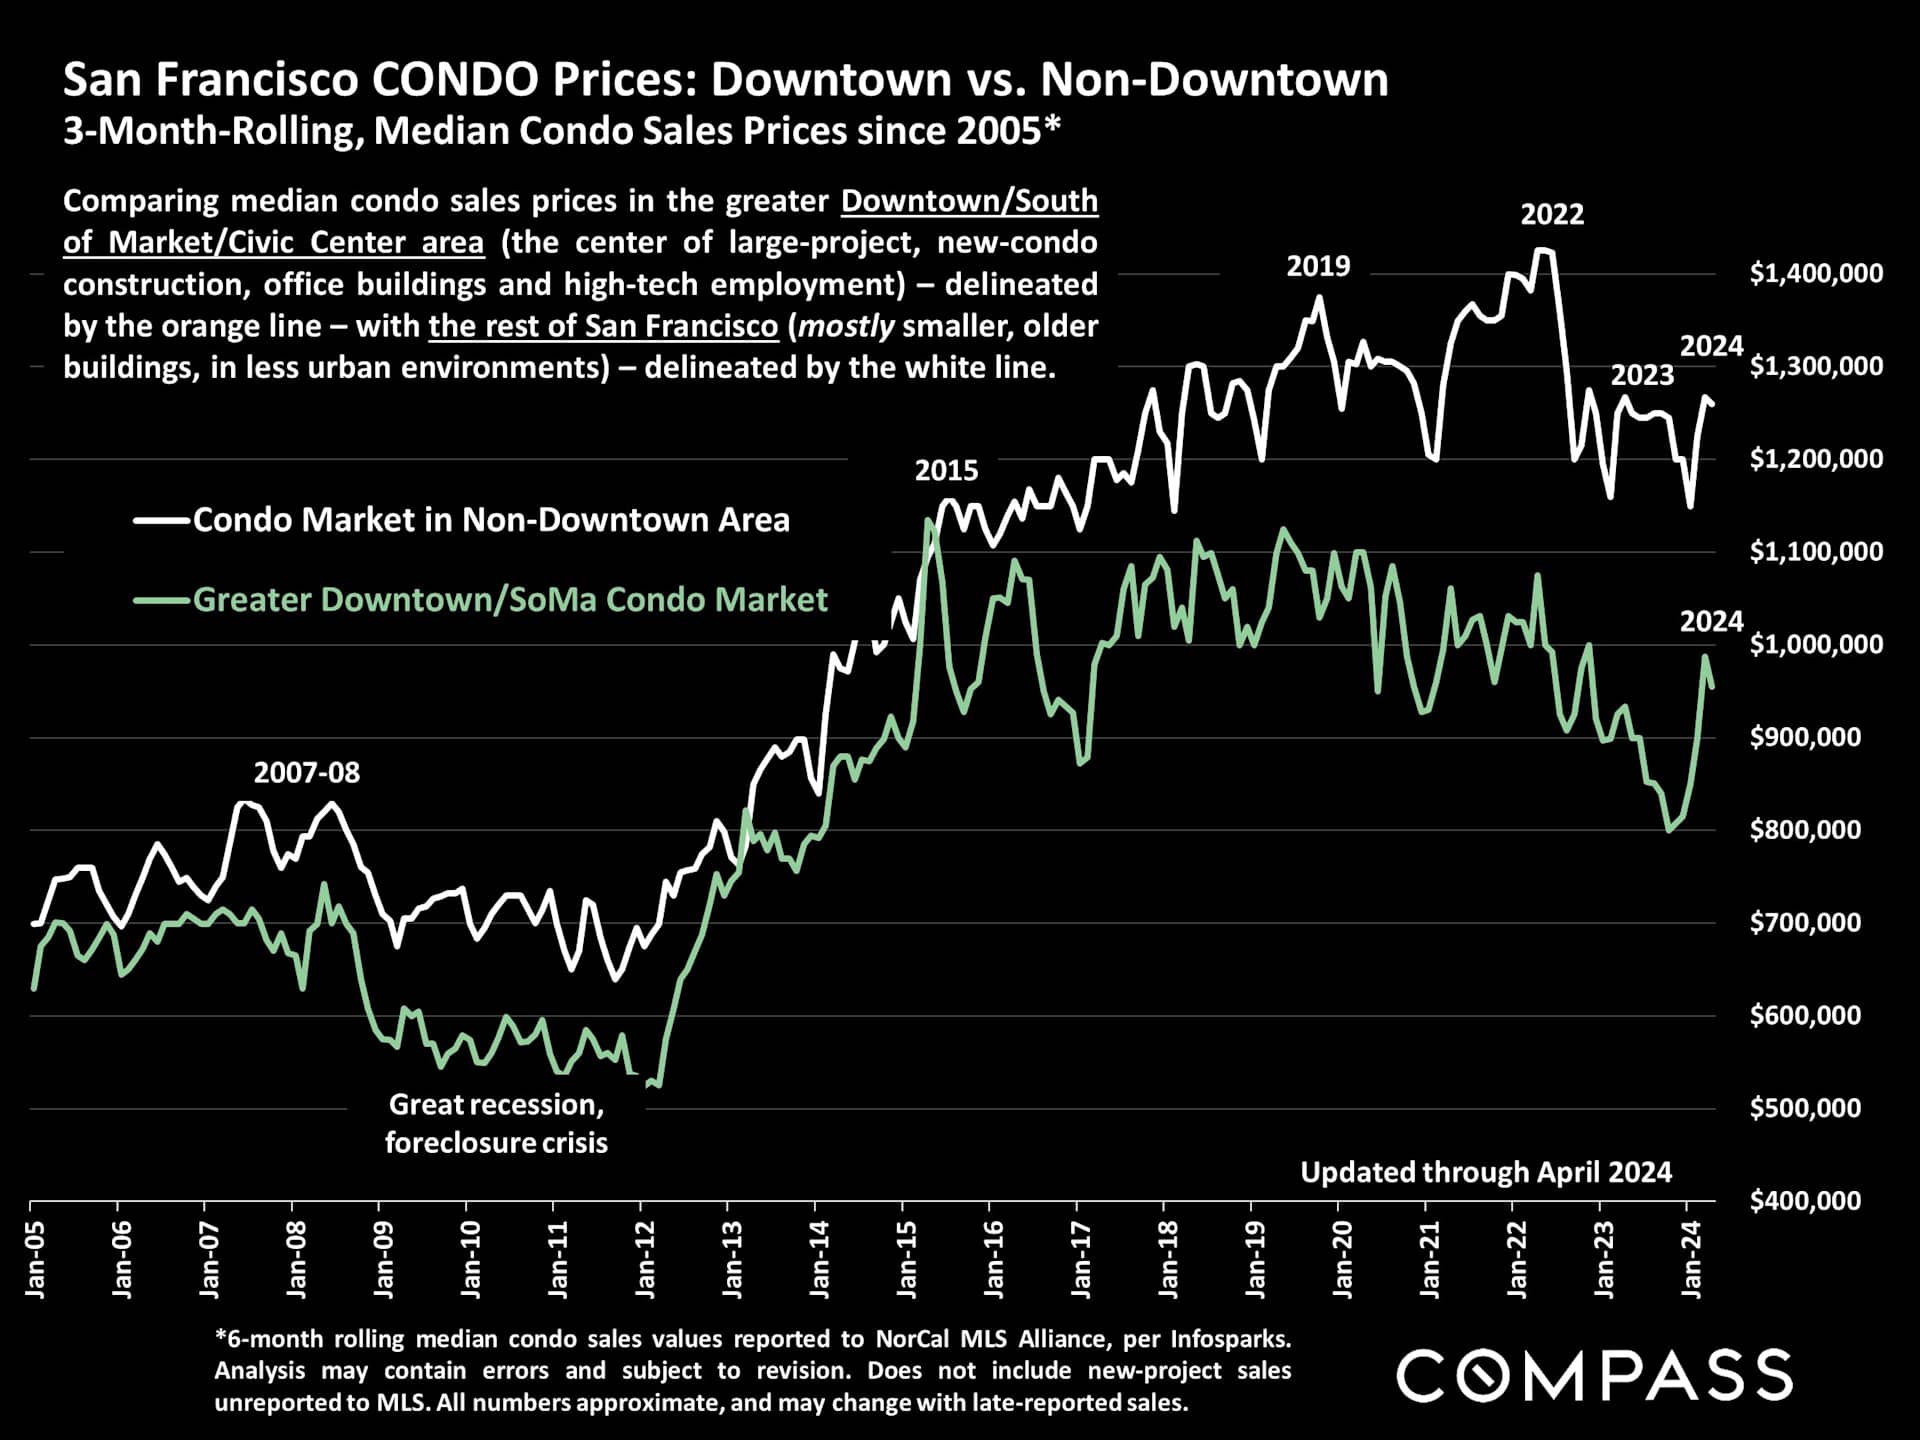
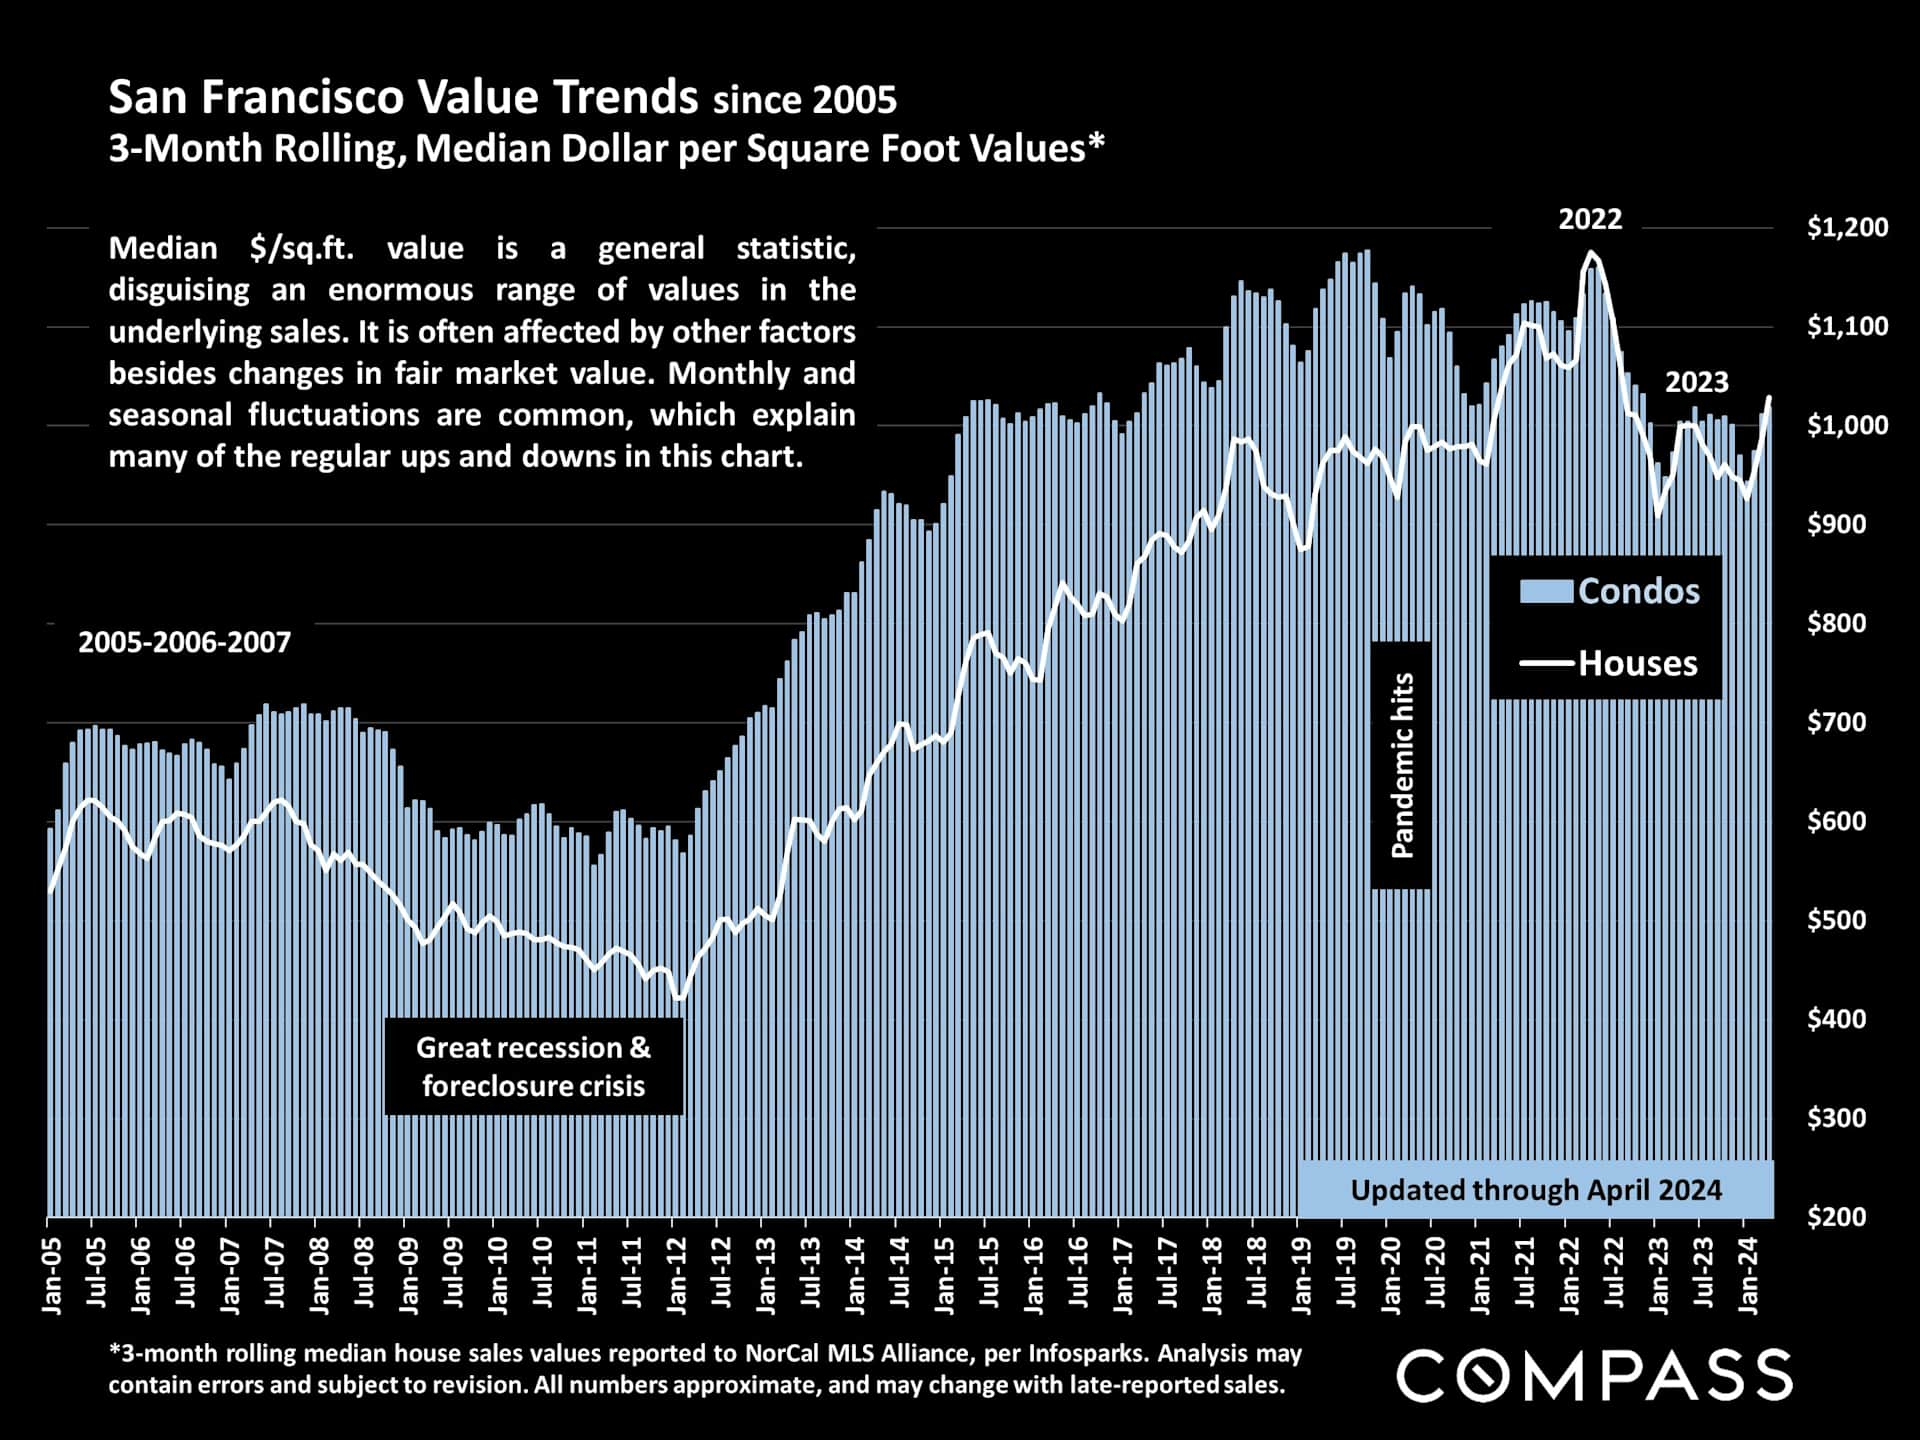
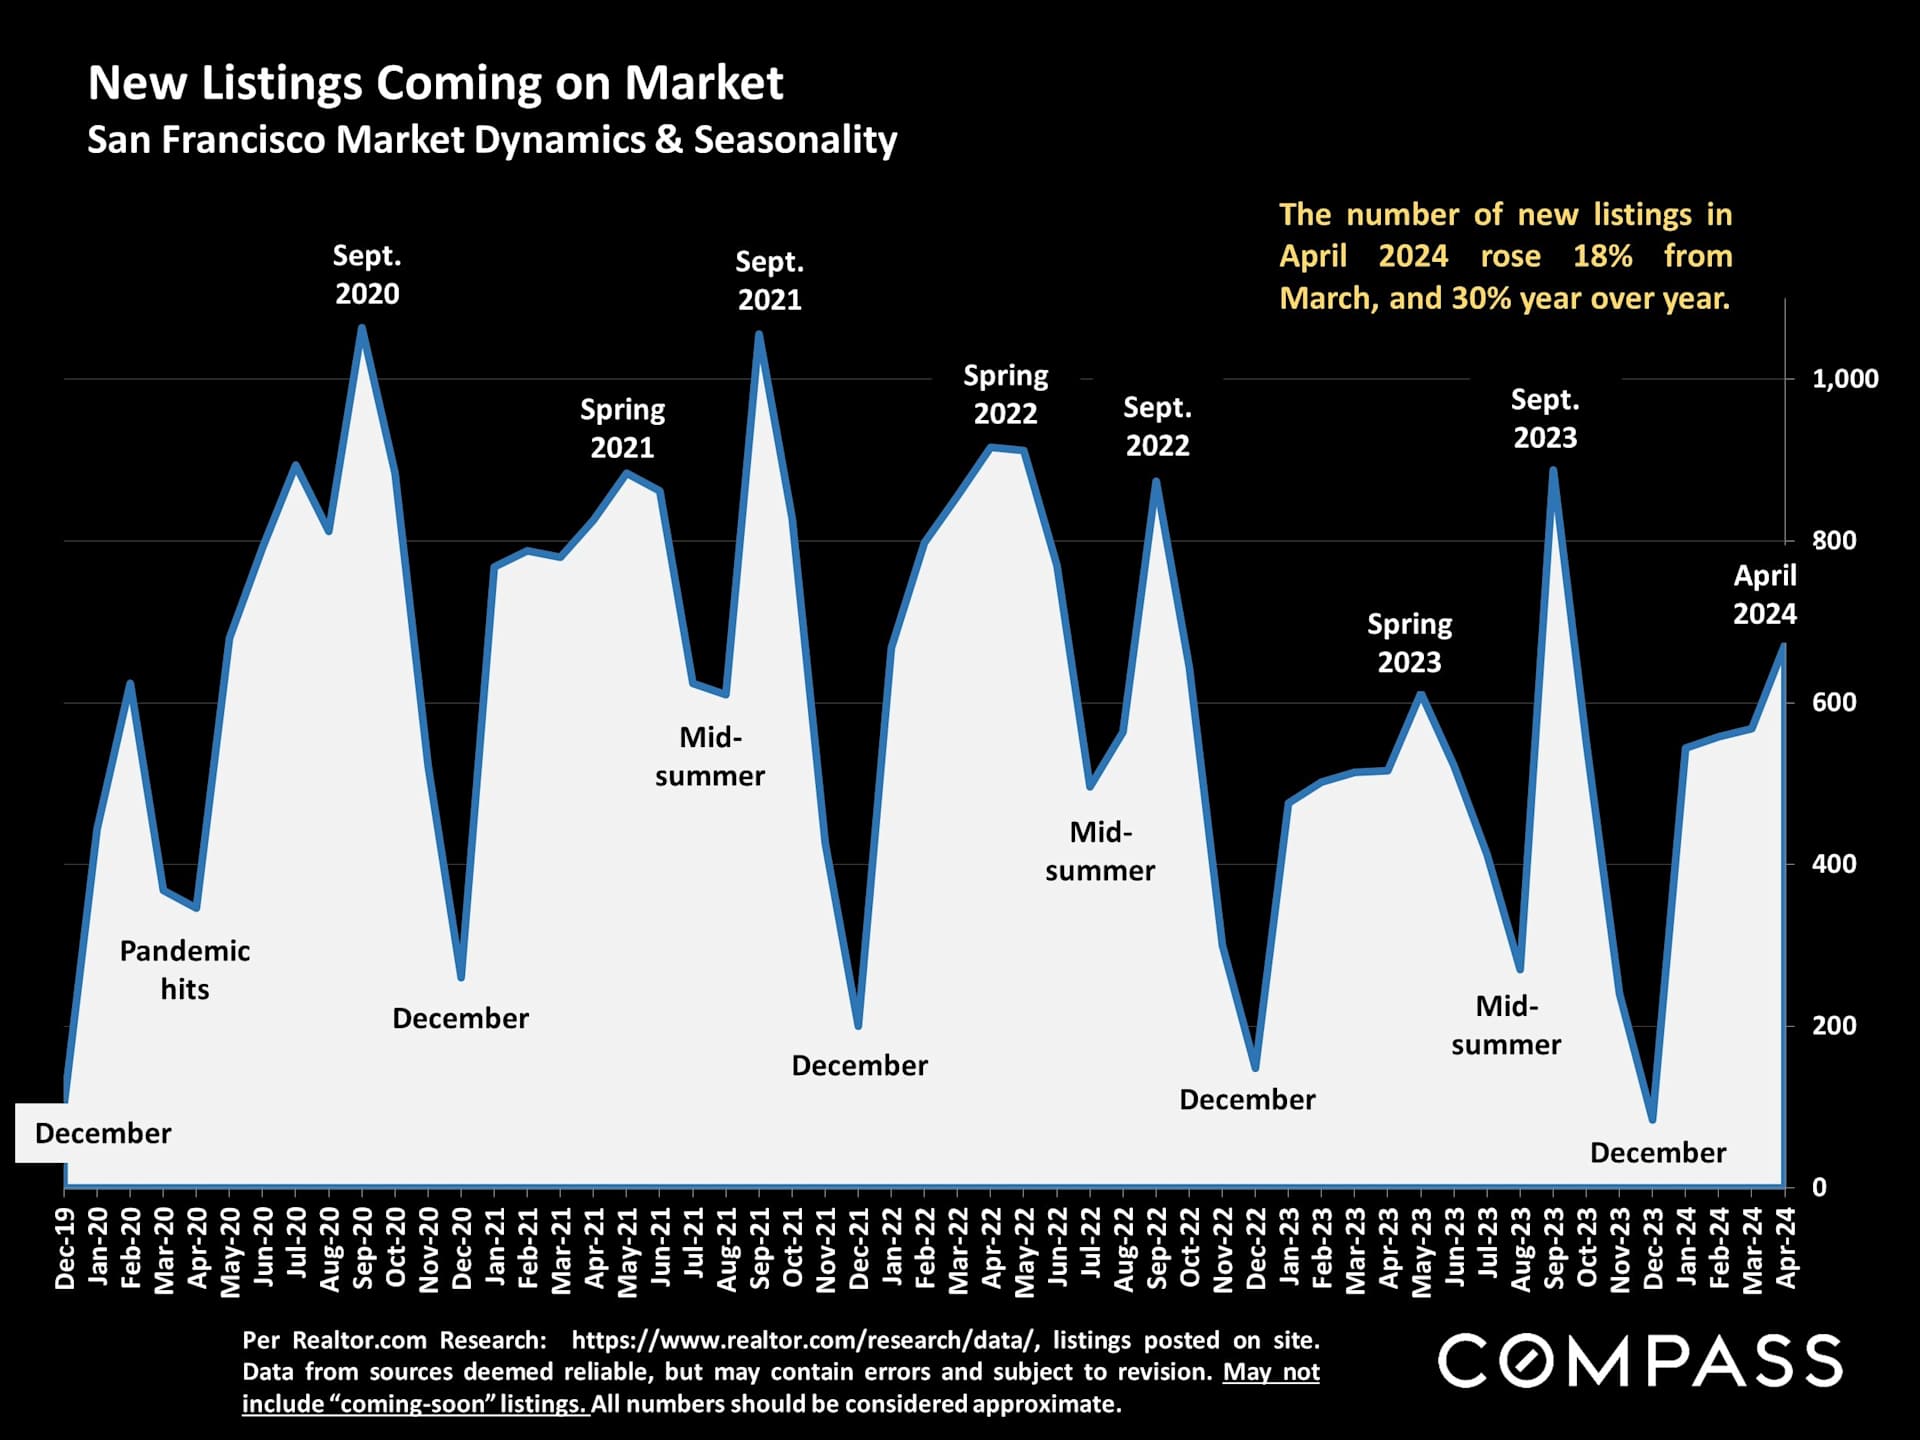
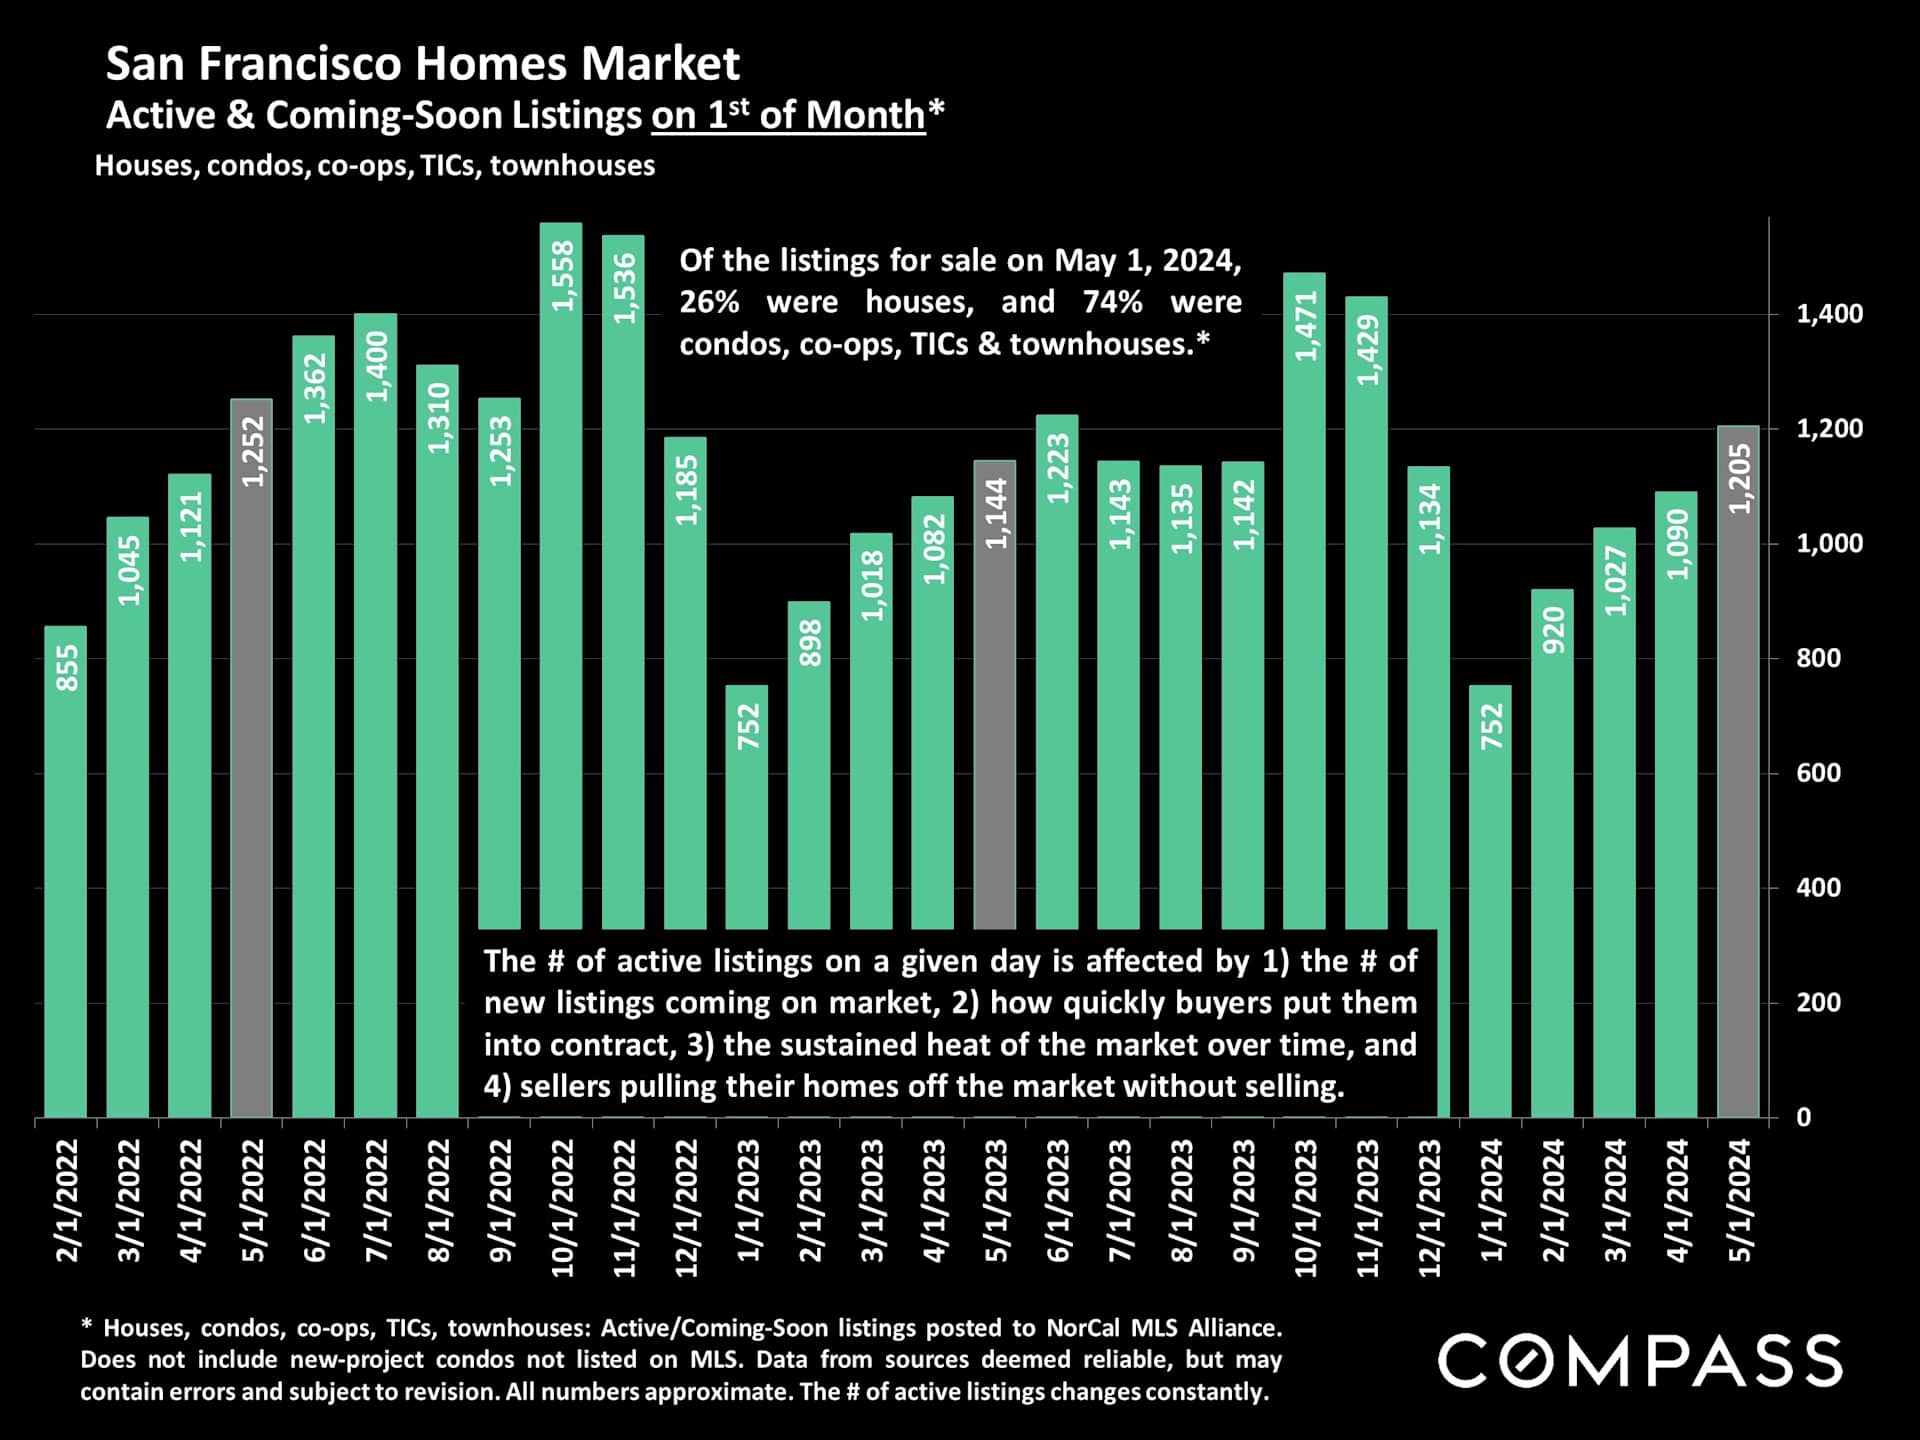
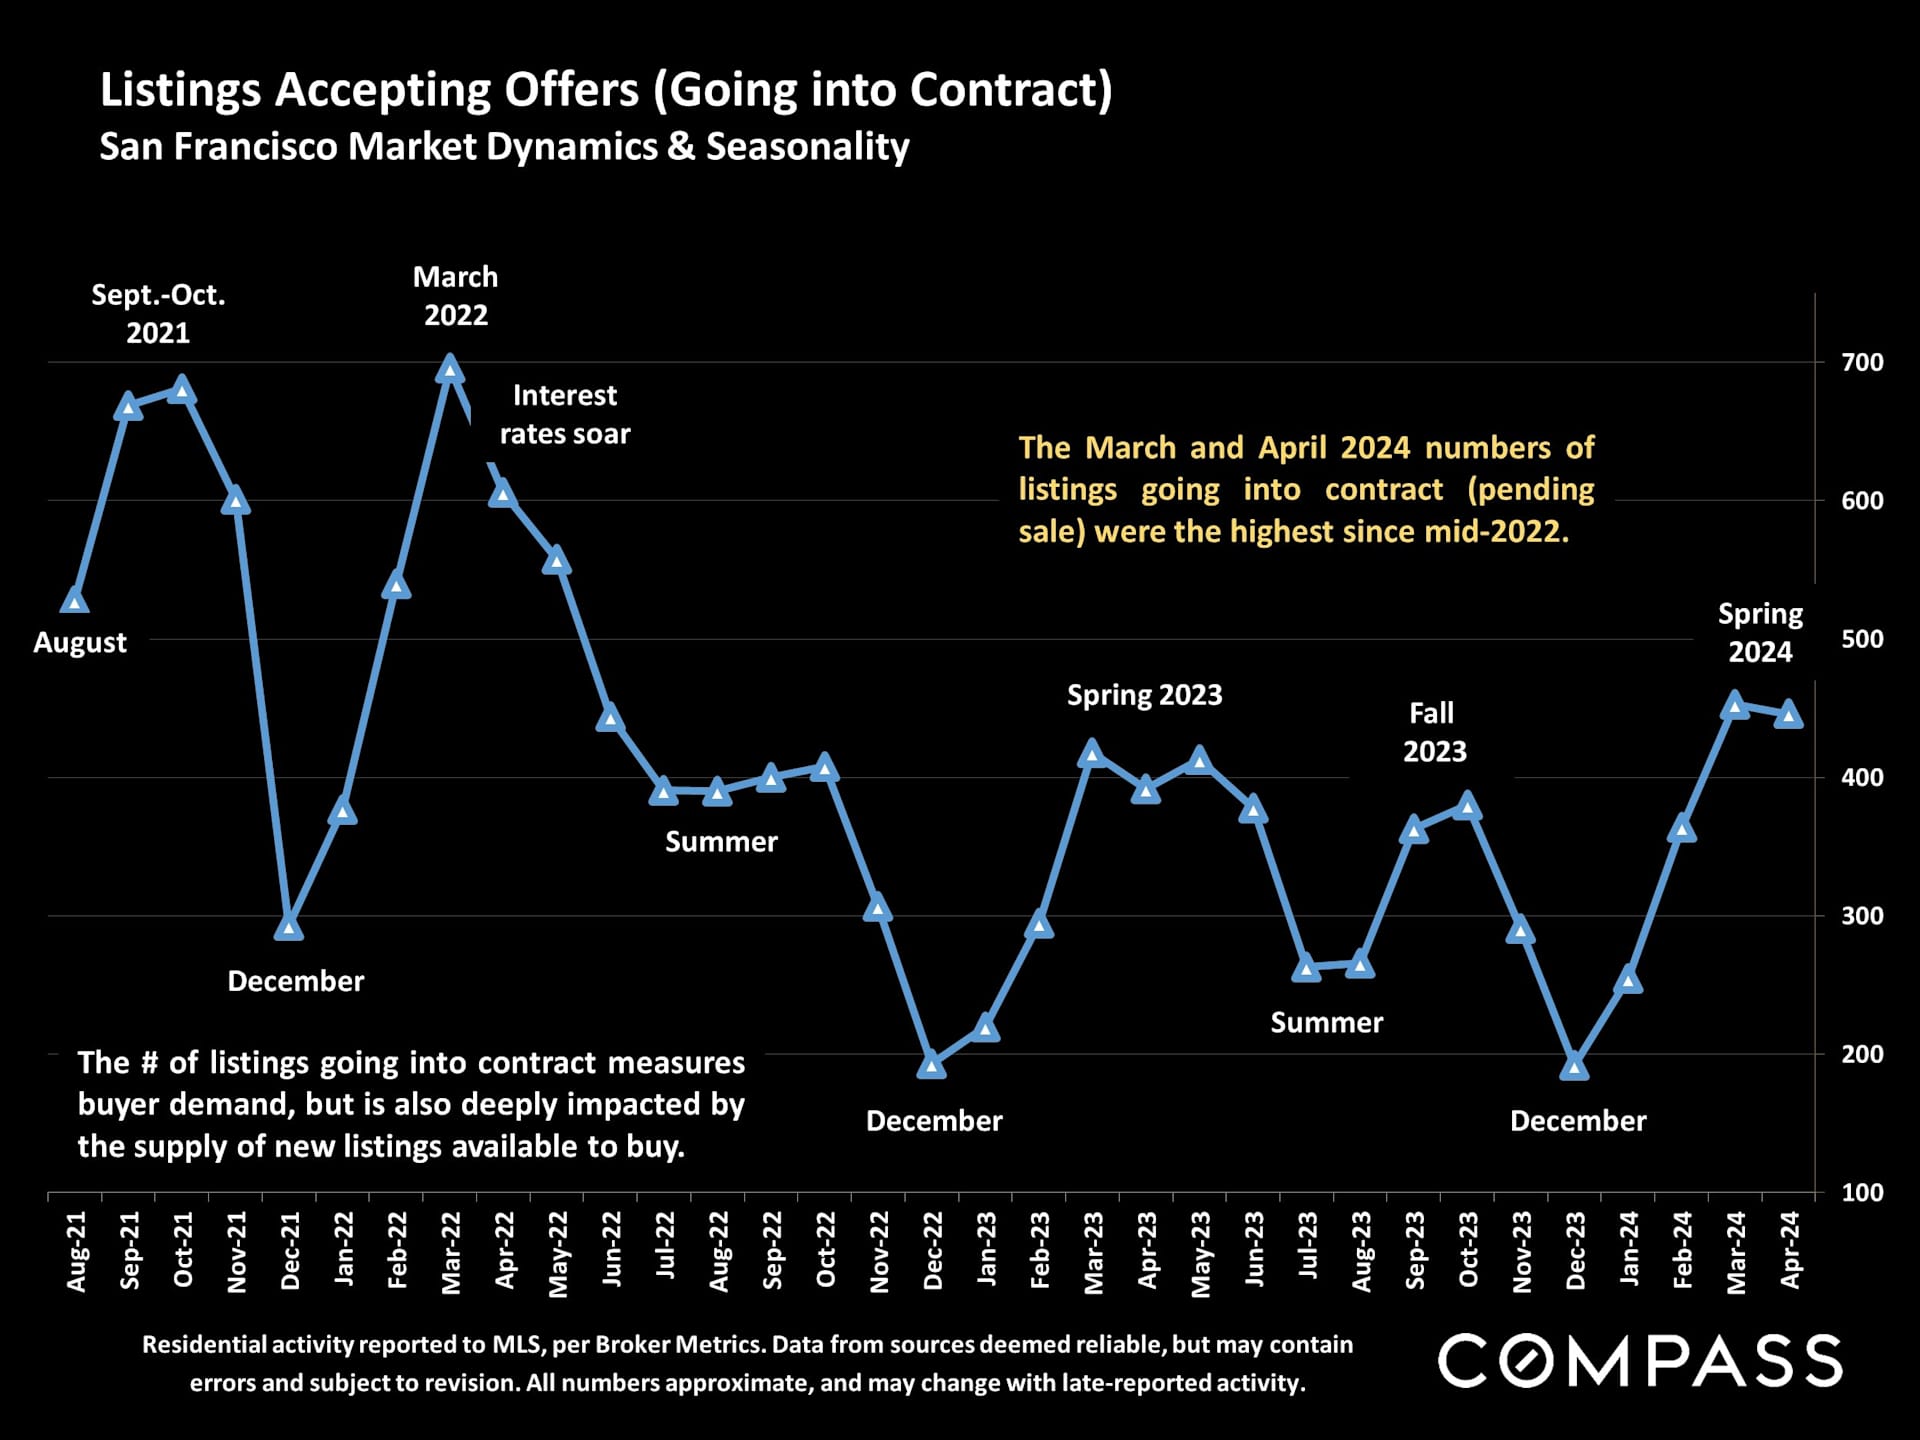
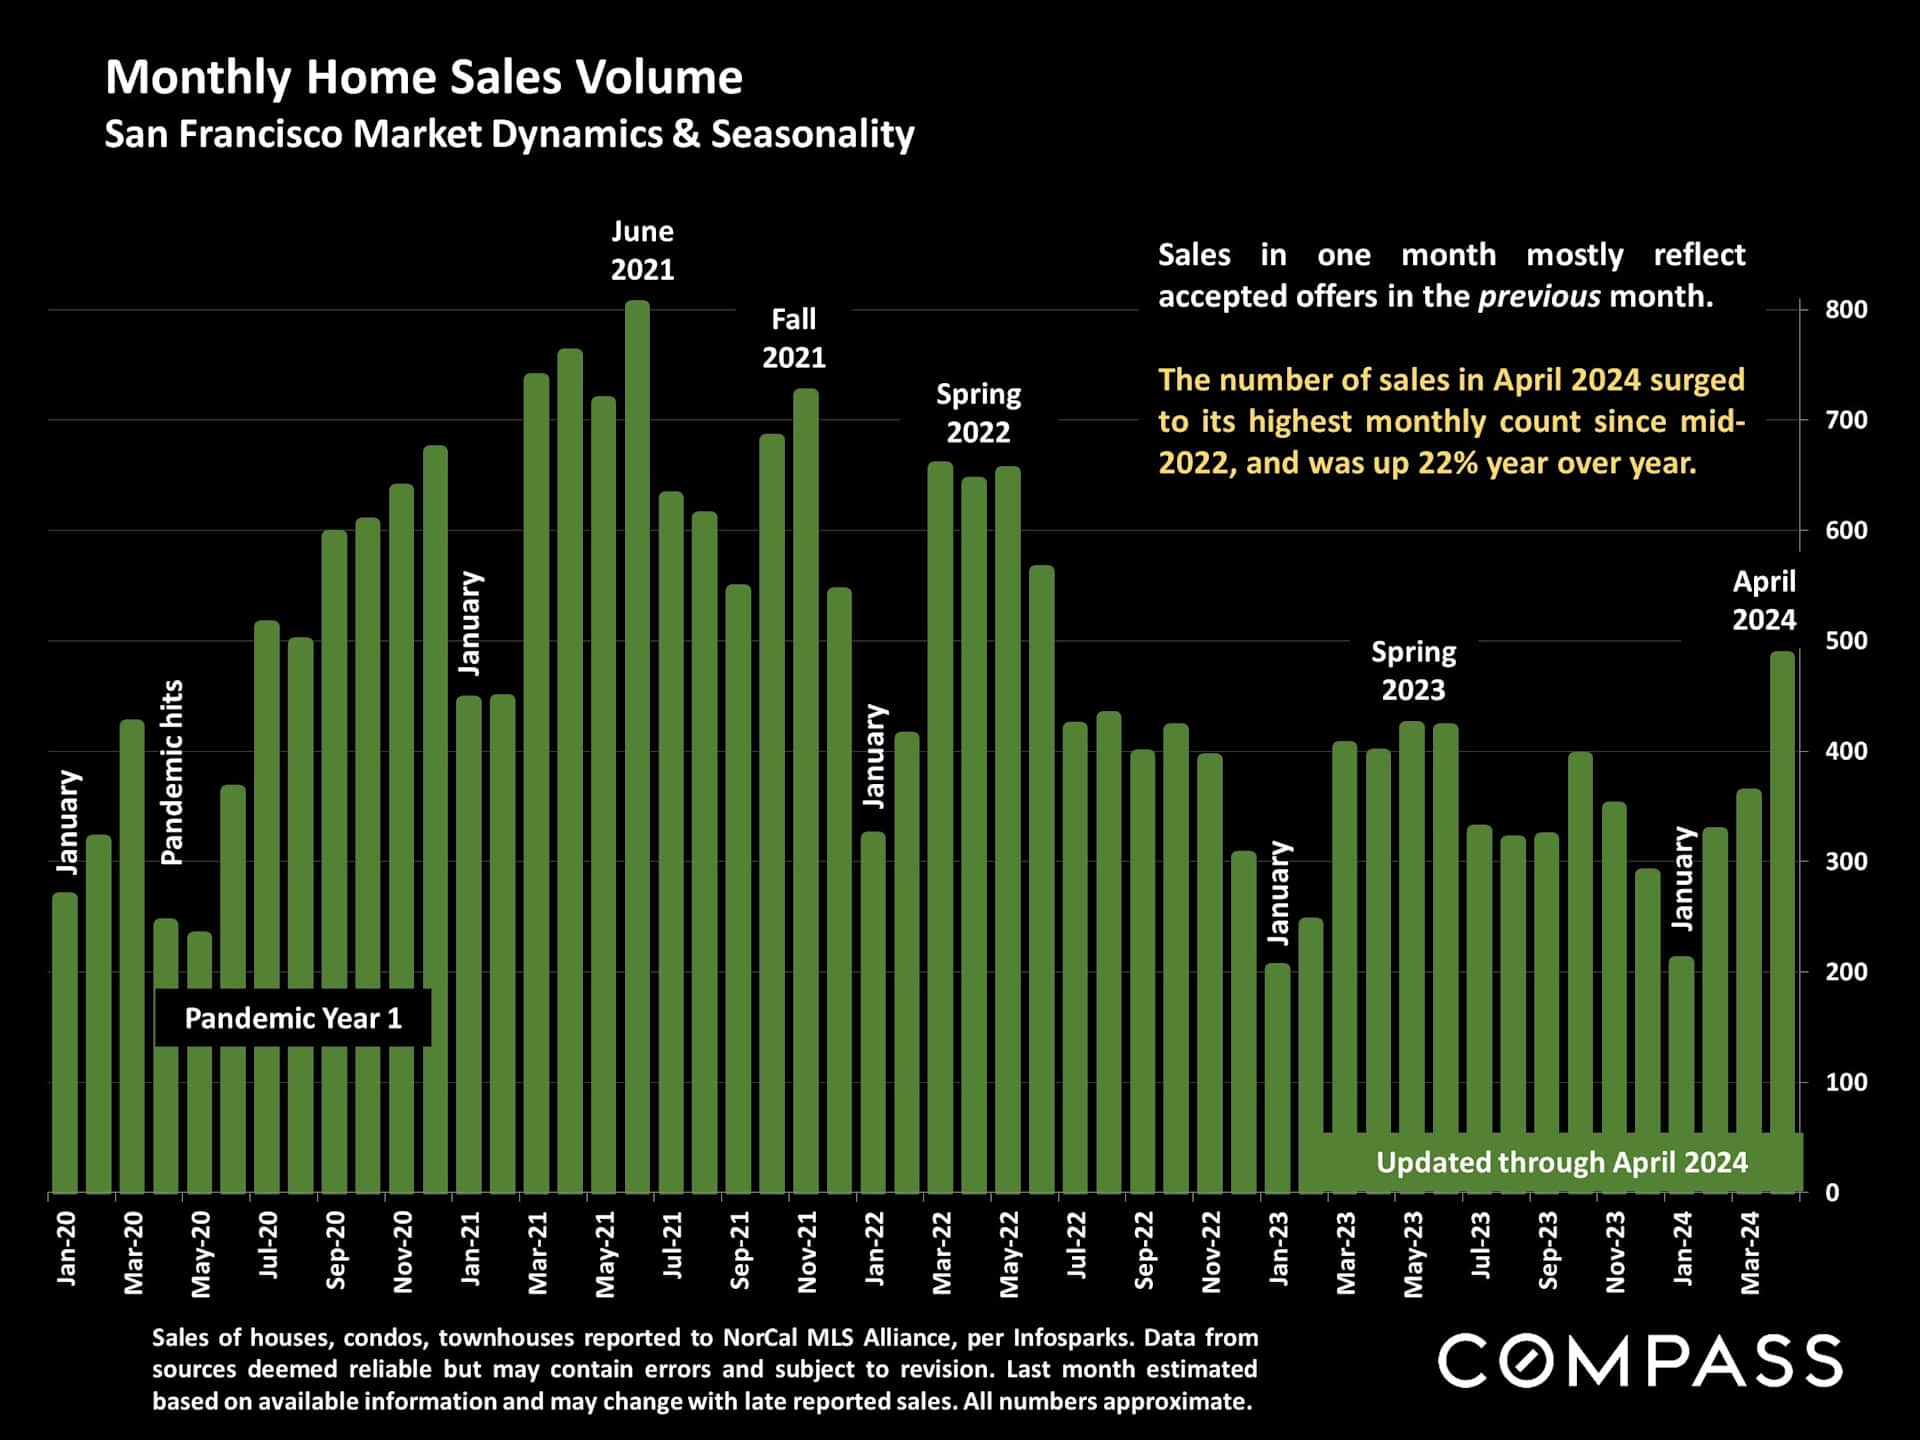
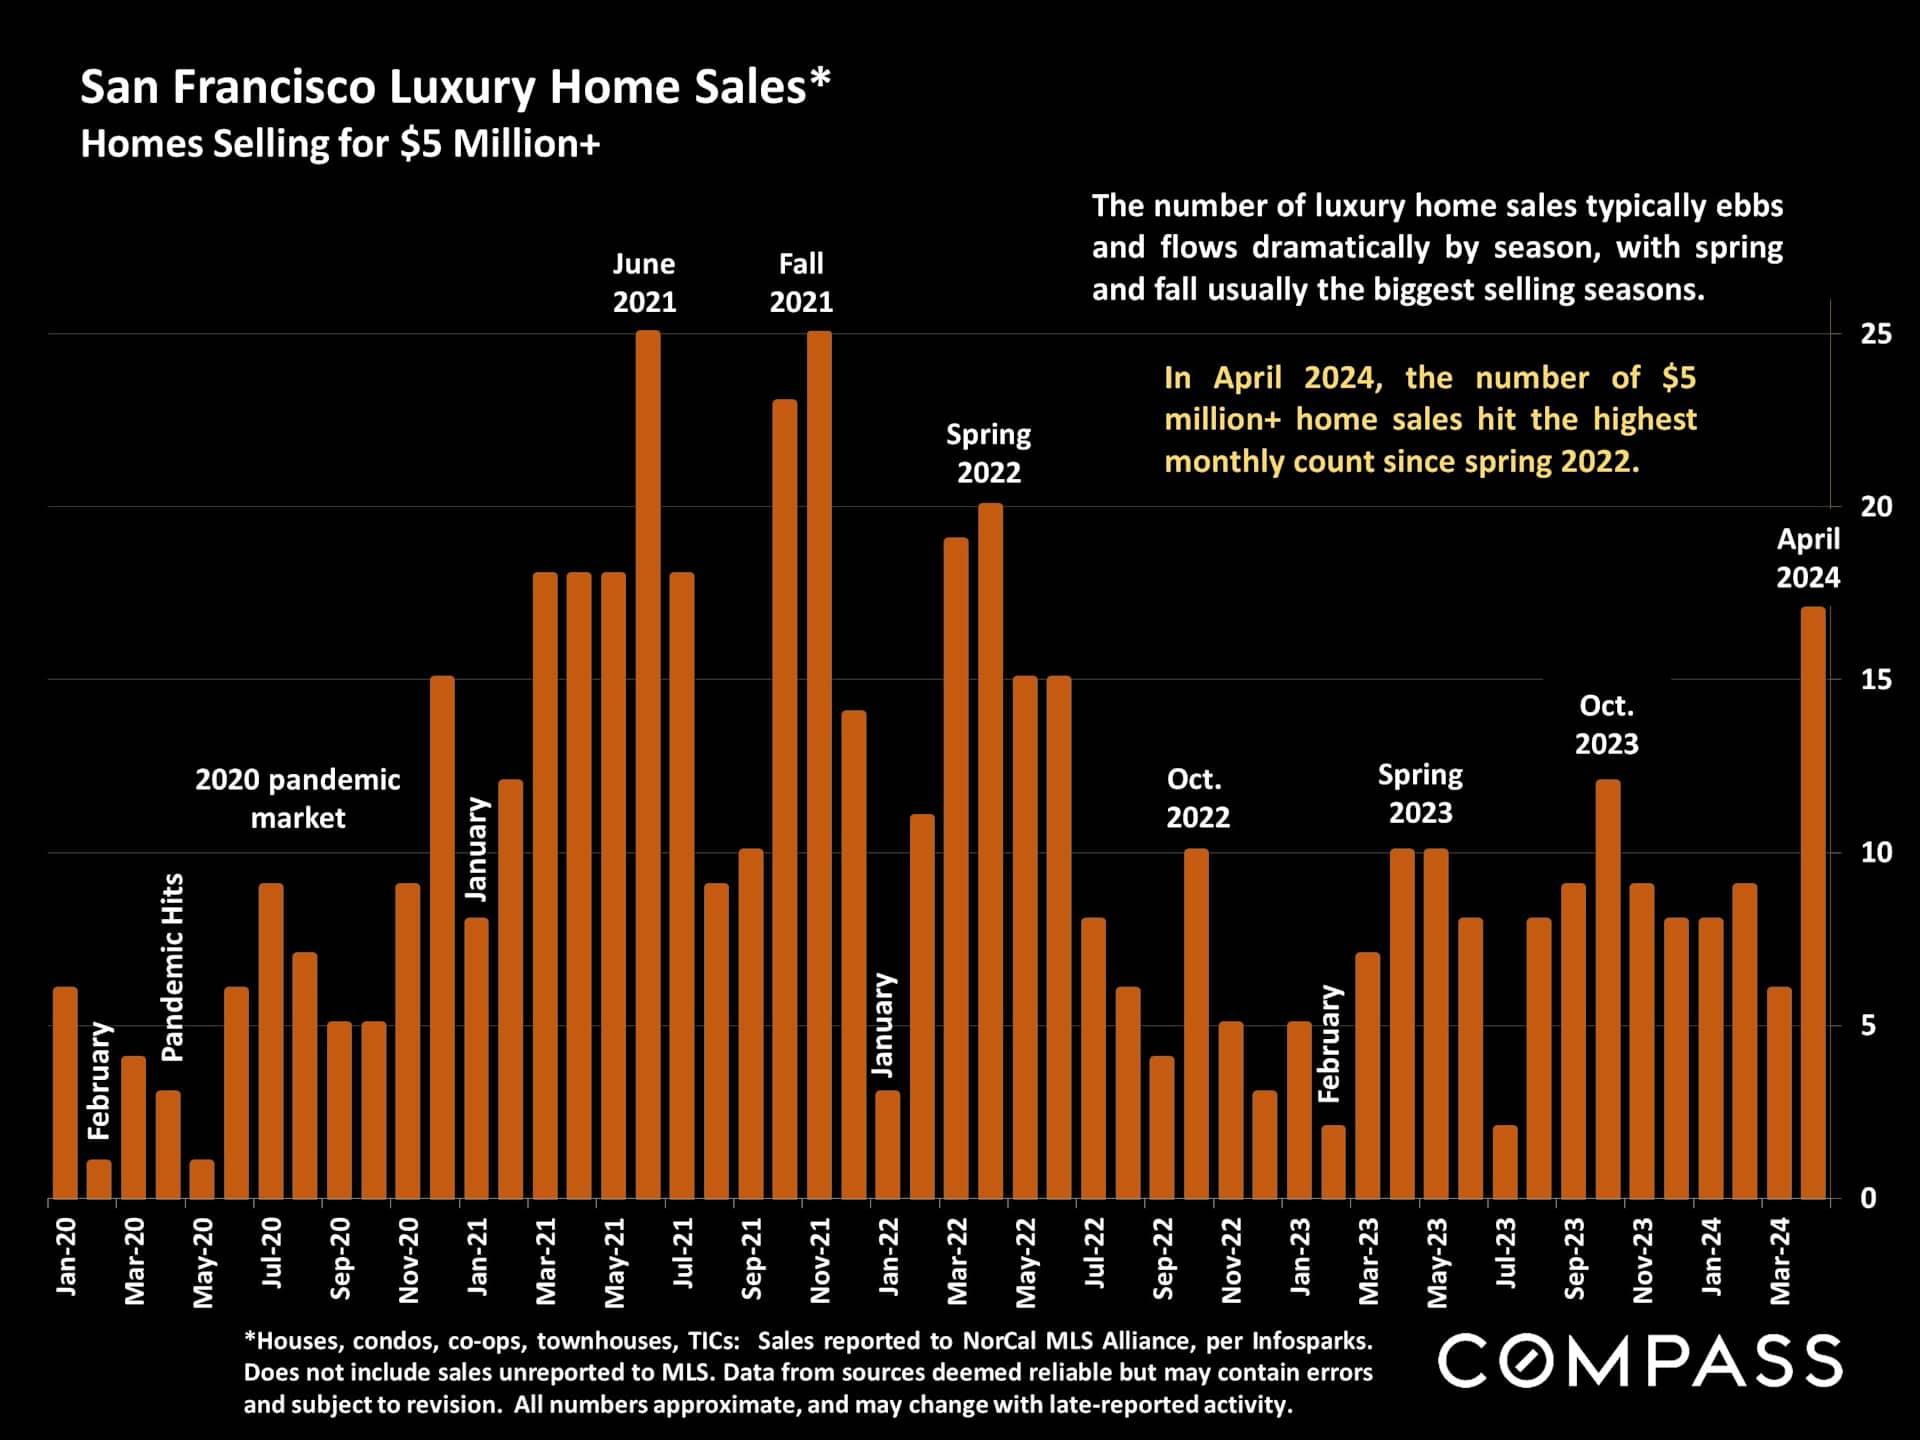
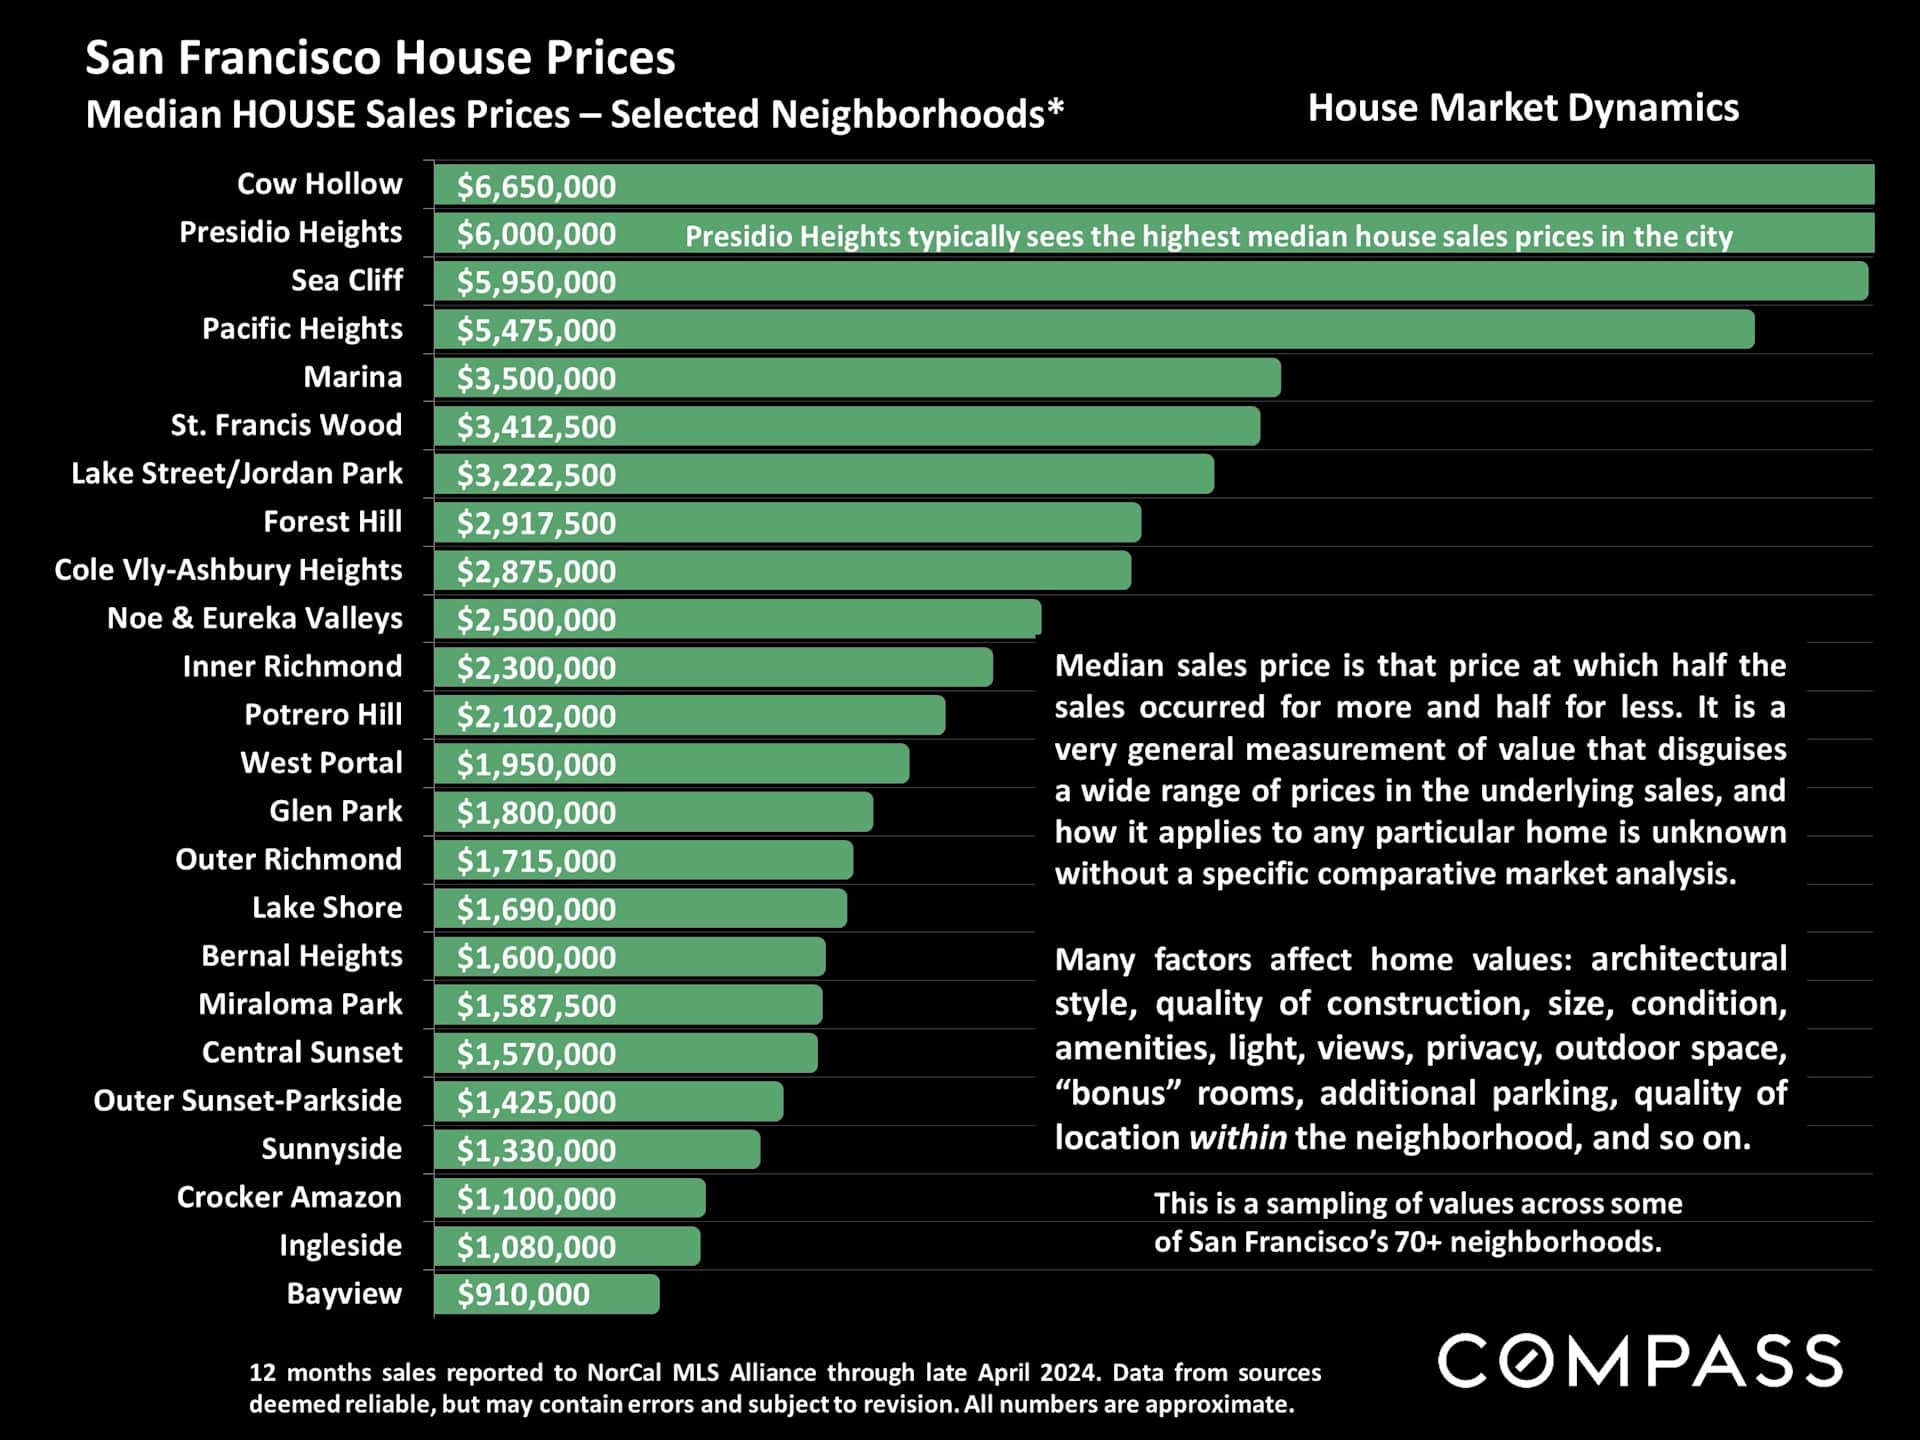
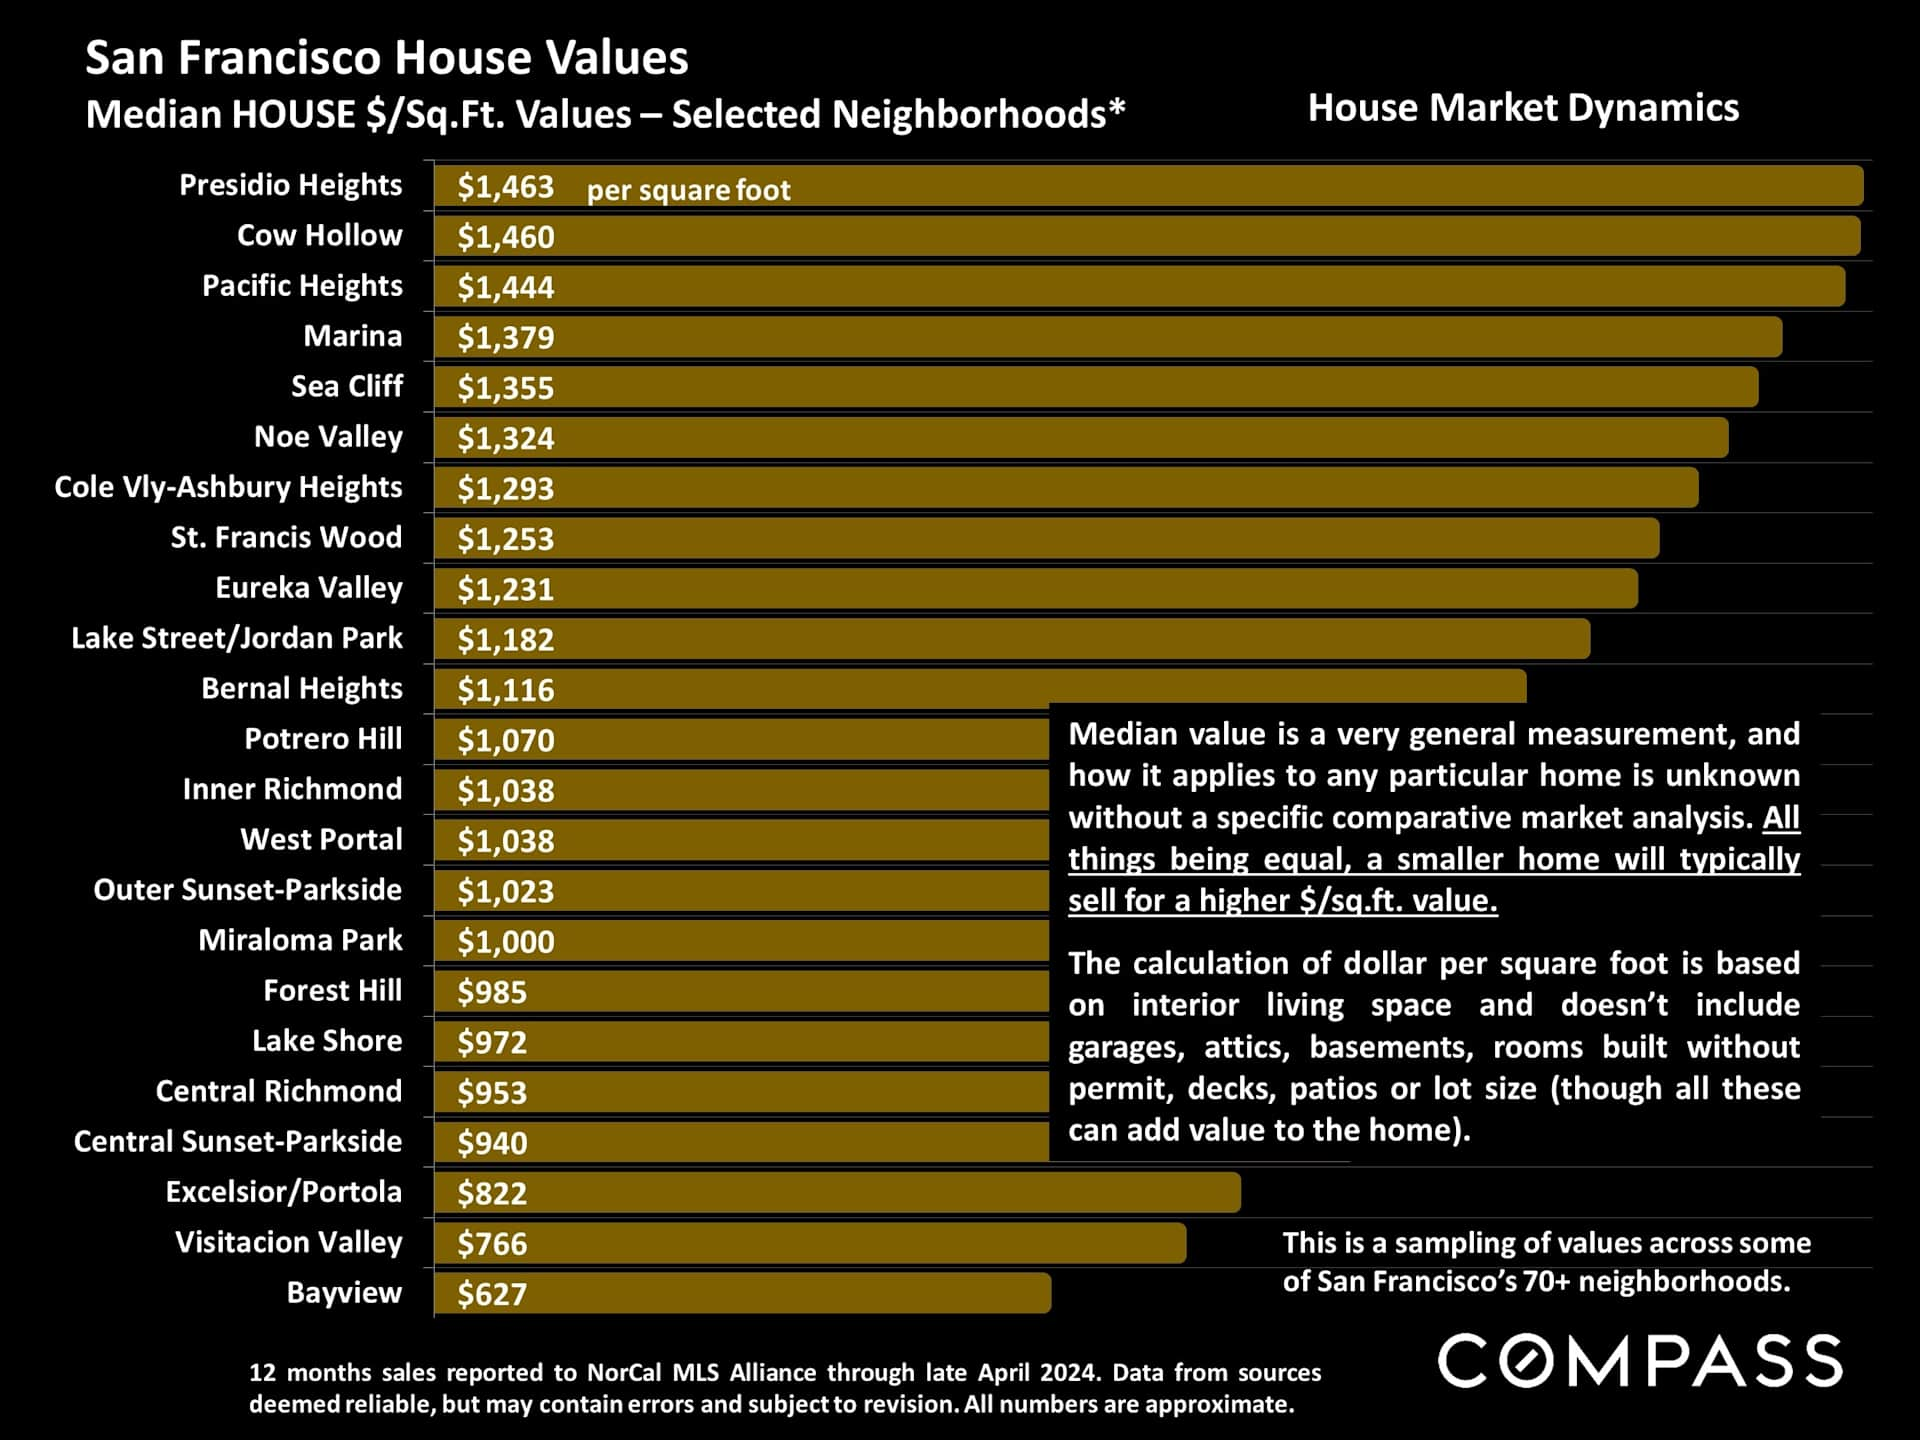
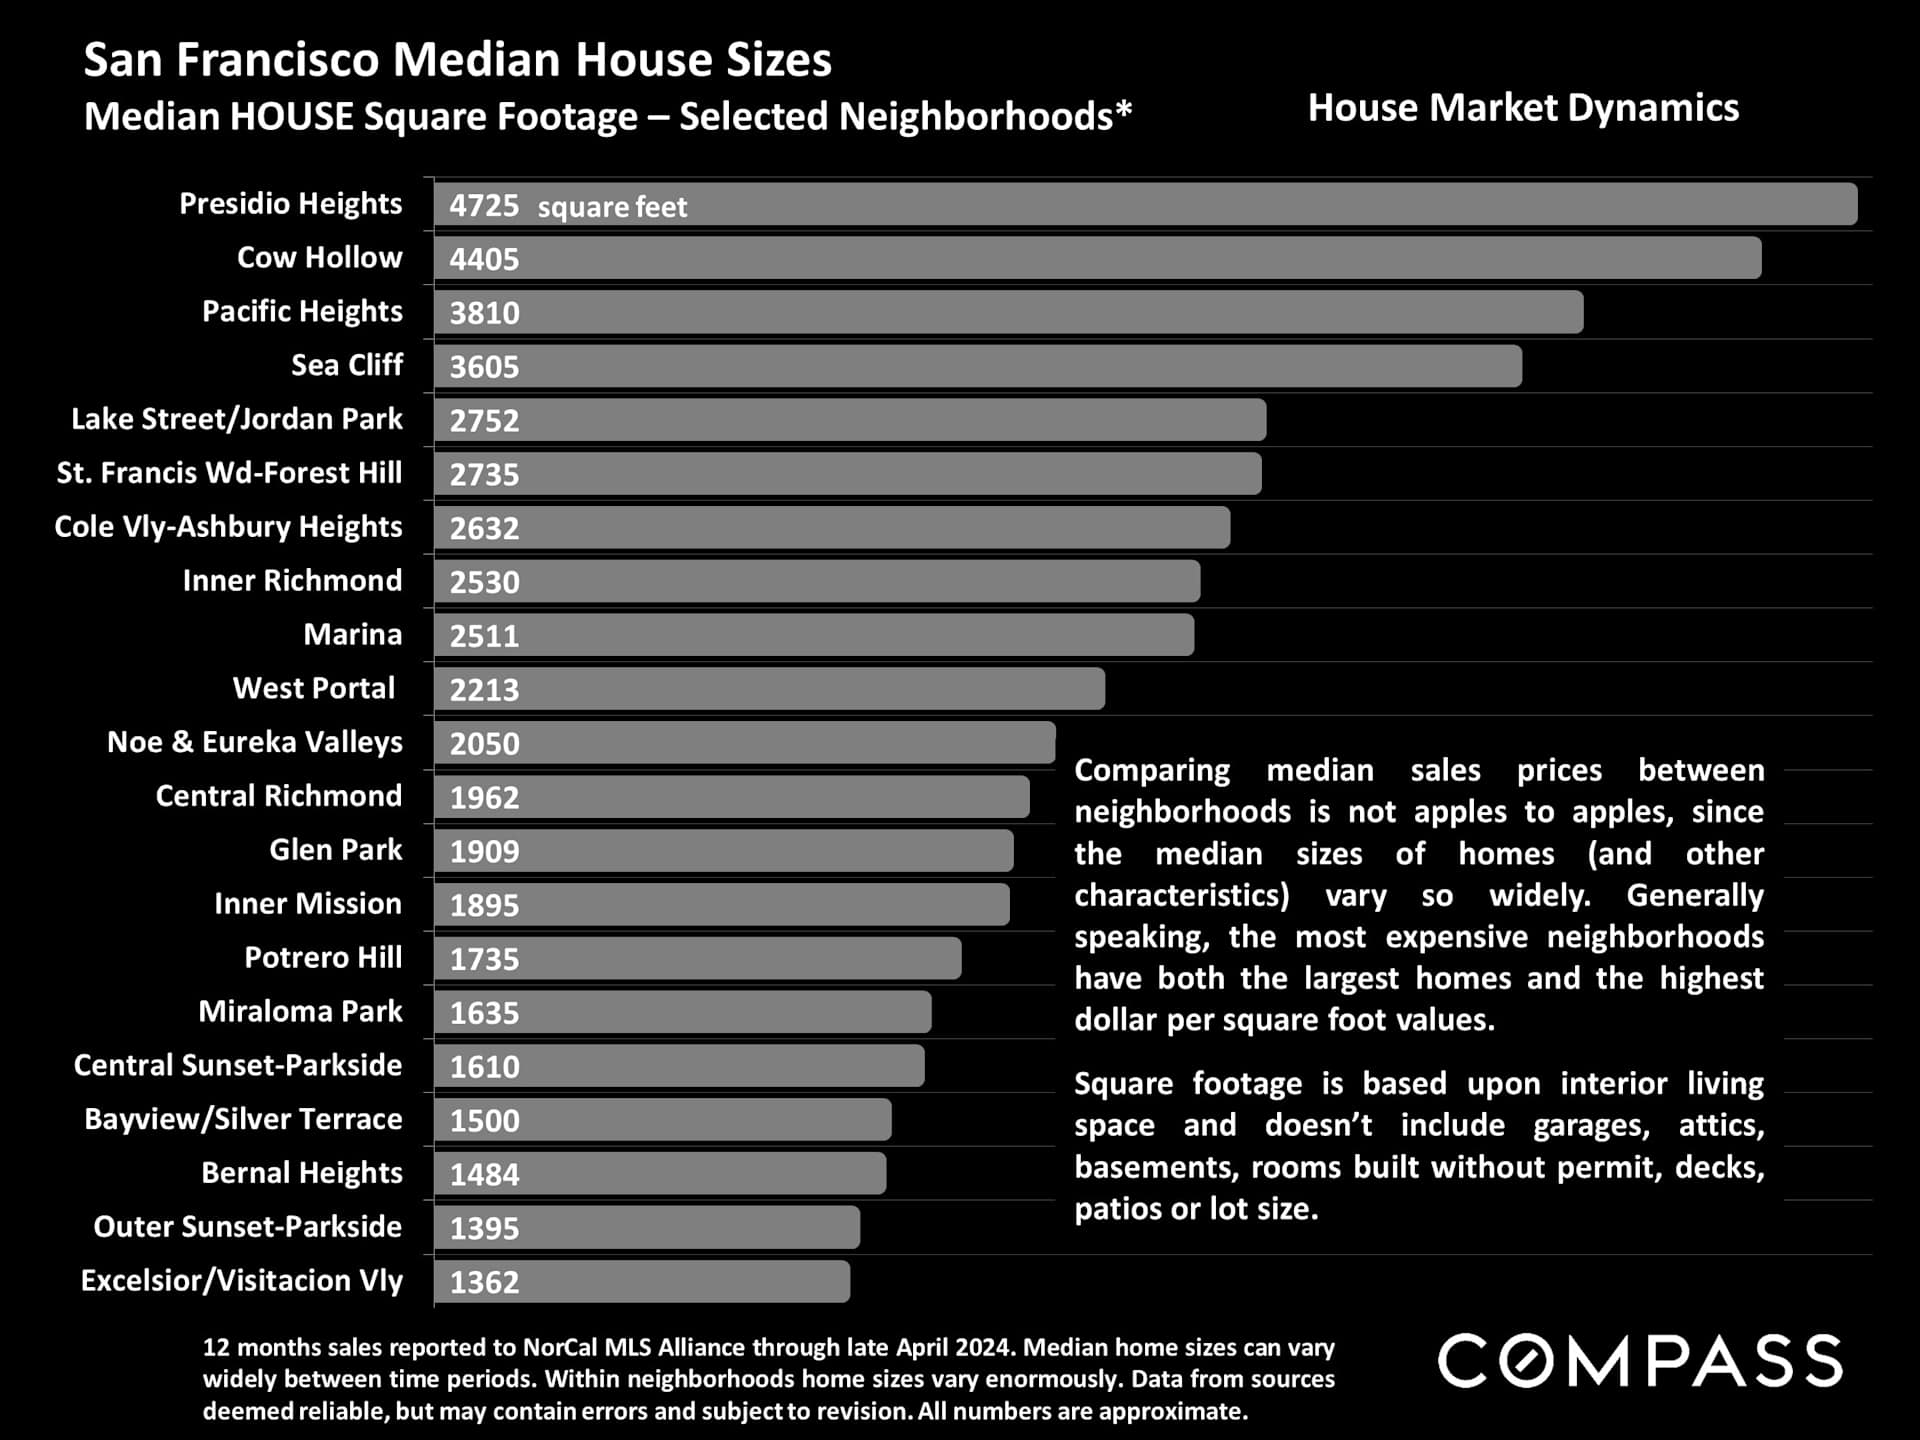
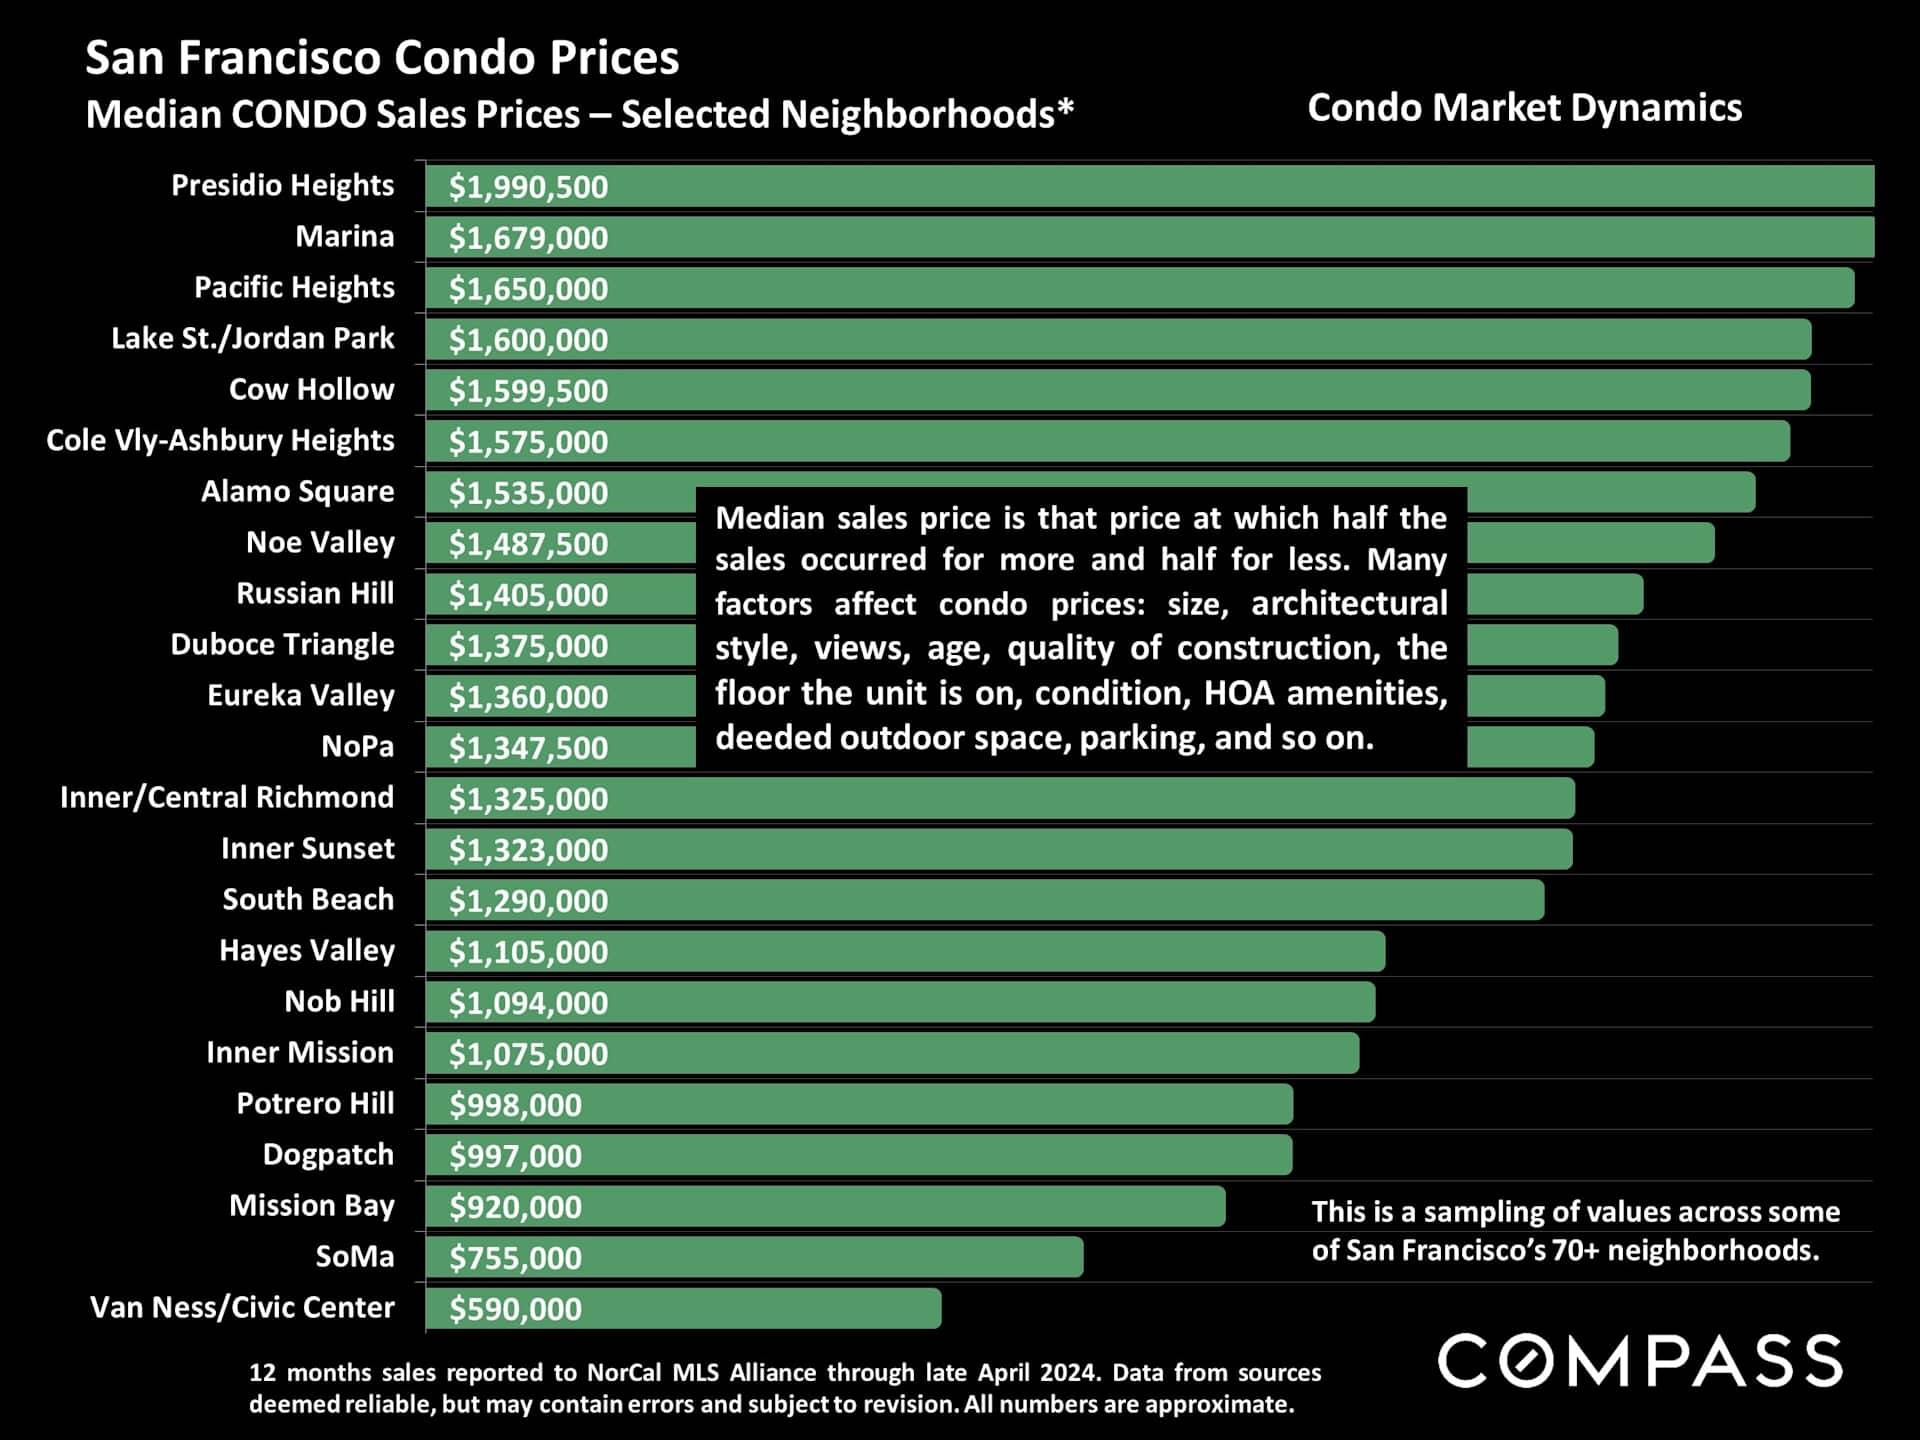
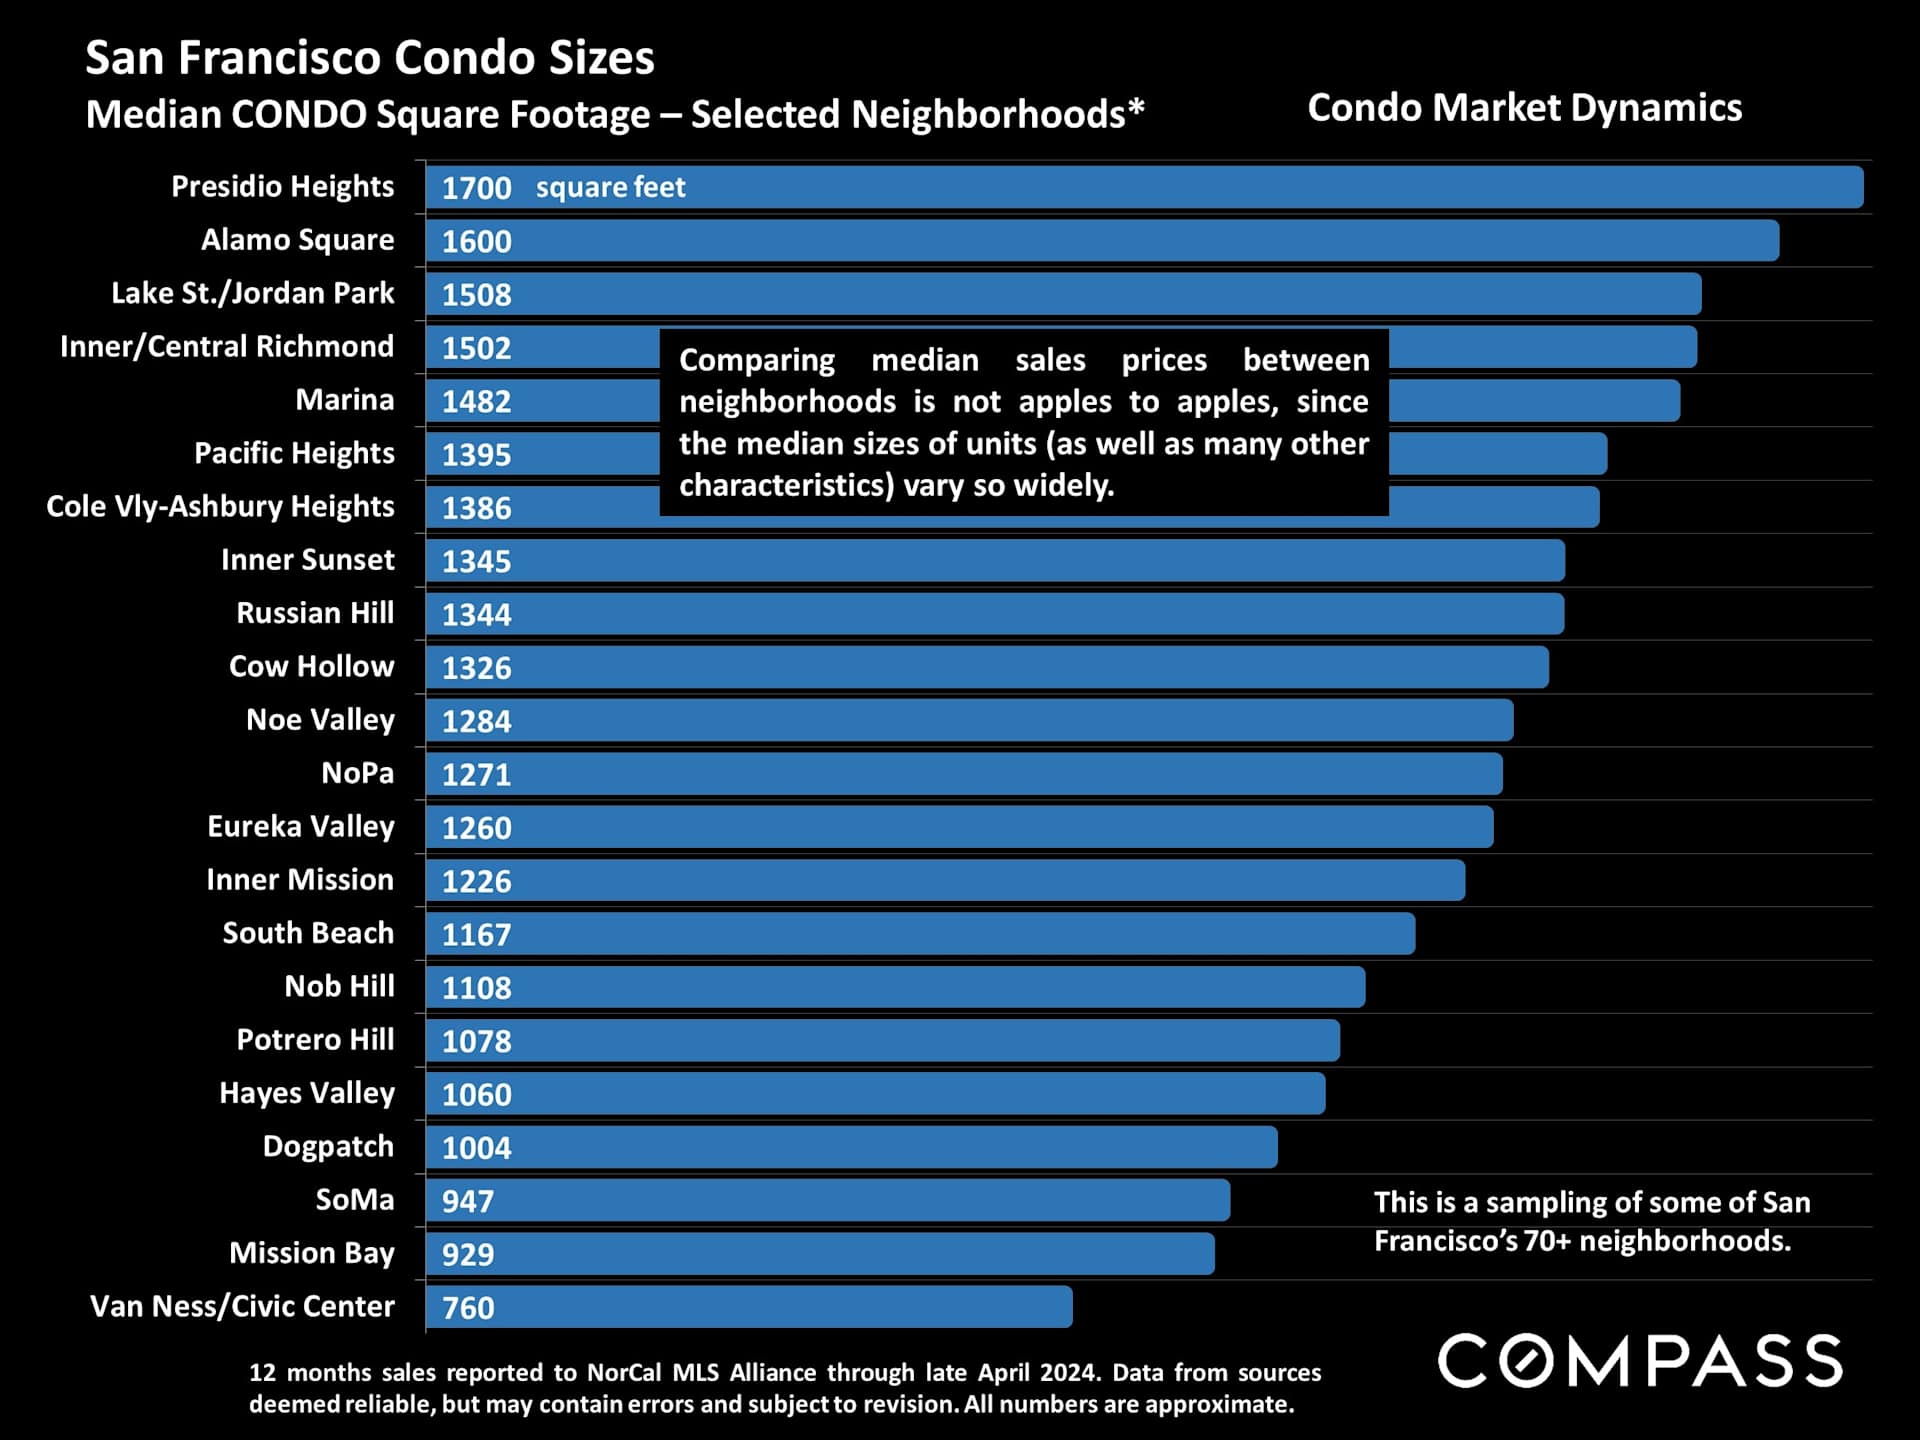
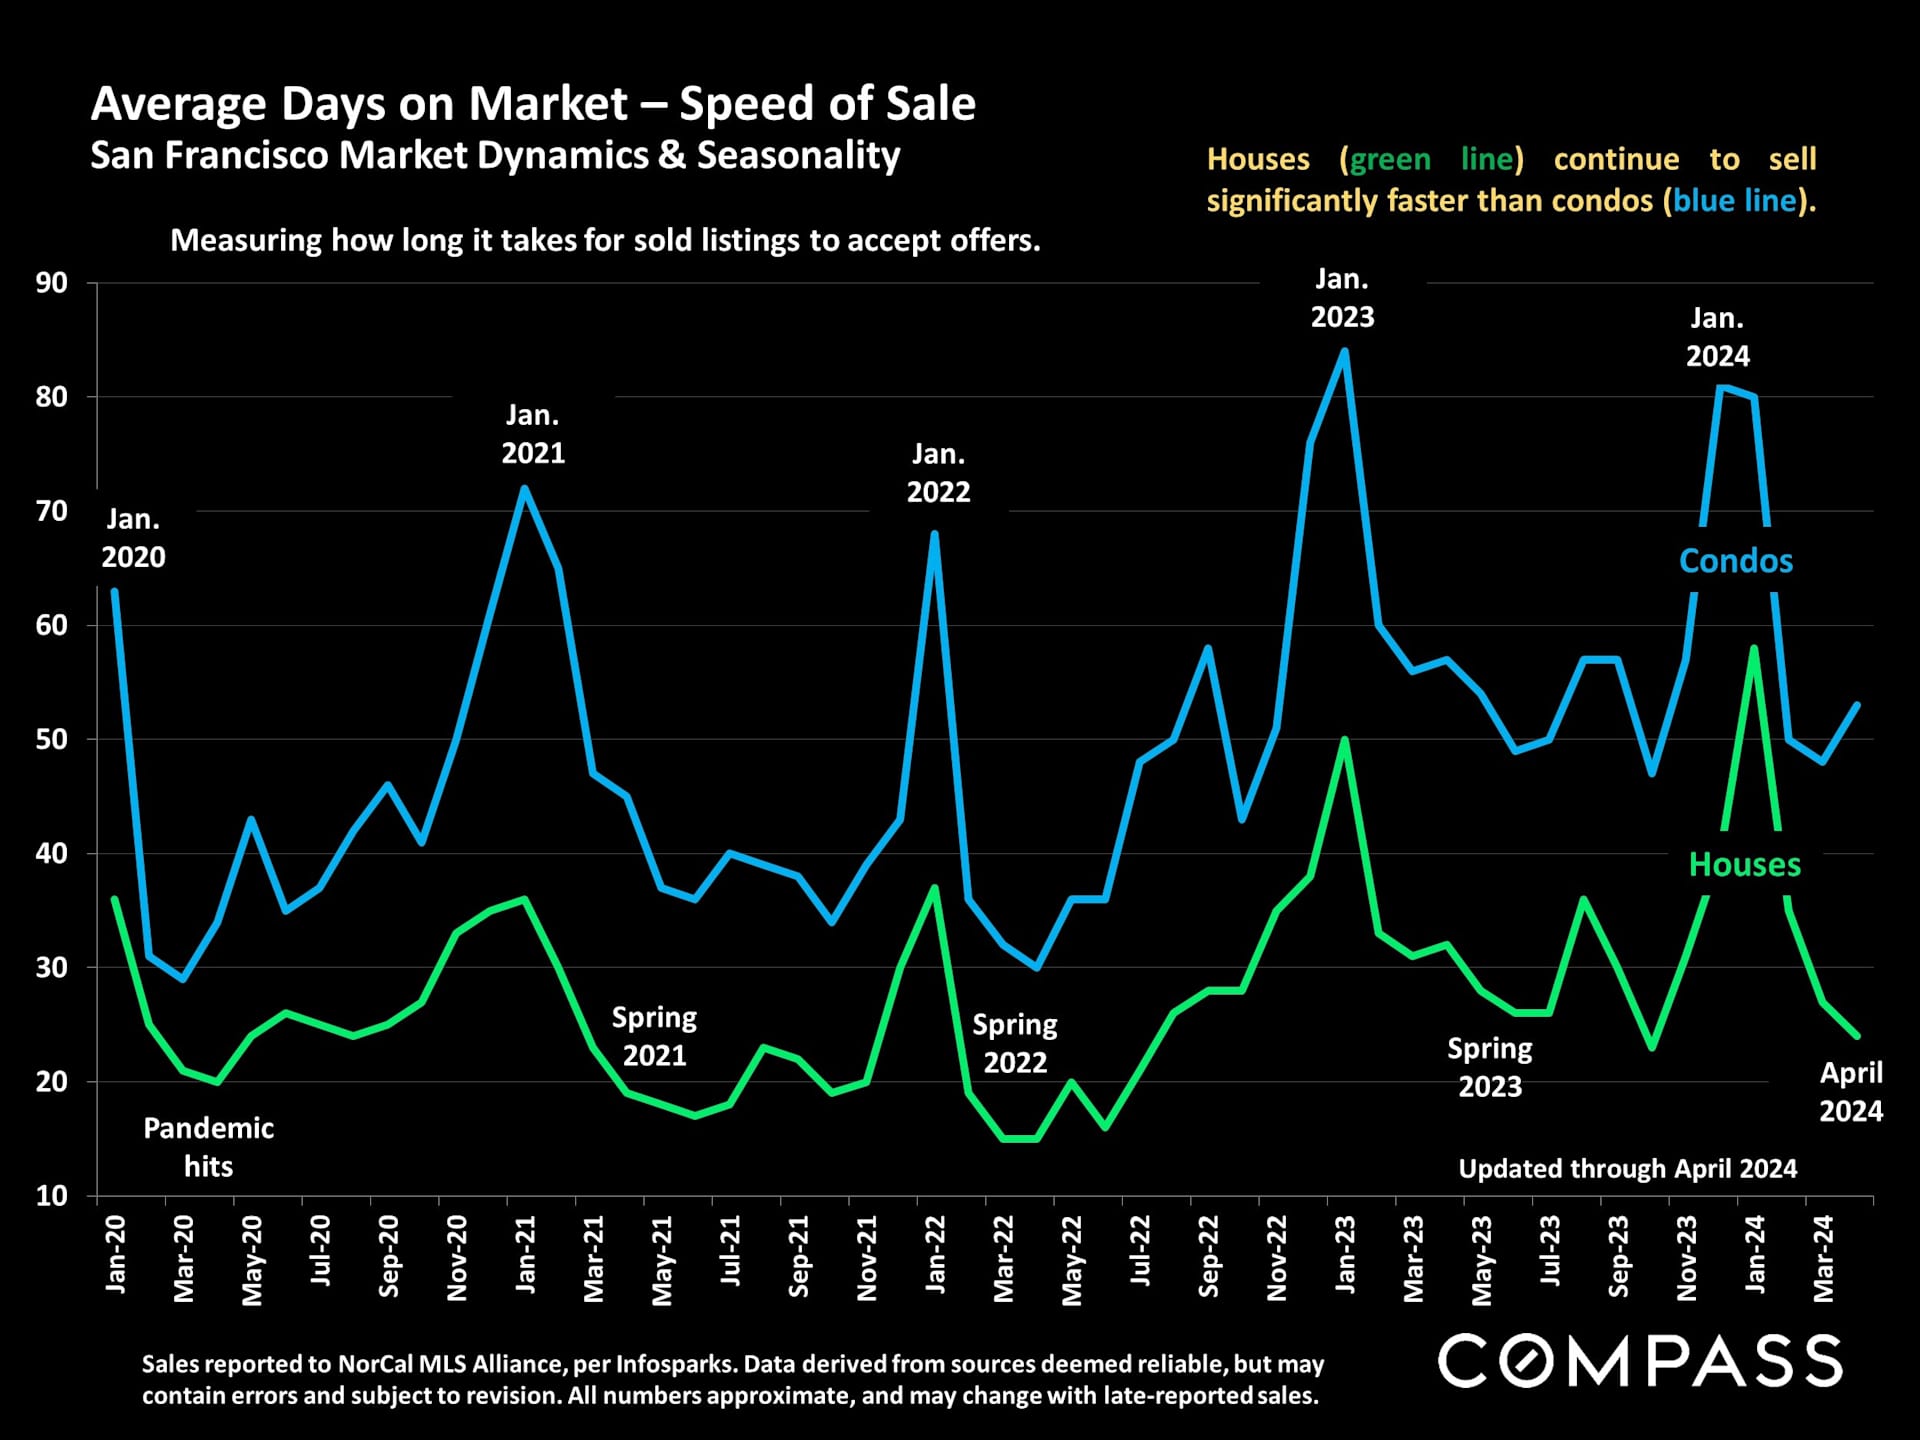
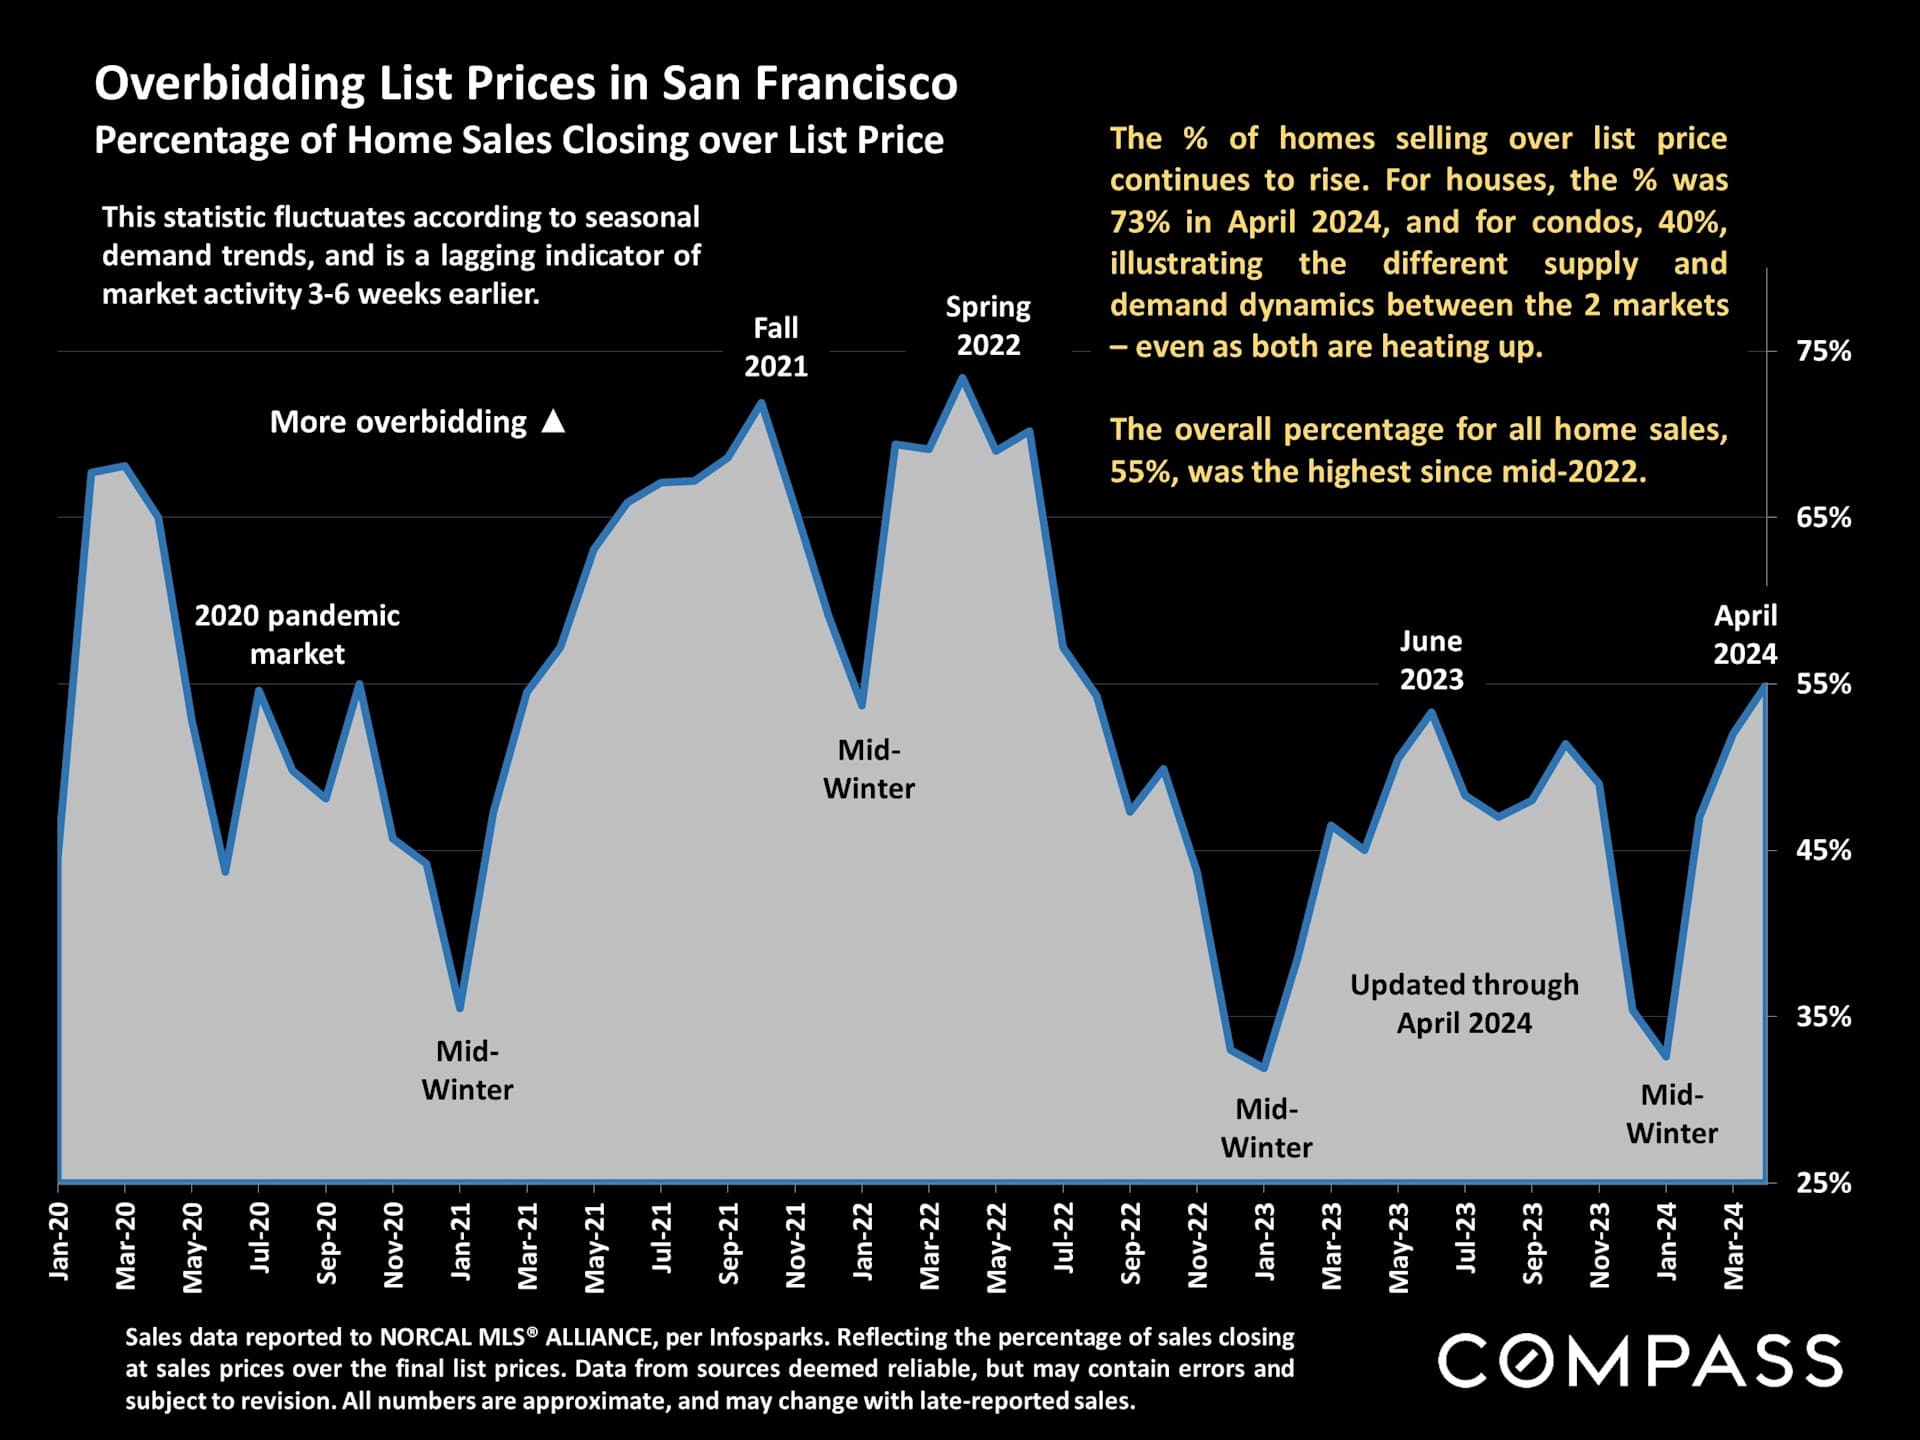
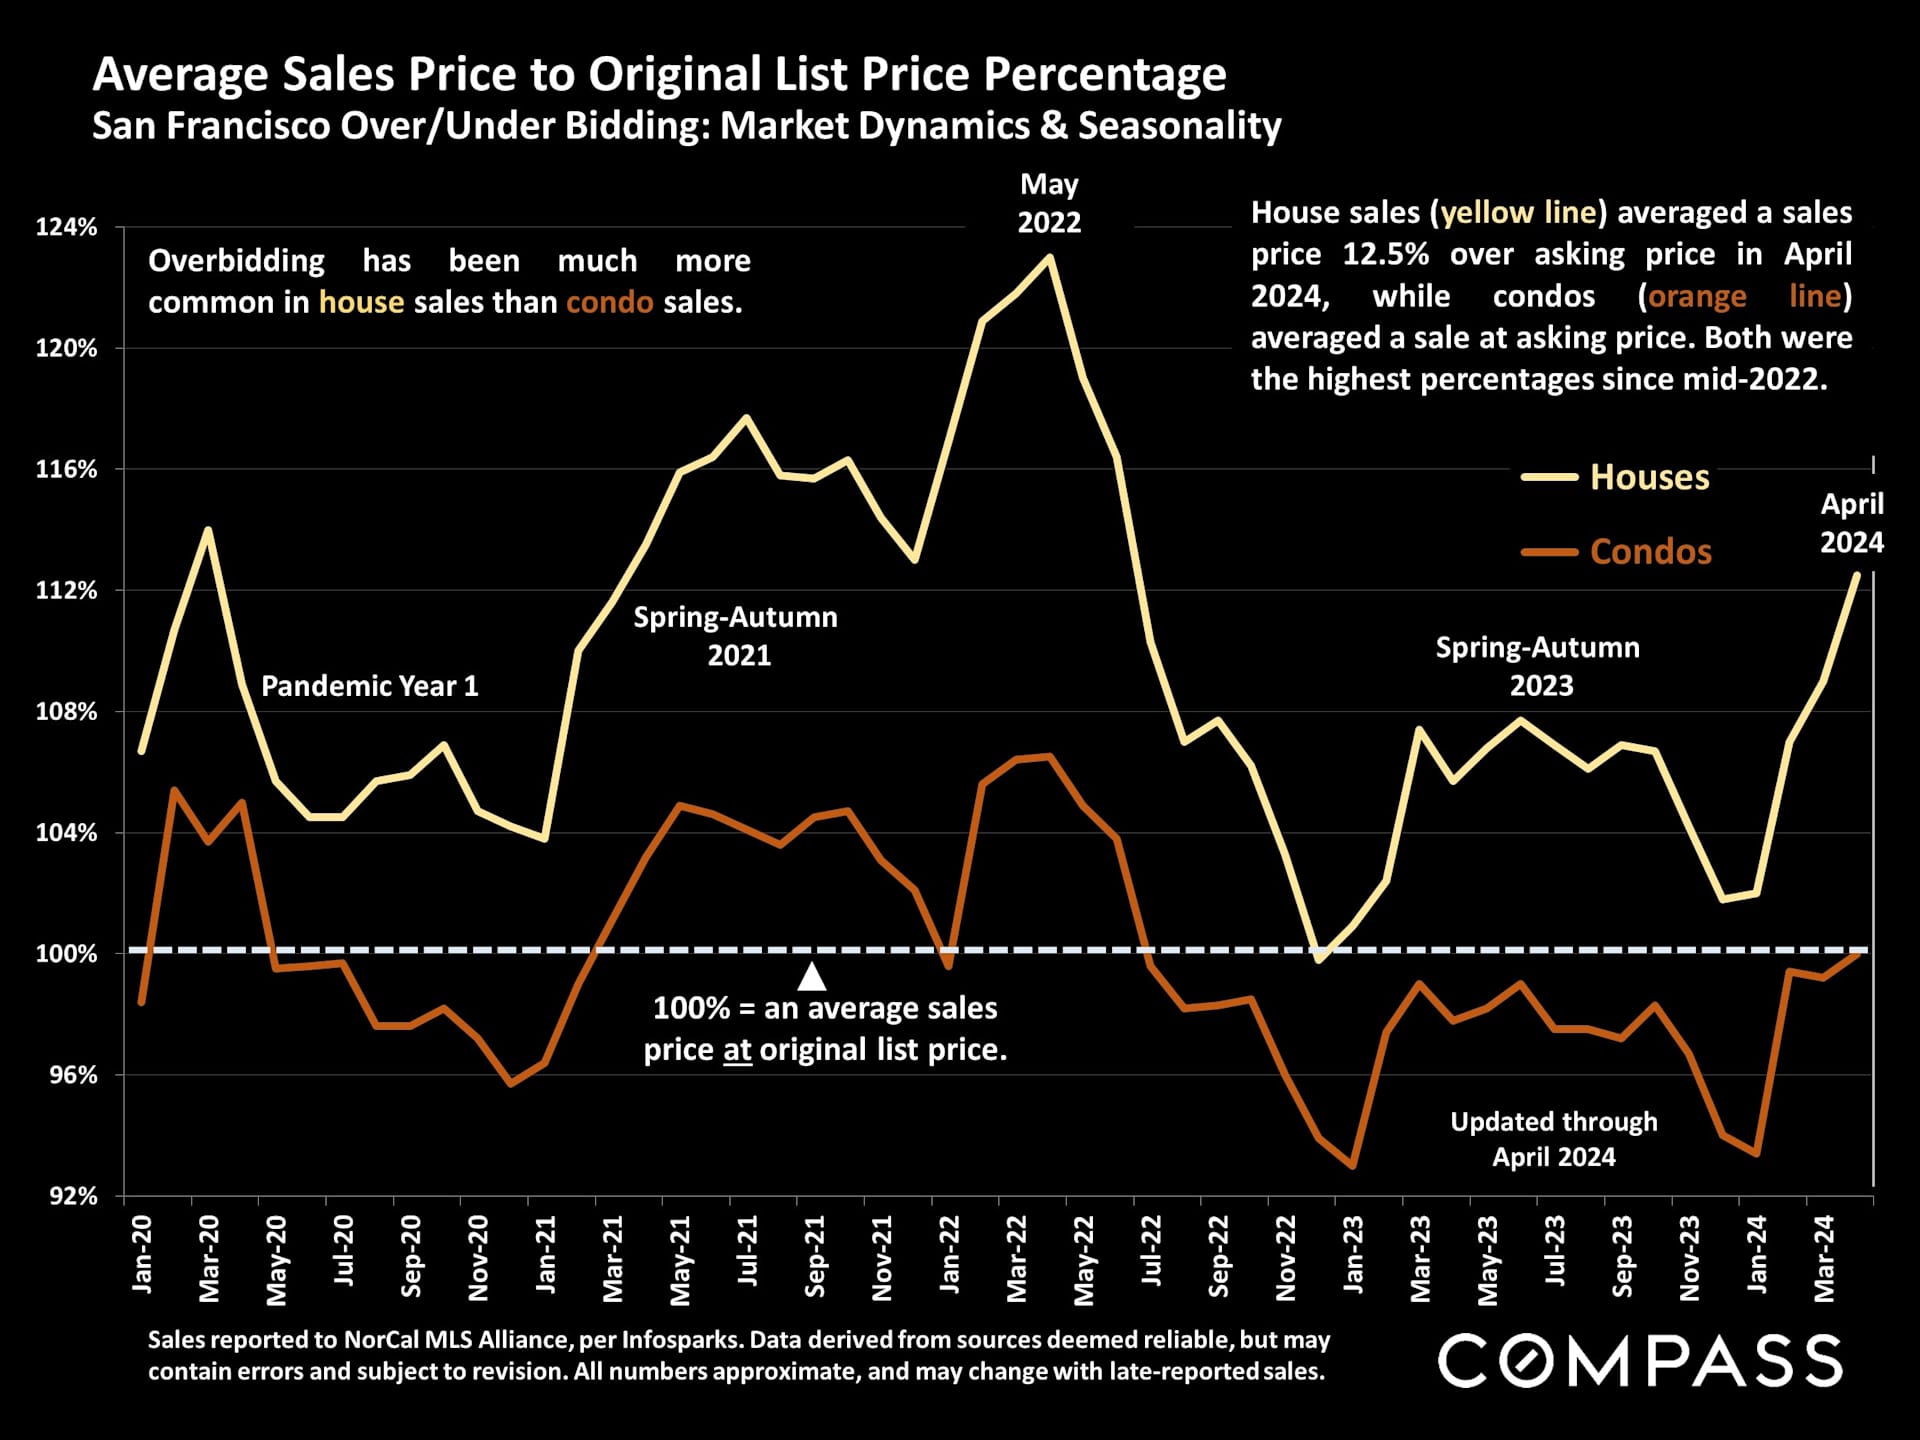
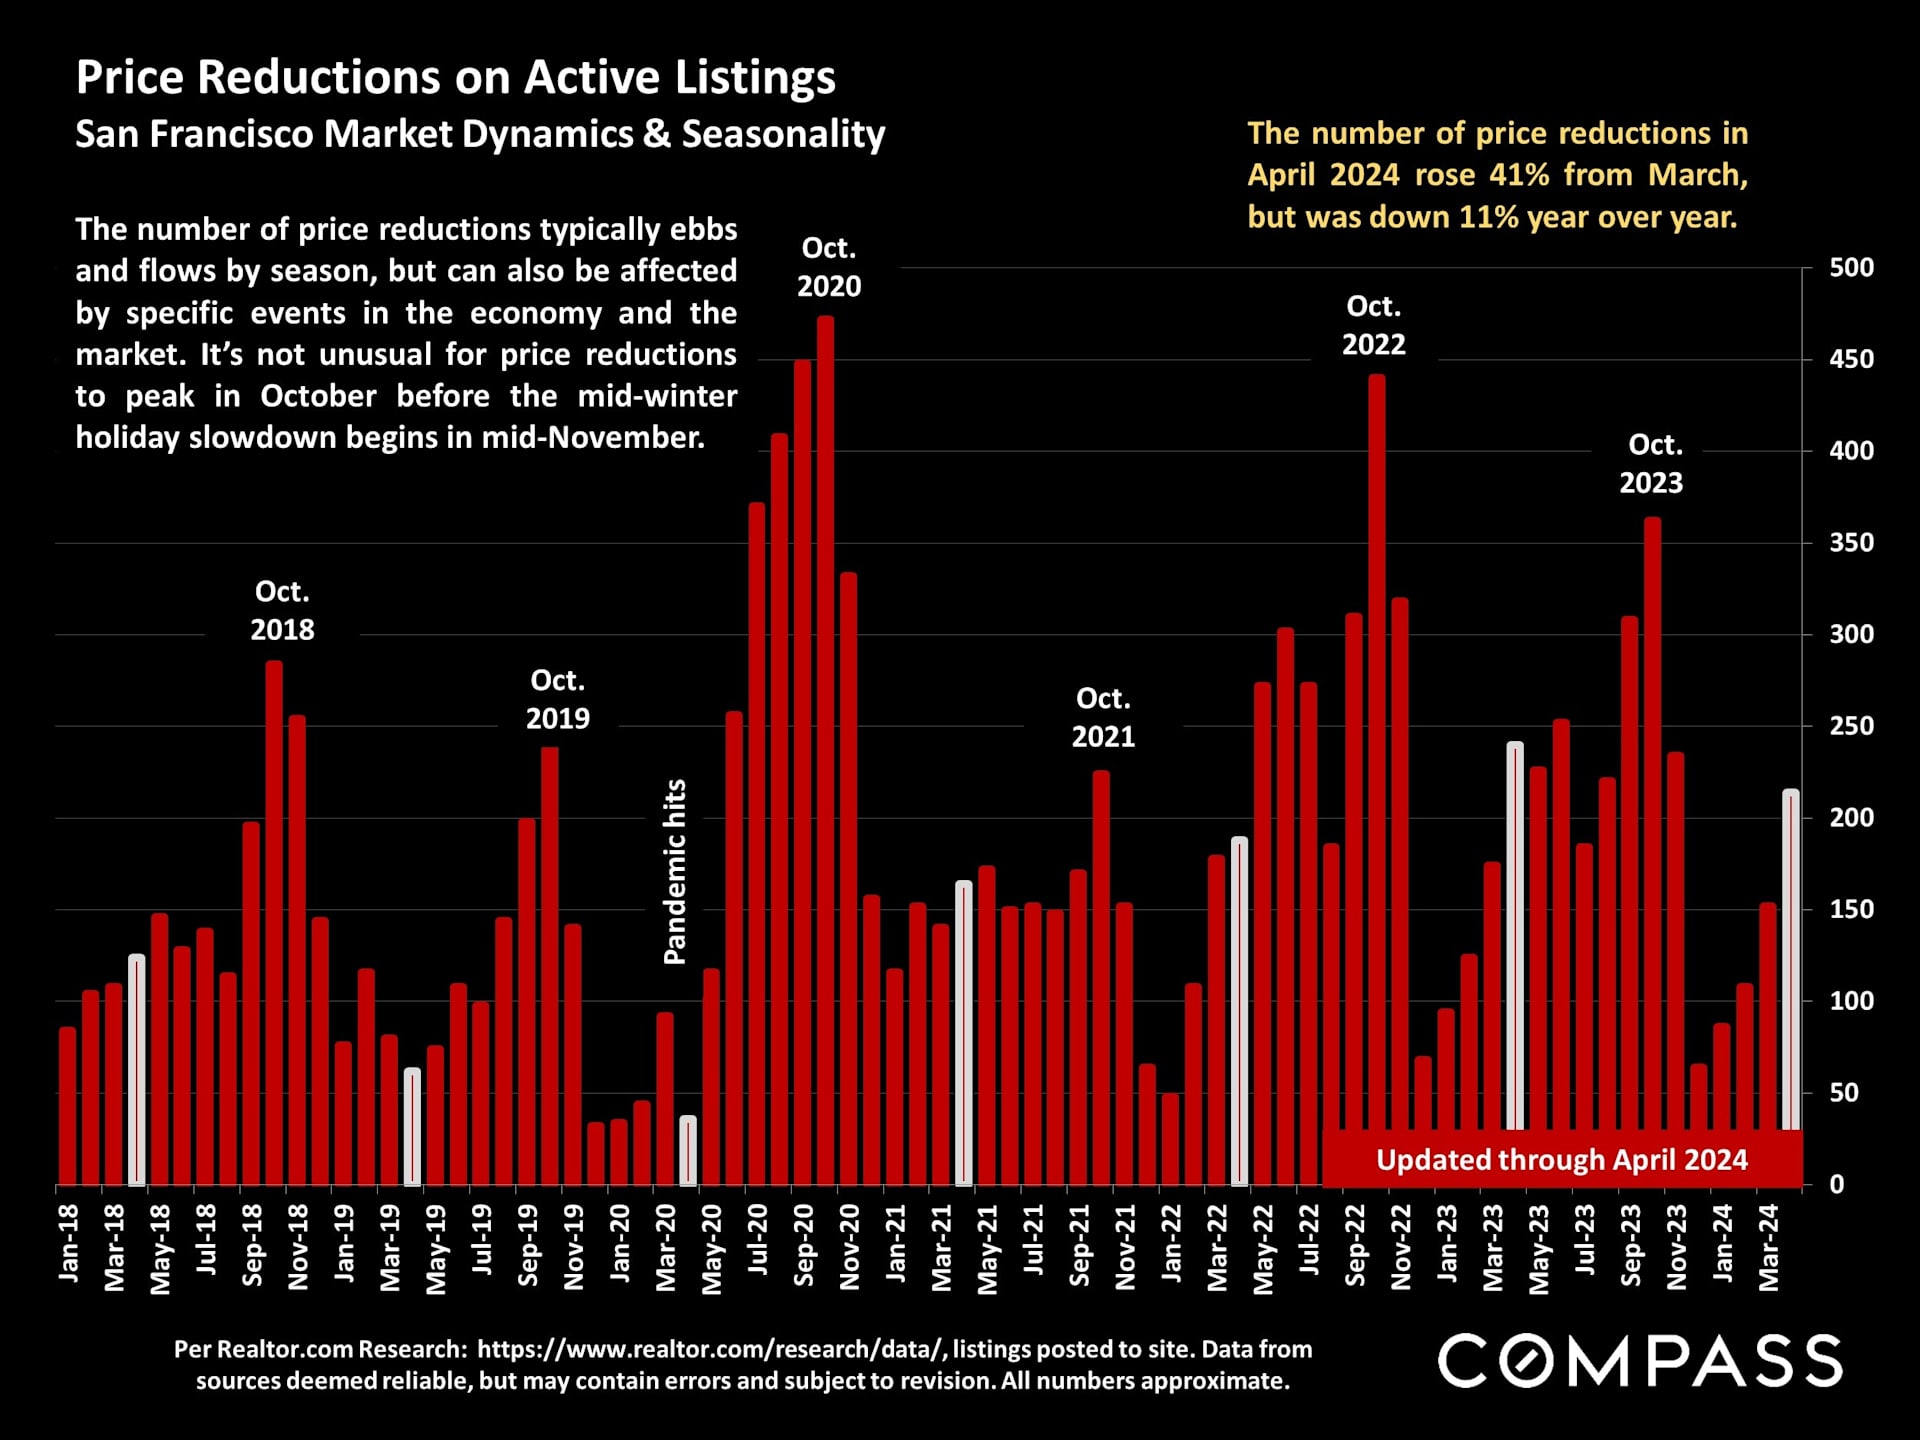
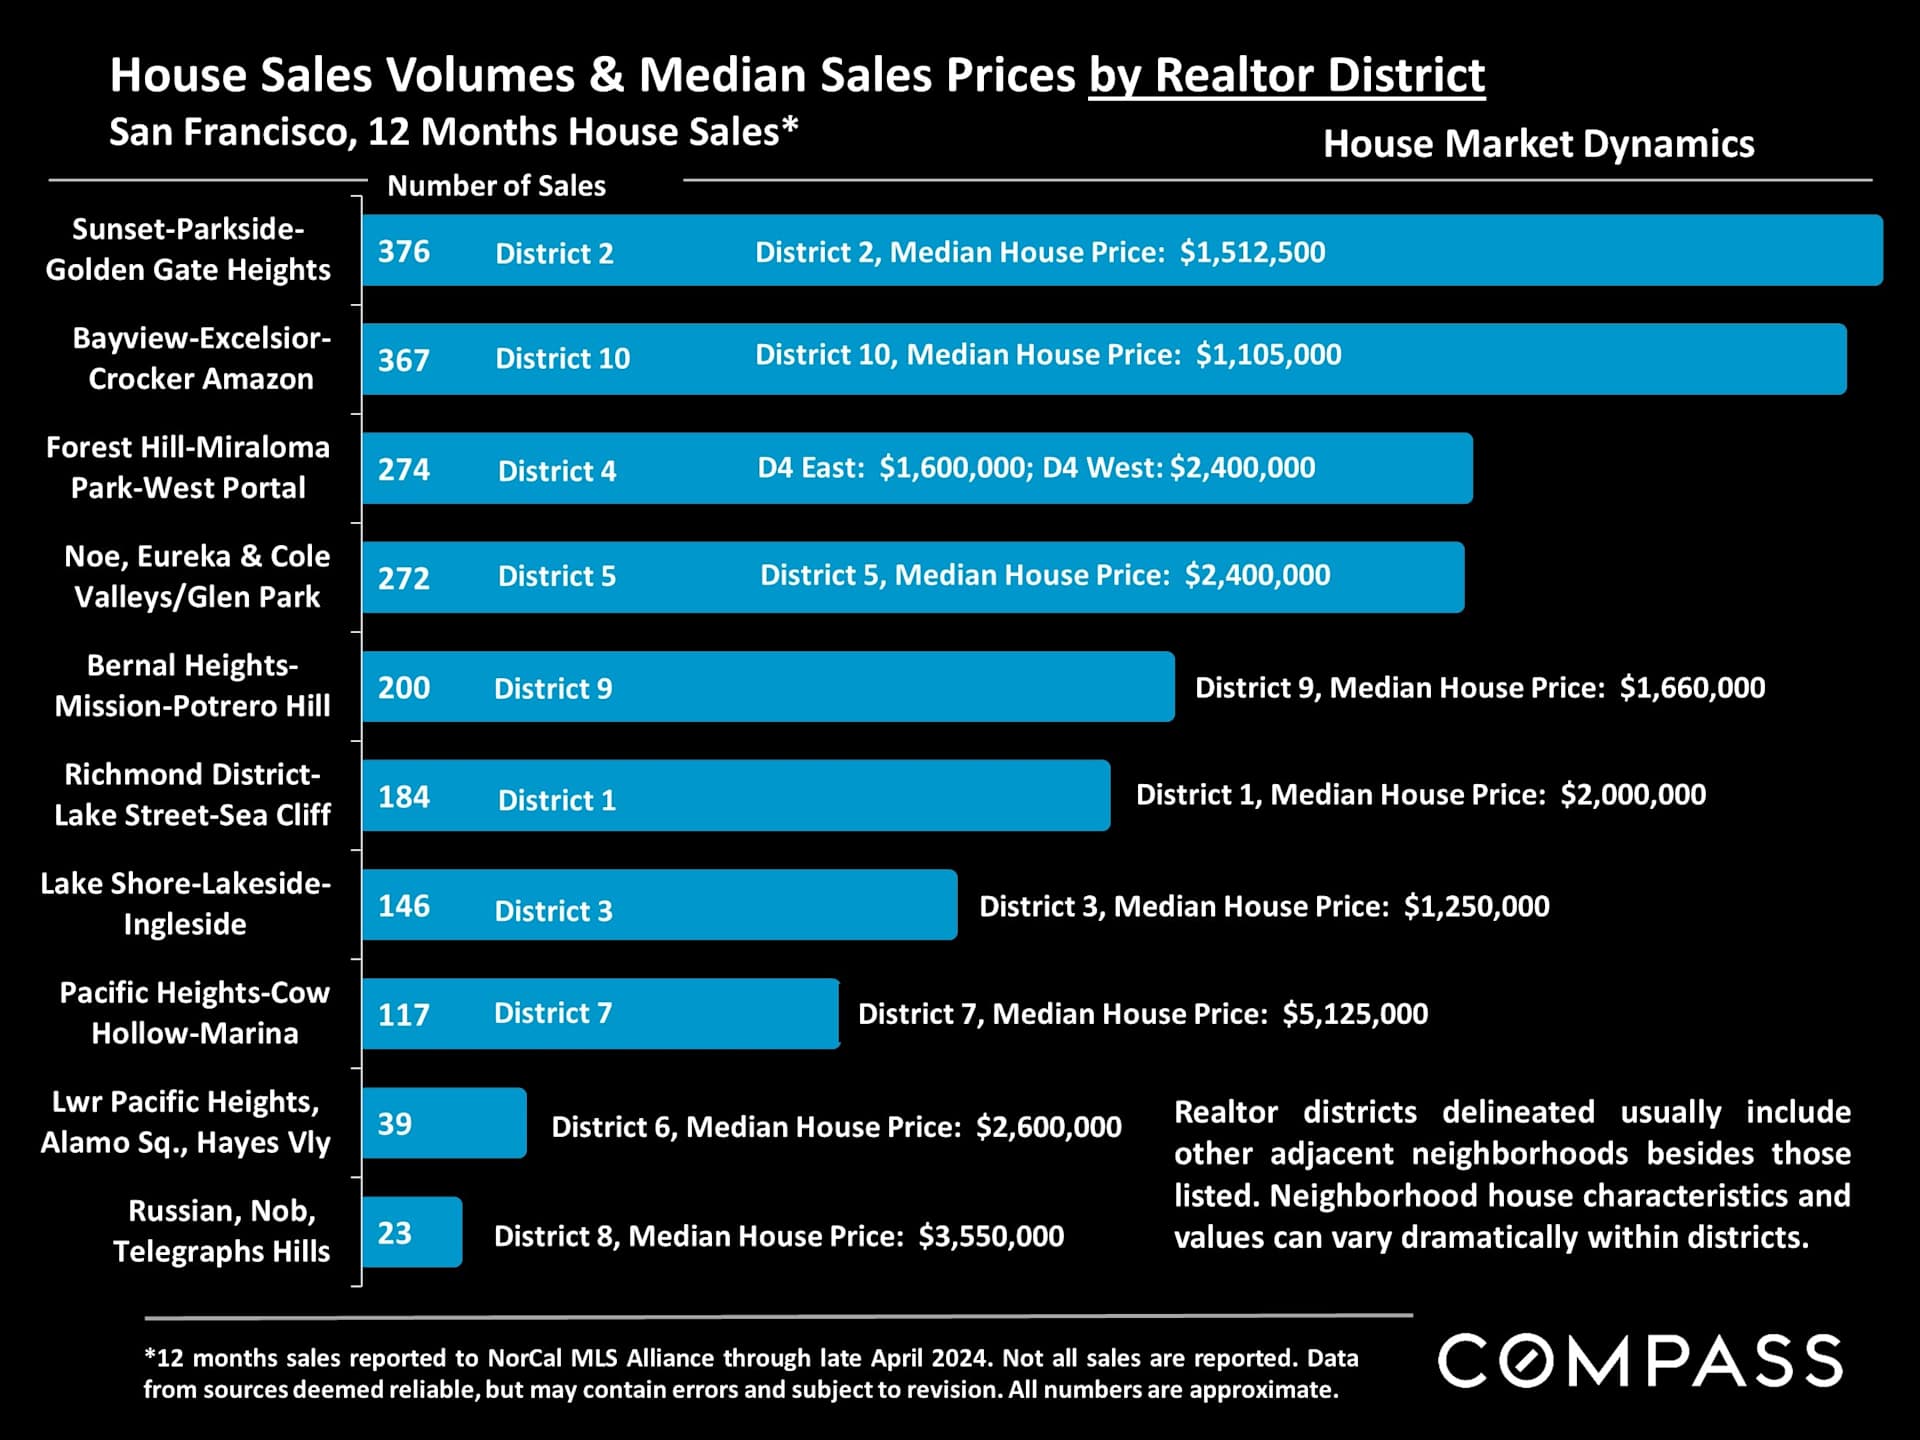
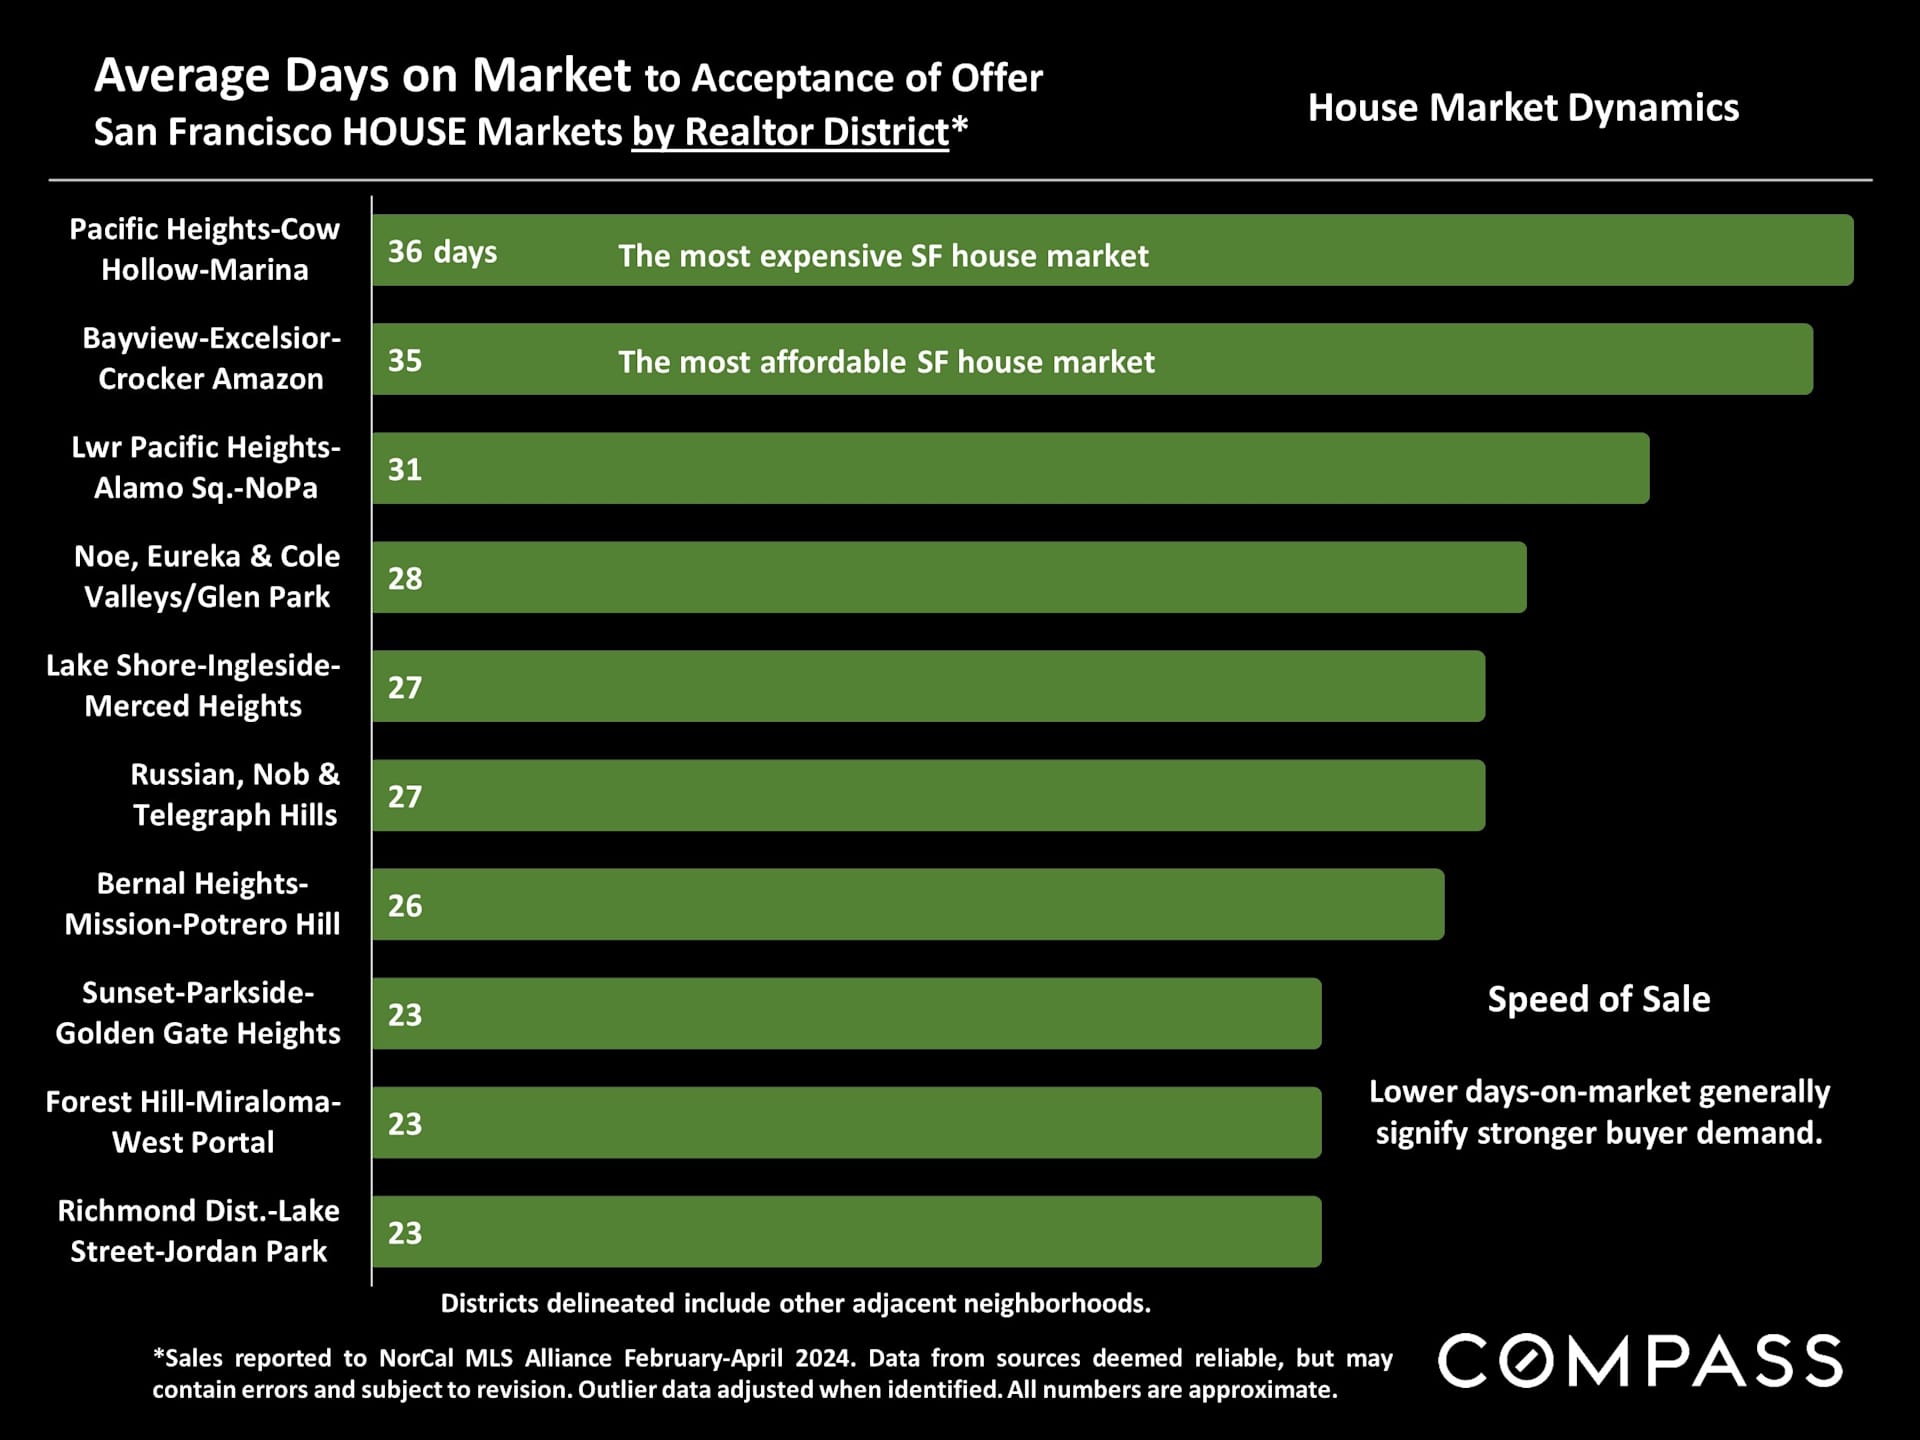
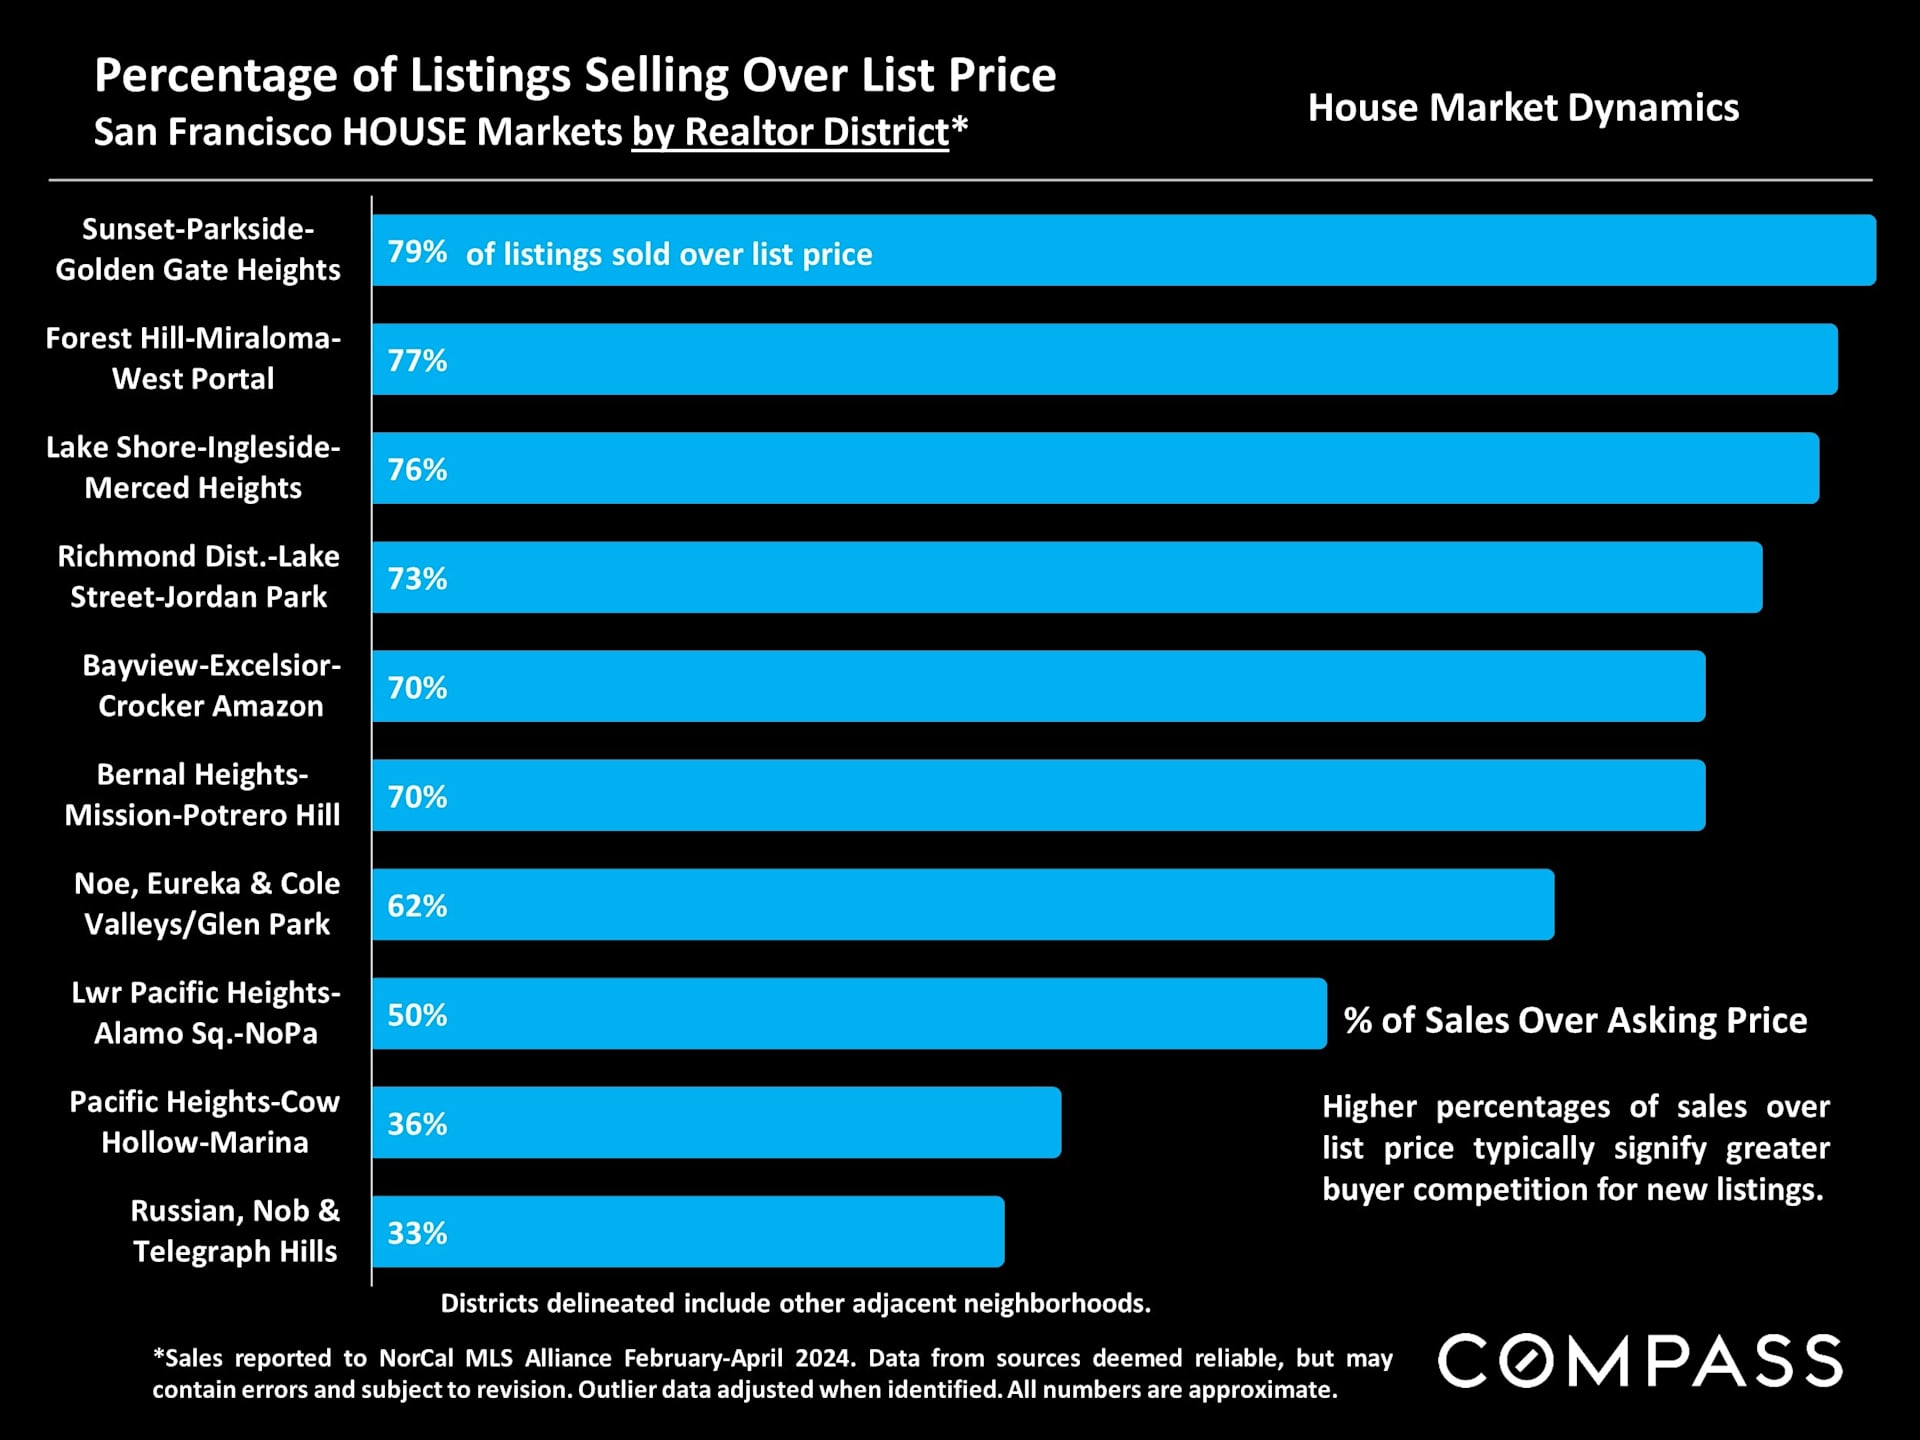
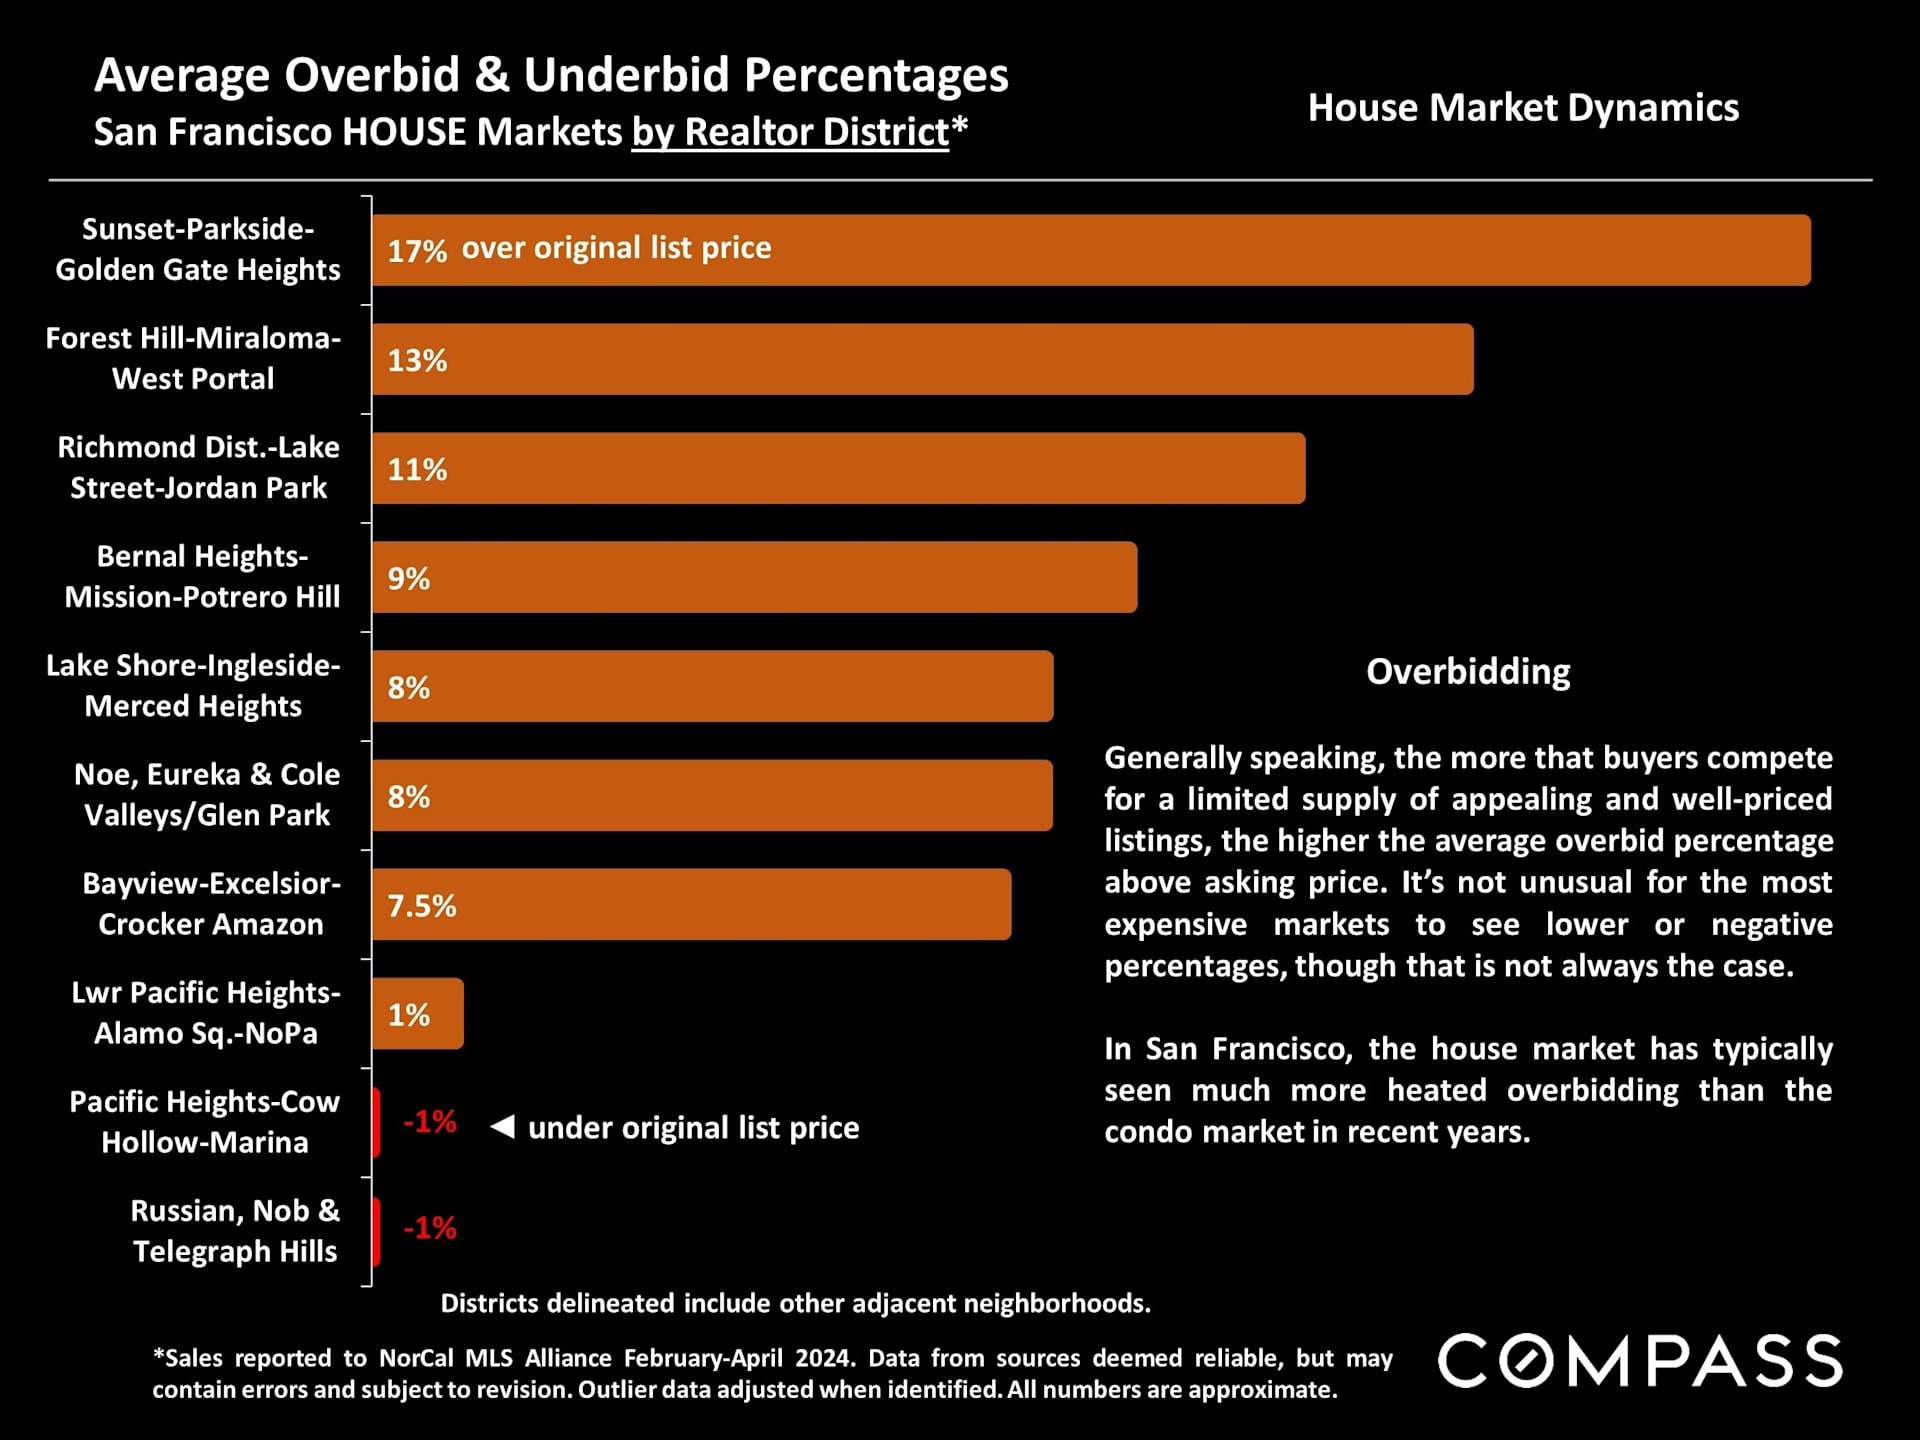
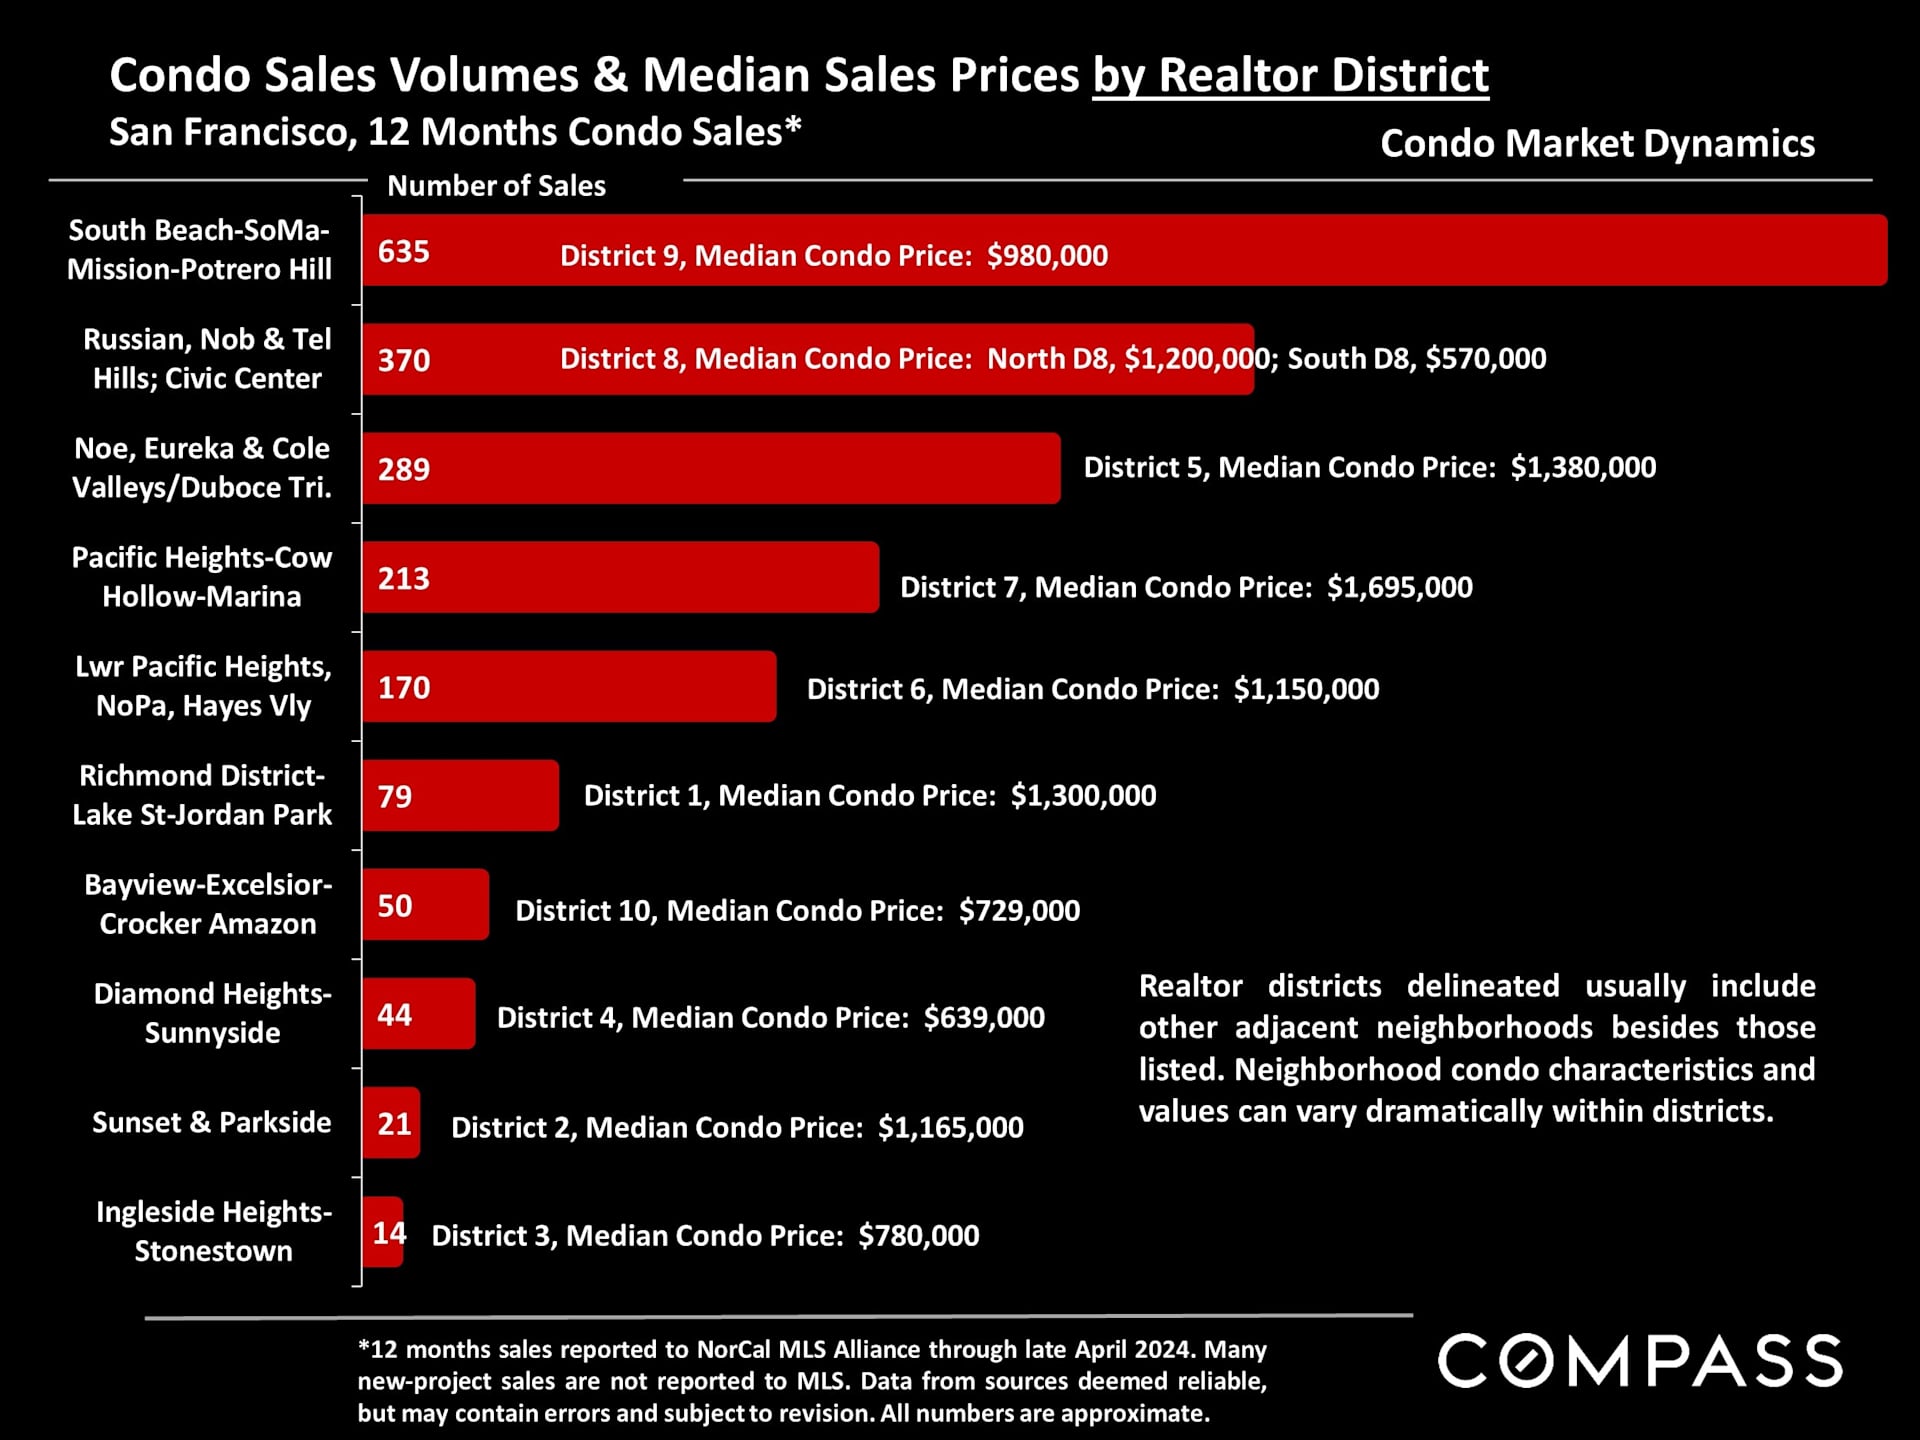
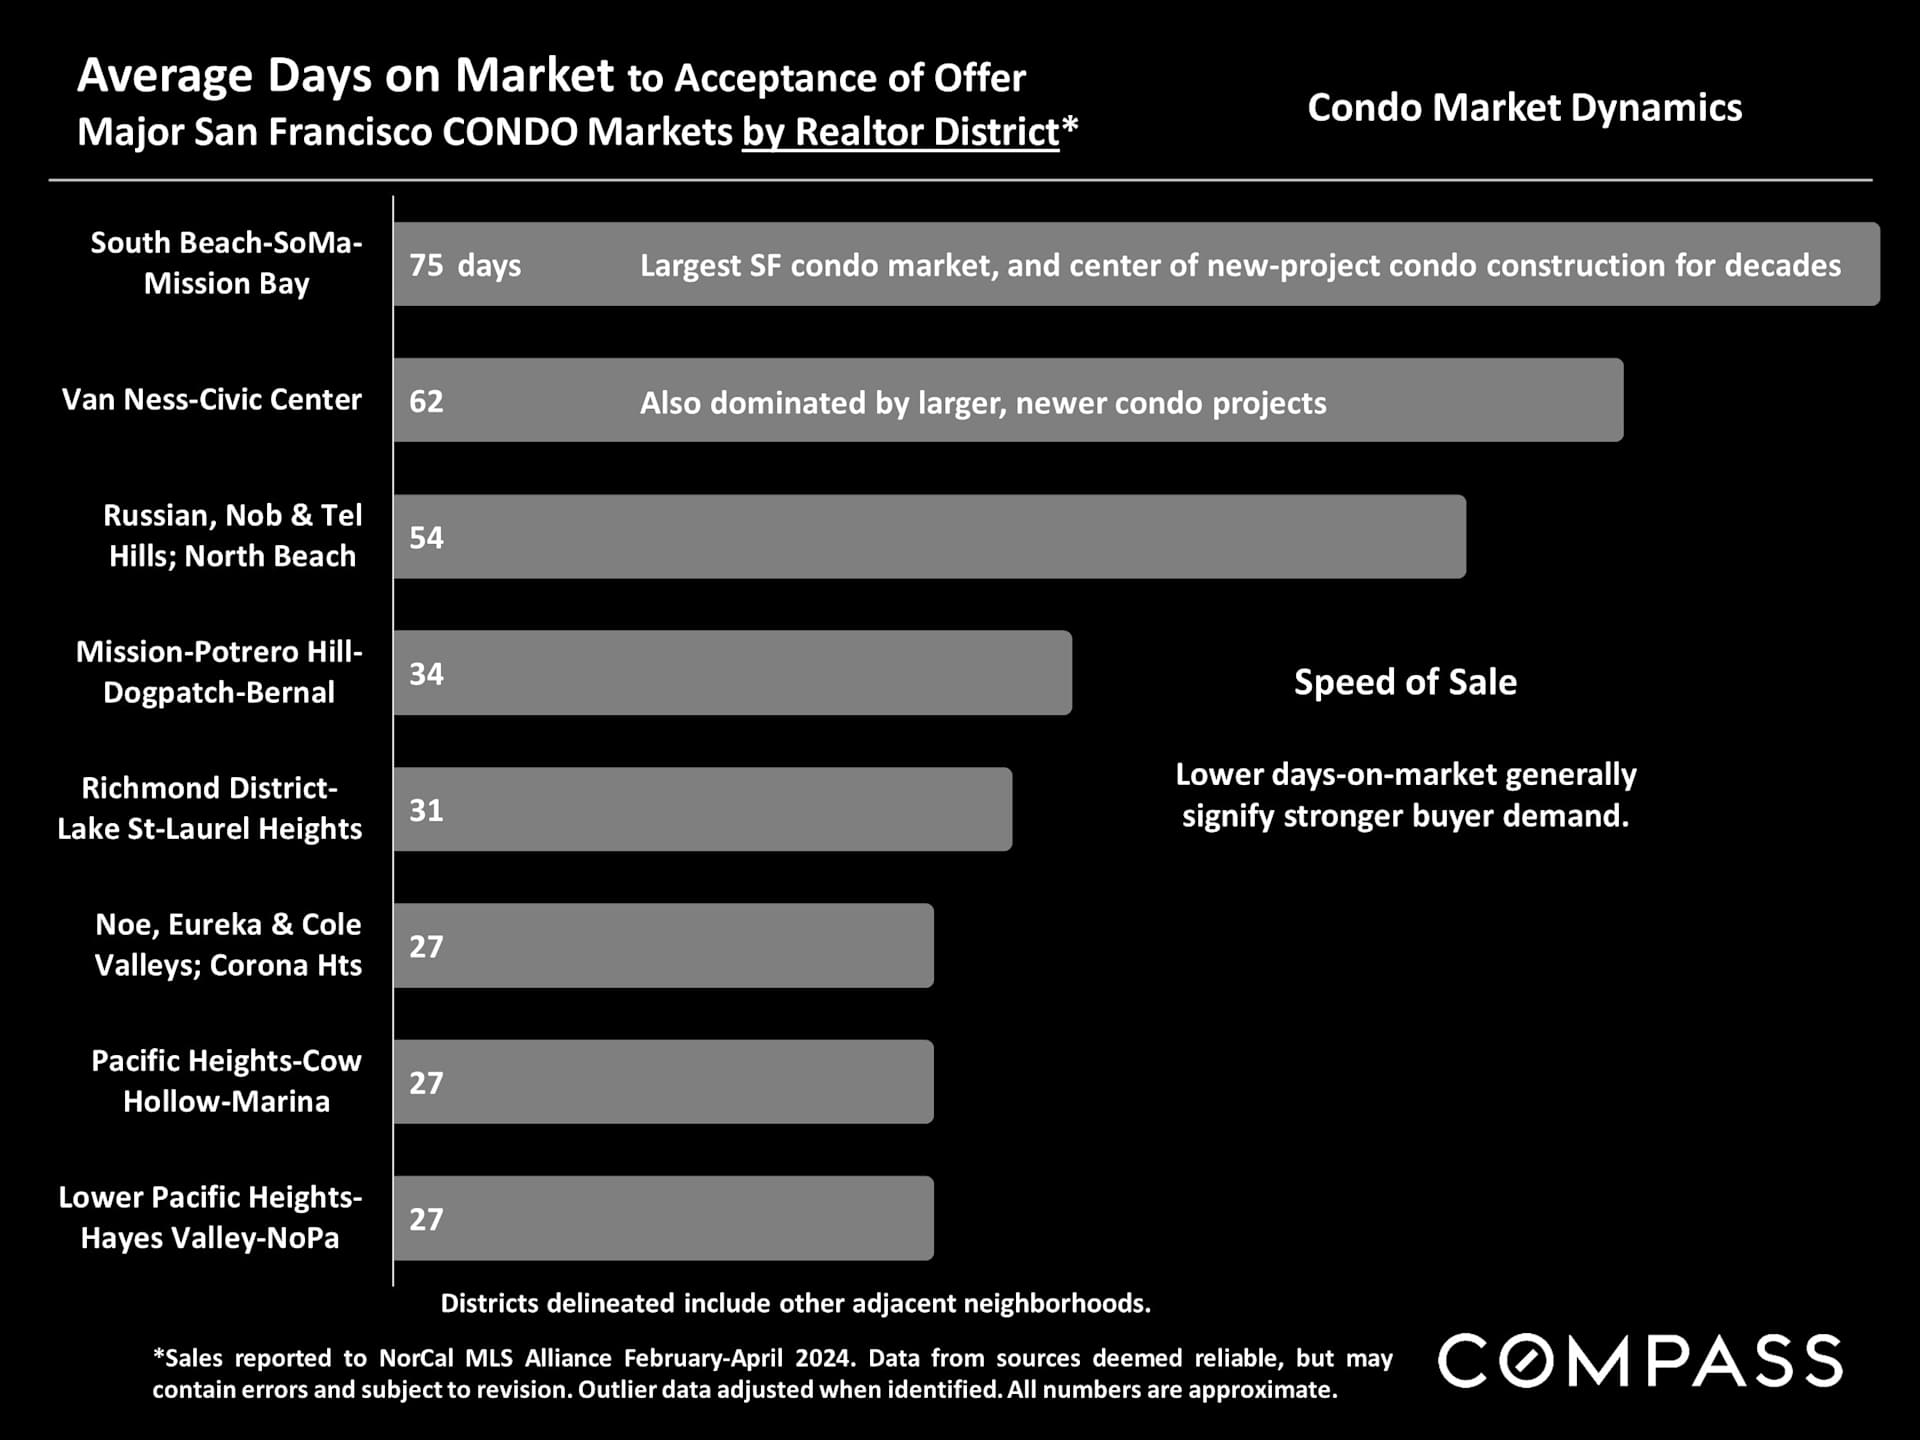
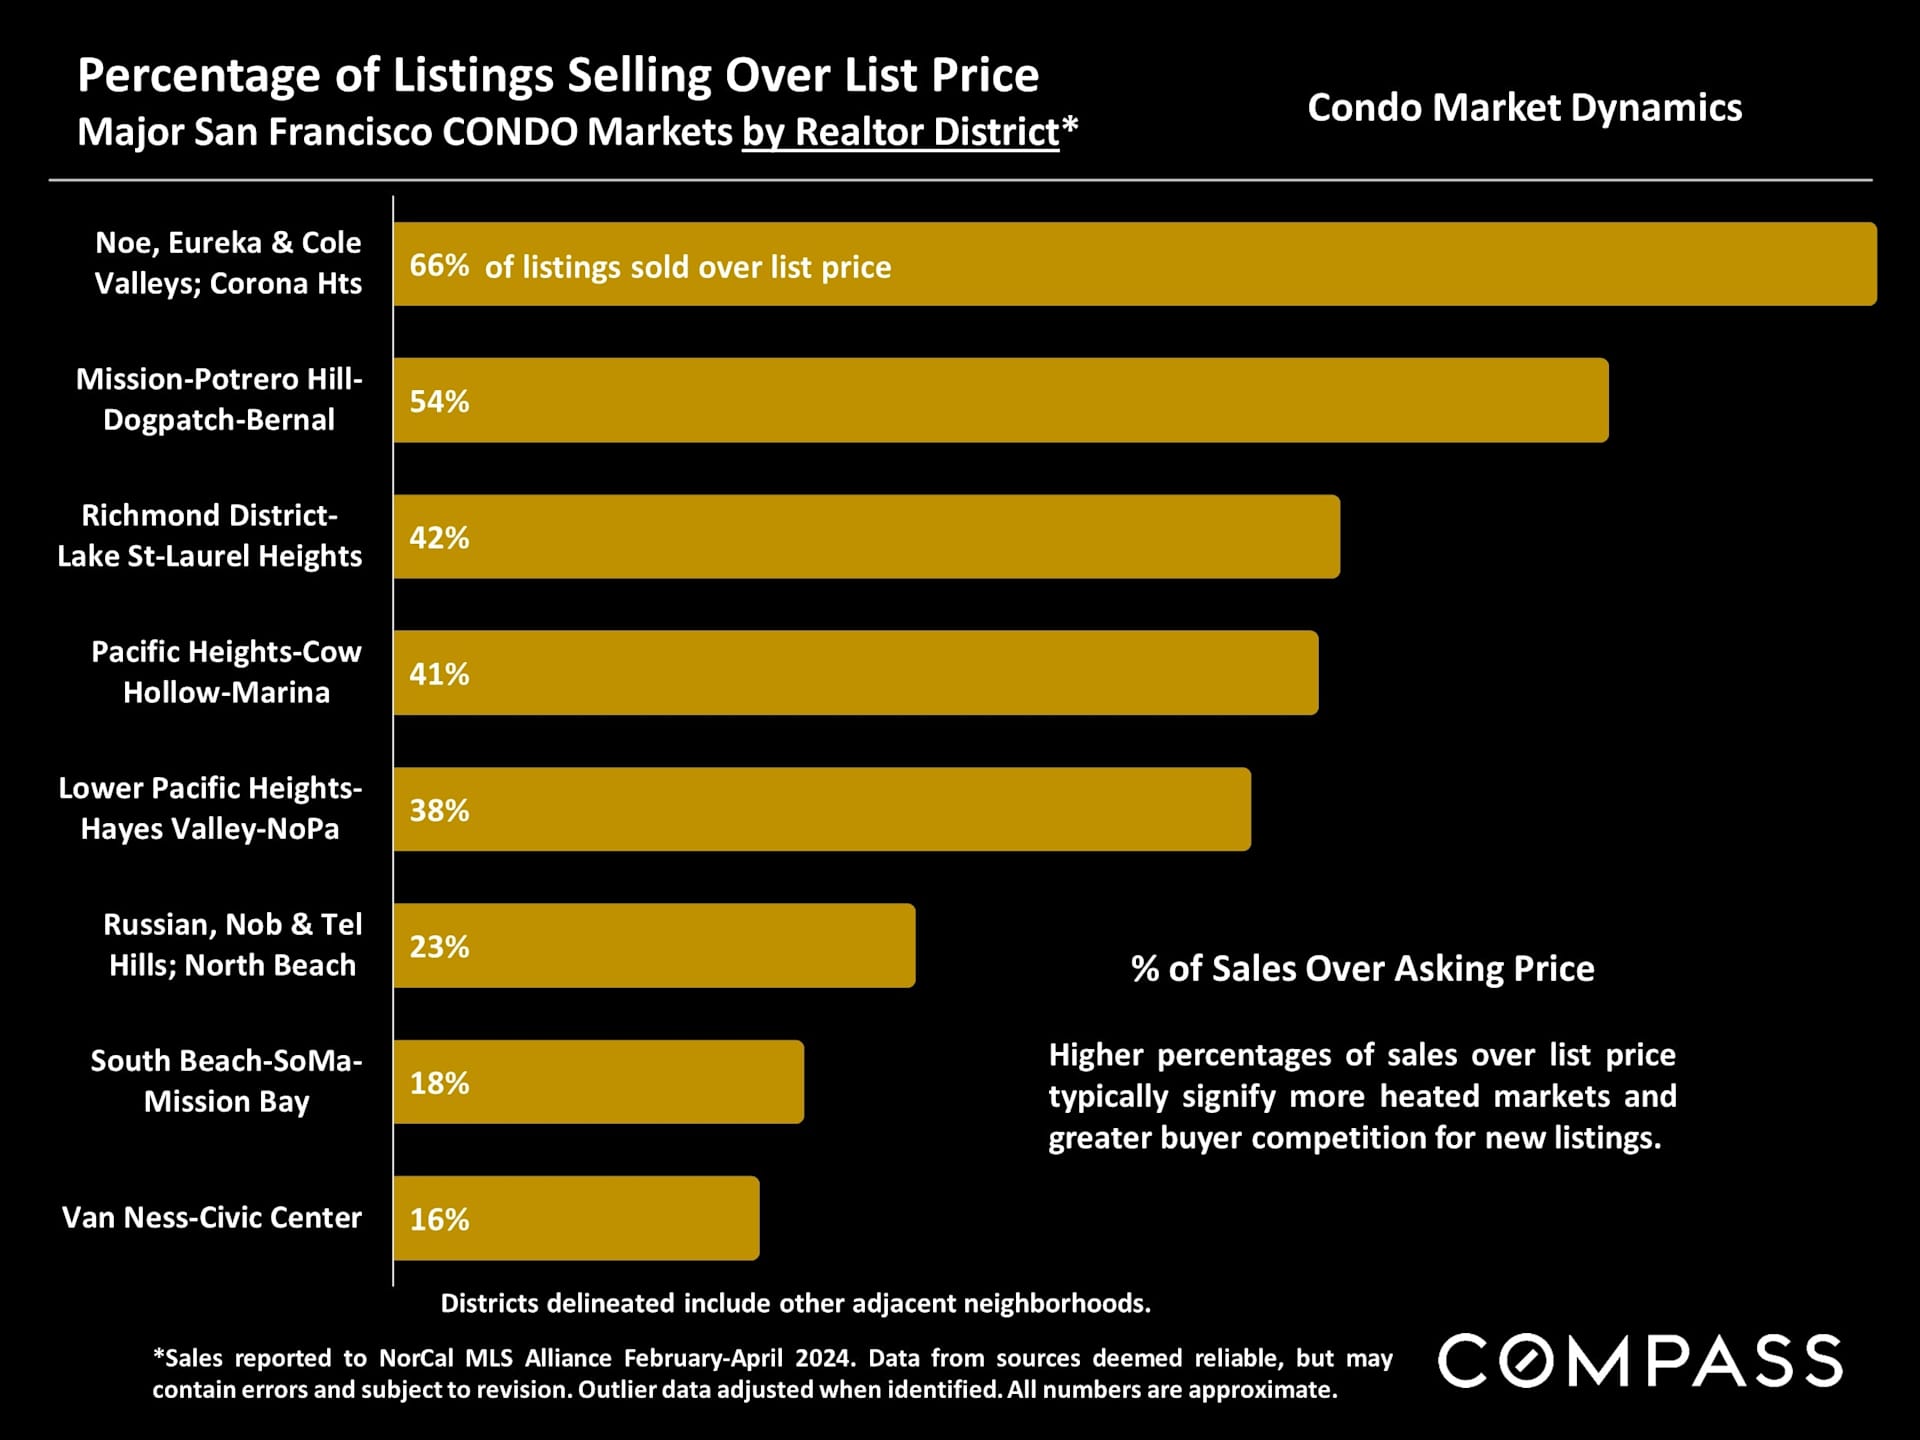
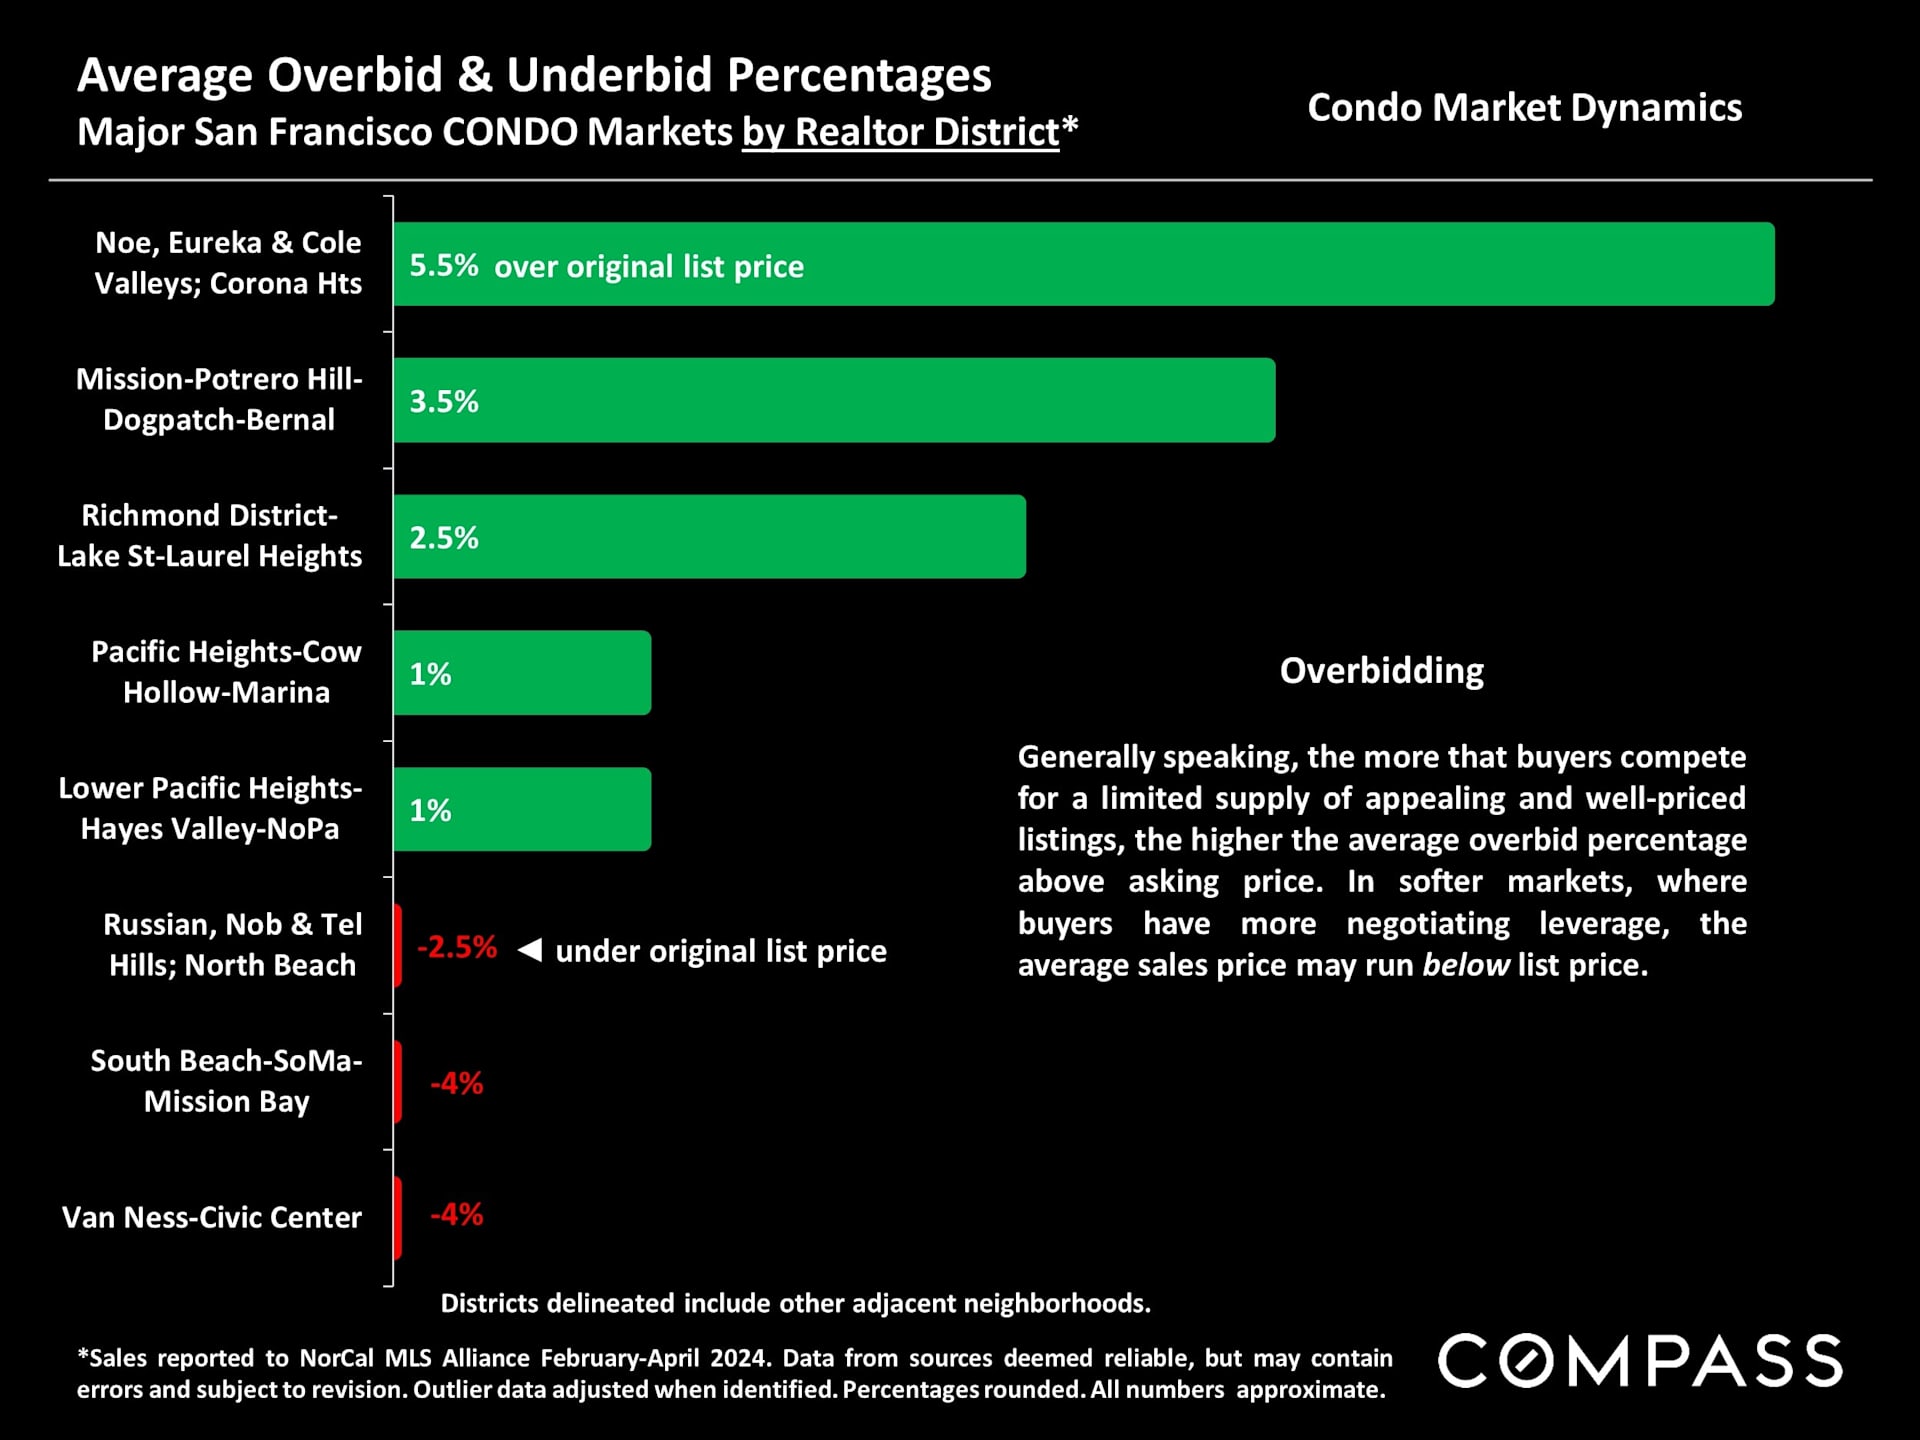
April 2024 market highlights on home sales, price reductions, inflation, and mortgage rates.San Francisco median house prices from 1990 to April 2024, with prices up 9.5% year over year.San Francisco home appreciation chart shows a rebound to 8% year-over-year in Q1 2024 after steep declines.Chart of San Francisco condo prices from 2005 to April 2024, peaking near $1.3 million in 2022.Chart comparing San Francisco downtown and non-downtown condo prices from 2005 through April 2024.San Francisco condo and house value trends since 2005, shown as blue bars and a white line through April 2024.Chart of San Francisco new listings from December 2019 to April 2024, showing seasonal peaks and an April increase.San Francisco active and coming-soon listings chart from February 2022 to May 2024, with 1,205 listings in May.Chart of San Francisco listings entering contract, August 2021 to April 2024, with spring 2024 at its highest since mid-2022.Bar chart of San Francisco monthly home sales from January 2020 through April 2024.Chart of San Francisco $5 million-plus home sales, with April 2024 reaching its highest monthly count since spring 2022.Chart of median San Francisco house prices by neighborhood, from $6.65 million in Cow Hollow to $910,000 in Bayview.San Francisco neighborhood house values per square foot, shown in a gold-bar chart from Presidio Heights to Bayview.Chart comparing median home sizes across San Francisco neighborhoods, from 4,725 square feet in Presidio Heights to 1,362 in Excelsior.Chart comparing median San Francisco condo prices across neighborhoods, from Presidio Heights to Van Ness/Civic Center.Chart comparing median condo prices per square foot across selected San Francisco neighborhoods.Chart comparing median condo square footage across San Francisco neighborhoods, from Presidio Heights to Van Ness/Civic Center.San Francisco chart comparing house and condo days on market, January 2020–April 2024.Chart of San Francisco home sales over list price, rising to 55% overall in April 2024.San Francisco chart comparing house and condo sale prices to original list prices, January 2020–April 2024.Chart of San Francisco active-listing price reductions, highlighting October peaks and April 2024 trends.Chart comparing San Francisco Realtor district house sales volumes and median prices, with neighborhood groupings.San Francisco house-market days-on-market chart by Realtor district, with averages ranging from 23 to 36 days.San Francisco housing market chart showing the share of listings selling over list price across ten realtor districts.San Francisco house-market overbid chart: Sunset-Parkside leads at 17%; two districts show underbids of 1%.Chart compares San Francisco condo sales volumes and median prices across ten realtor districts.San Francisco condo days on market by district: 75 days in South Beach–SoMa–Mission Bay, down to 27 in several districts.San Francisco condo sales-over-list-price chart: neighborhood percentages range from 16% to 66%.San Francisco condo market infographic compares overbid and underbid percentages by realtor district.Real estate statistics notes and legal disclaimer for a market report.

Work With Us

We will help you understand the complex aspects of the transaction and share our expertise so that you can make the best decisions possible. We are experienced, market savvy, and energetic. With both of us working for our clients, you get twice the amount of attention and insight.