
The SF Team, Eva + James, Compass

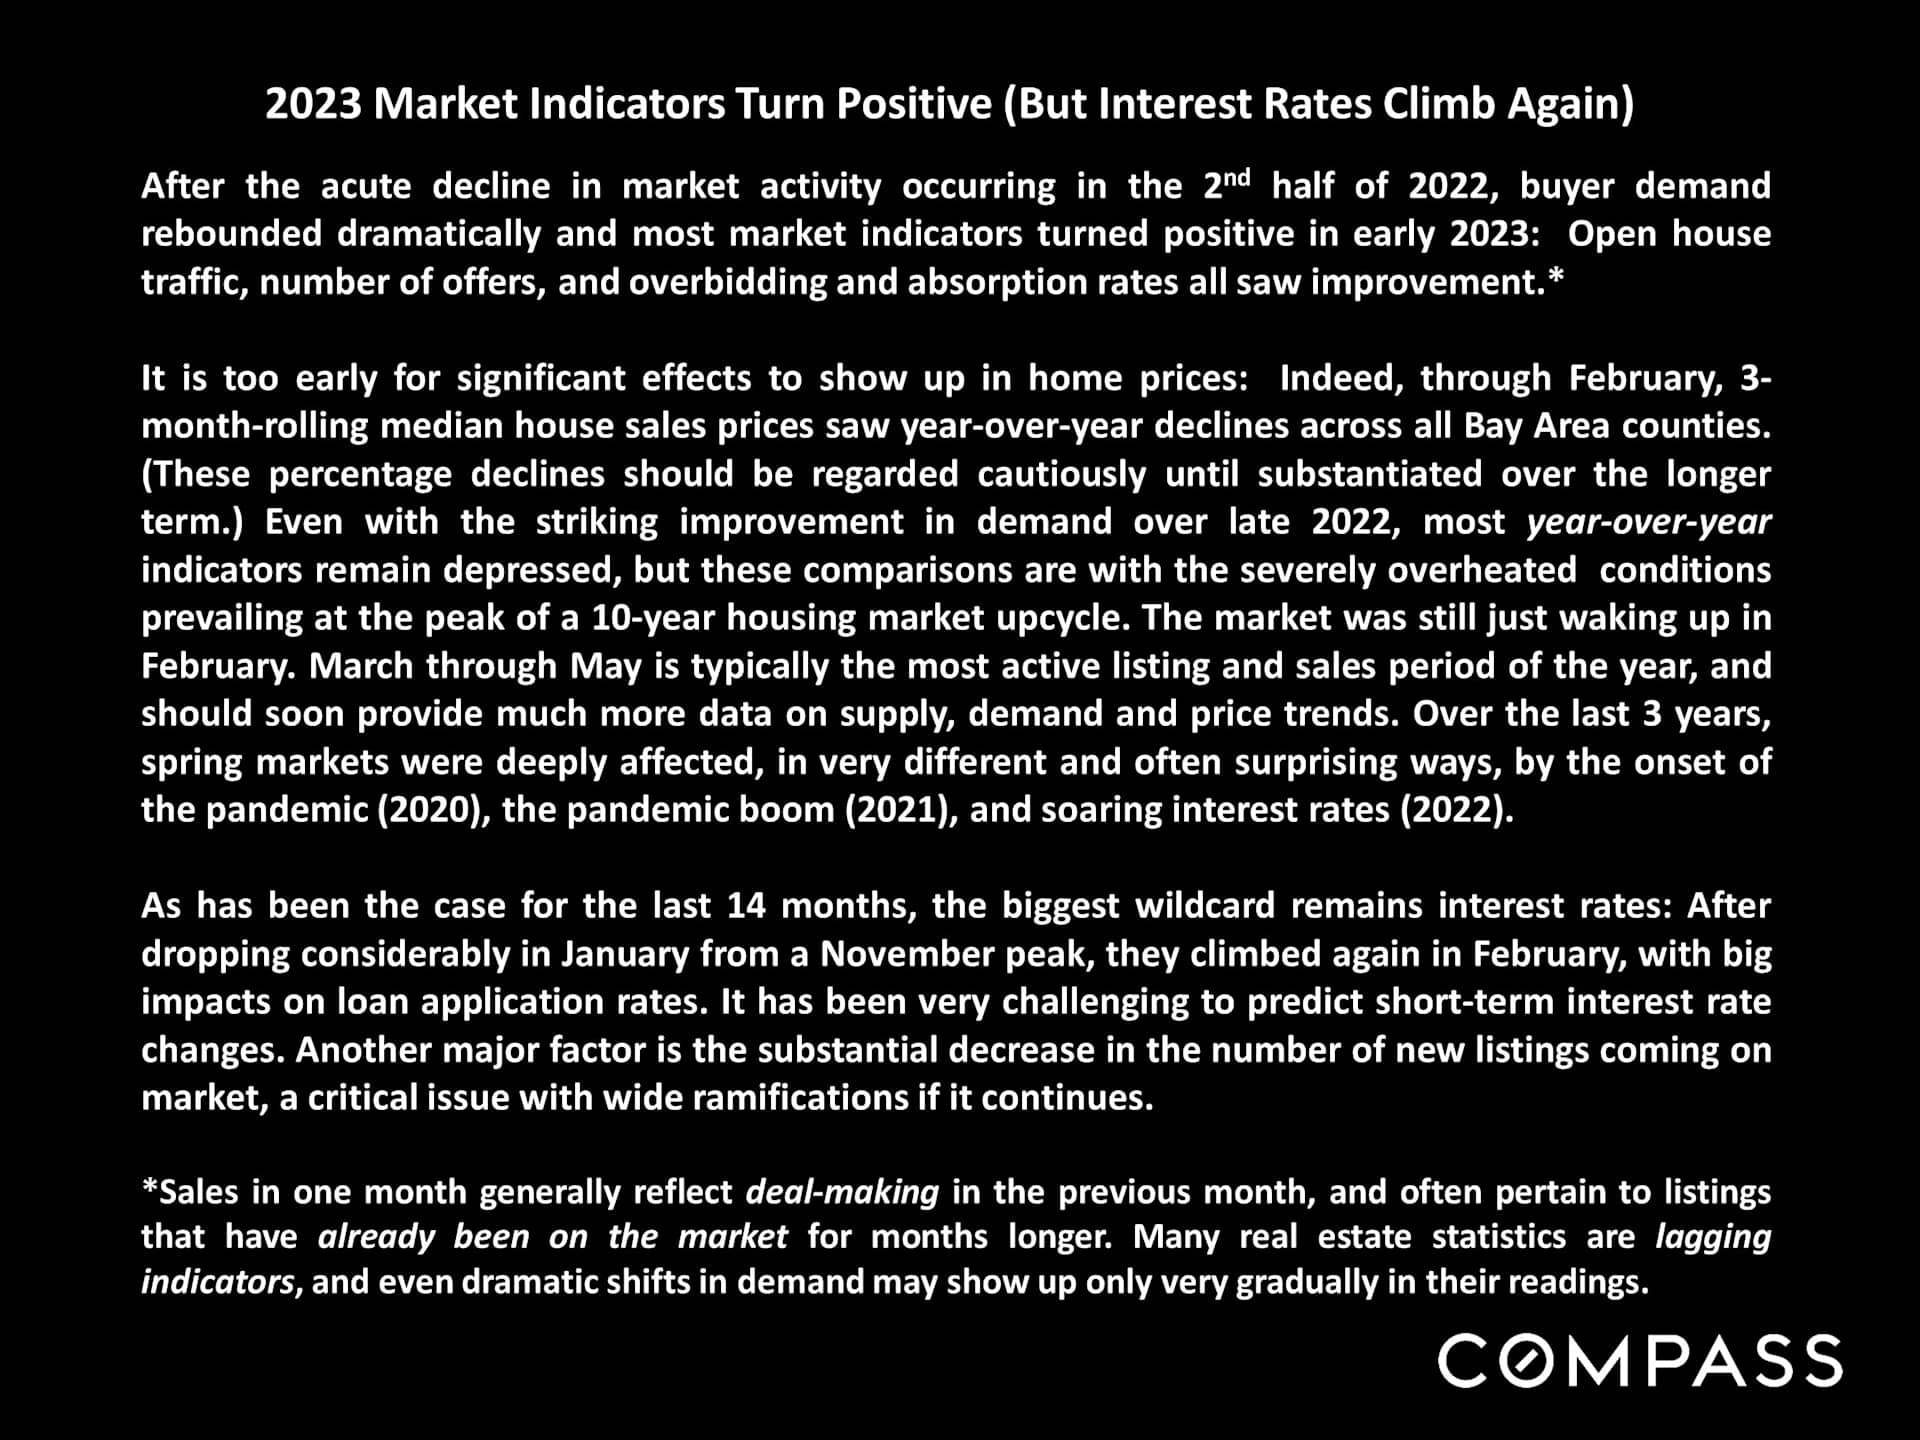
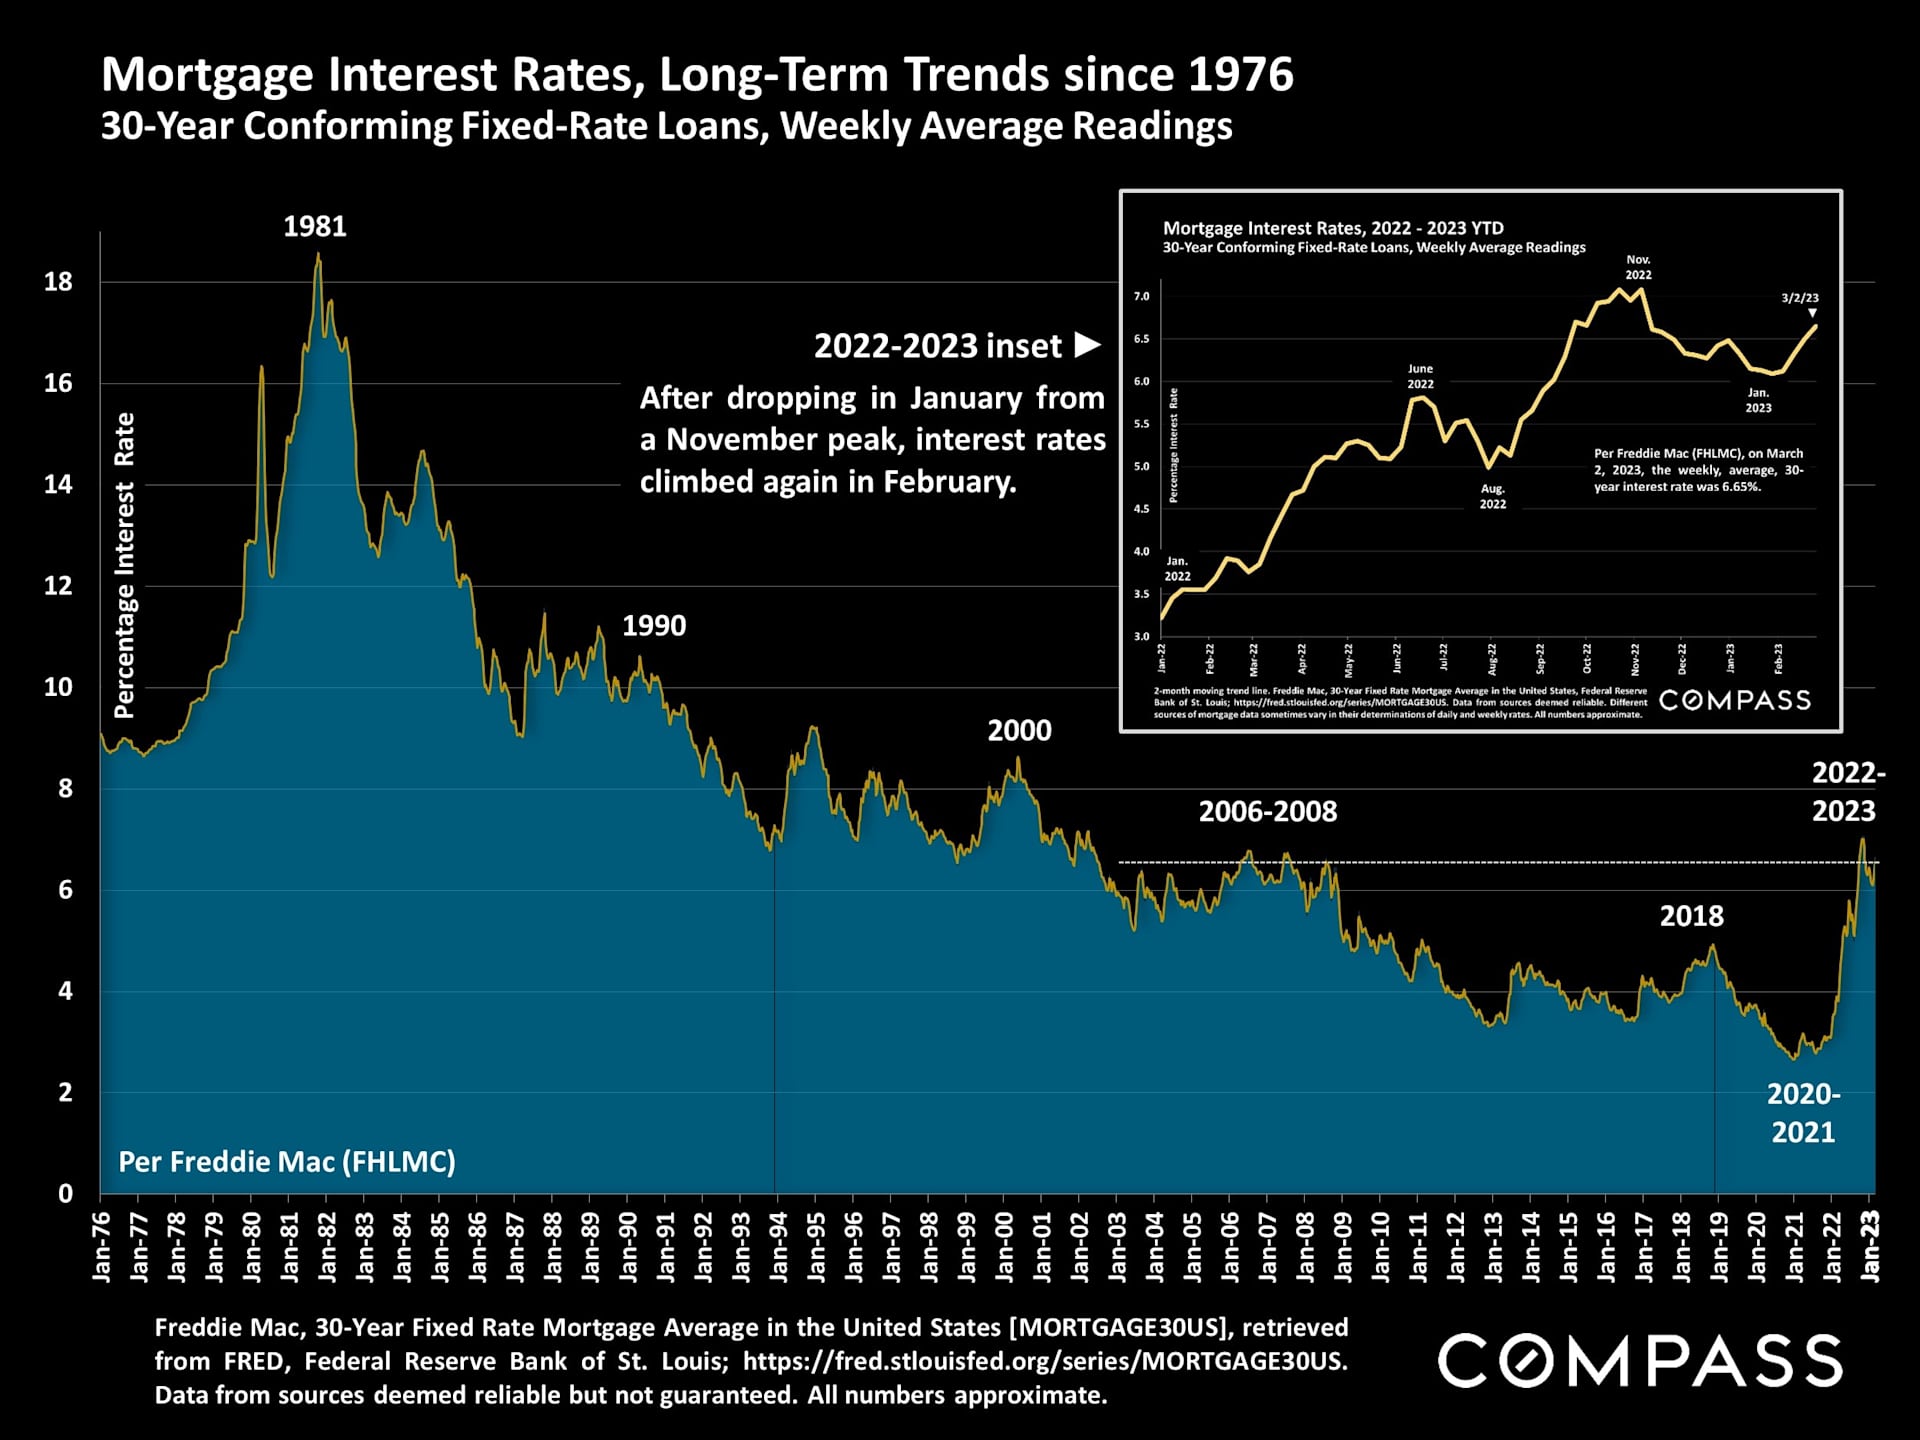
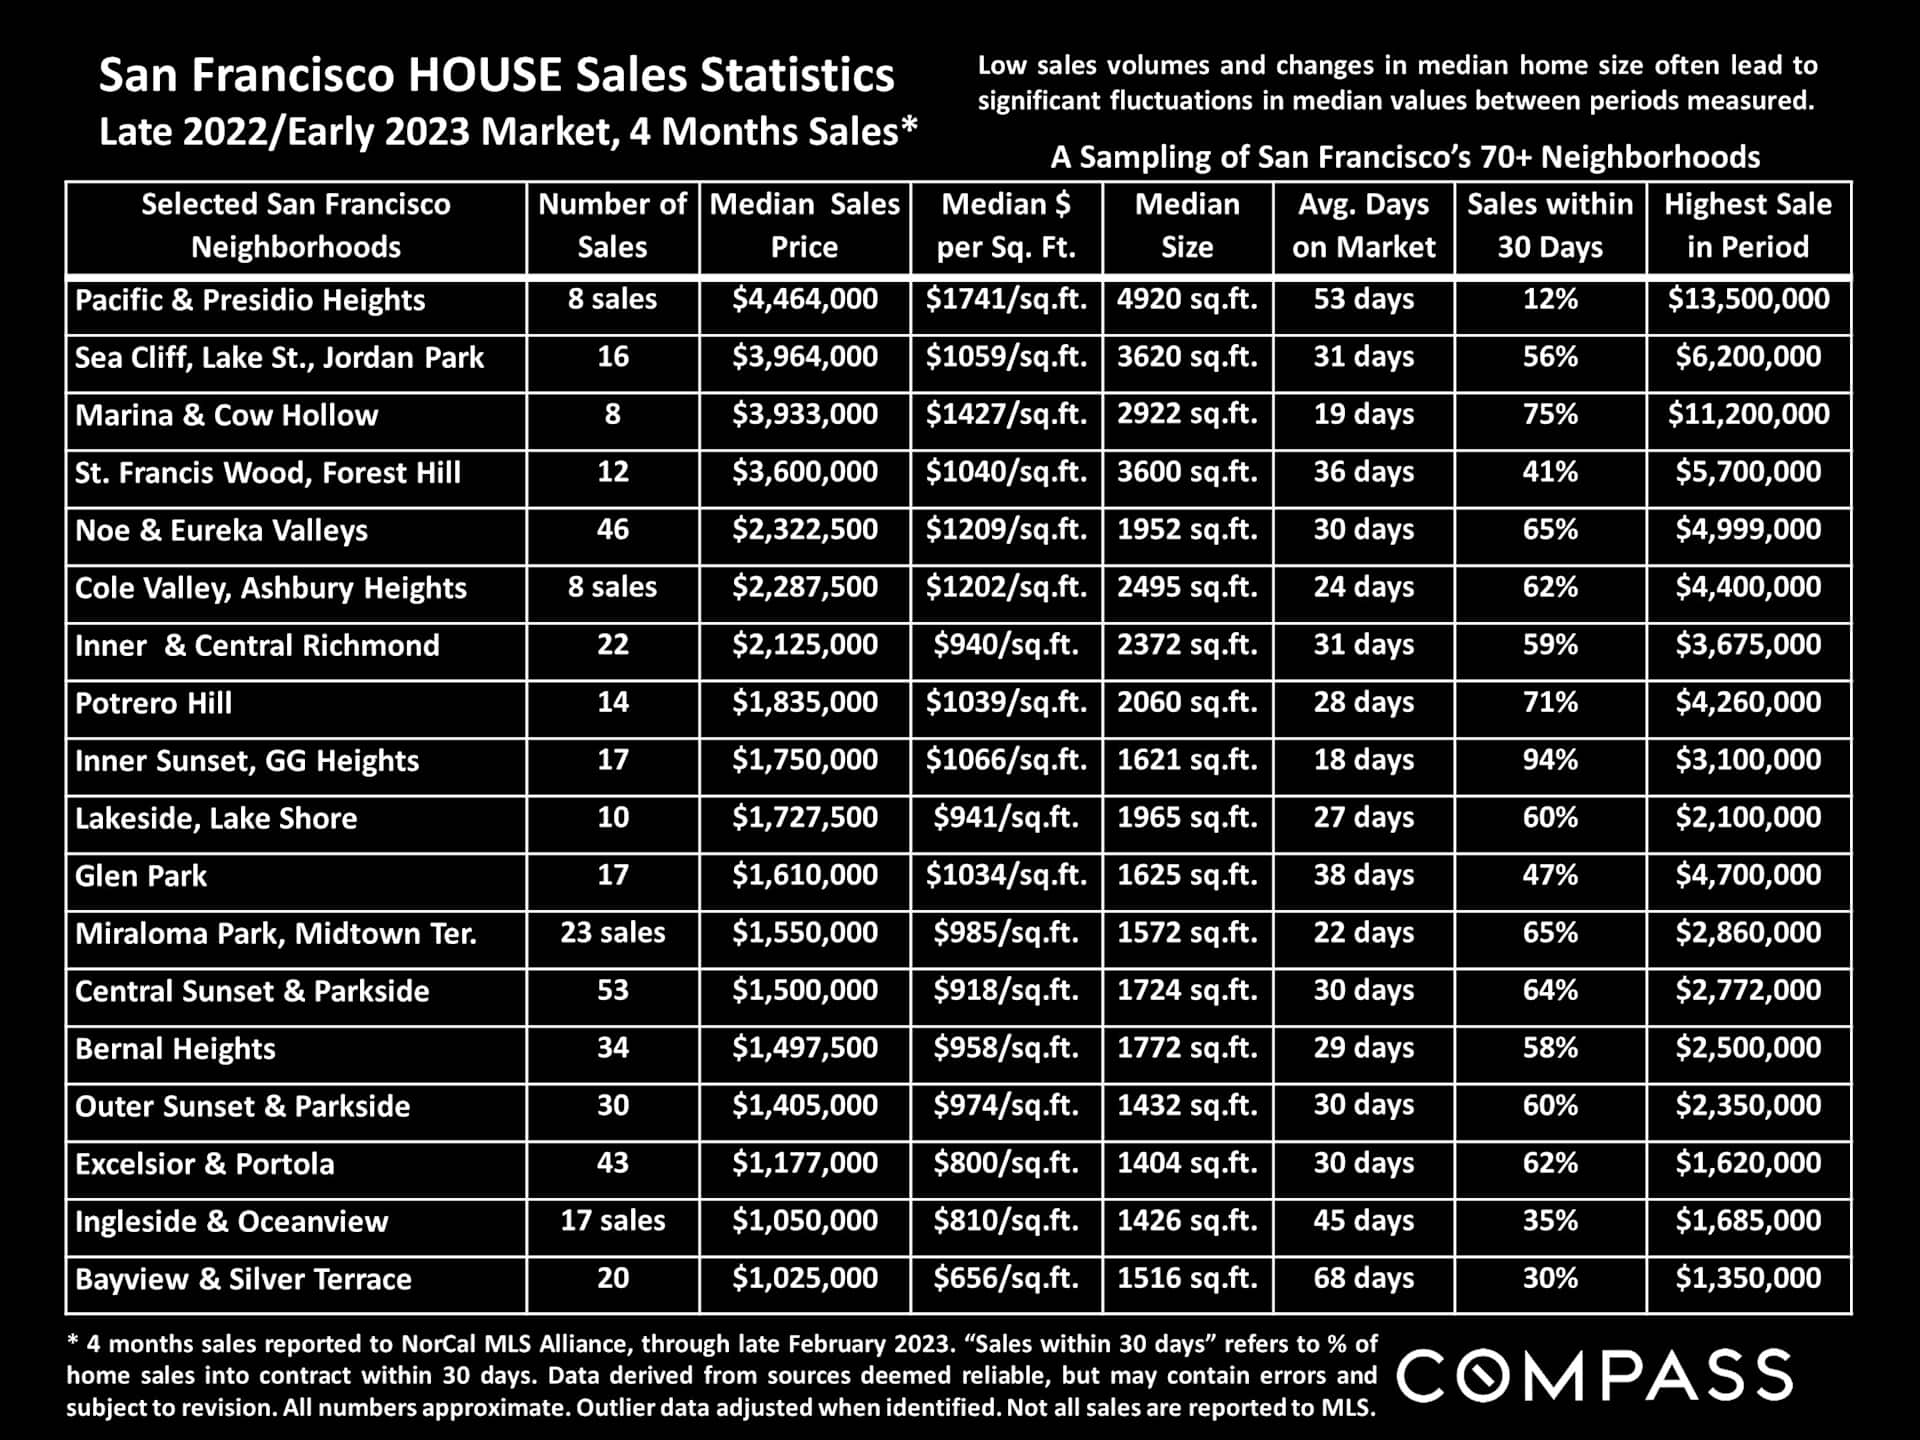
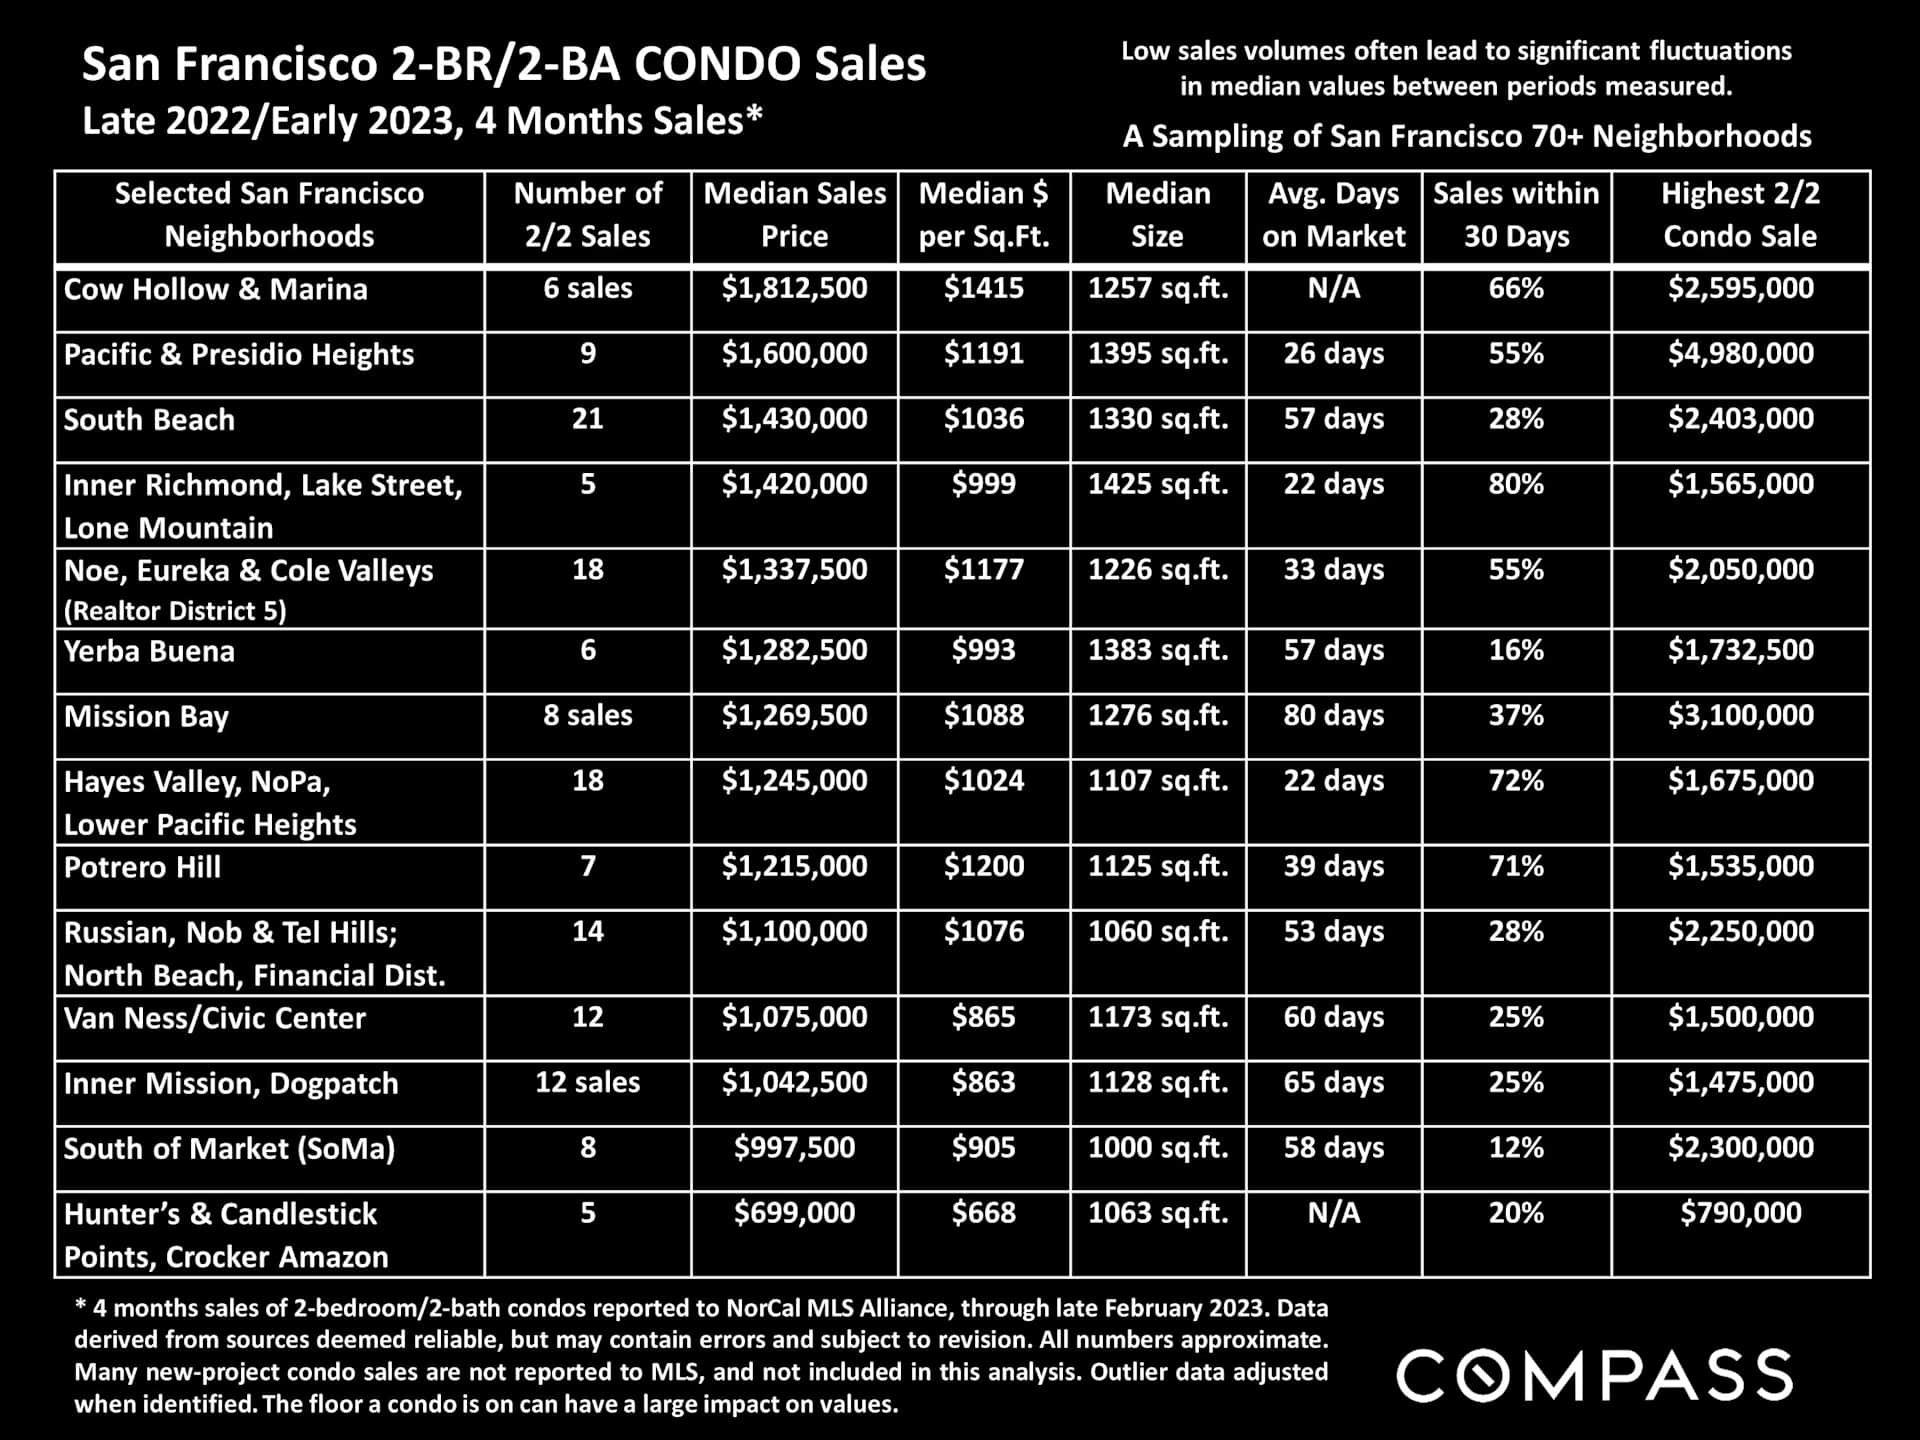
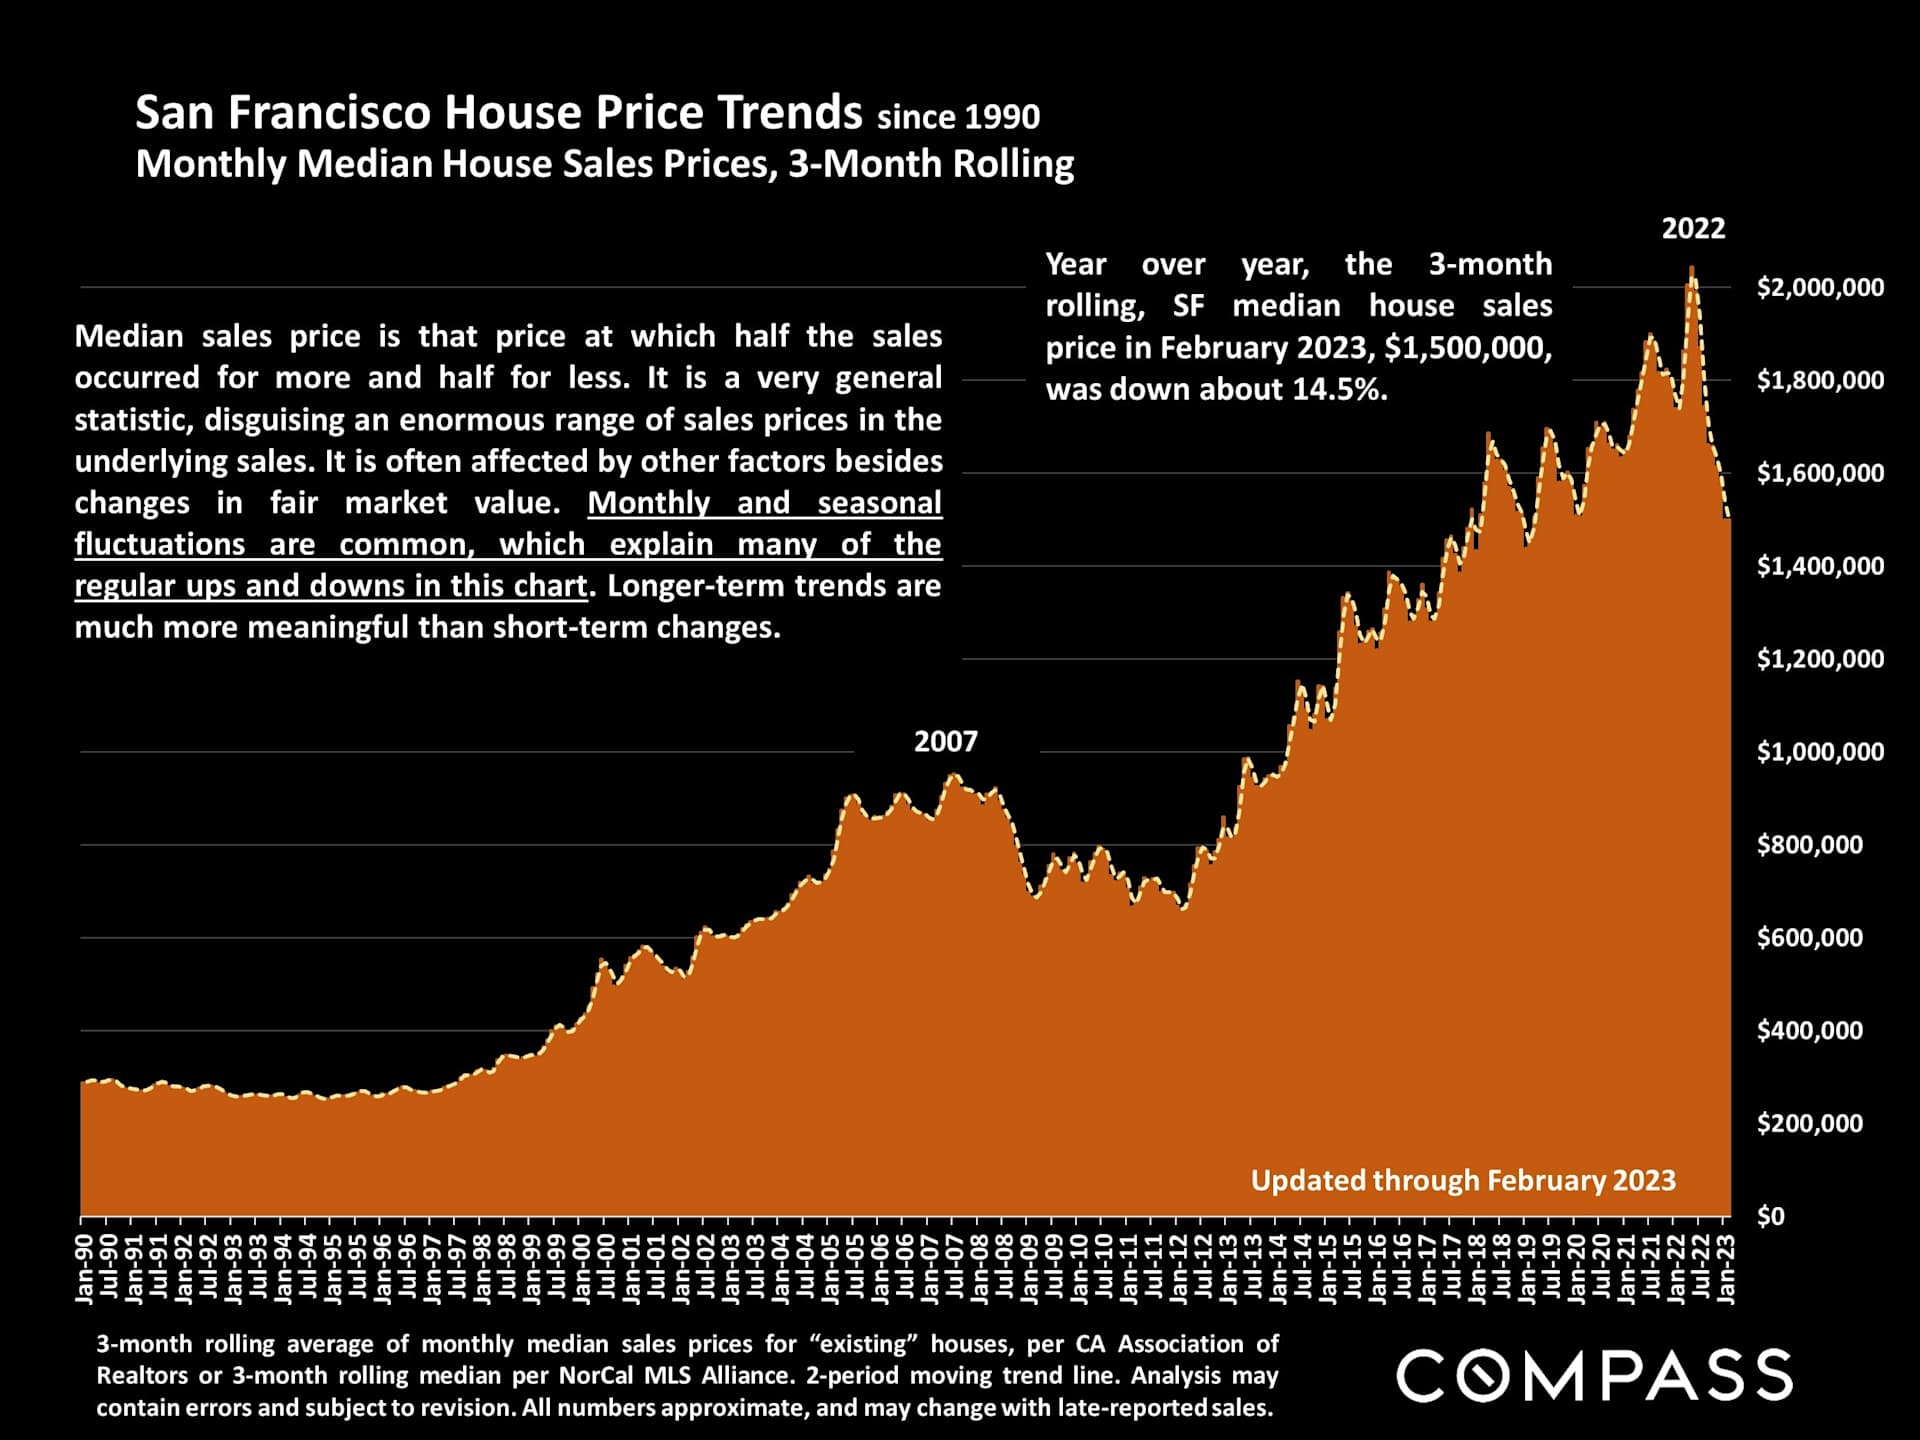
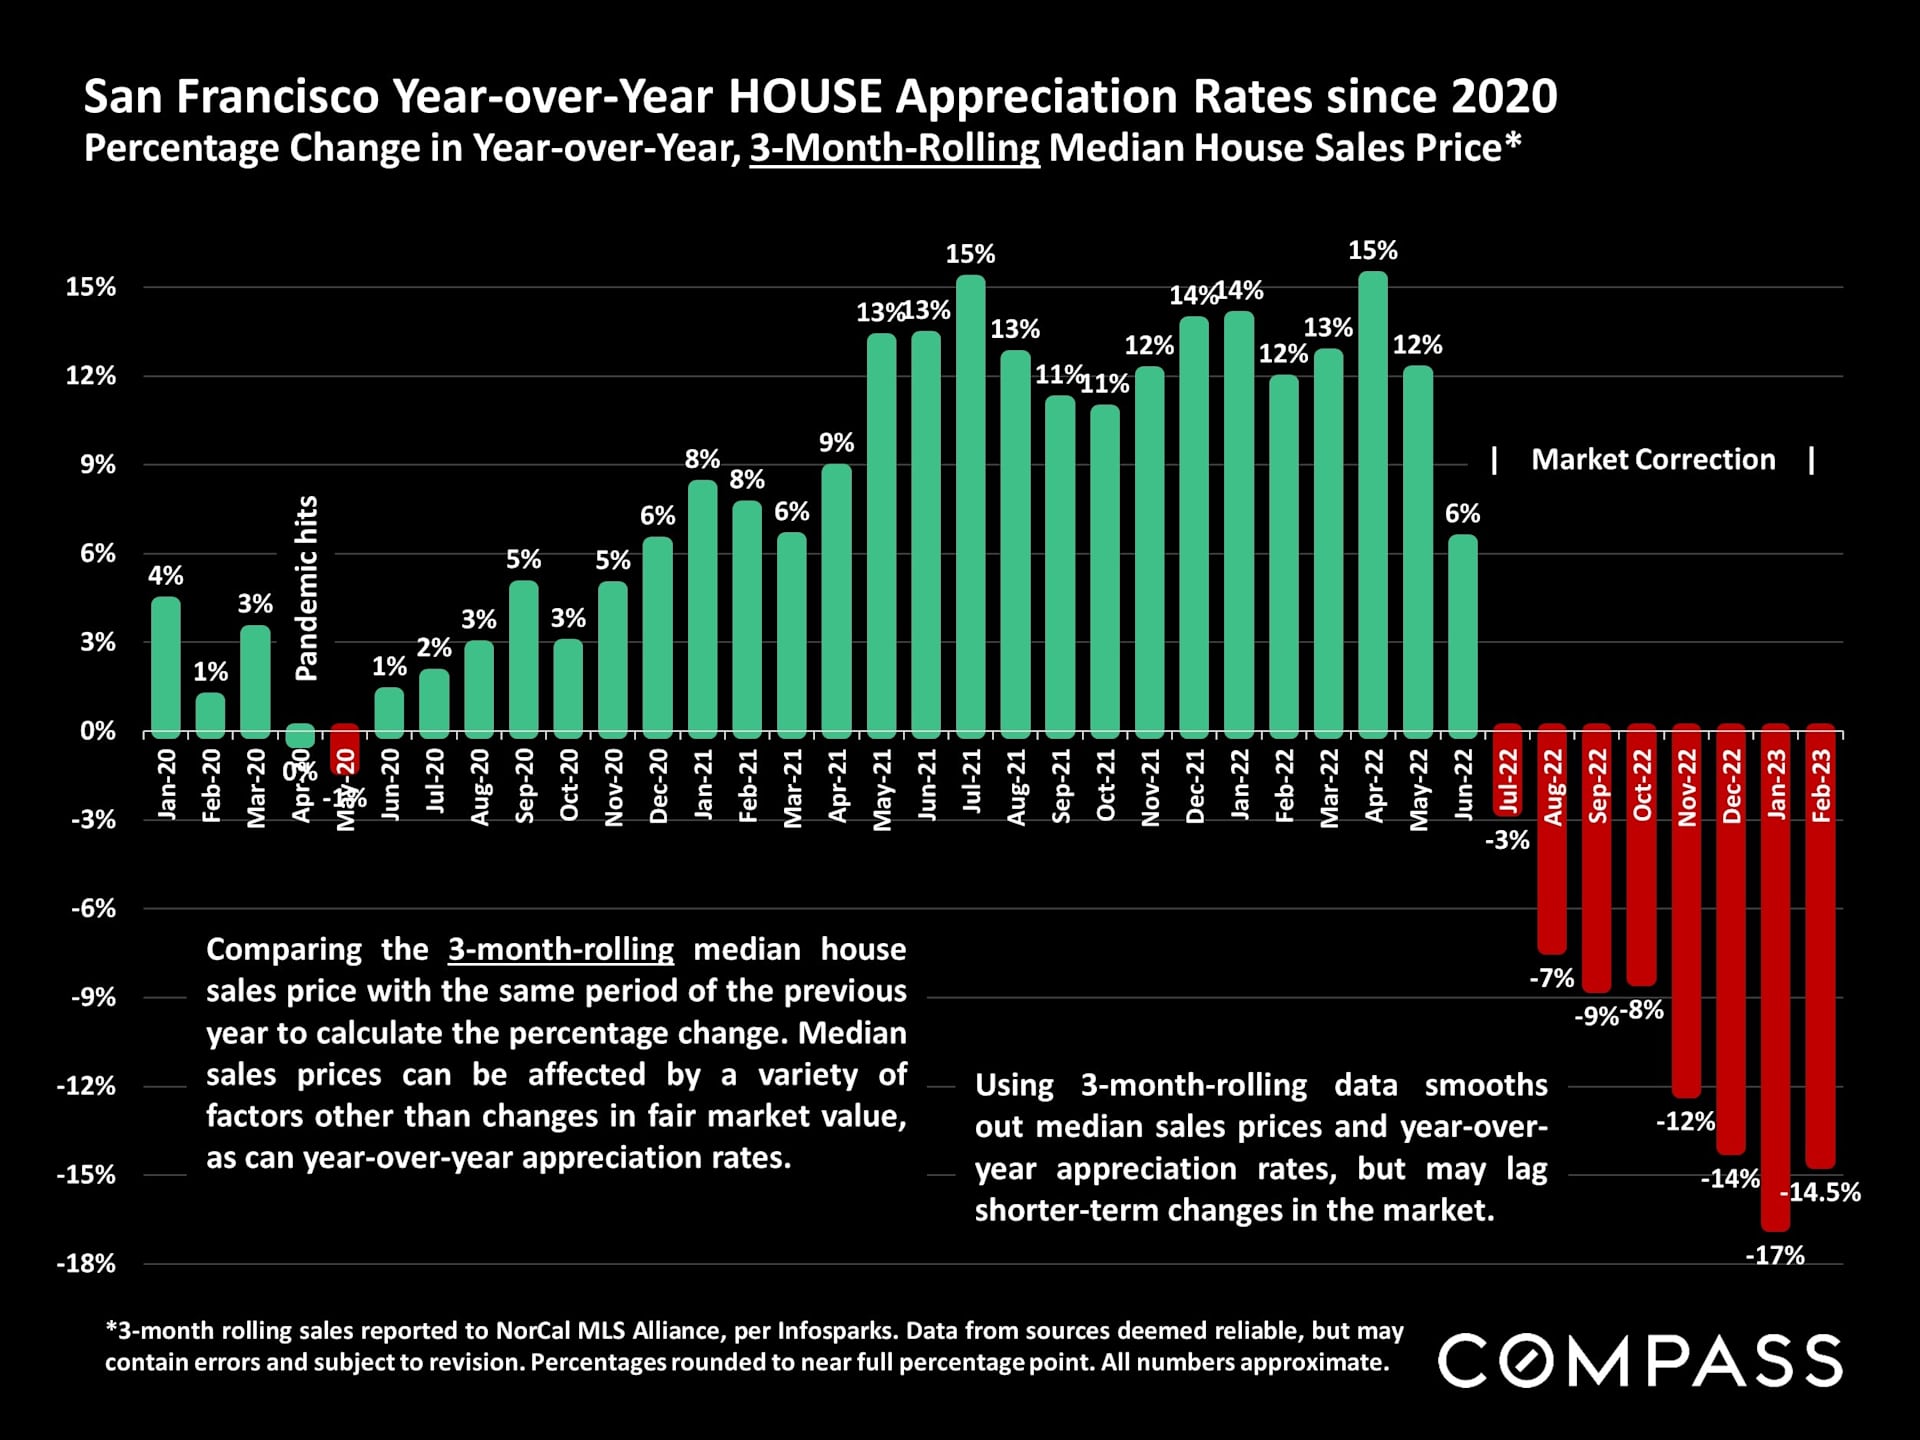
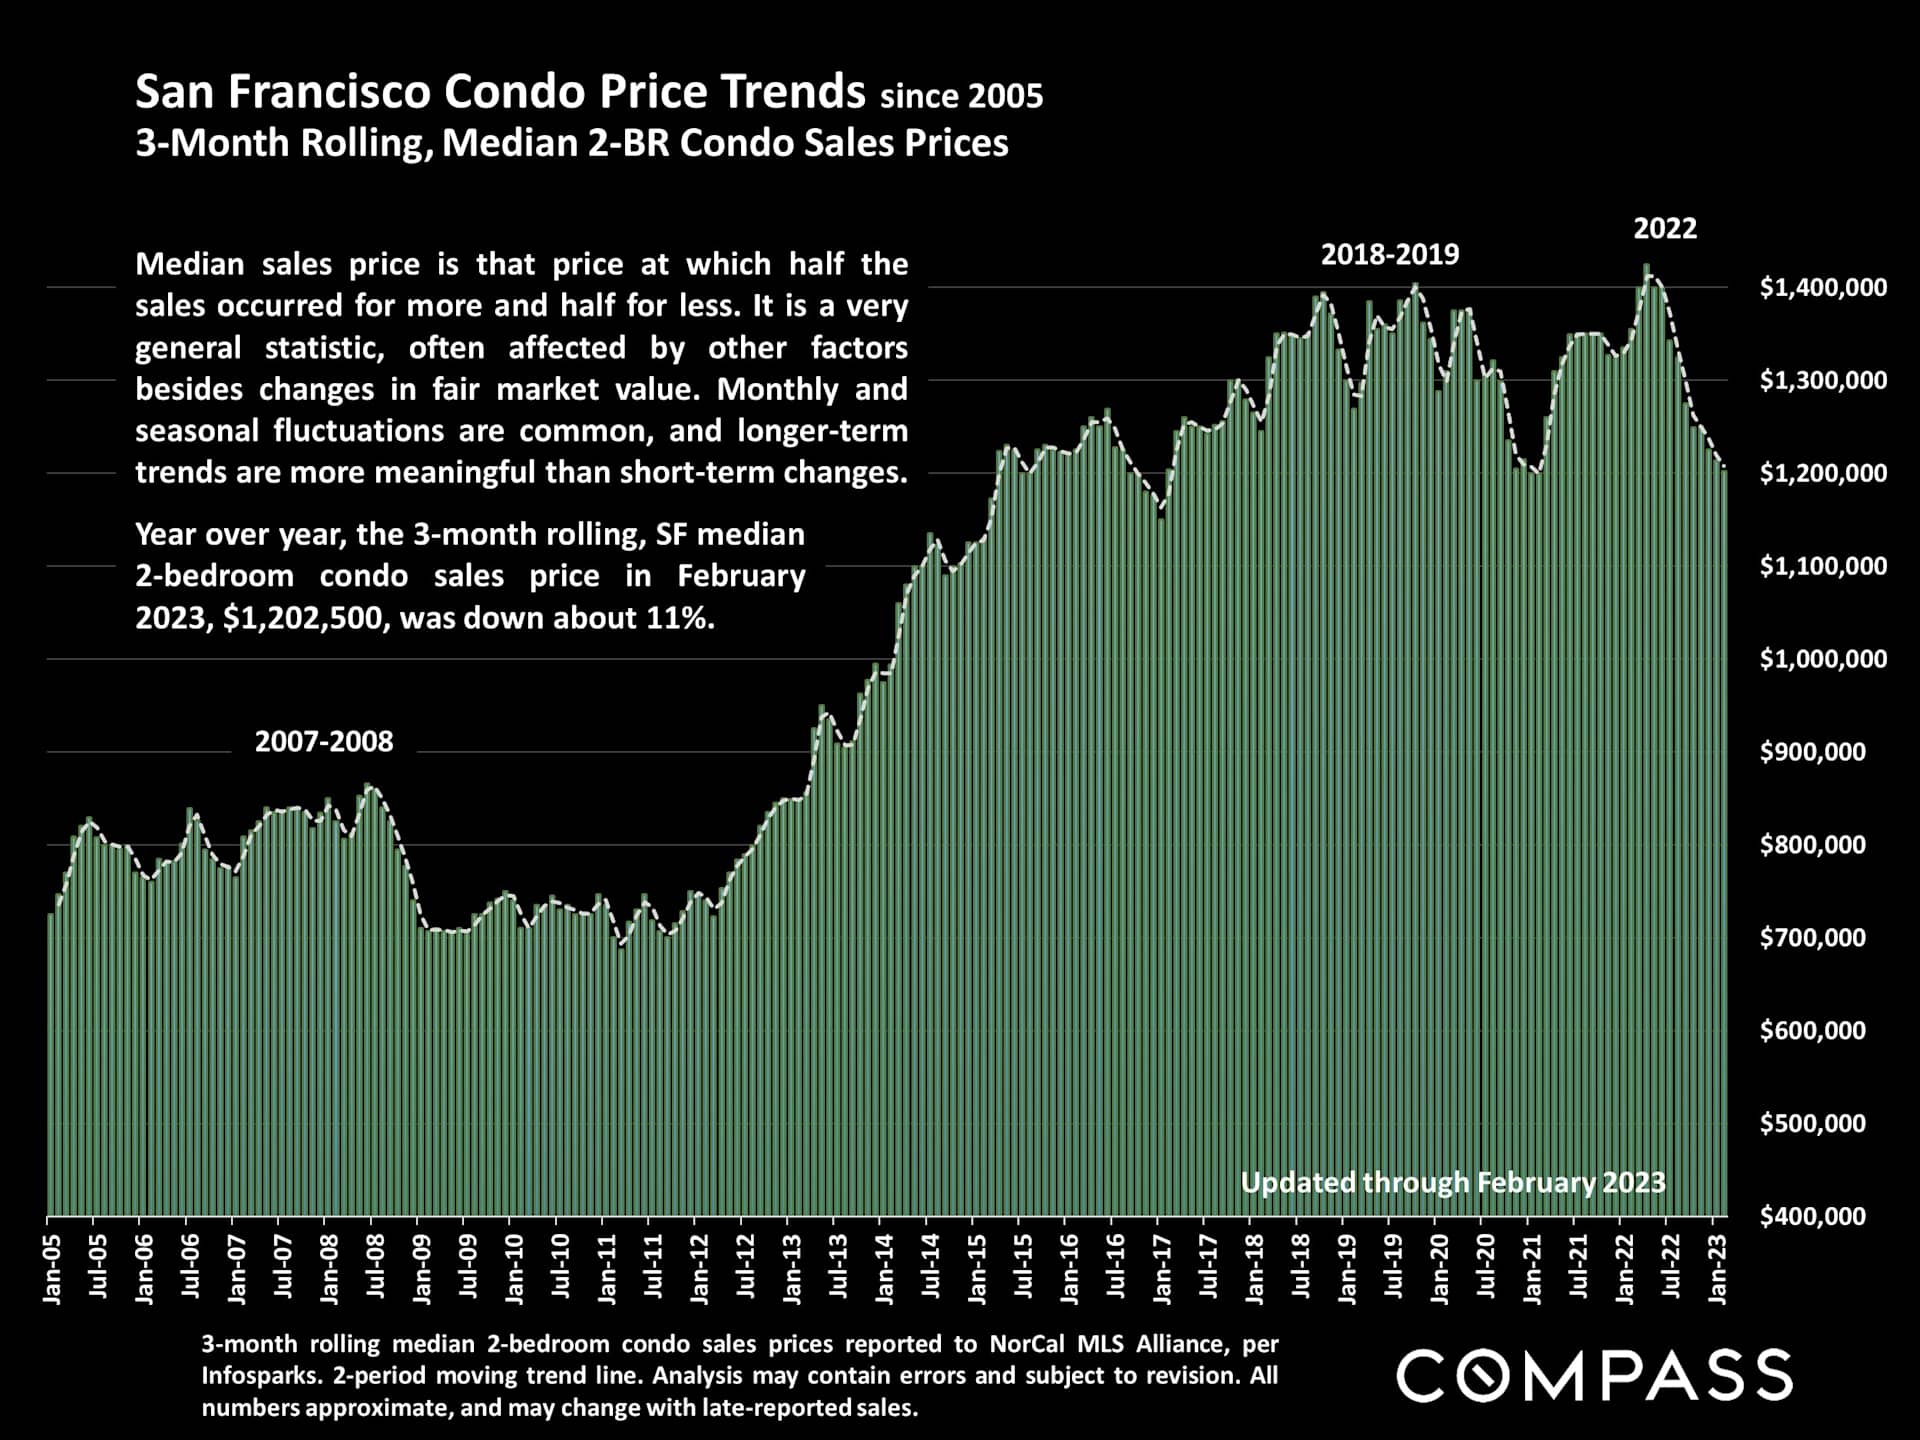
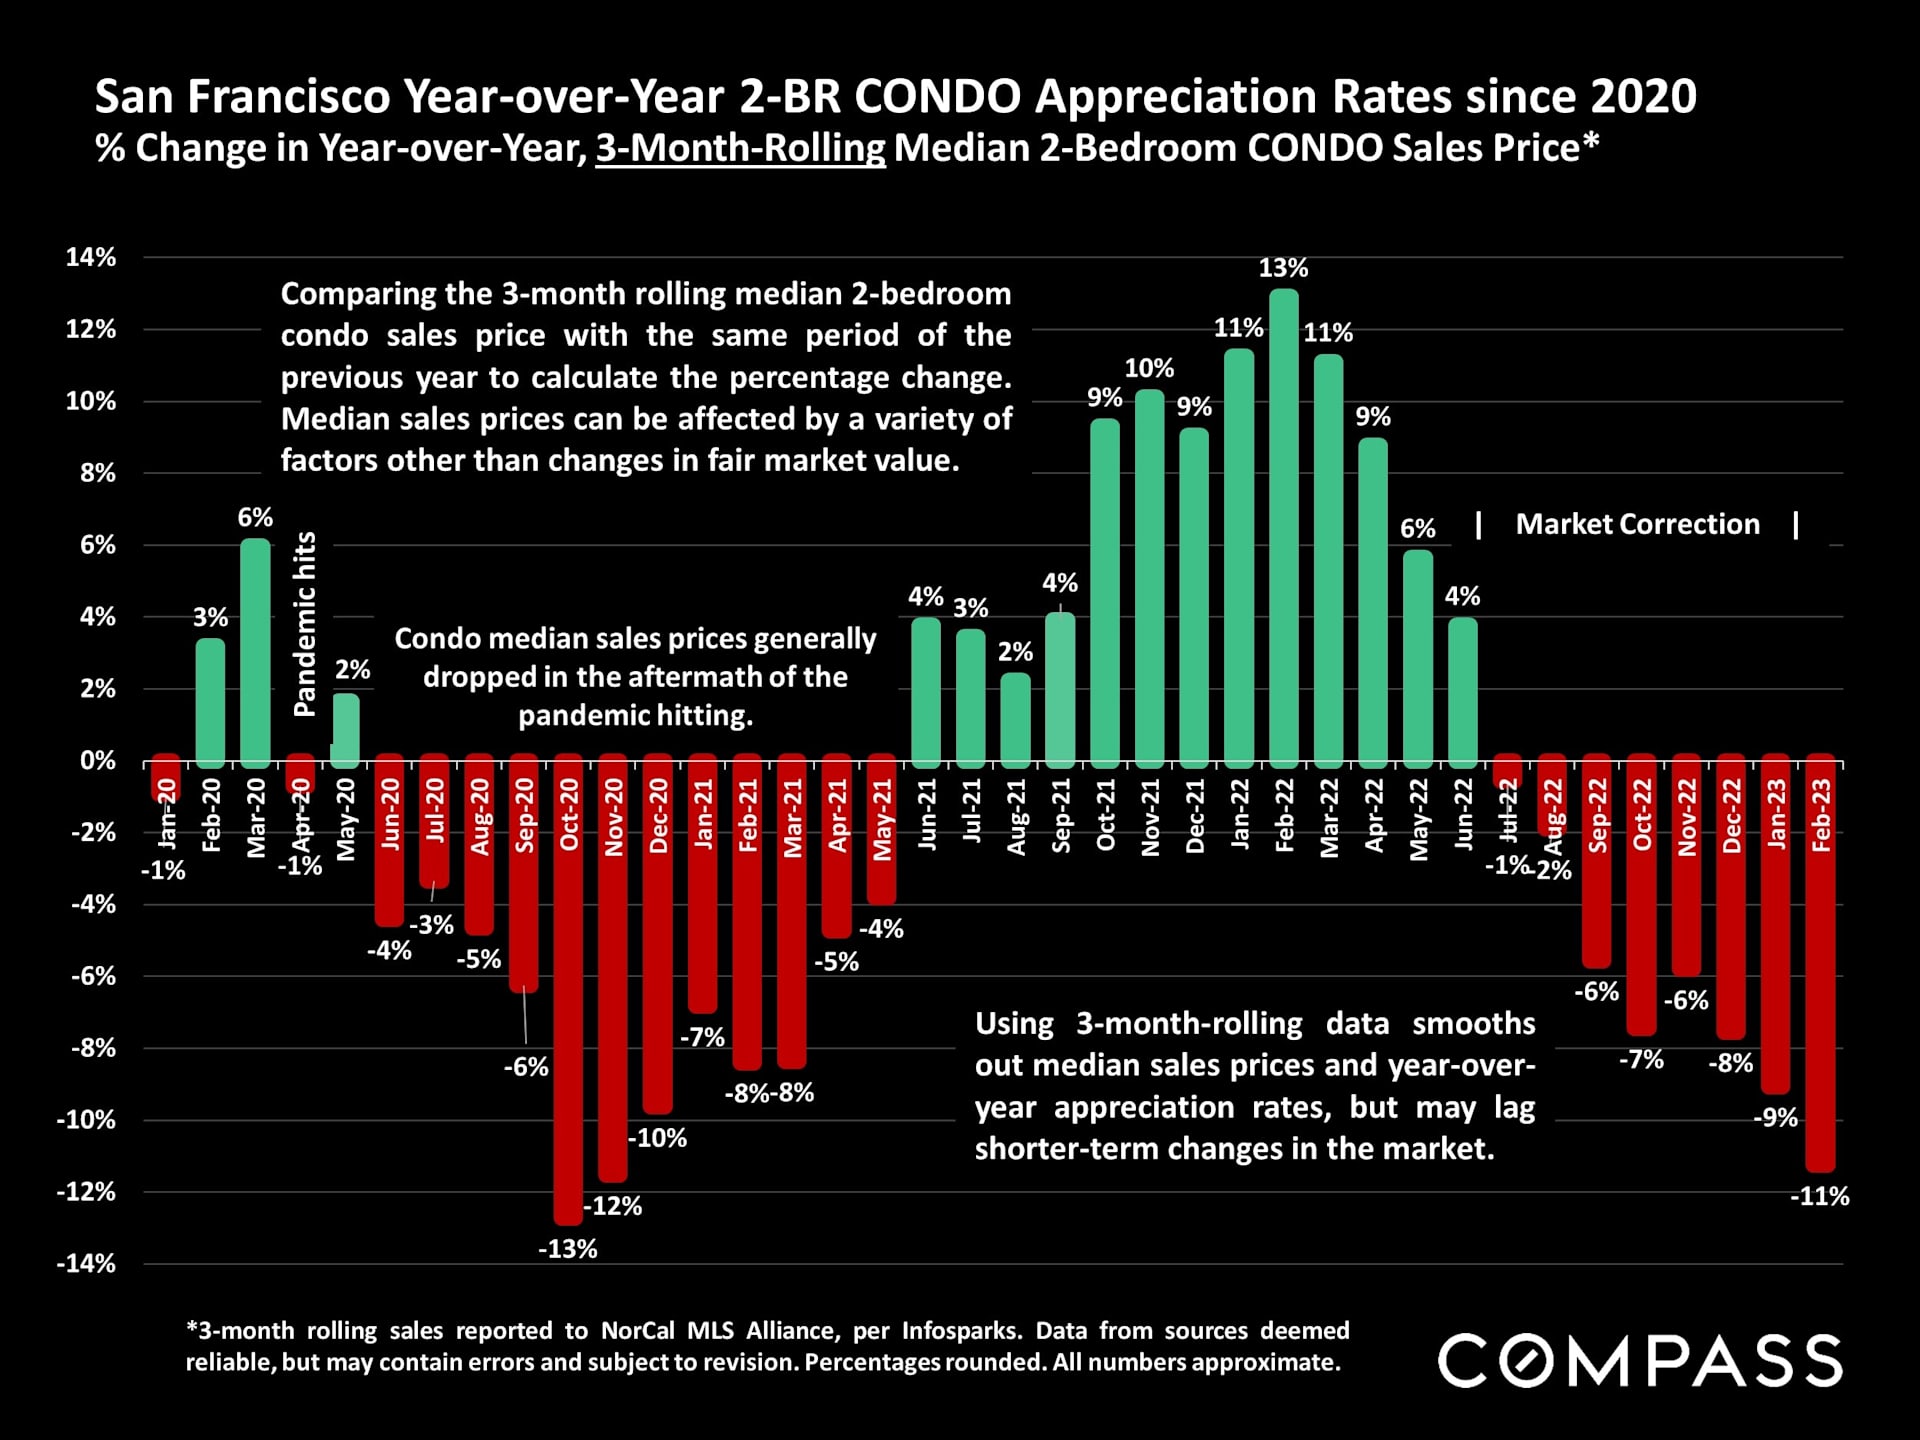
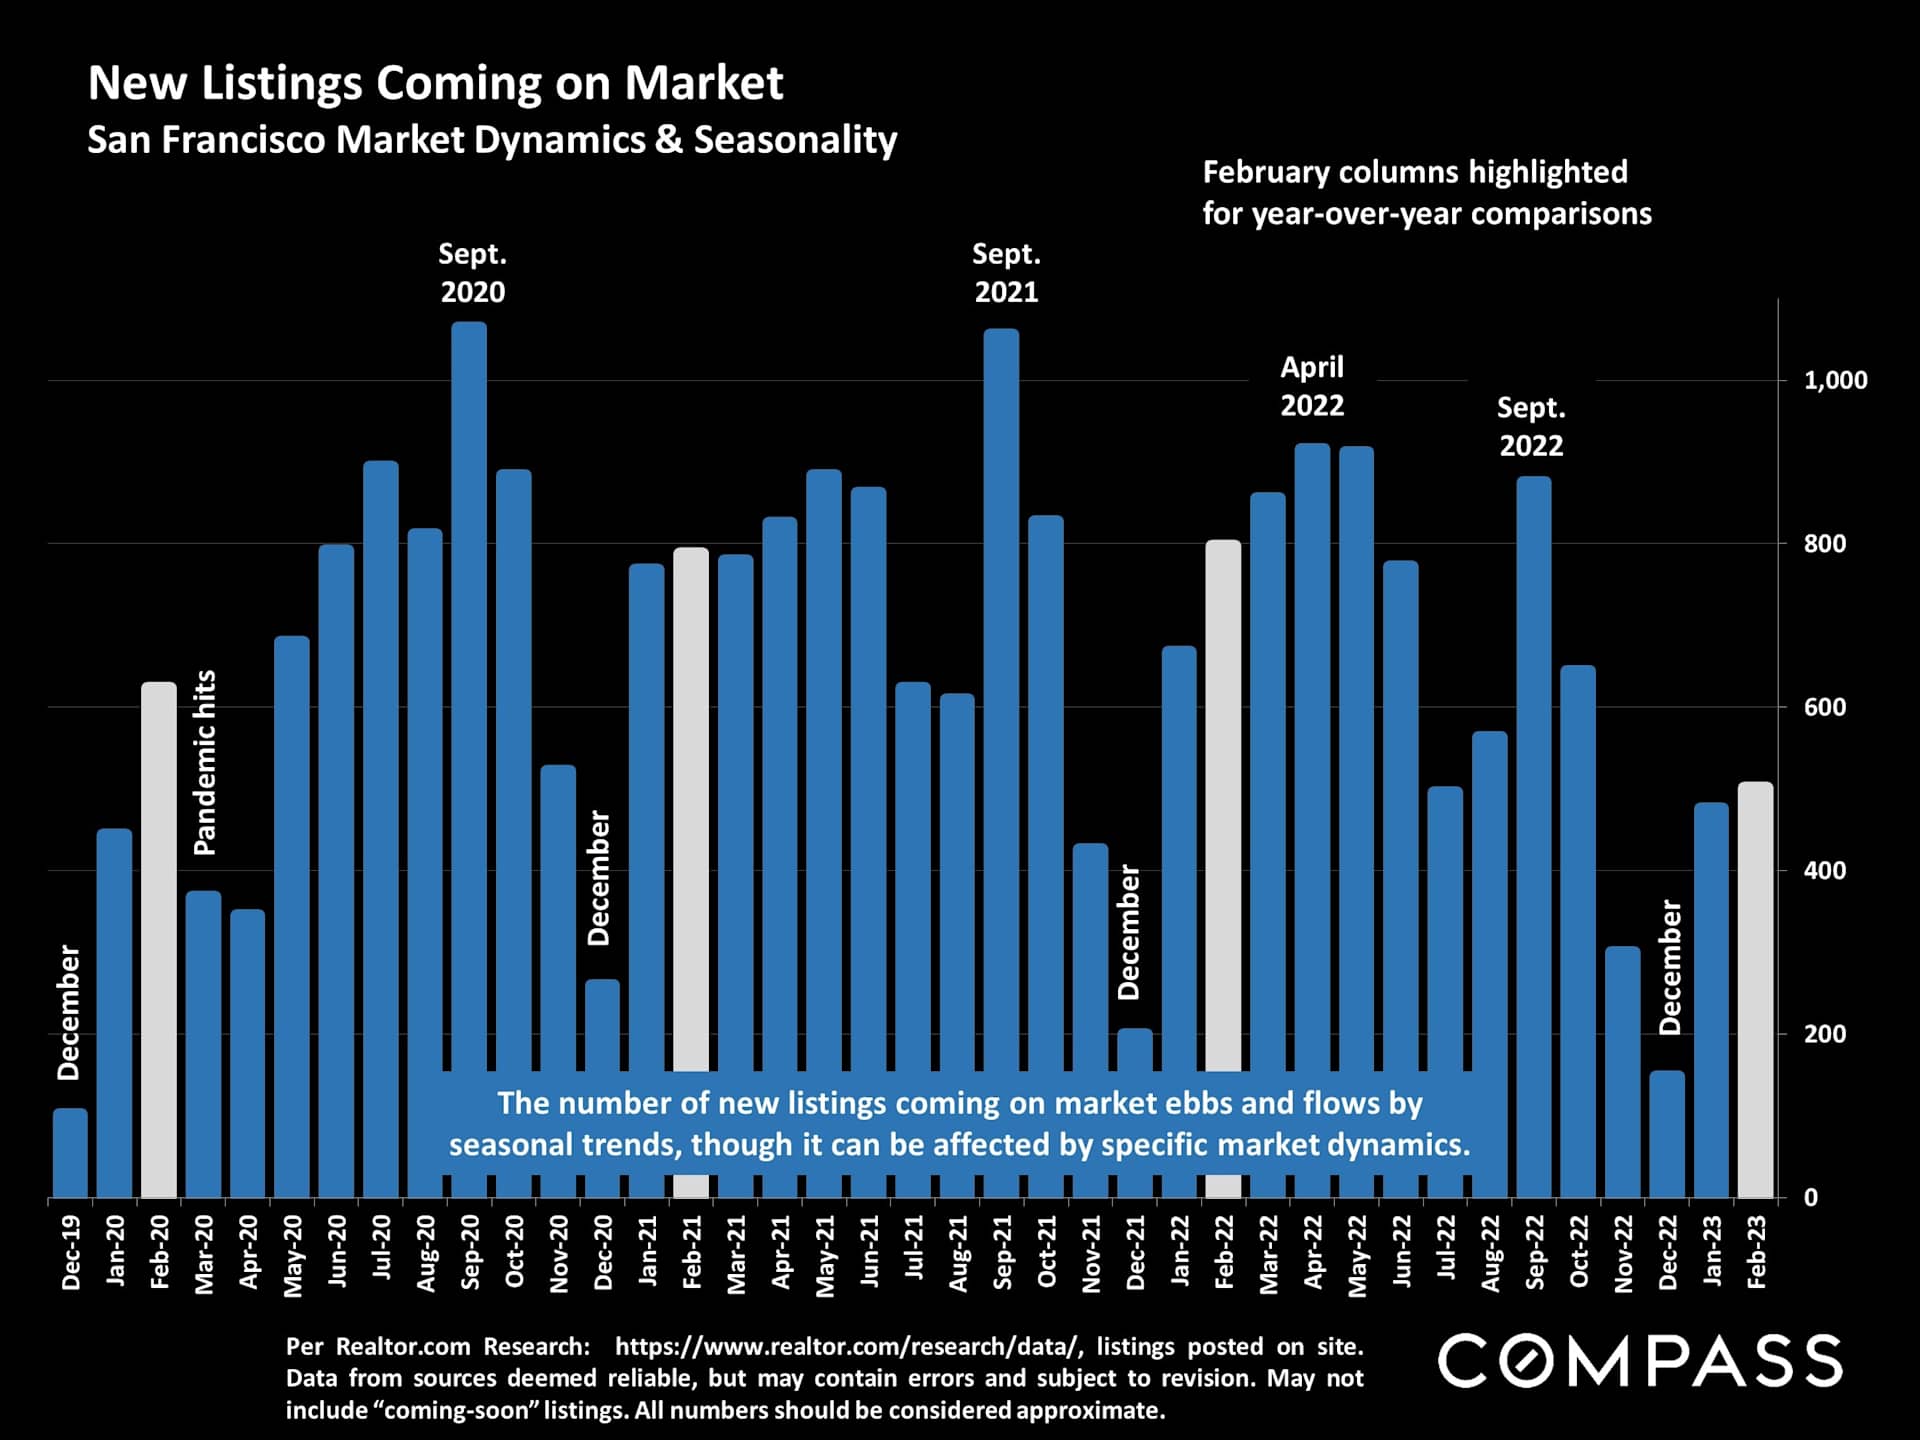
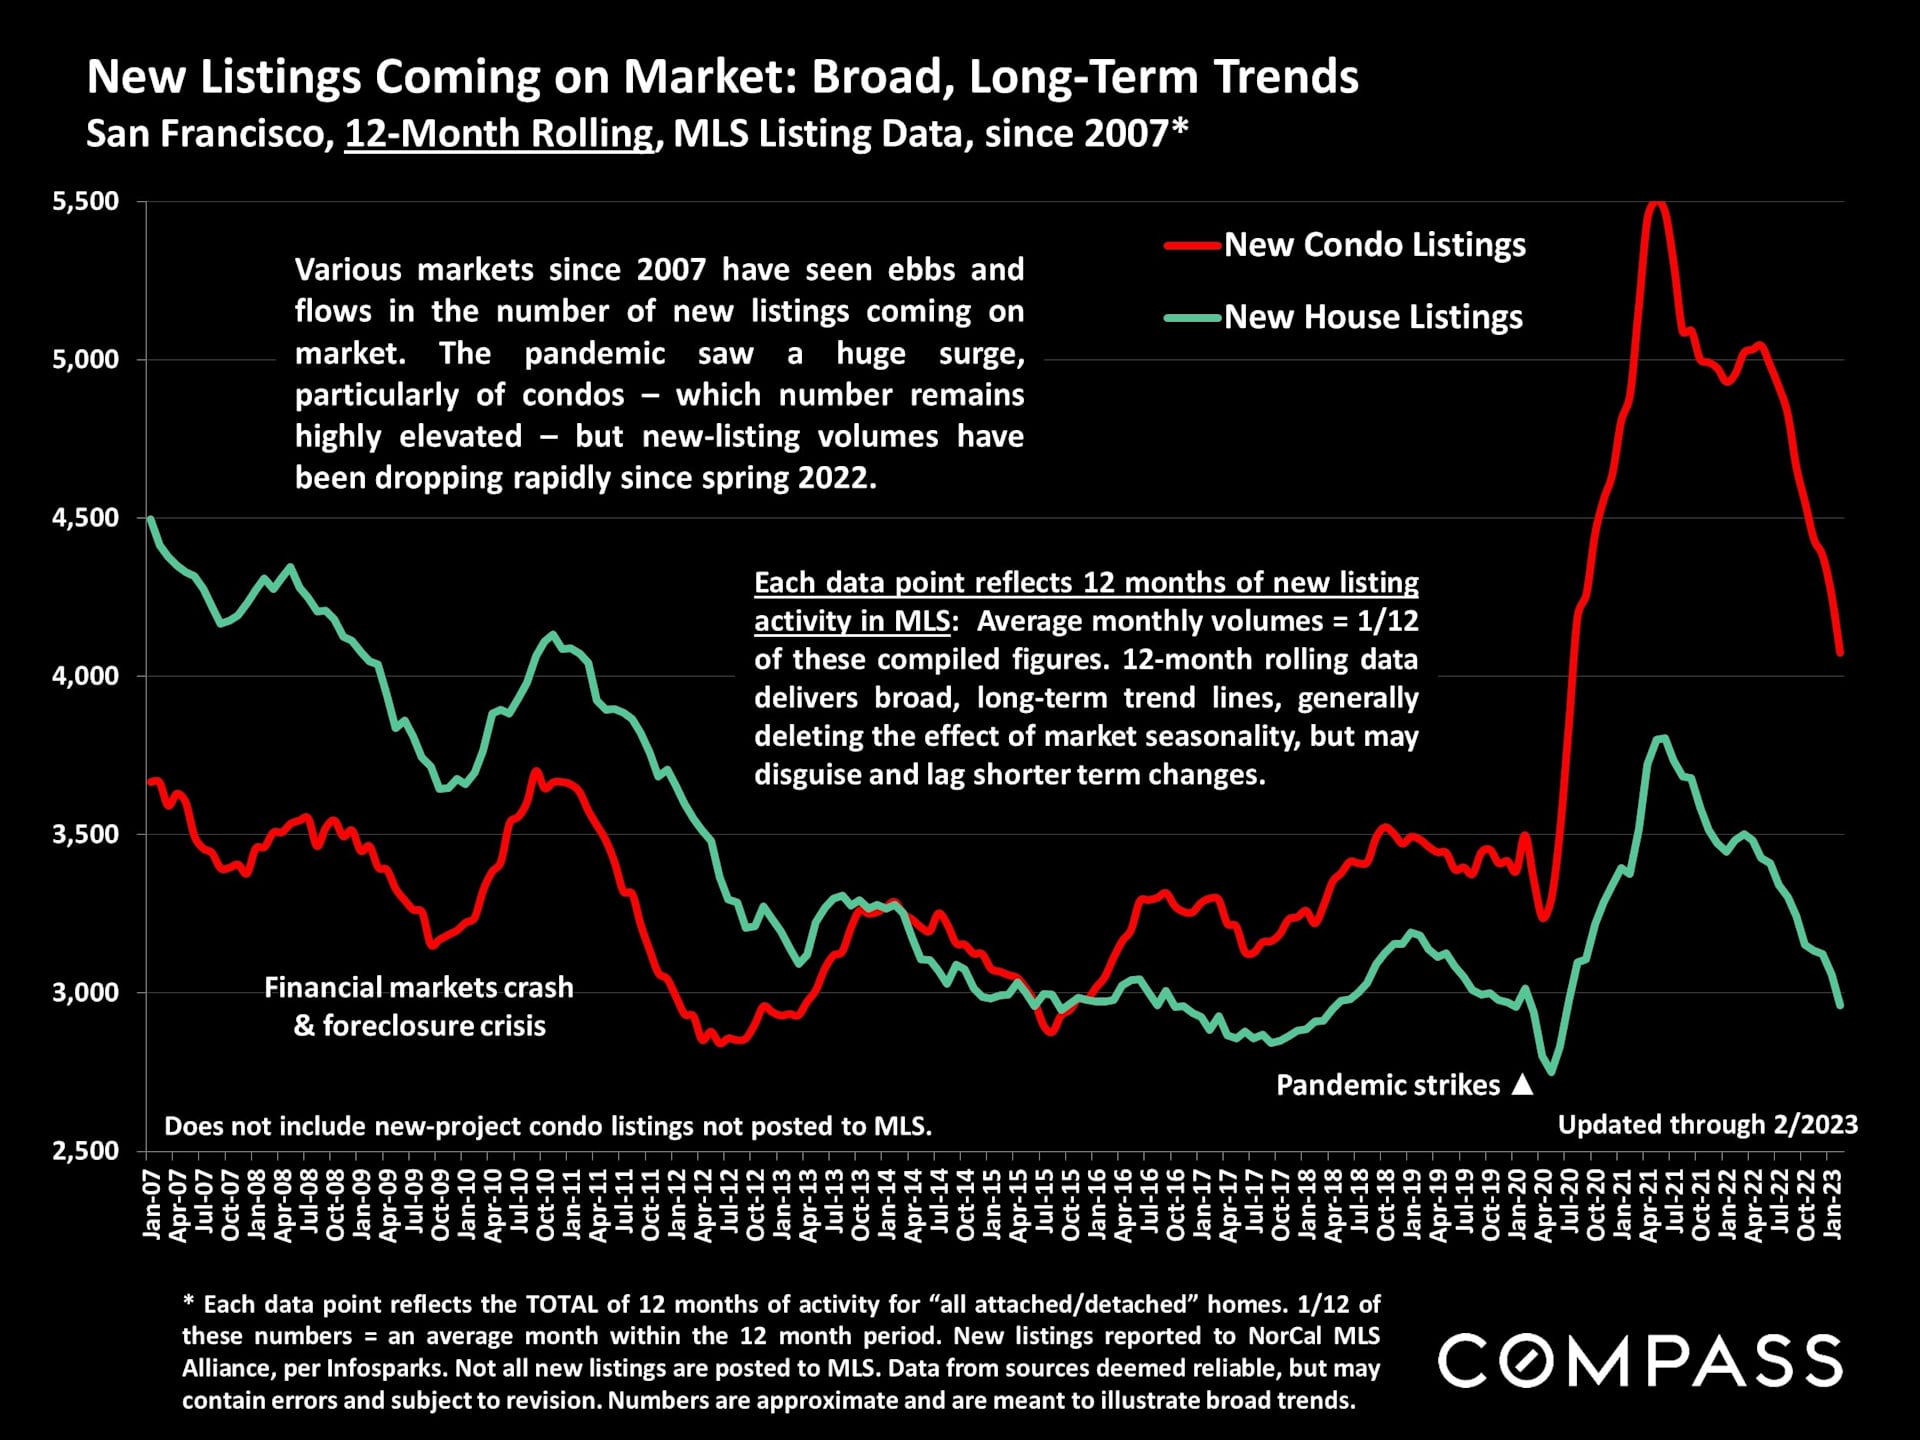
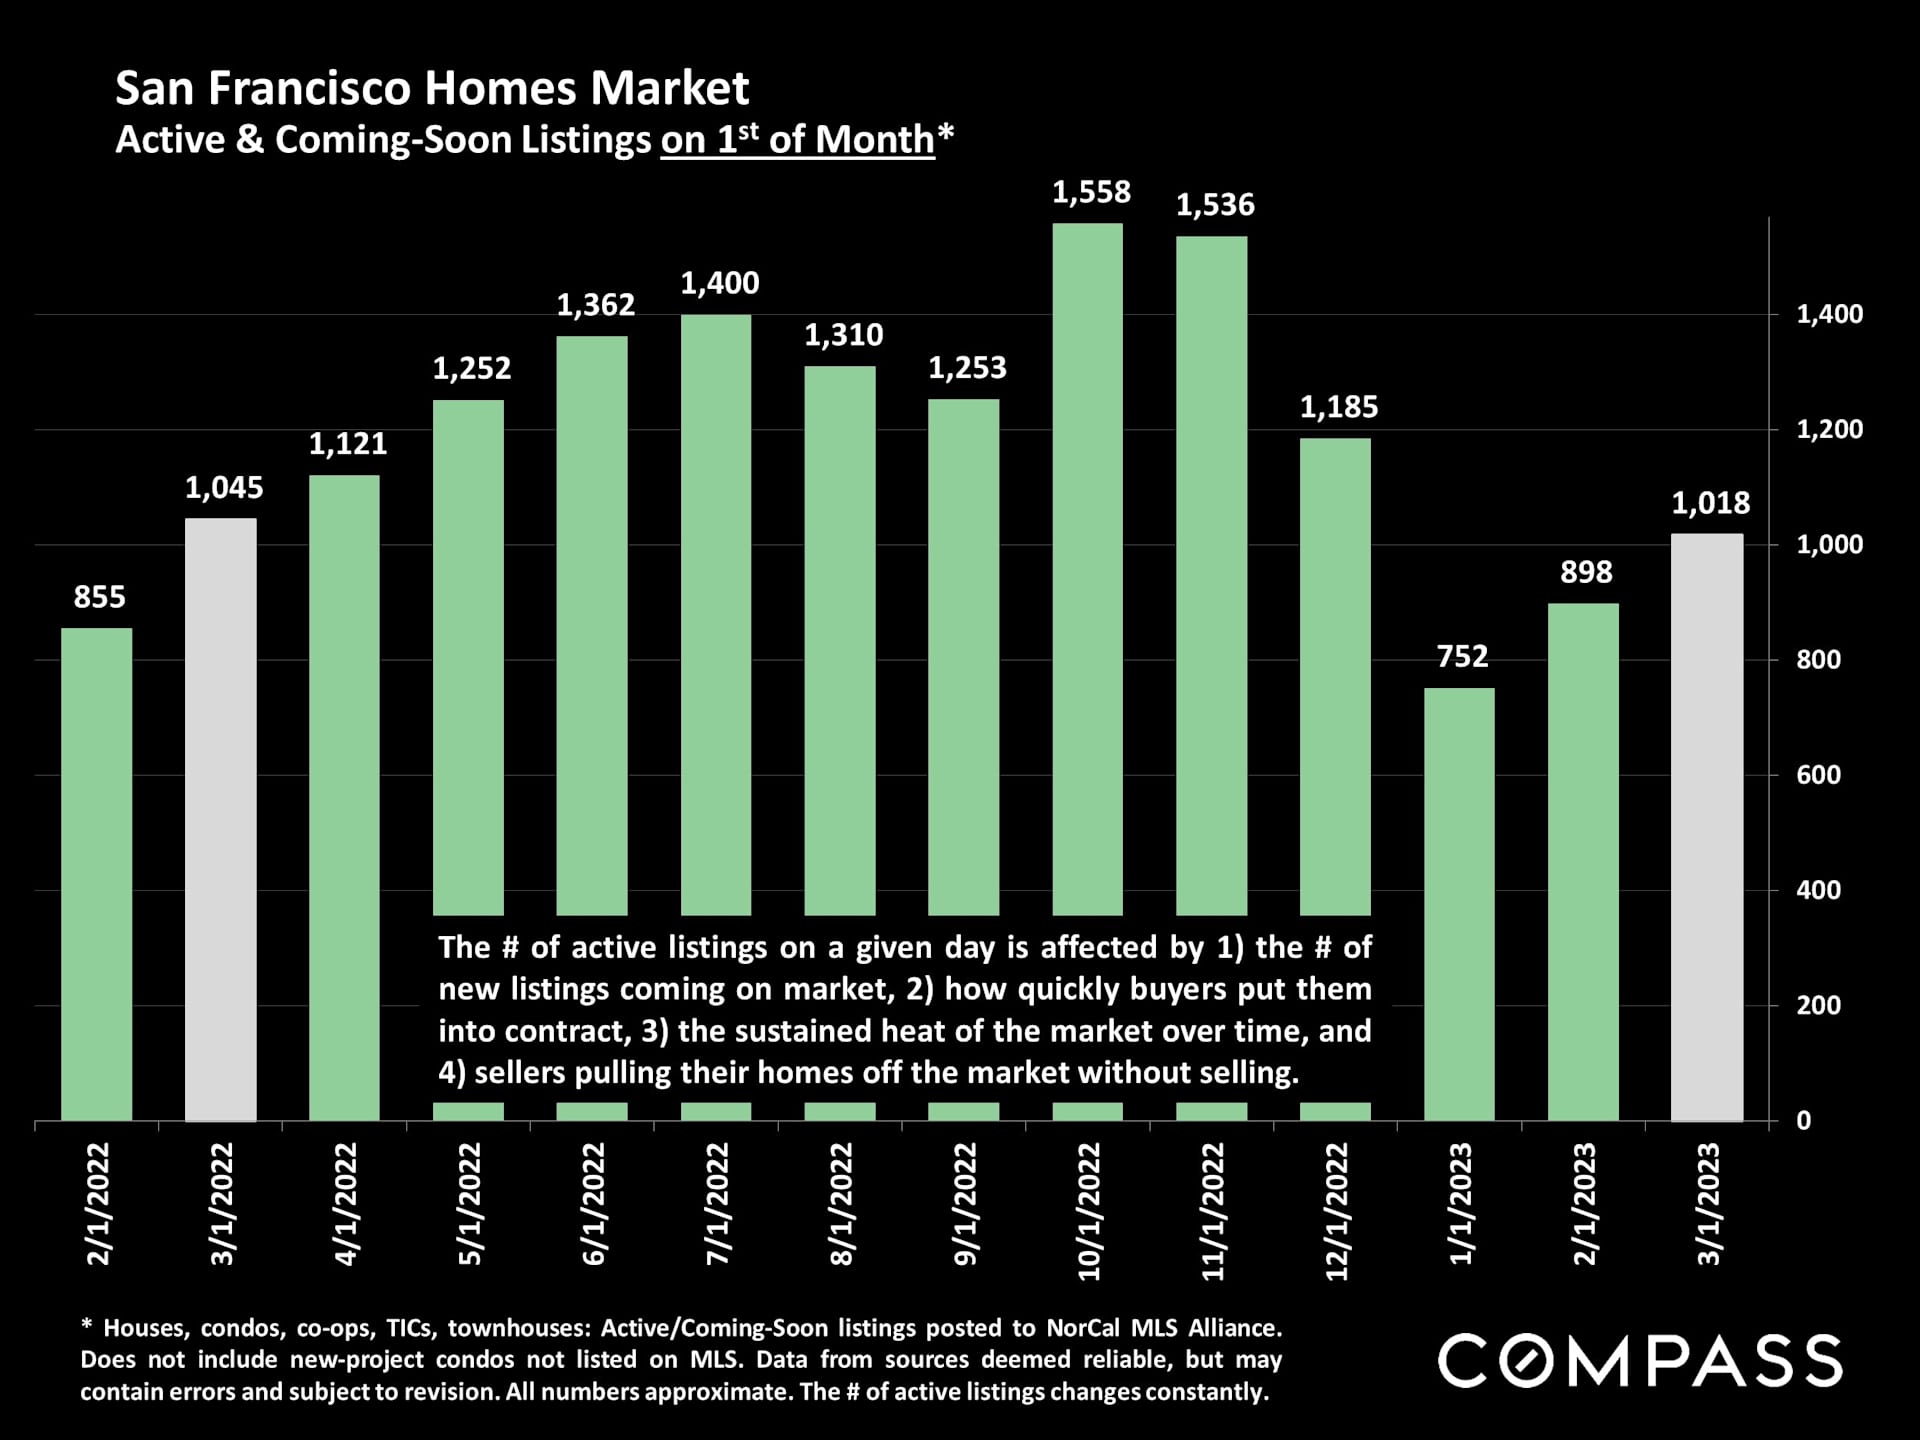
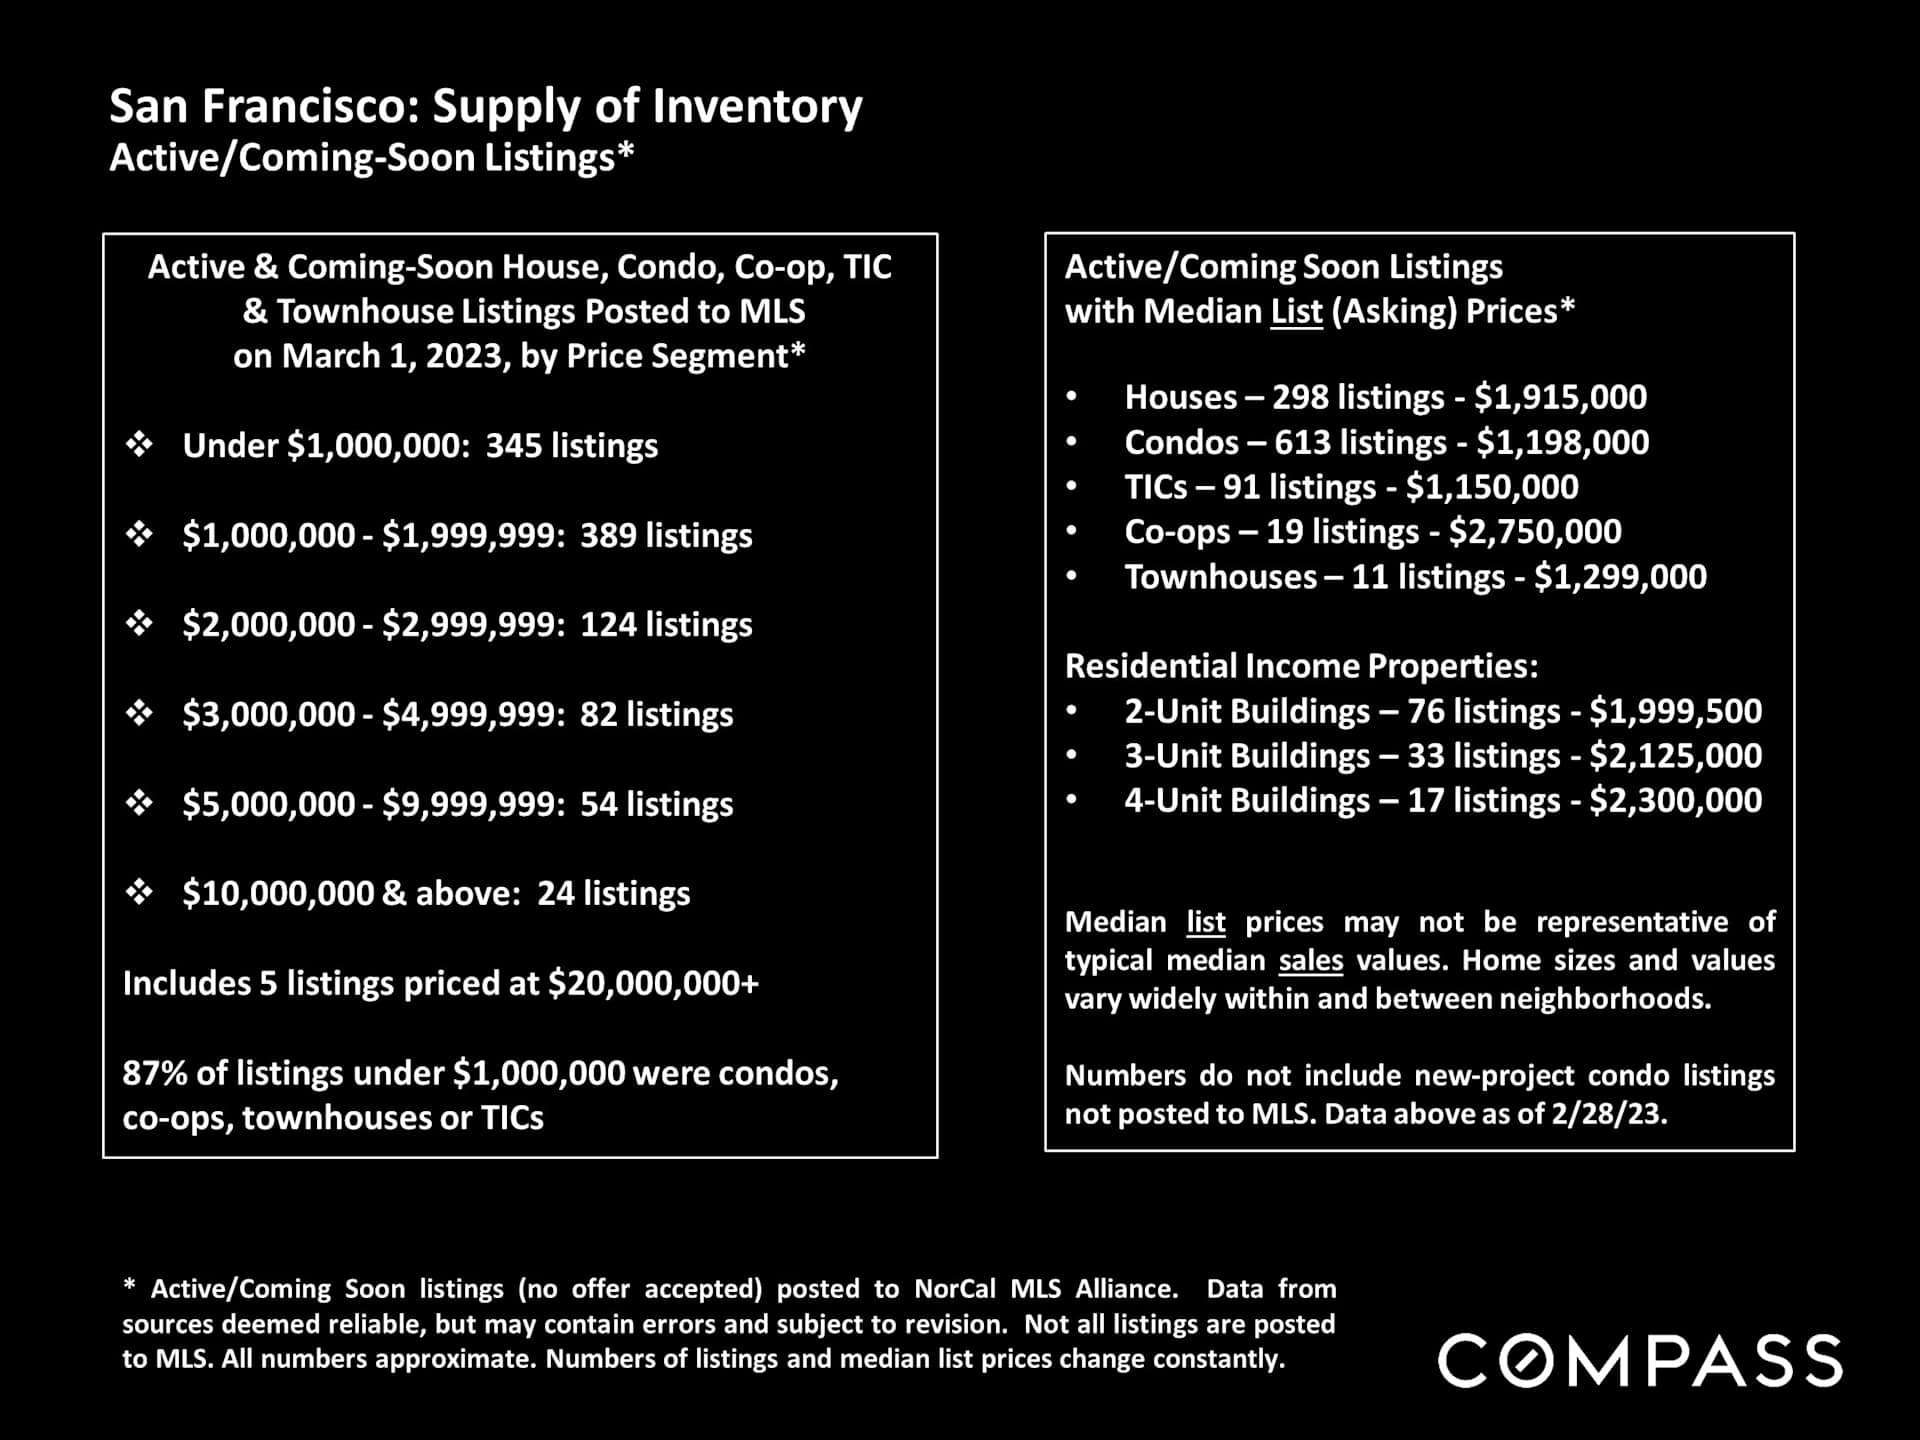
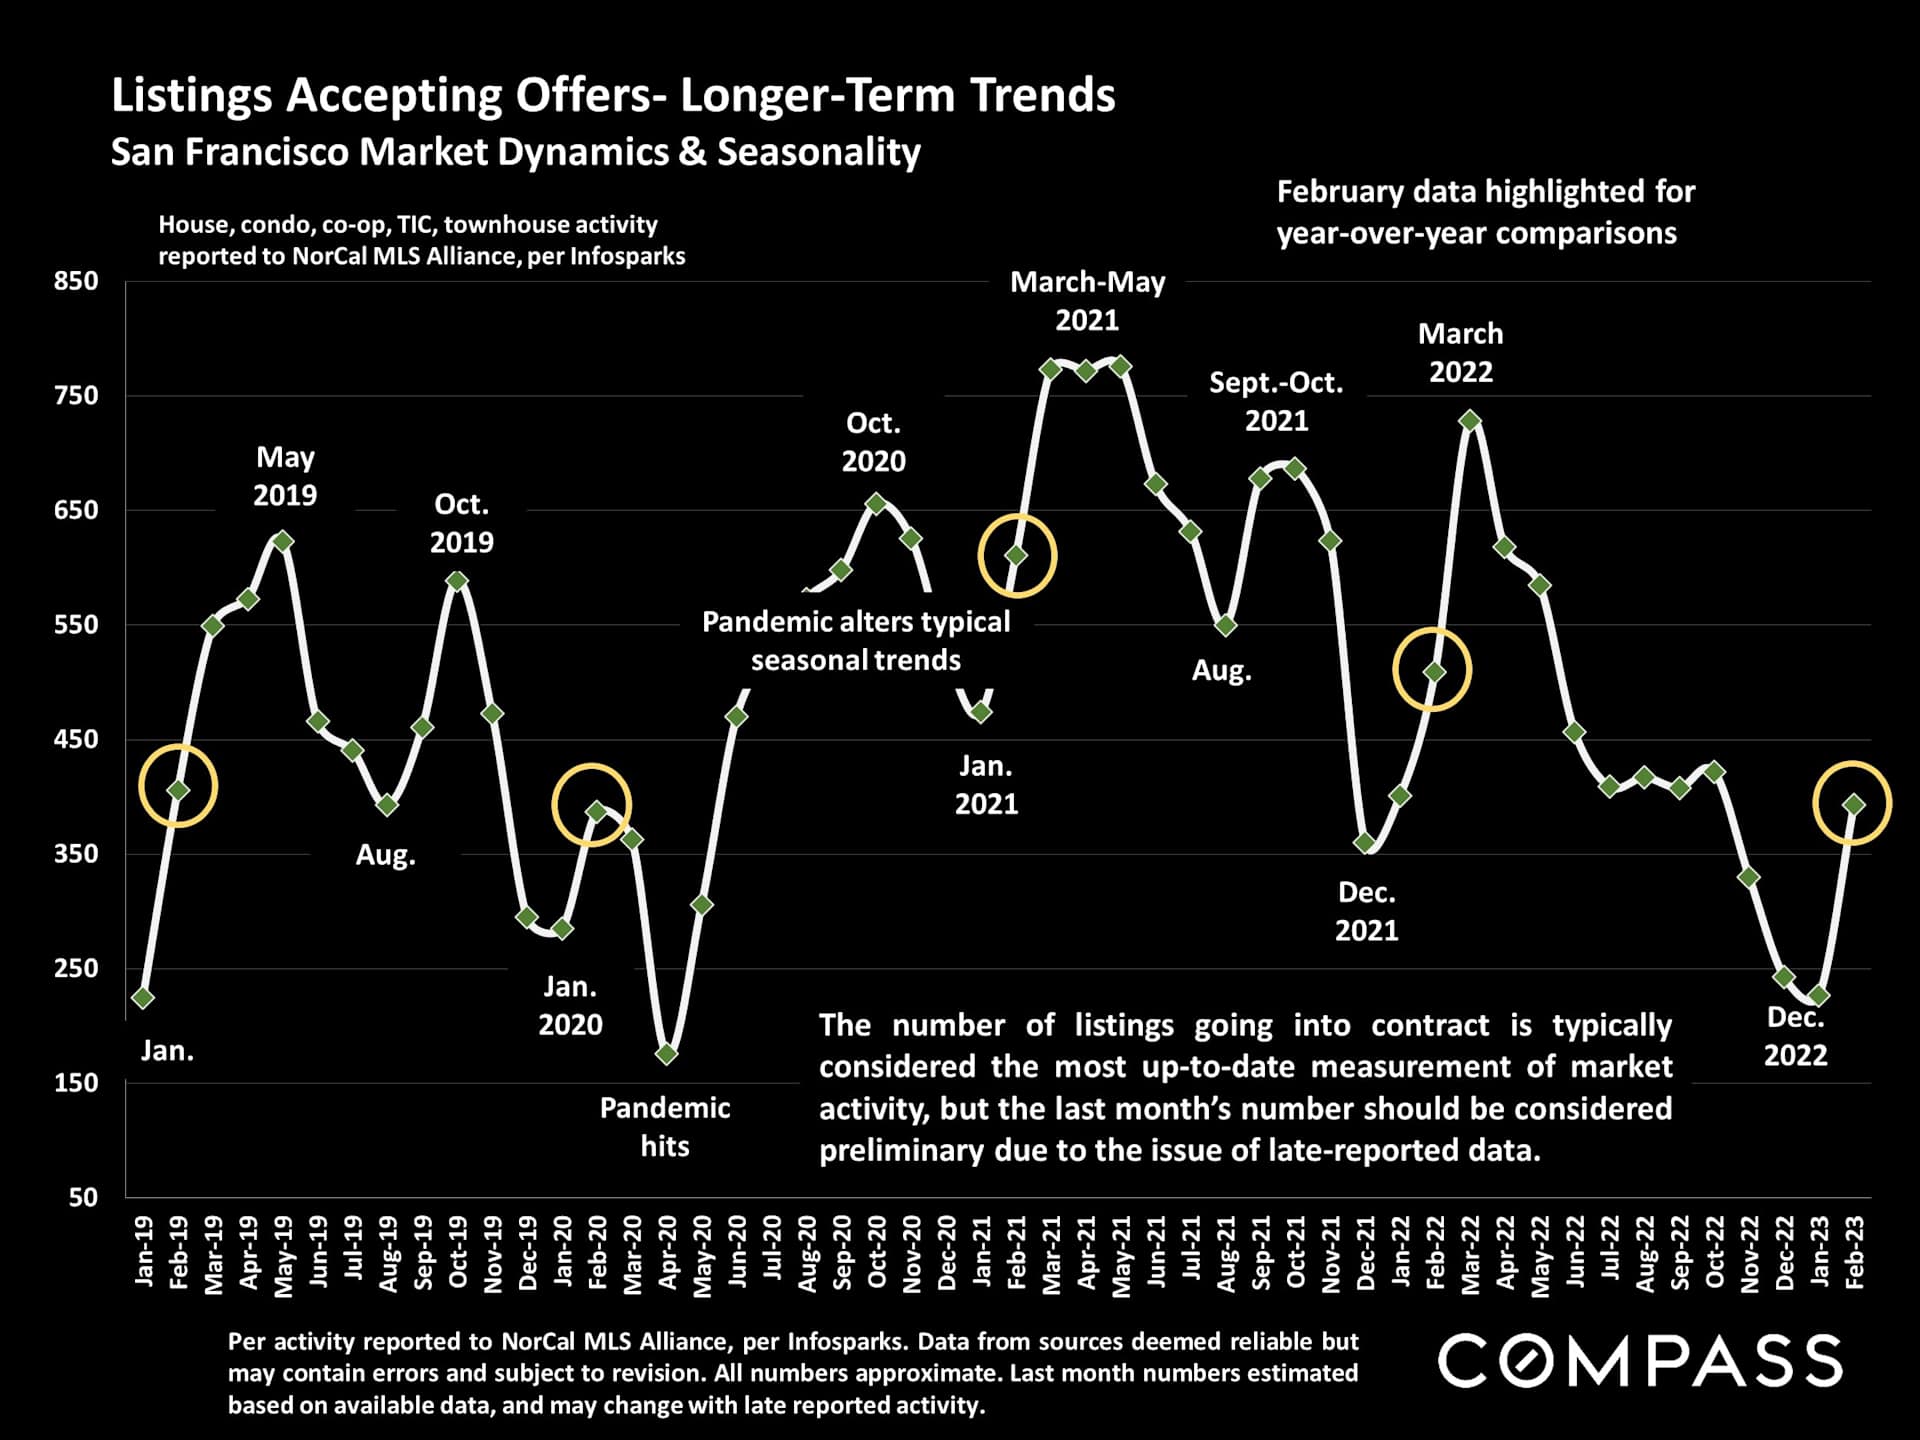
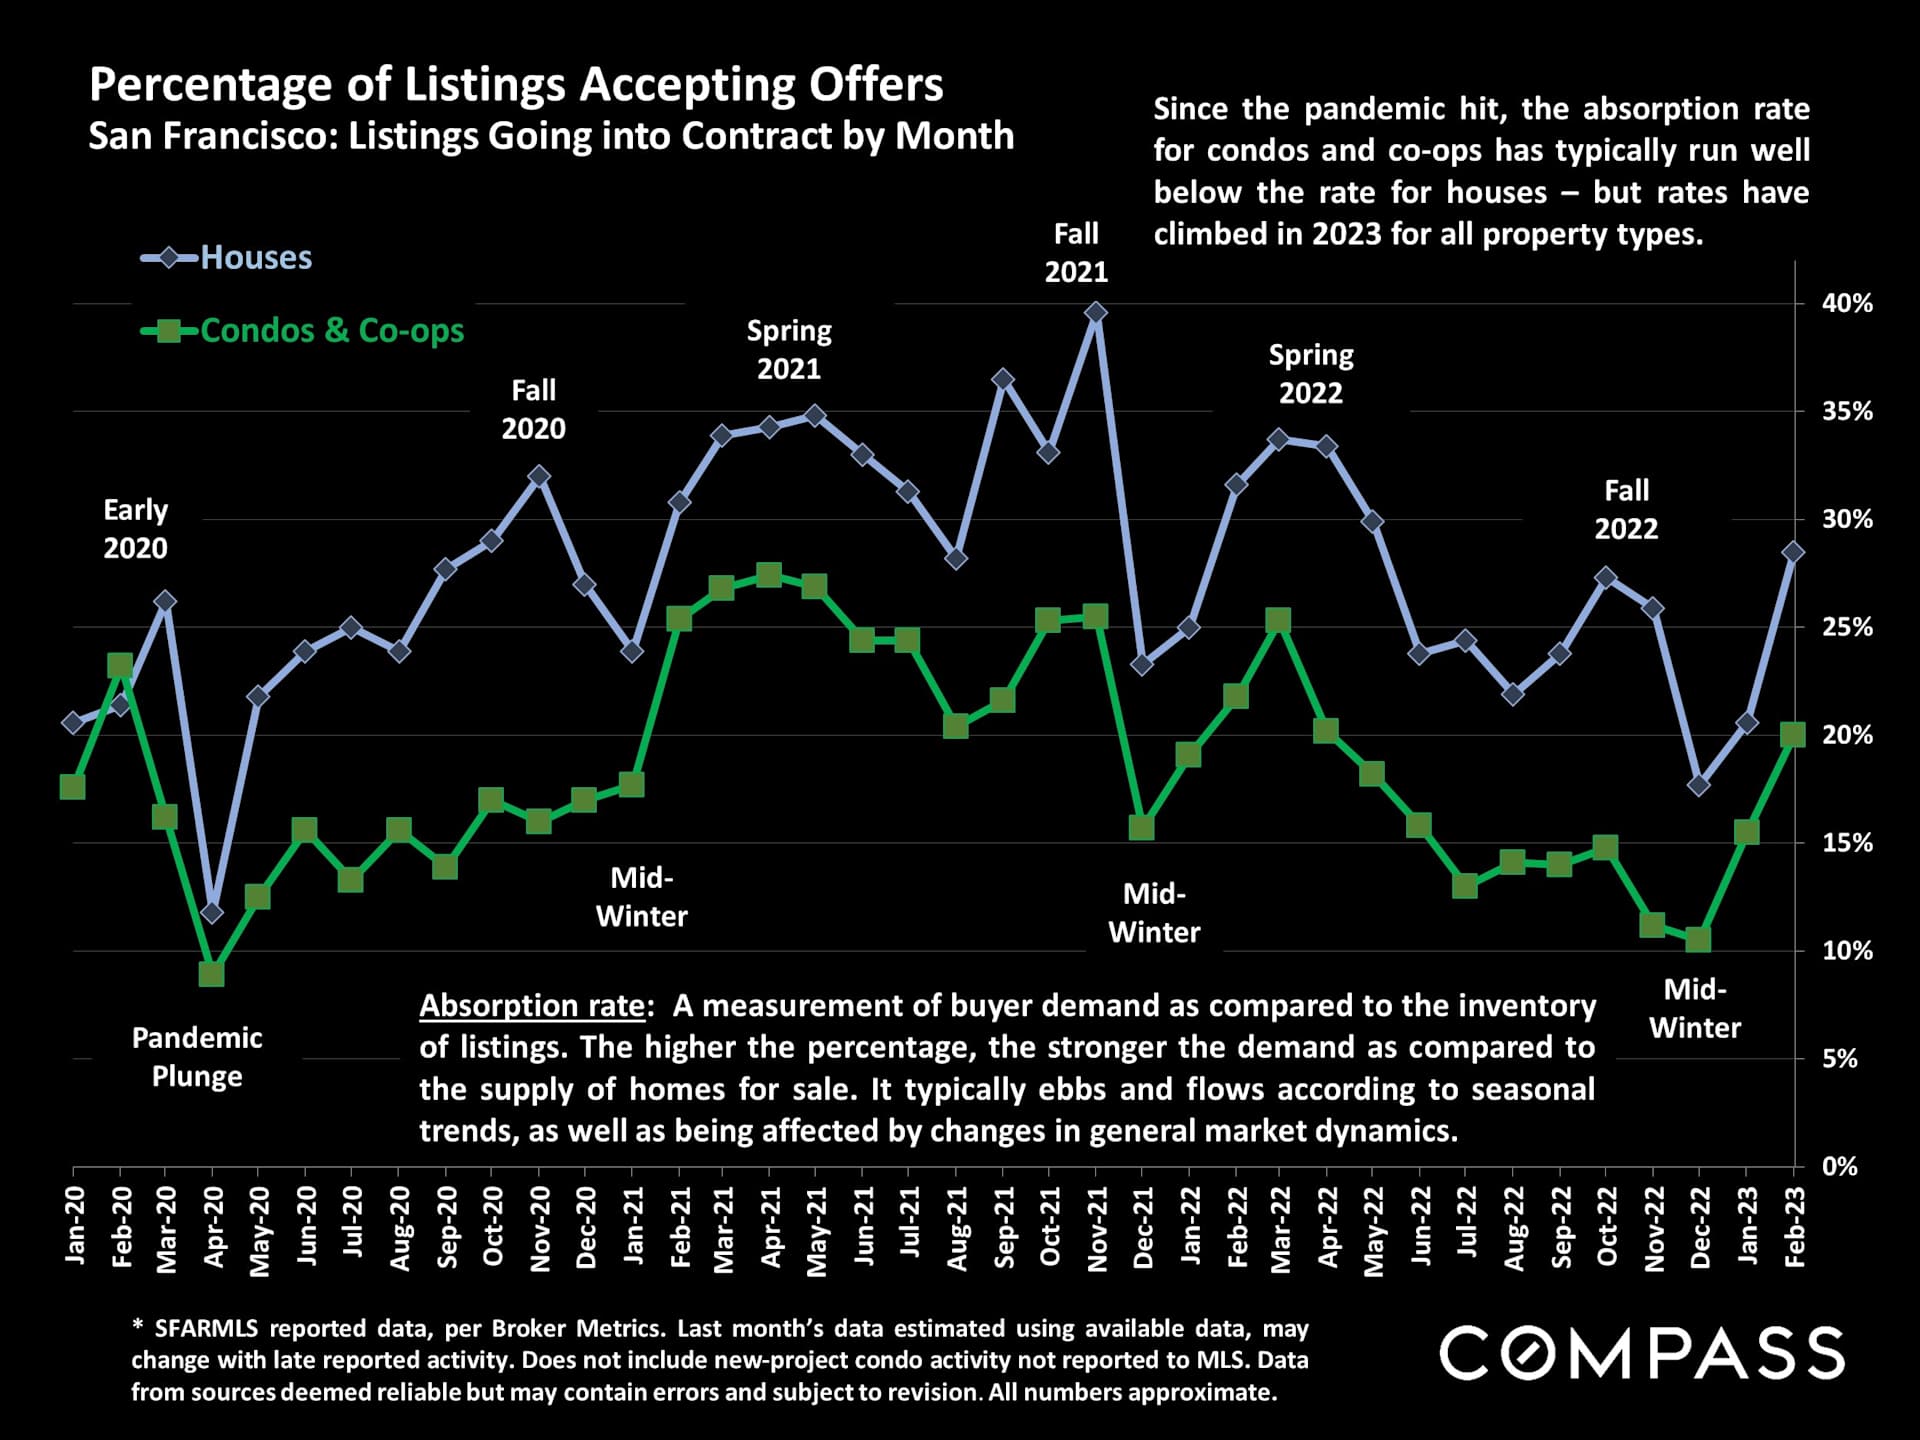
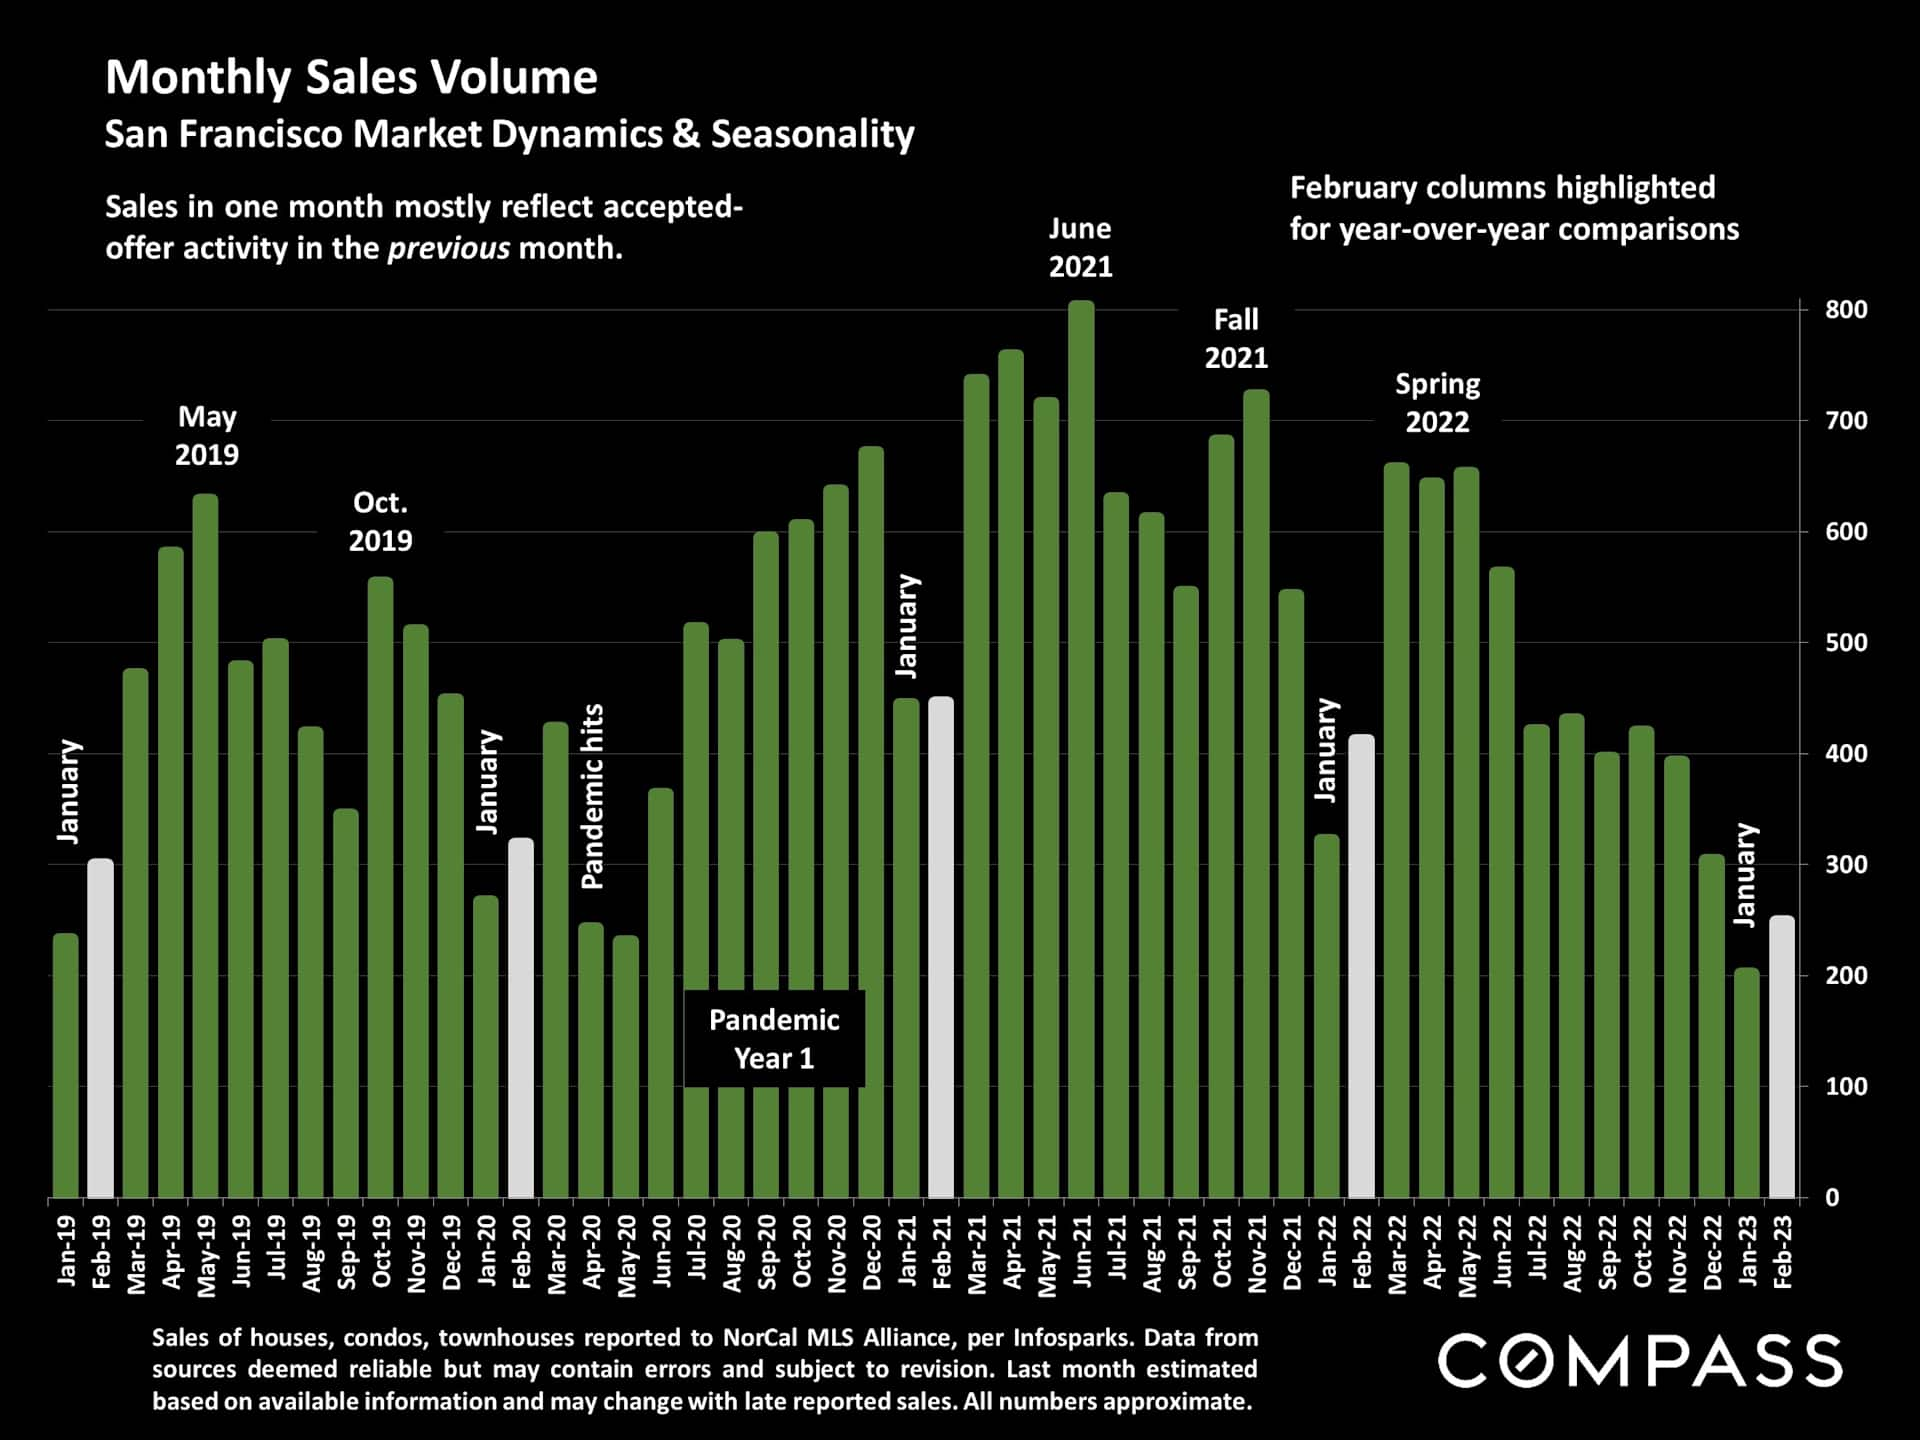
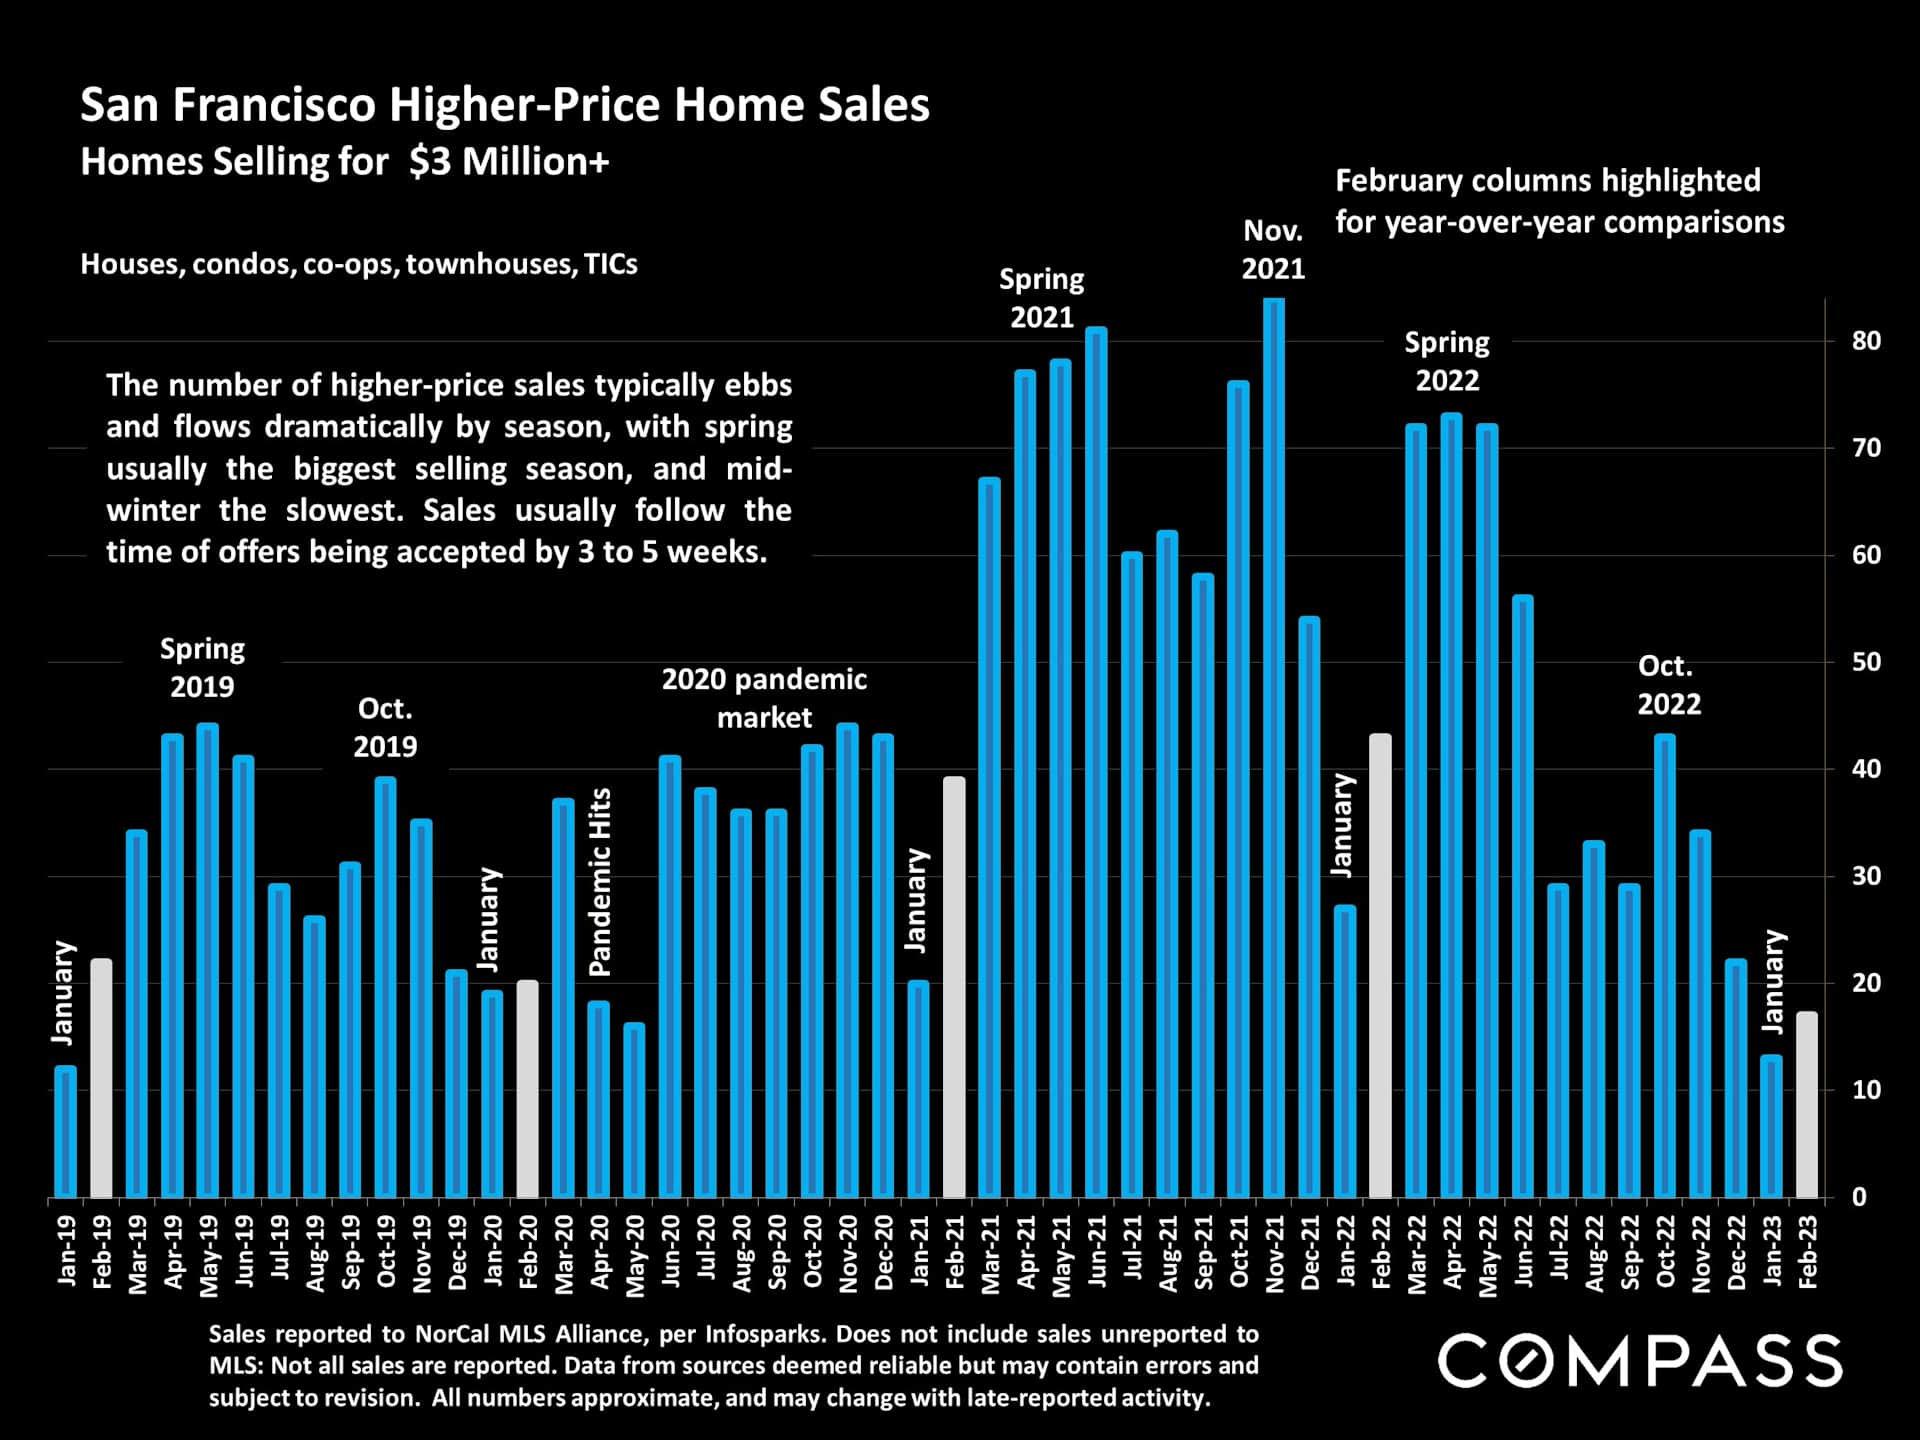
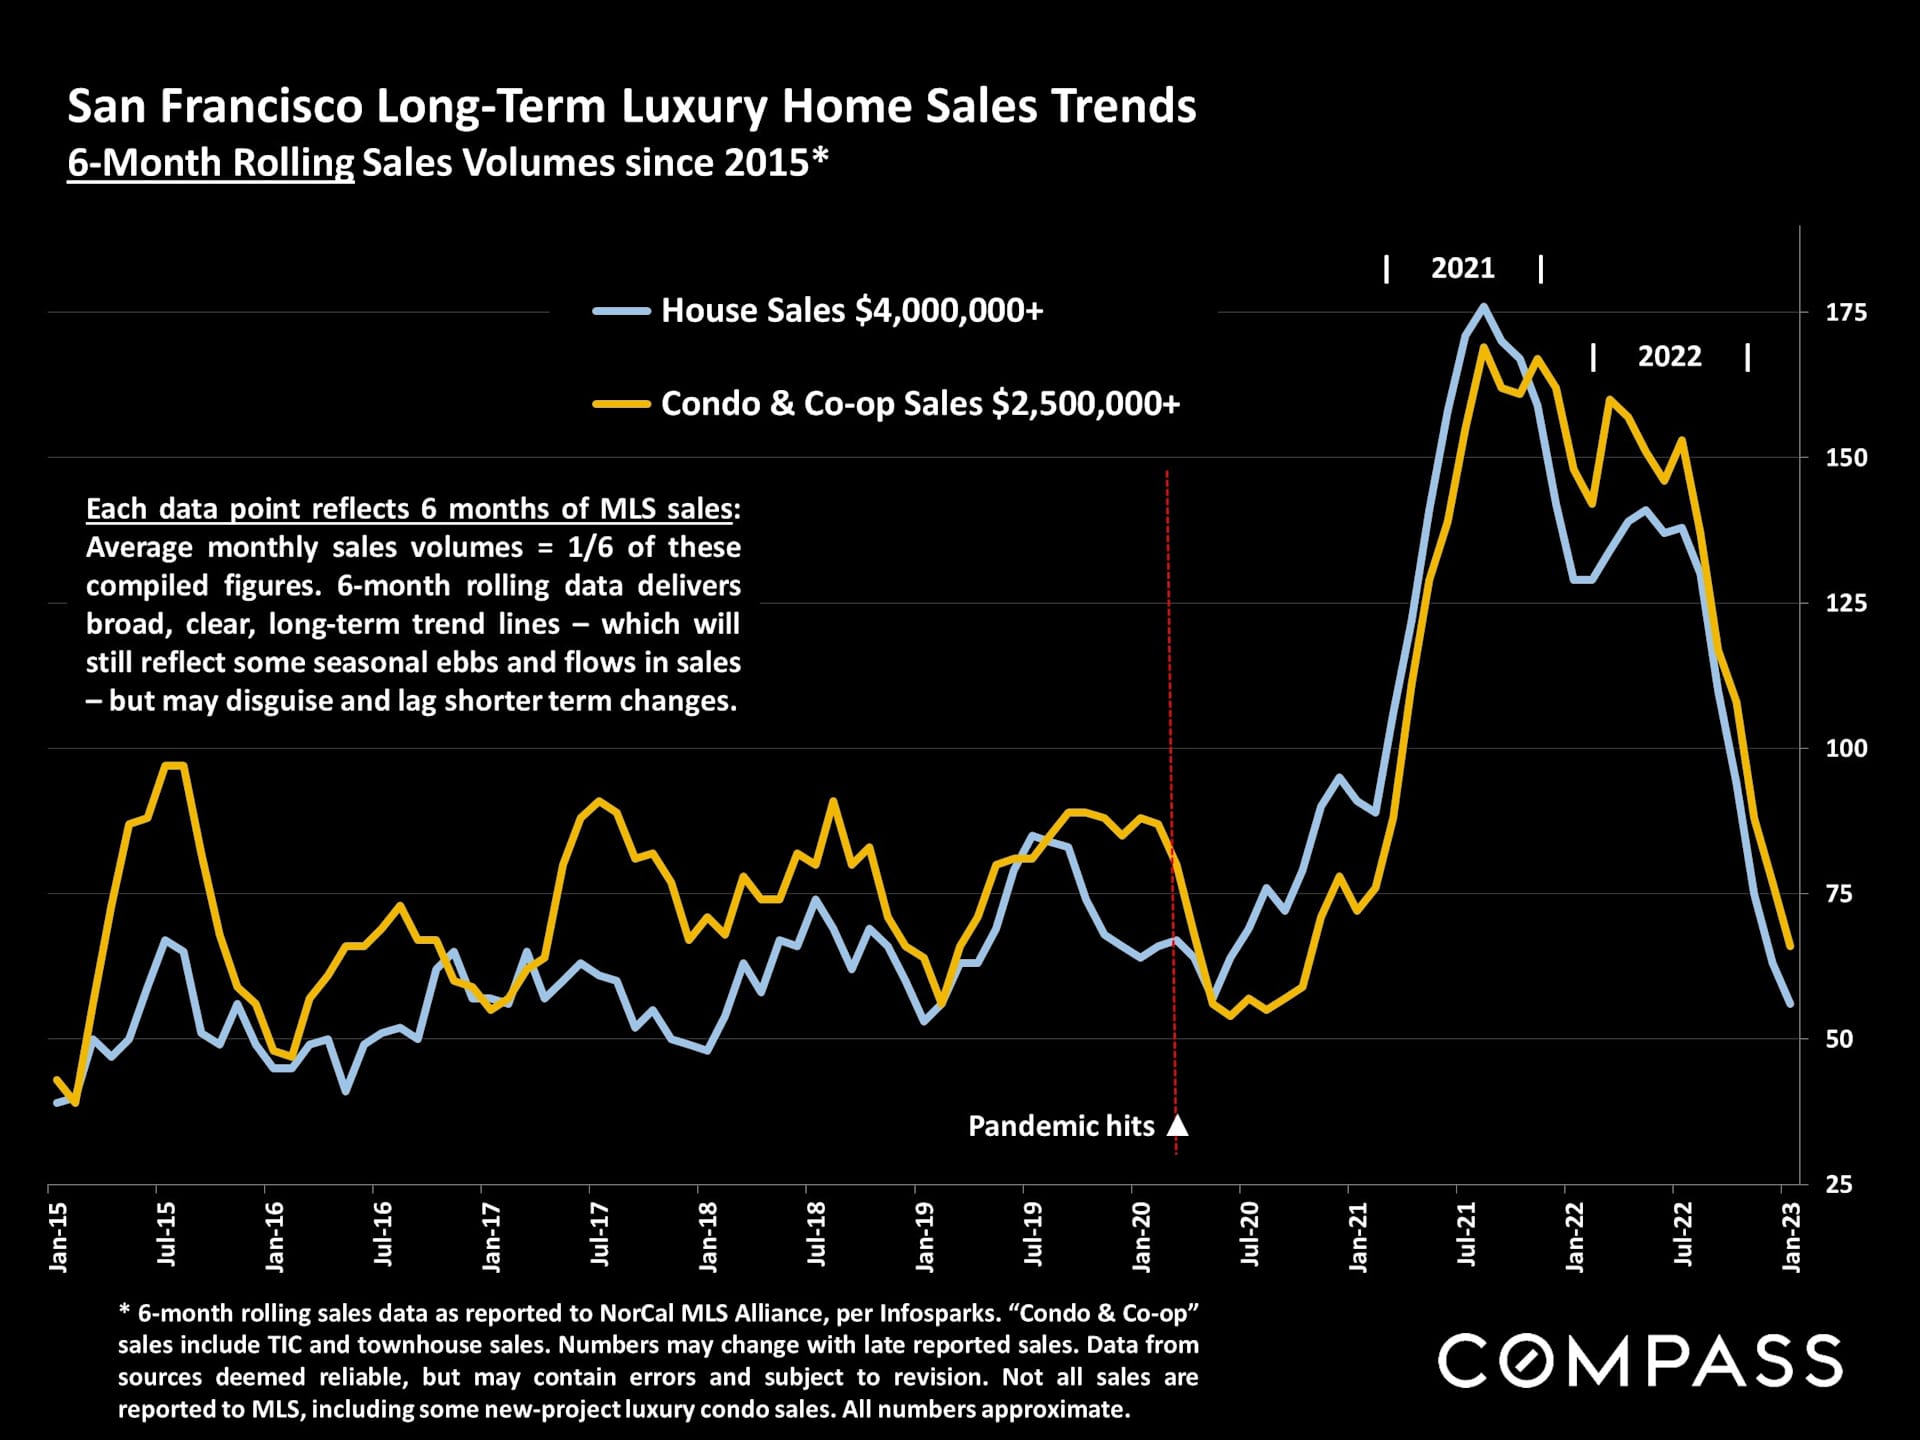
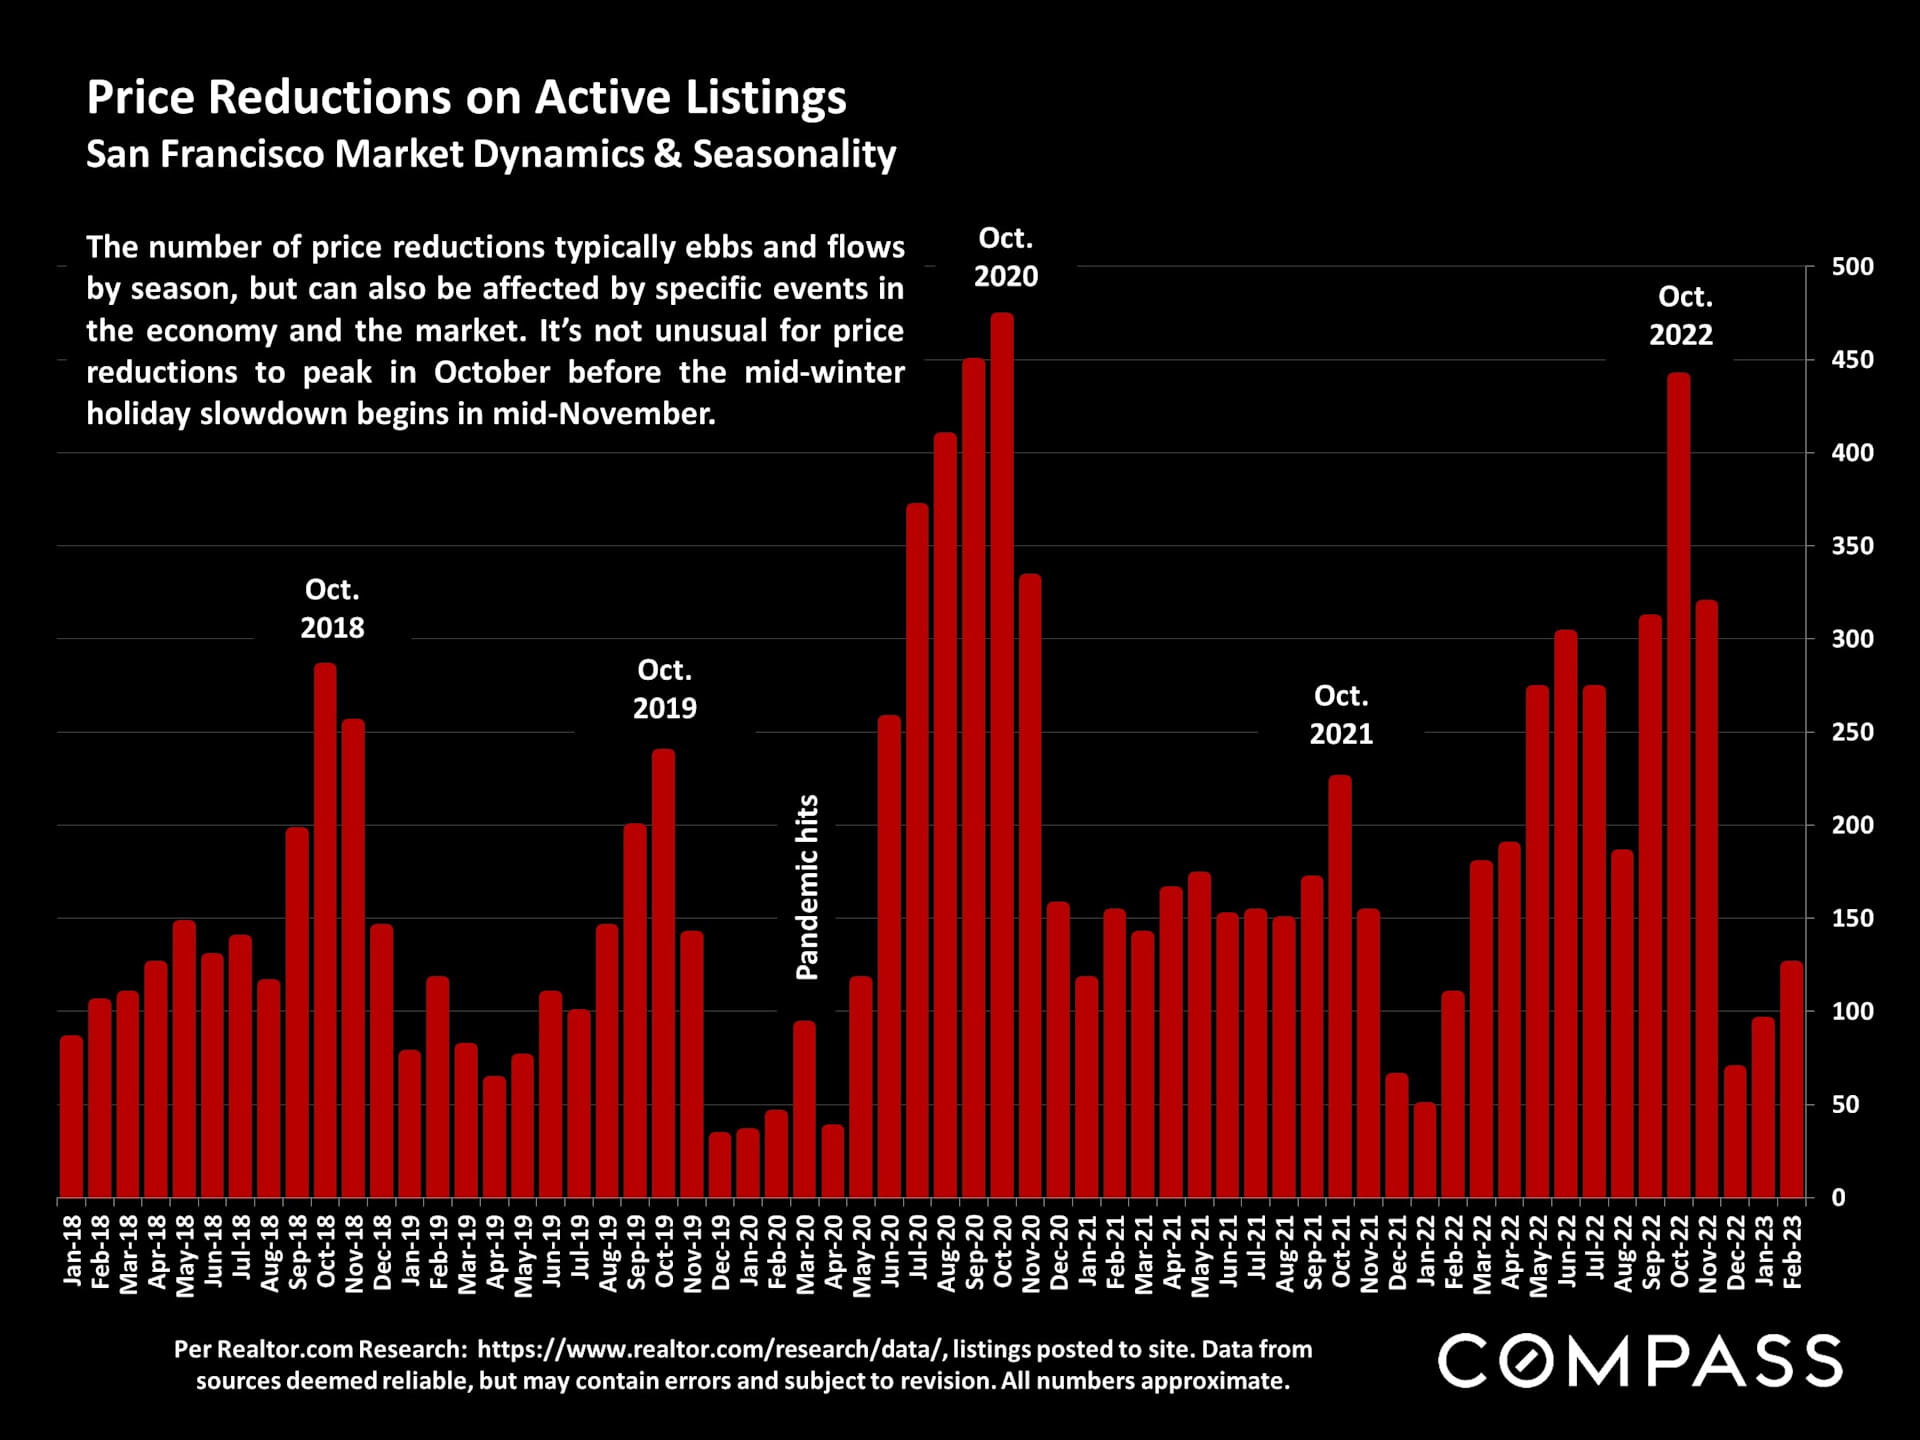
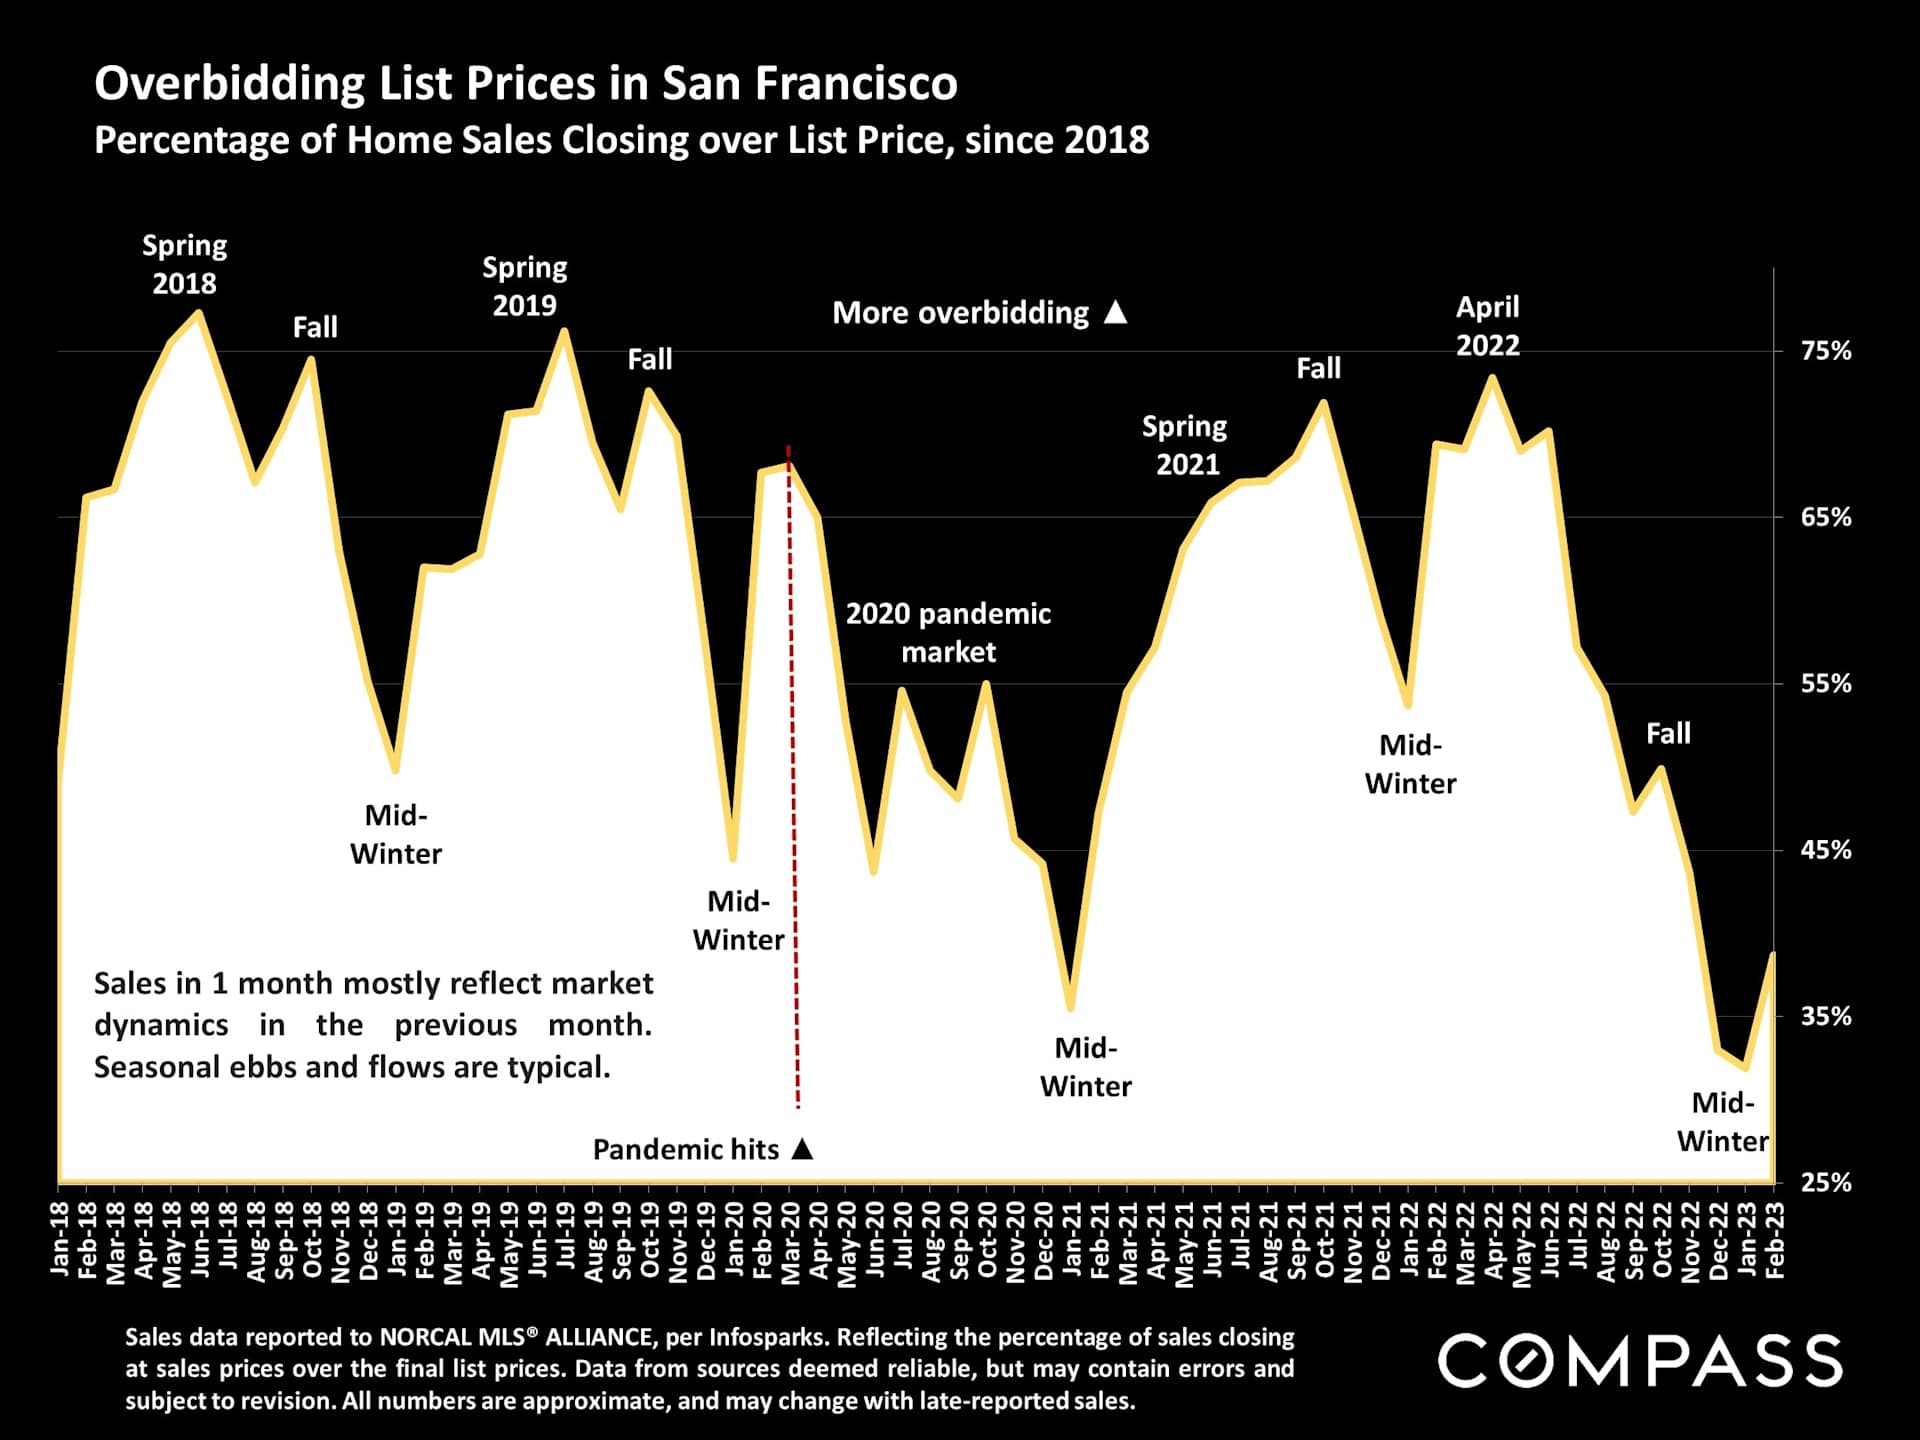
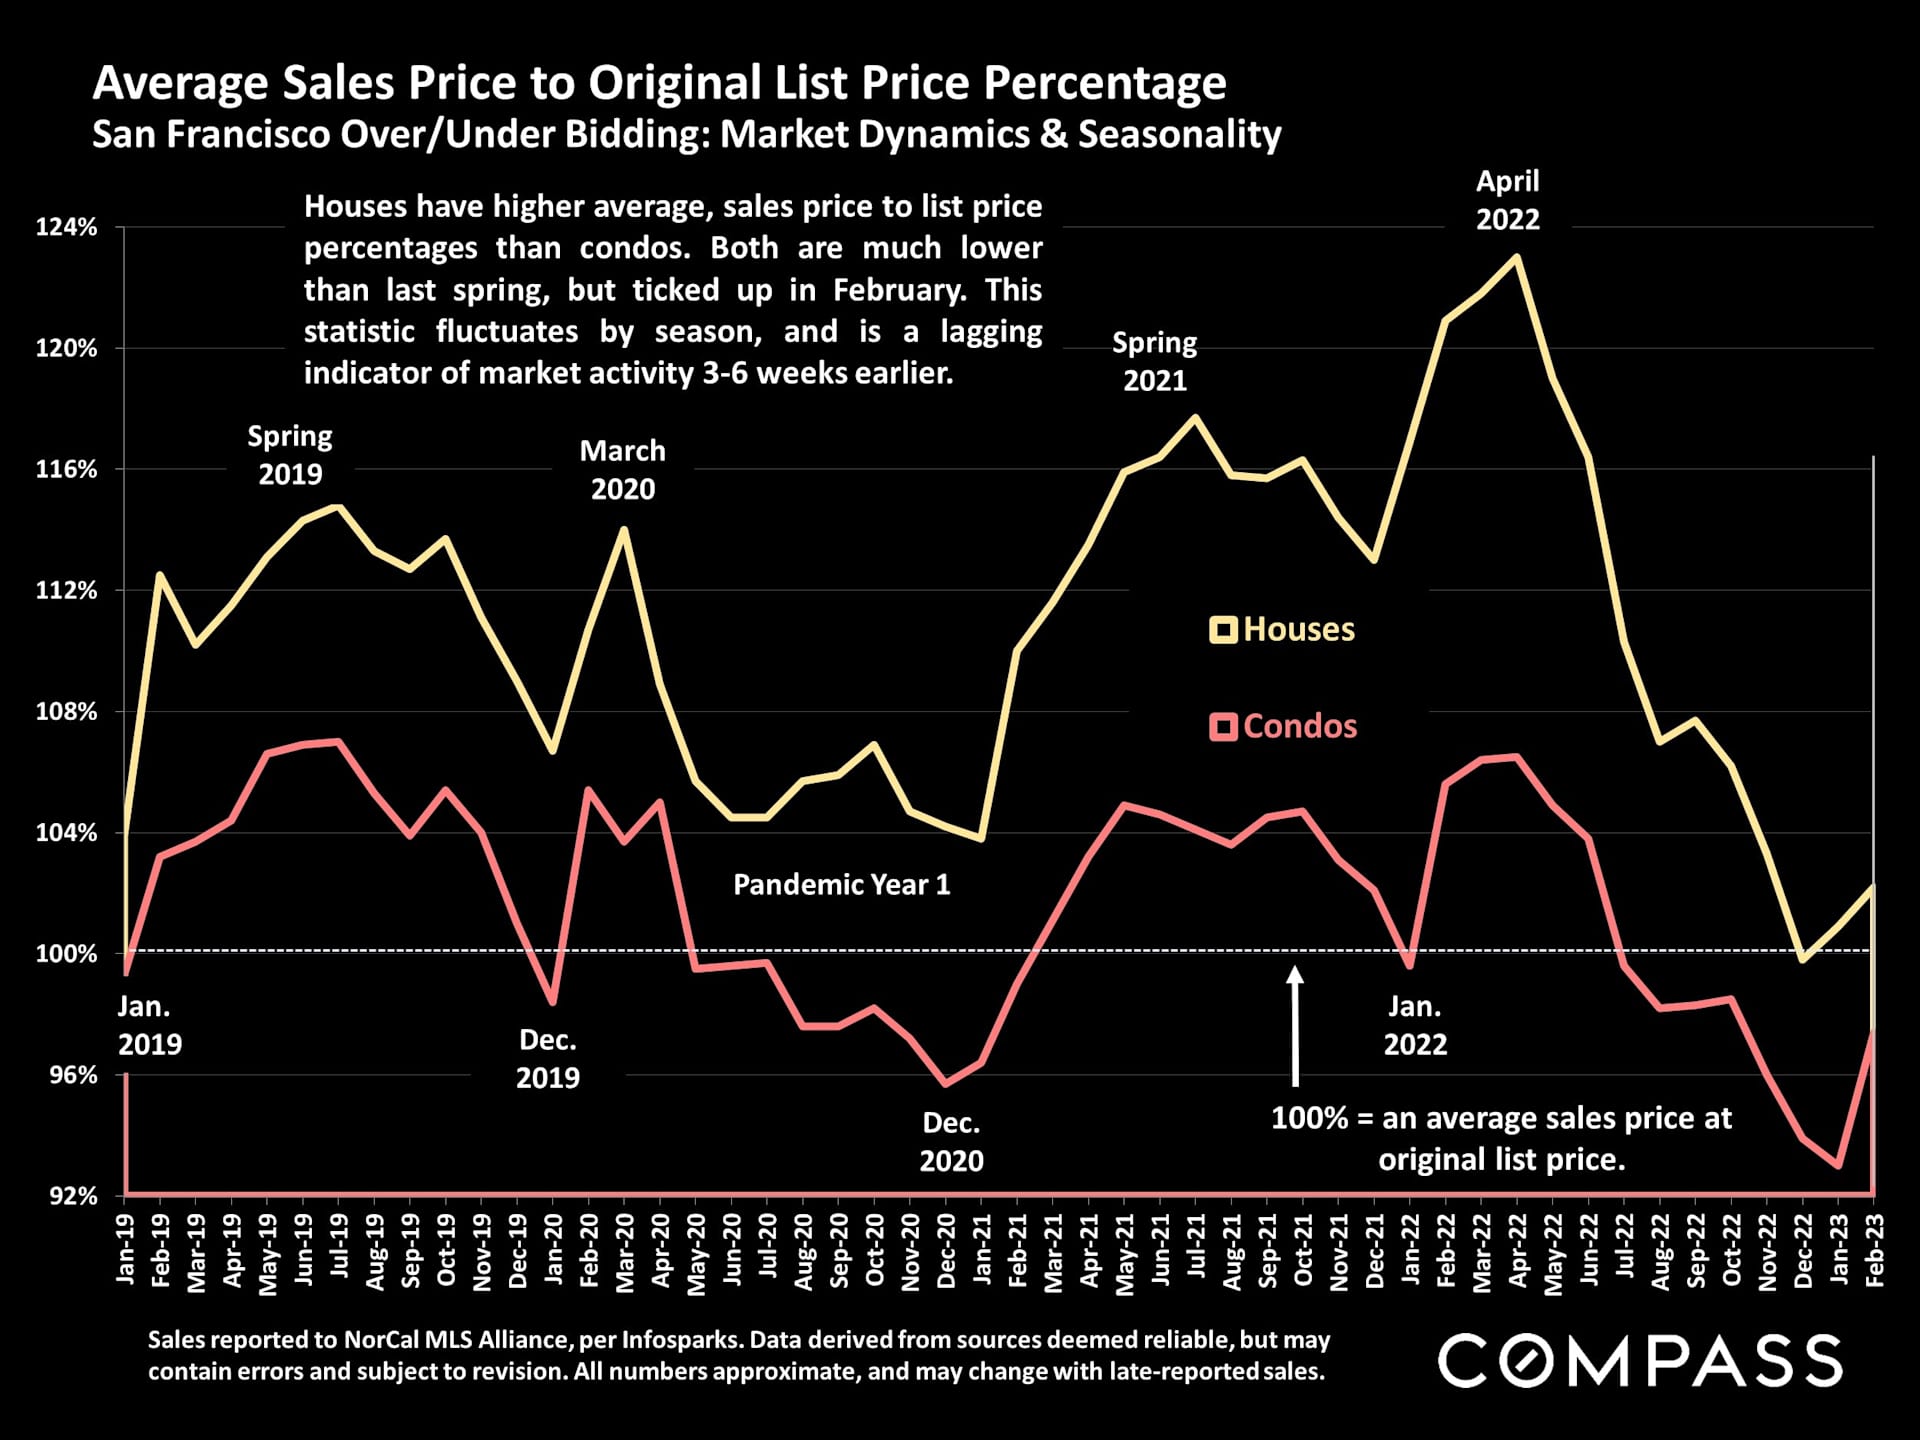
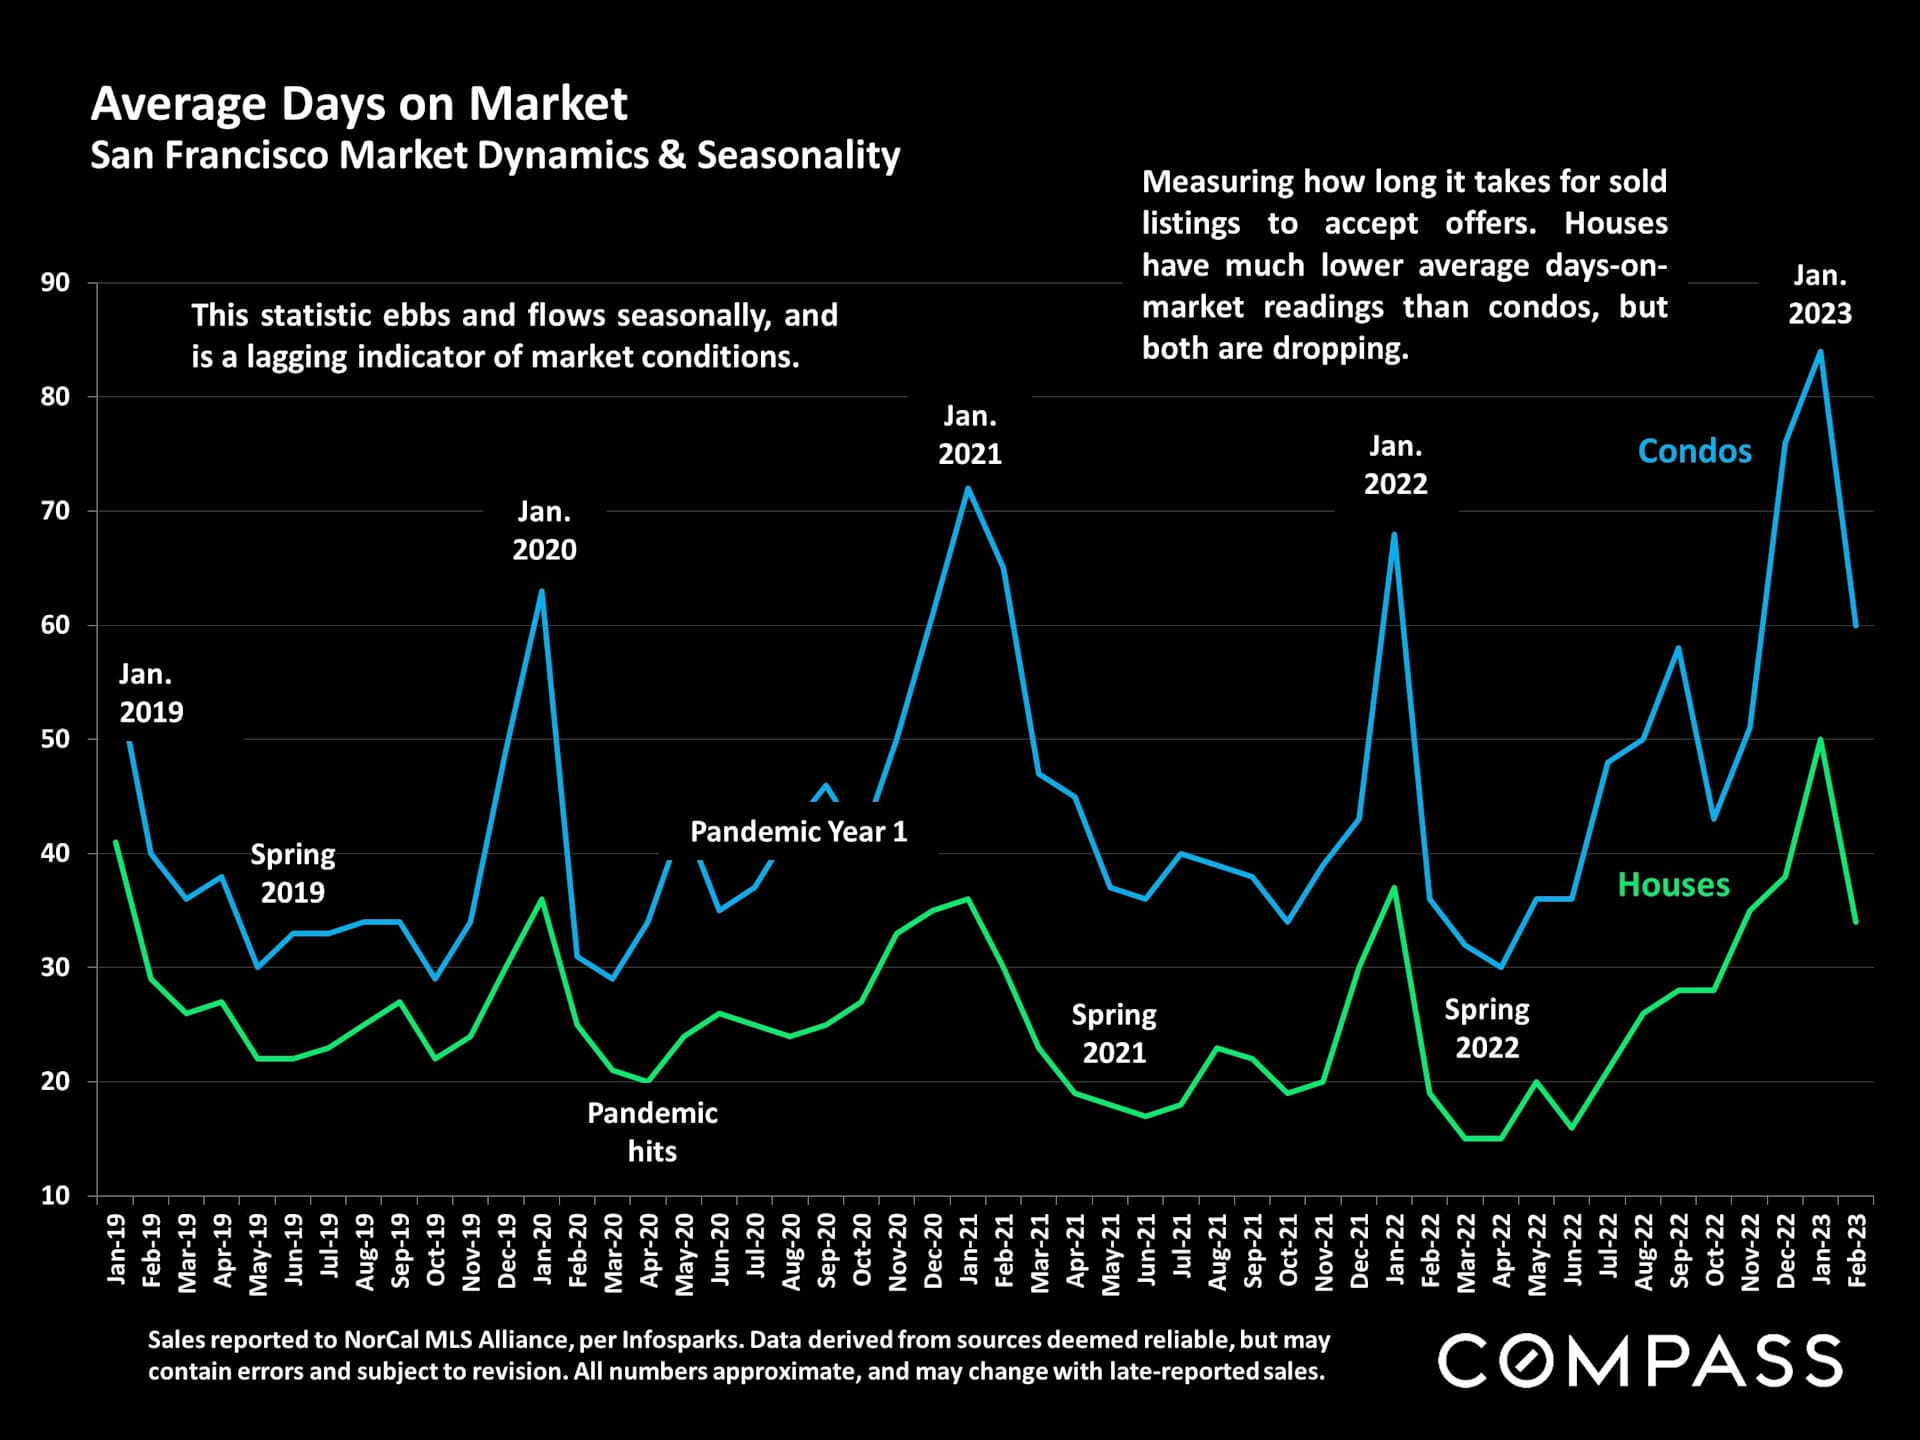
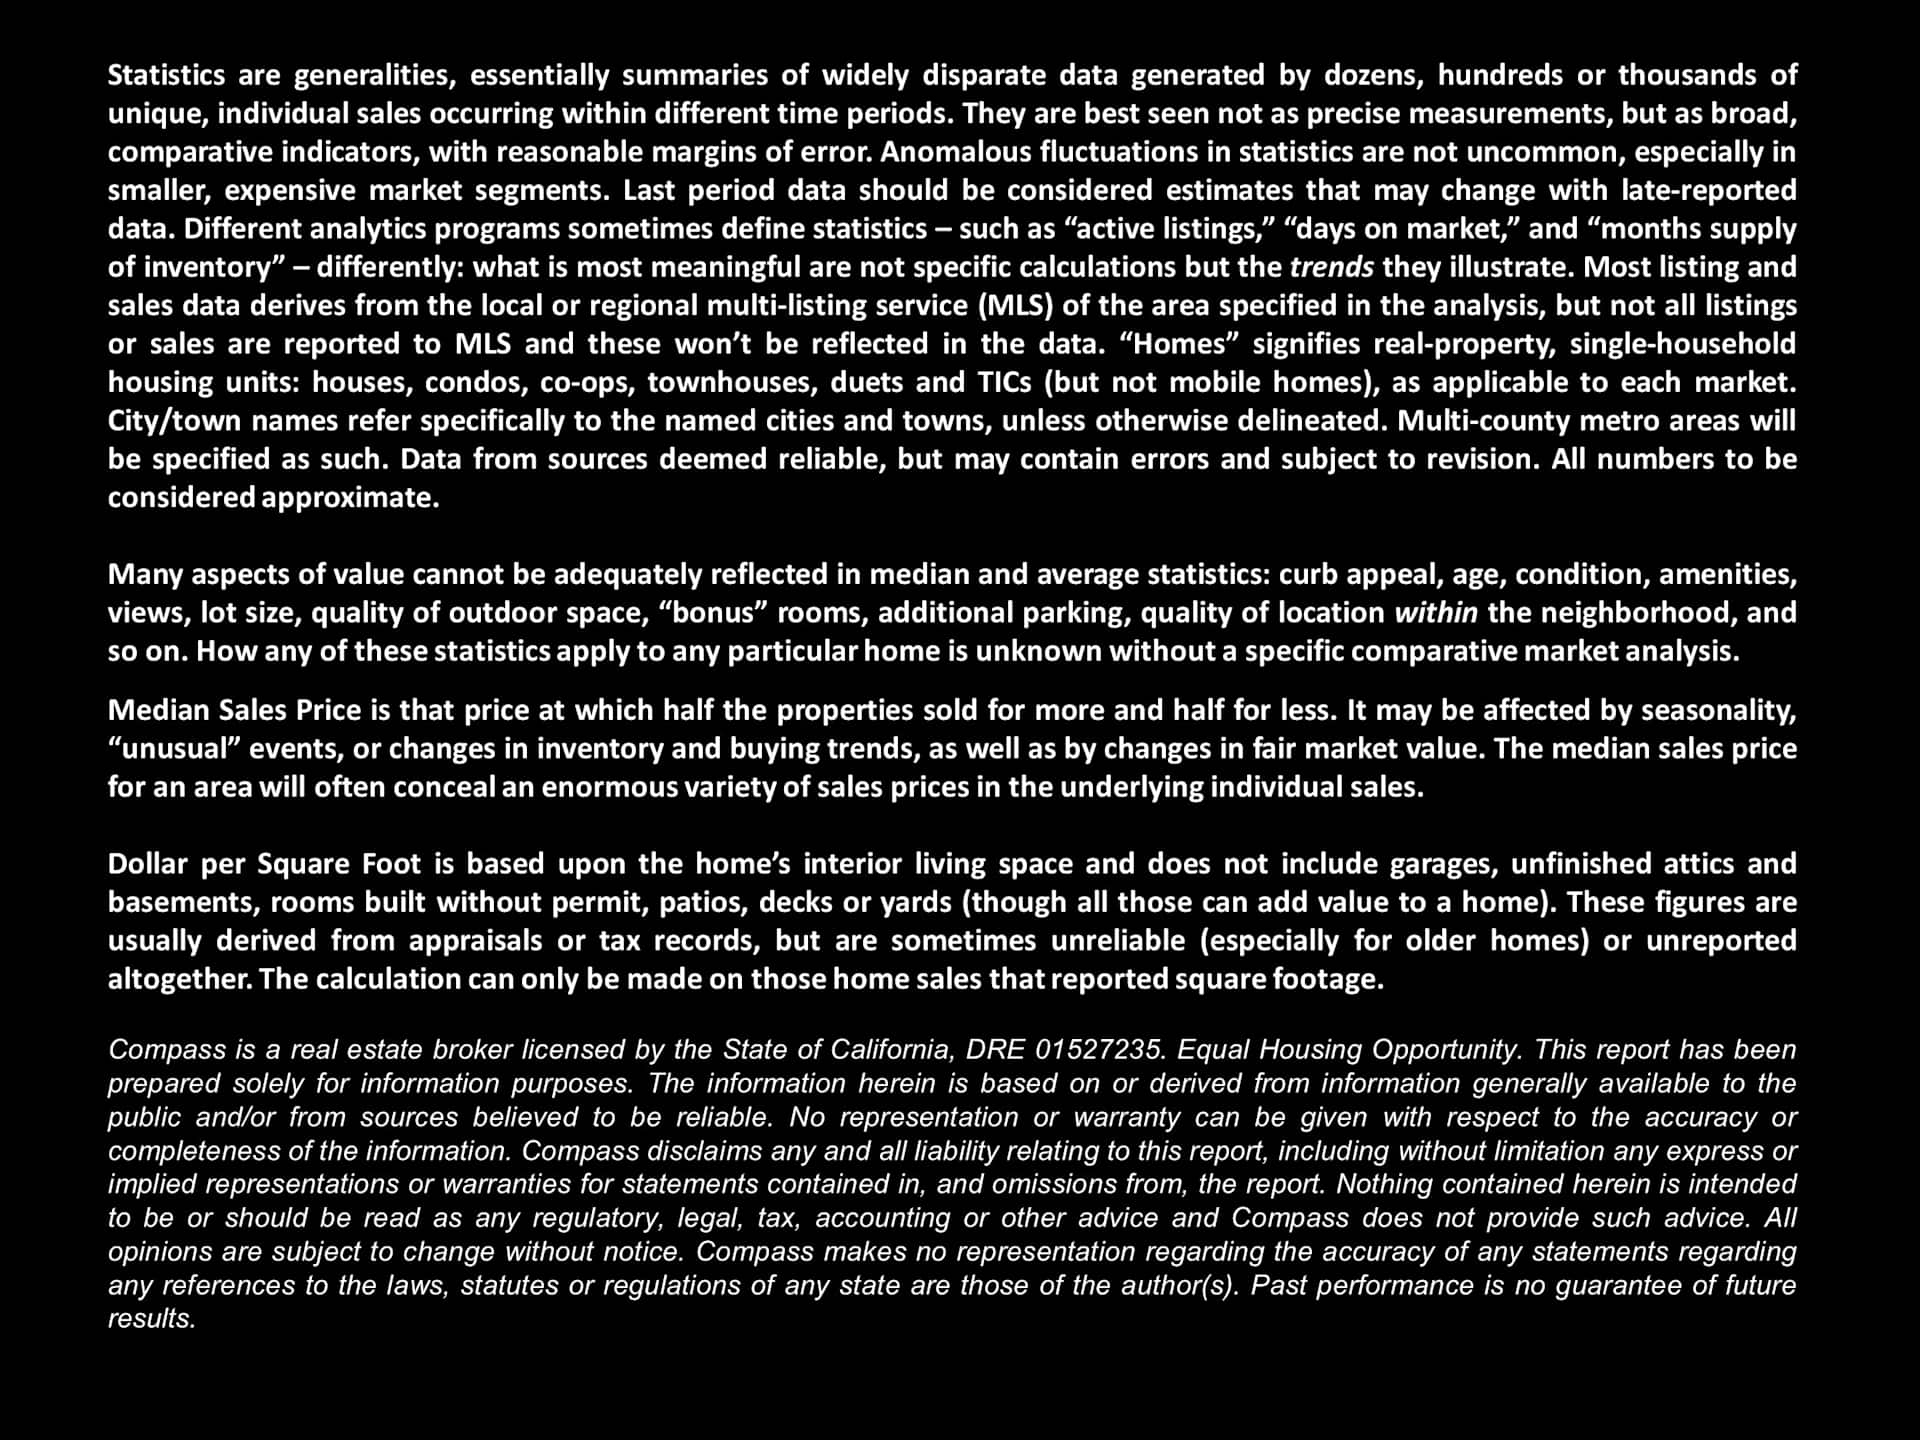
March 2023 real estate market report on improving buyer demand, home prices, interest rates and listings.Chart of 30-year fixed mortgage rates from 1976 to 2023, with a 2022–2023 inset showing the recent increase.San Francisco neighborhood home sales statistics table for late 2022 and early 2023, with prices and market times.Table comparing San Francisco two-bedroom, two-bathroom condo sales across neighborhoods in late 2022 and early 2023.Chart of San Francisco median house prices from 1990 to 2023, with a three-month average falling from its 2022 peak.Chart of San Francisco year-over-year house price changes, turning sharply negative from July 2022 and reaching -17% in January 2023.Chart of San Francisco two-bedroom condo prices from 2005 to 2023, peaking near $1.4 million before declining.Chart of San Francisco two-bedroom condo appreciation rates, with a 13% peak in February 2022 and declines through February 2023.San Francisco monthly new listings chart, with February year-over-year comparisons highlighted.San Francisco chart comparing rolling new condo and house listings from 2007 to 2023, with a pandemic-era condo surge.Chart of San Francisco active and coming-soon listings, showing monthly counts from February 2022 through March 2023.San Francisco listing inventory infographic with counts and median asking prices by price range and property type.Chart of San Francisco listings accepting offers from January 2019 to February 2023, annotated with seasonal and pandemic trends.Chart comparing monthly San Francisco home offer acceptance rates for houses and condos from 2020 to 2023.Chart of San Francisco monthly home sales, January 2019–February 2023, with February year-over-year comparisons highlighted.Bar chart of San Francisco $3 million-plus home sales by month, January 2019 to February 2023.Chart of San Francisco luxury home sales, with house and condo trends peaking in 2021 before declining.Chart of San Francisco active-listing price reductions from 2018 to 2023, with October peaks and a 2020 surge.Chart showing the percentage of San Francisco home sales closing over list price from 2018 to 2023.Chart comparing San Francisco house and condo sale prices to original list prices, January 2019 to February 2023.San Francisco average days-on-market chart comparing condos and houses from 2019 to February 2023.Text explaining real estate statistics, their limitations, and Compass report disclaimers.

Work With Us

We will help you understand the complex aspects of the transaction and share our expertise so that you can make the best decisions possible. We are experienced, market savvy, and energetic. With both of us working for our clients, you get twice the amount of attention and insight.