
The SF Team, Eva + James, Compass

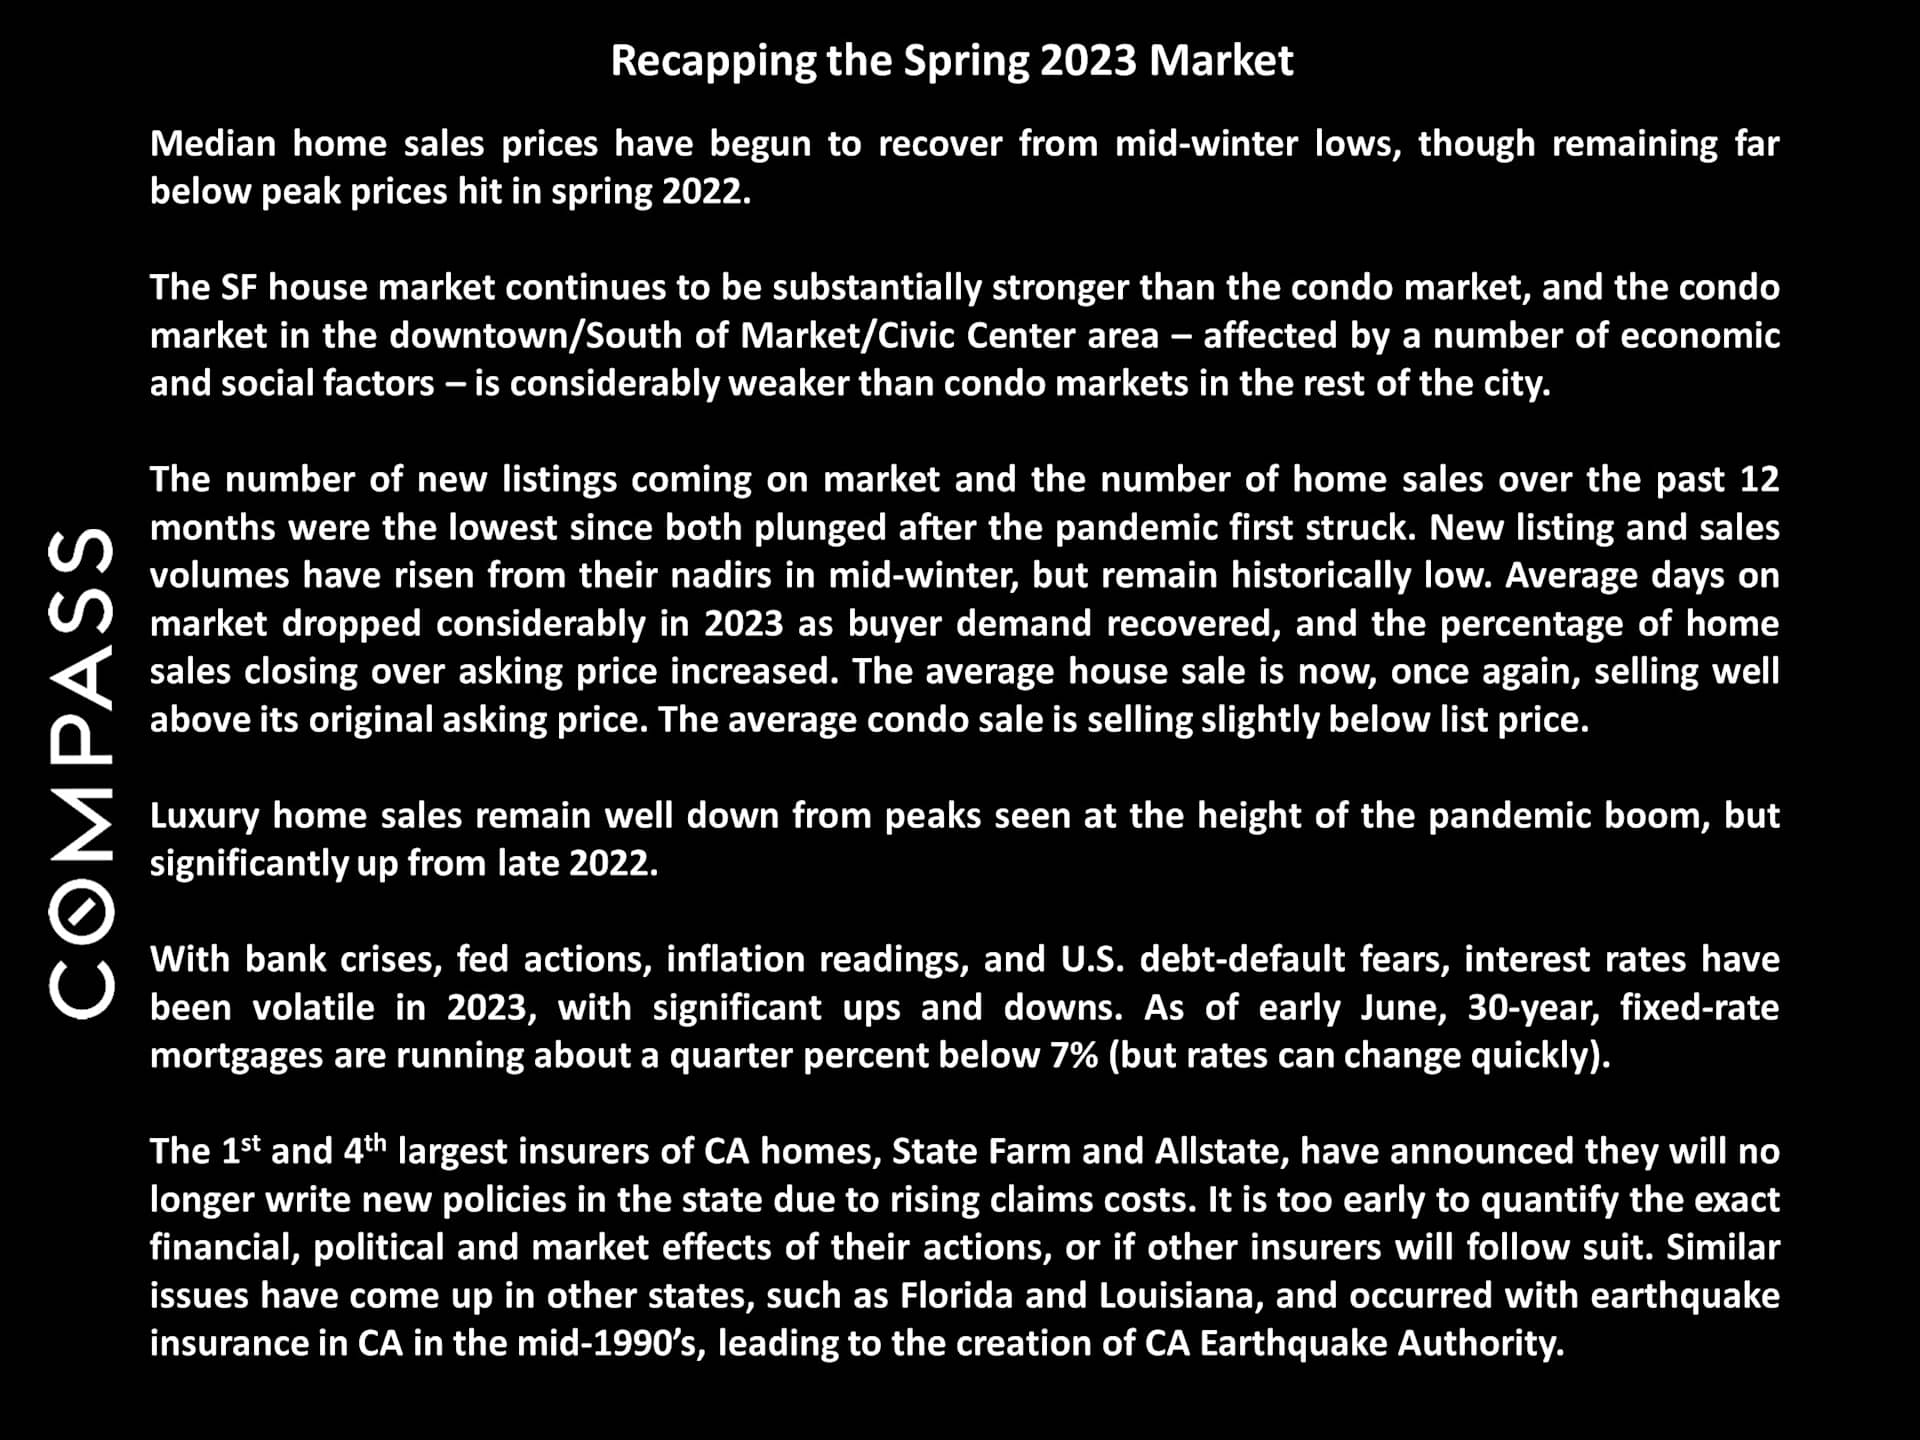
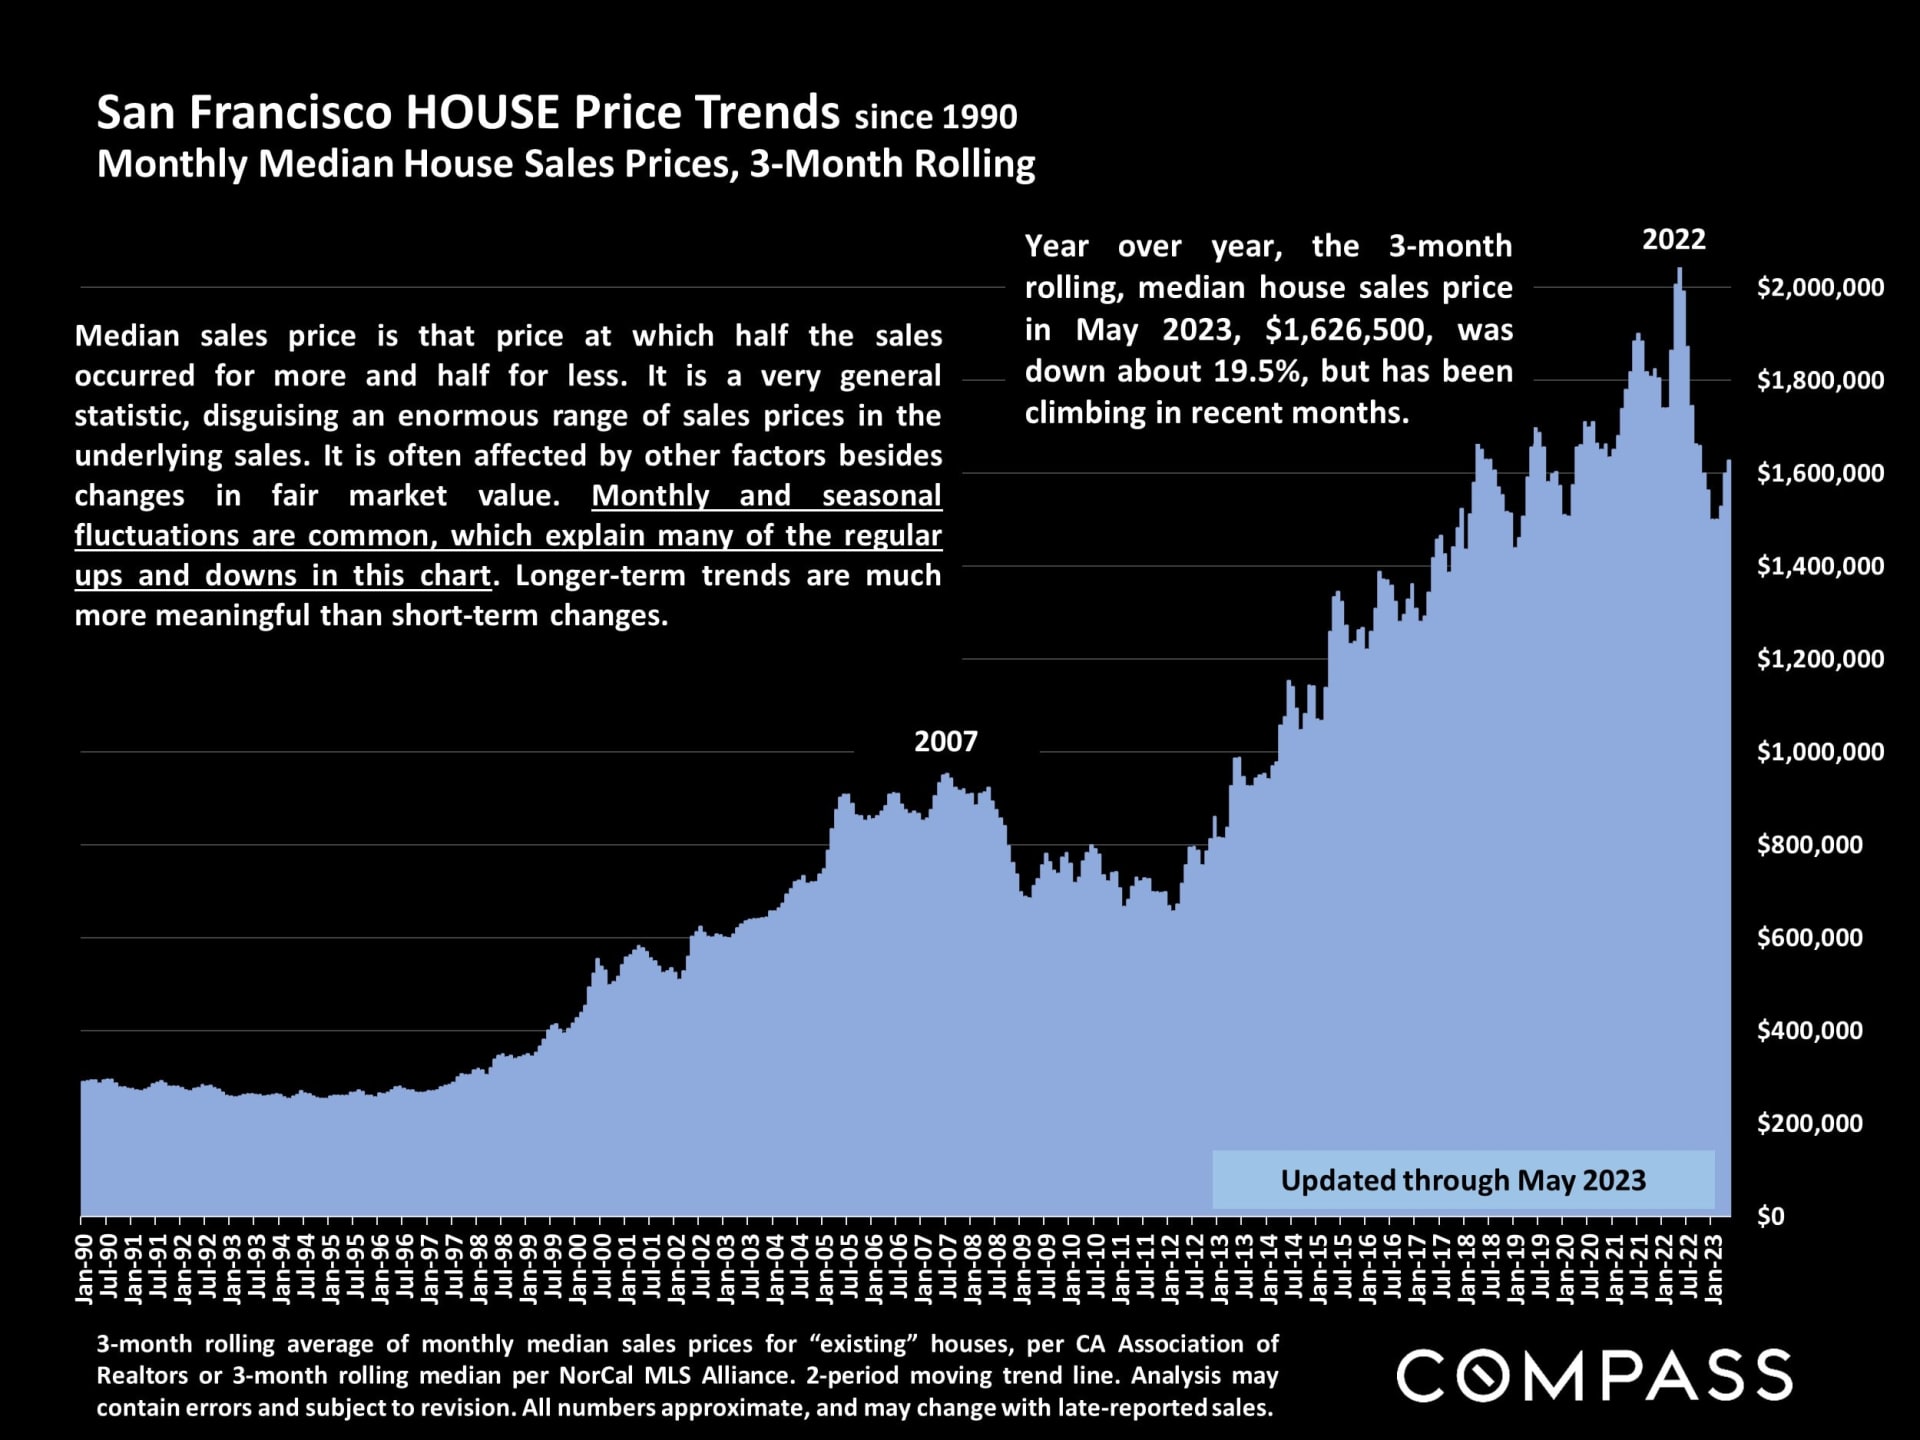
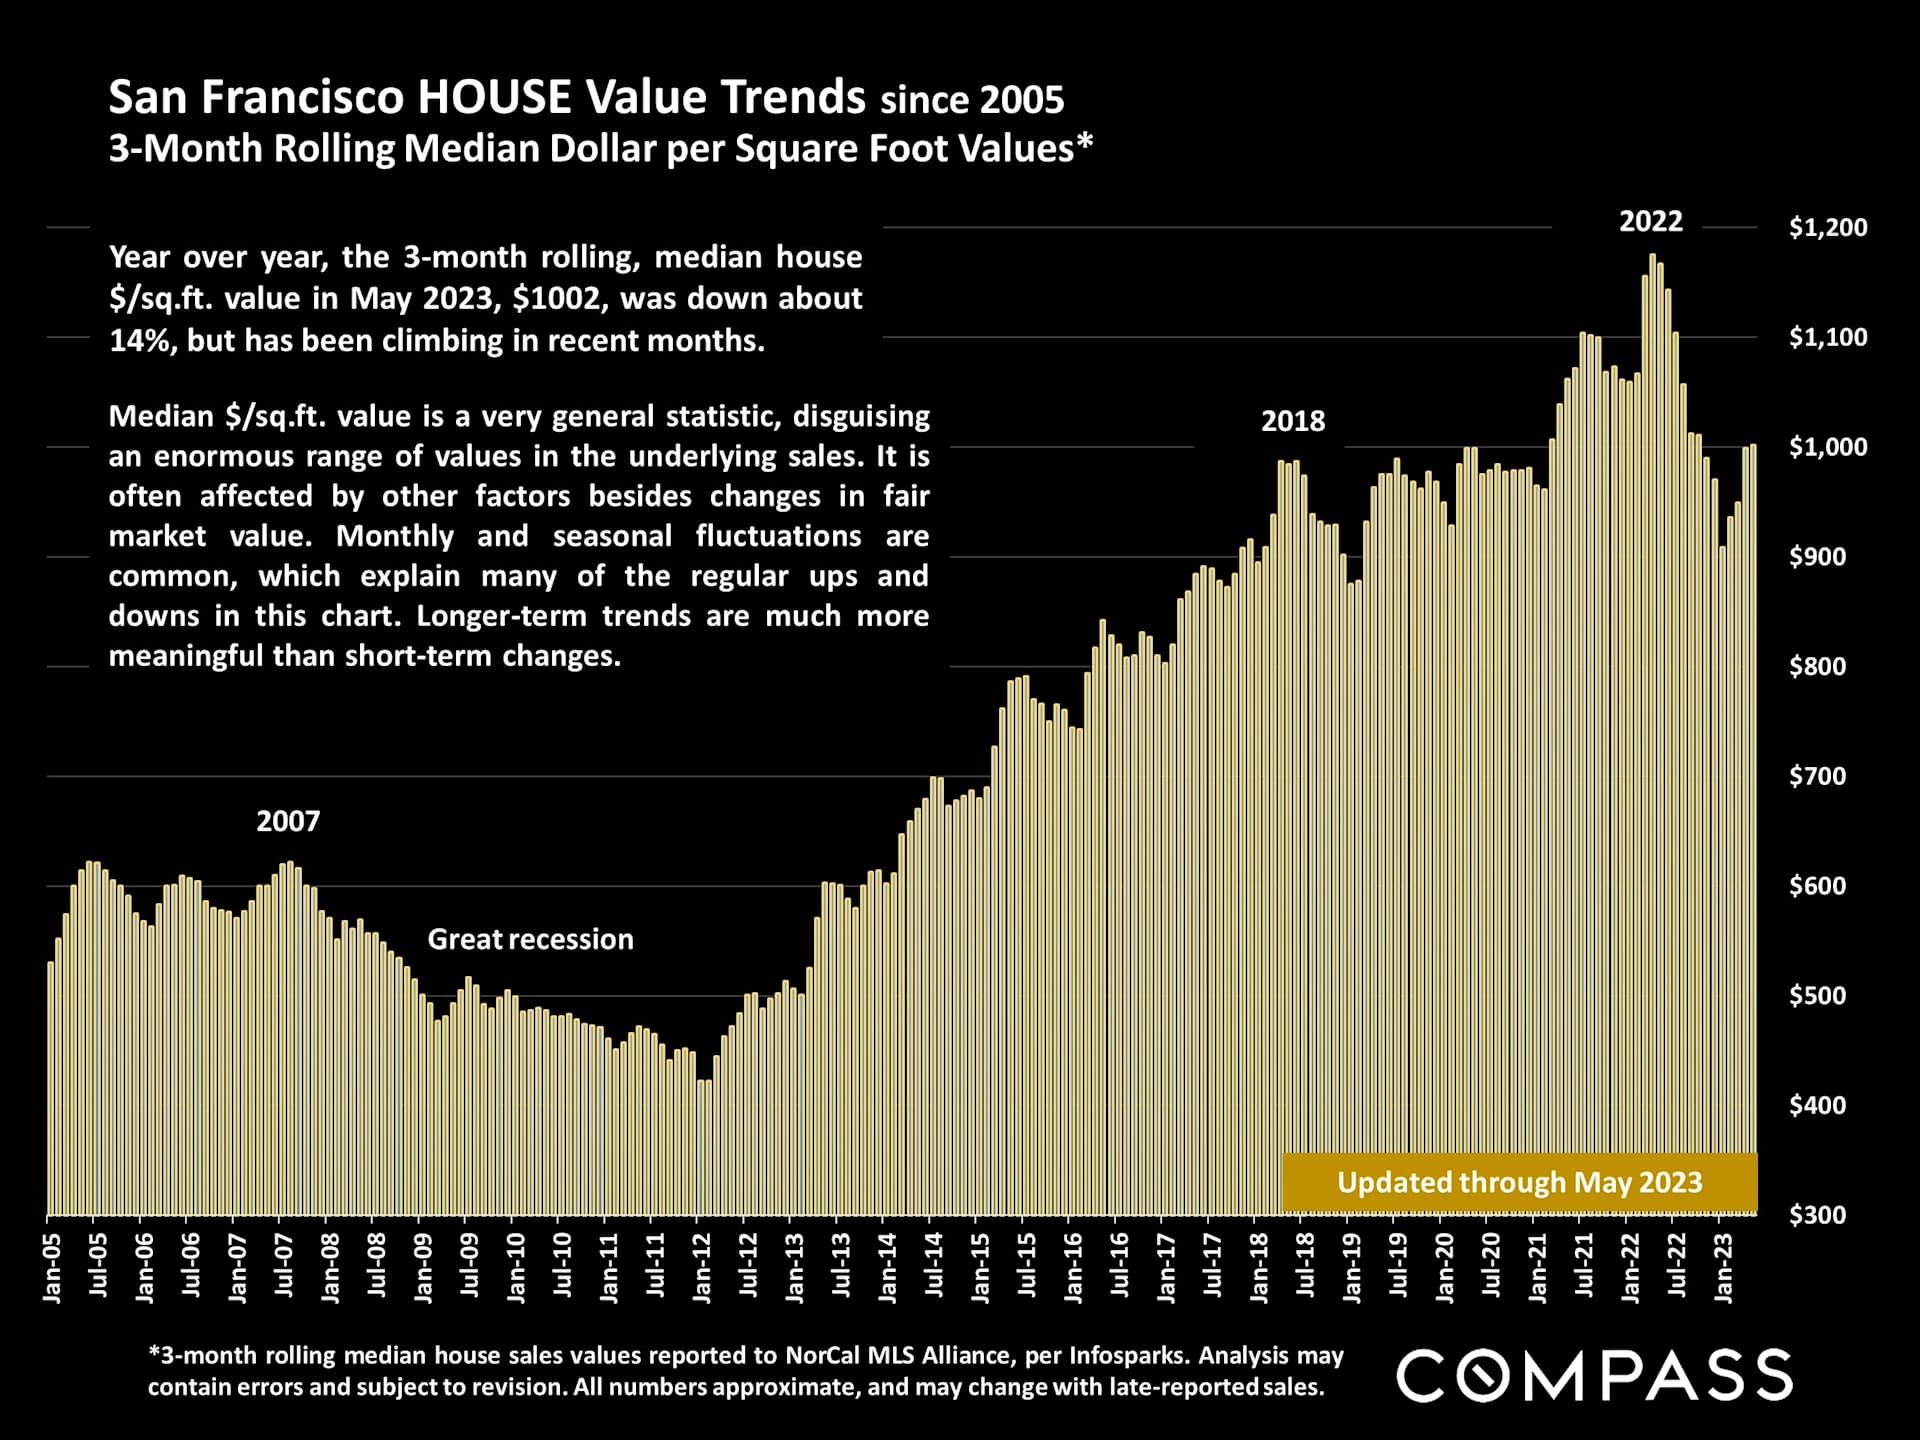
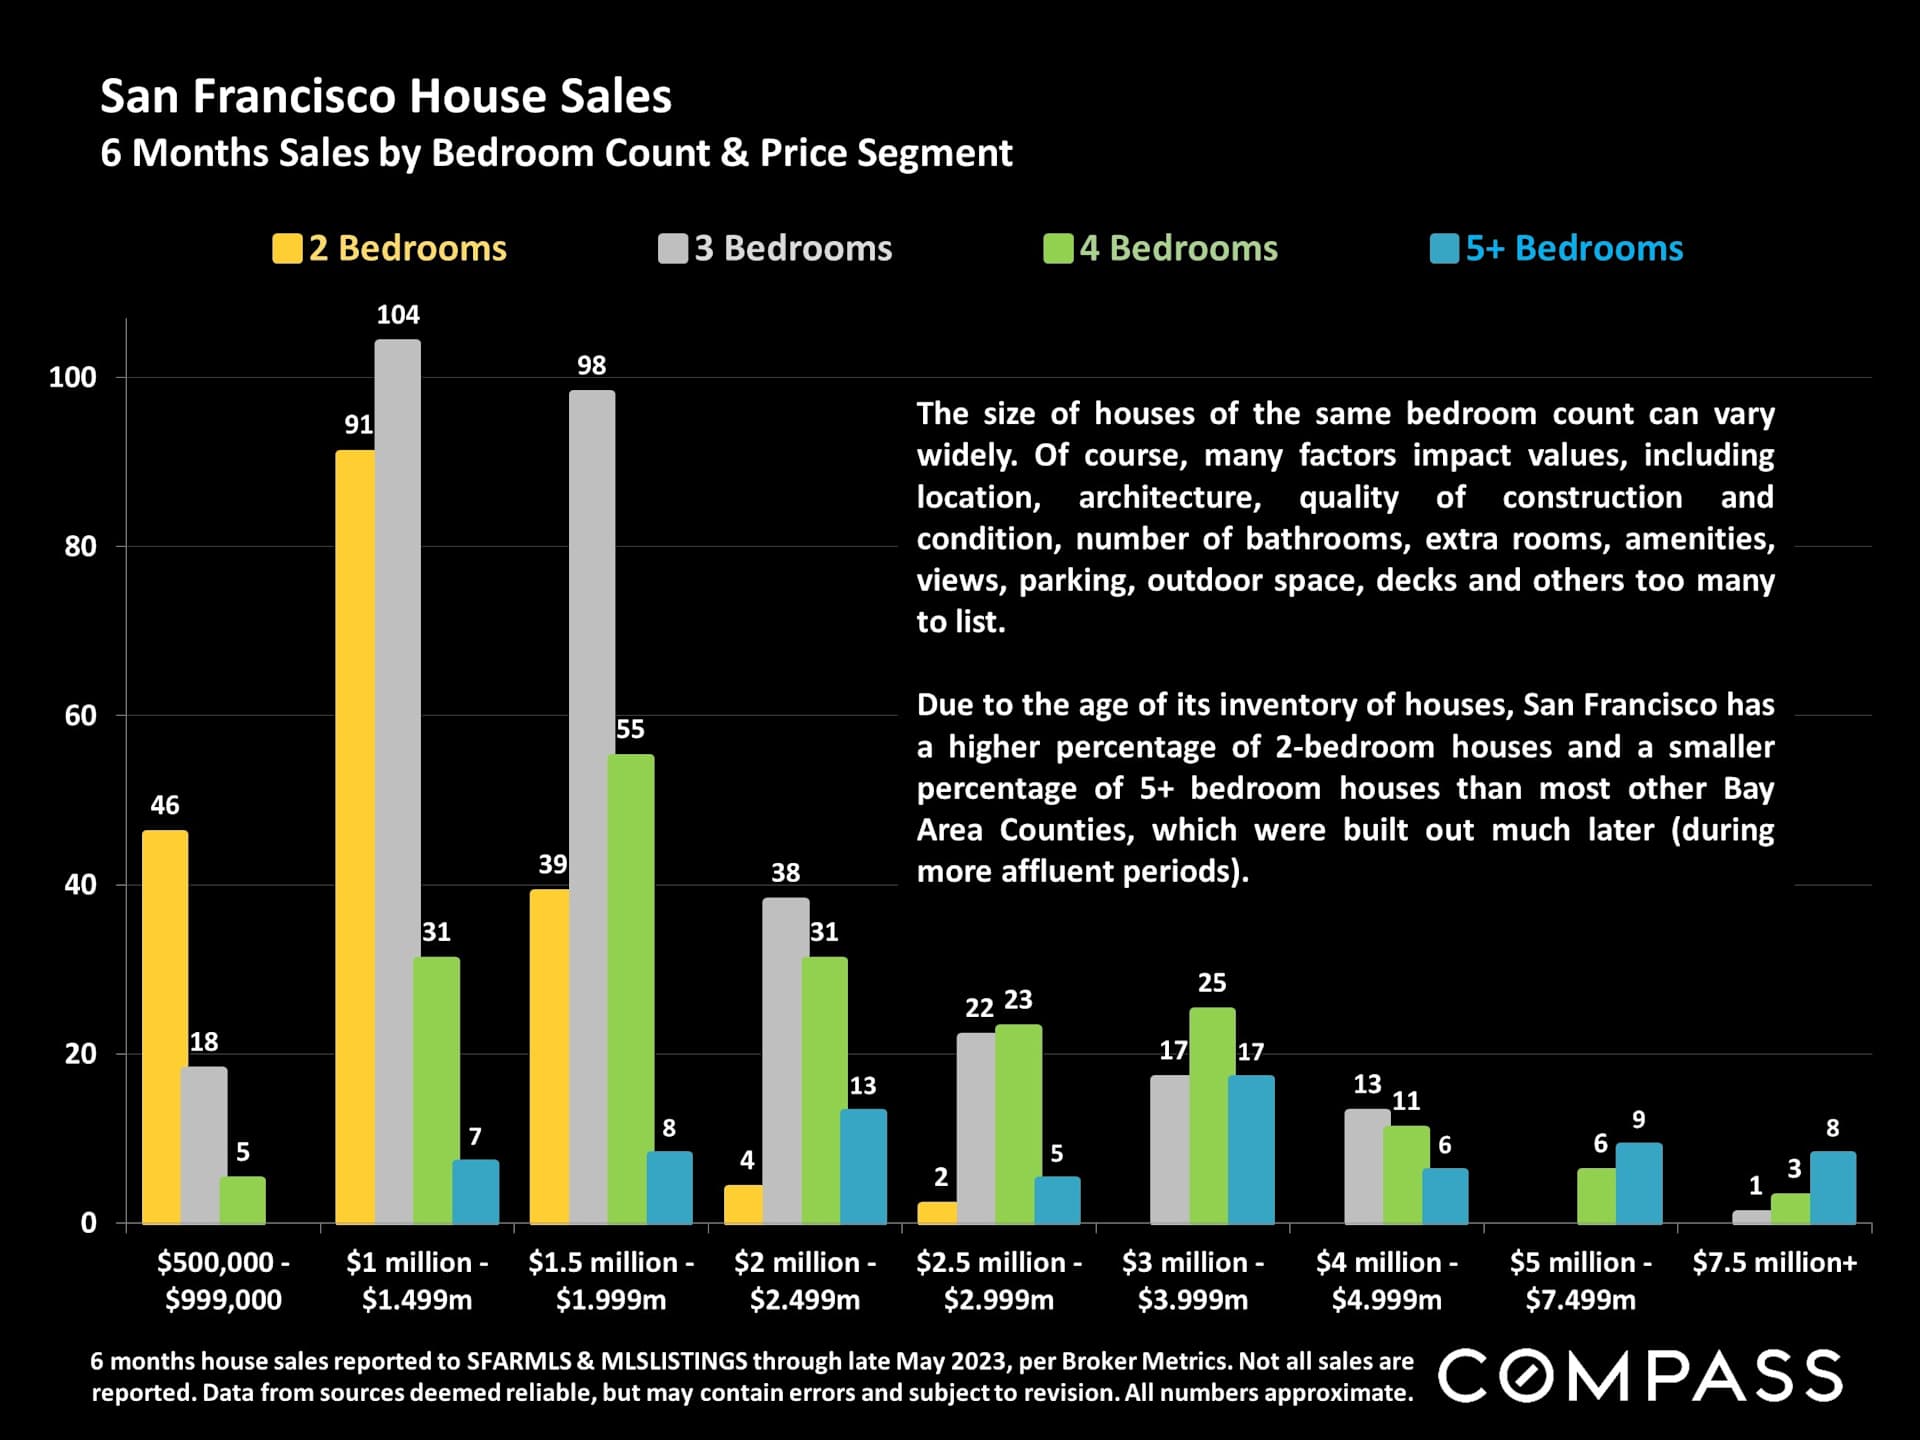
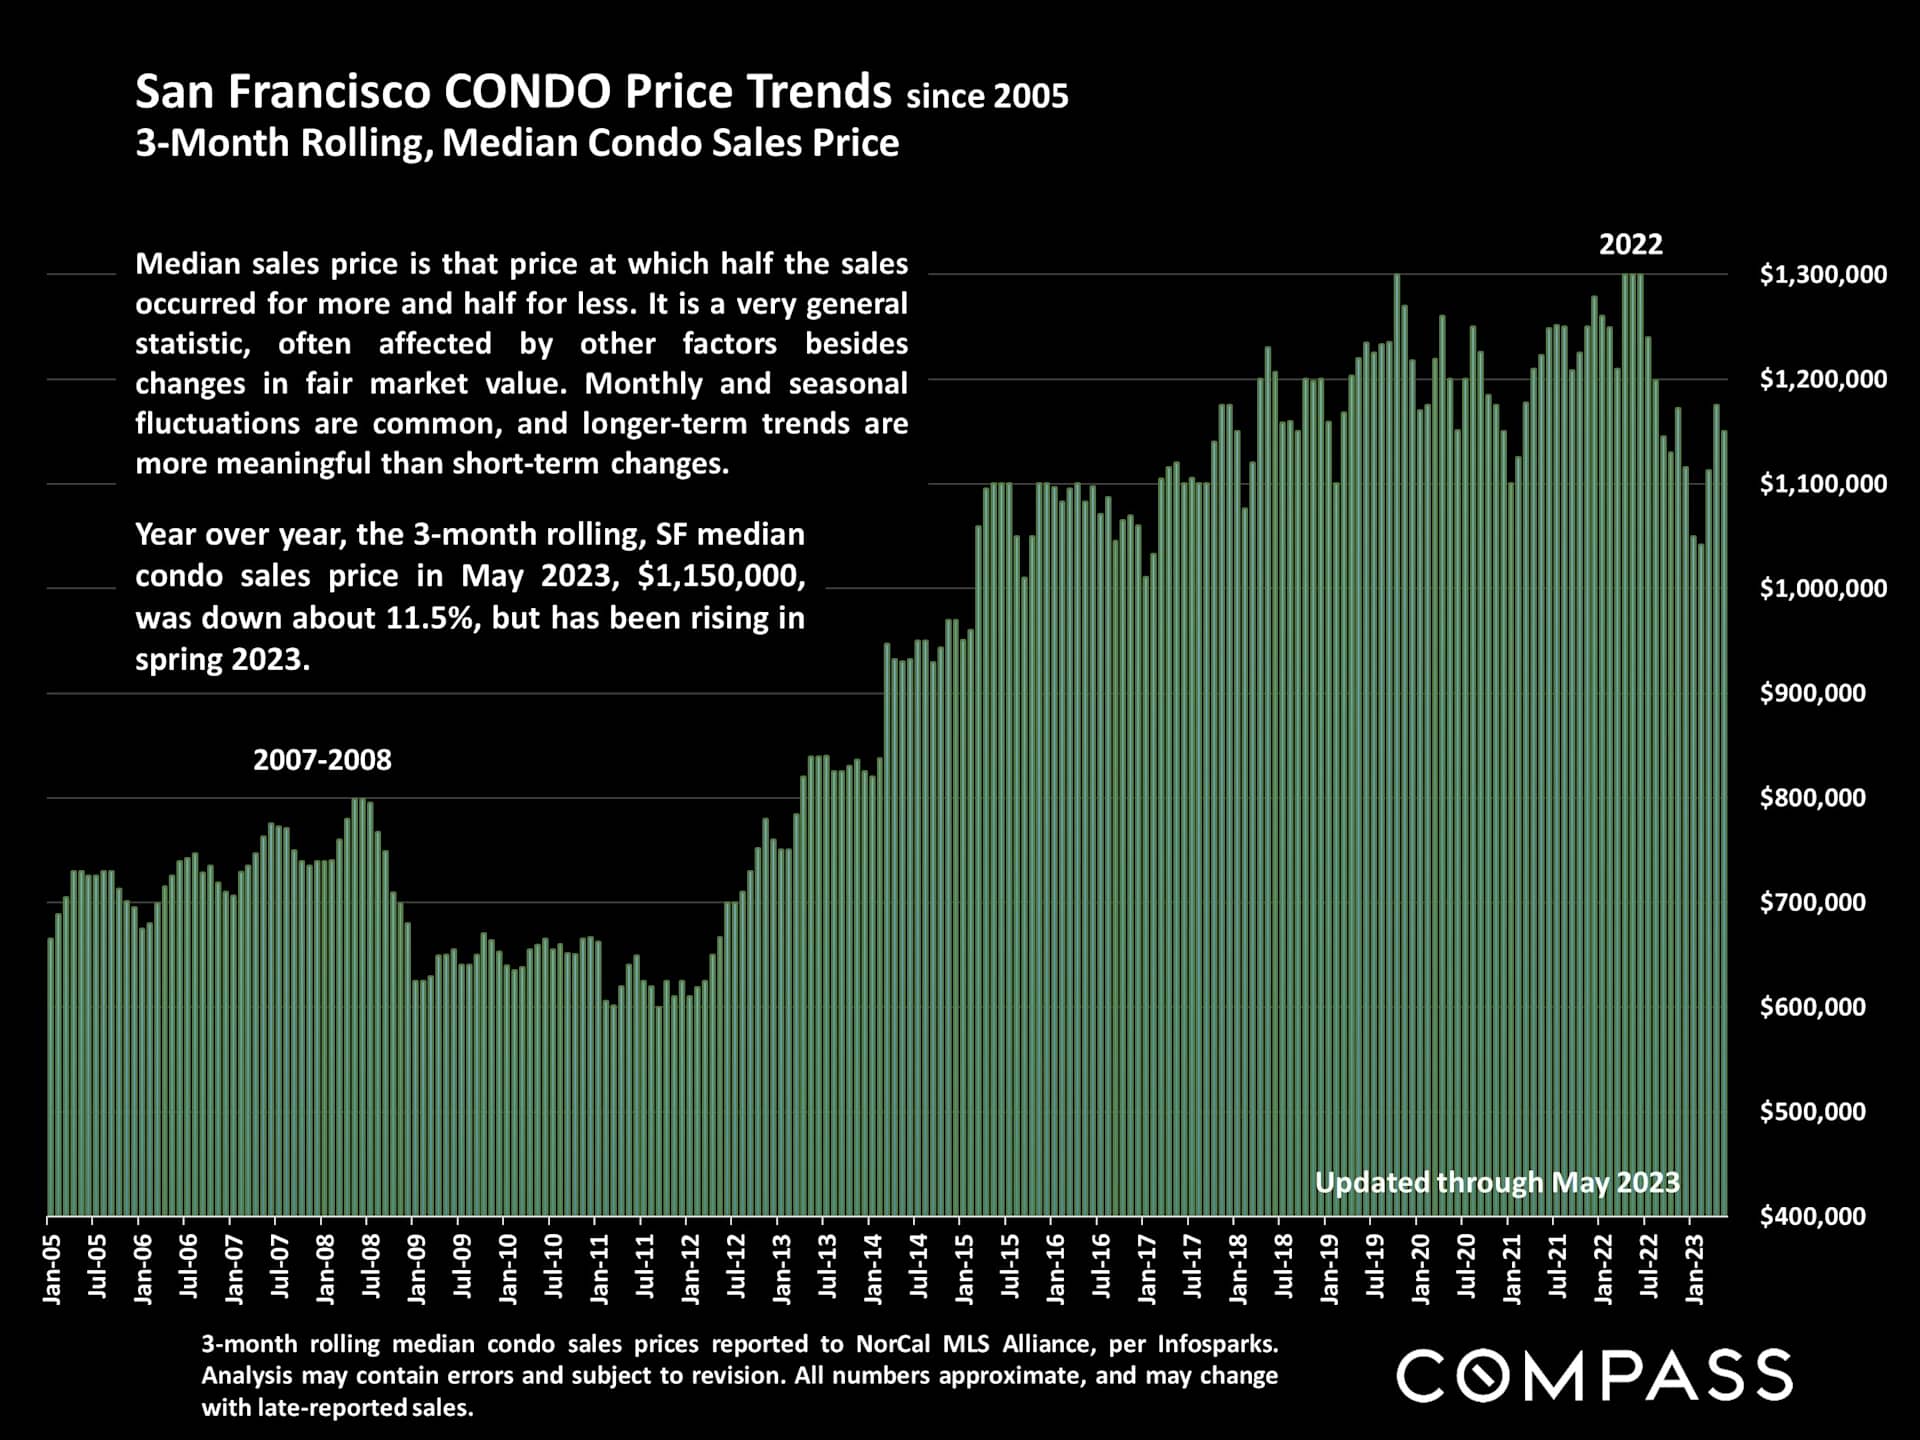
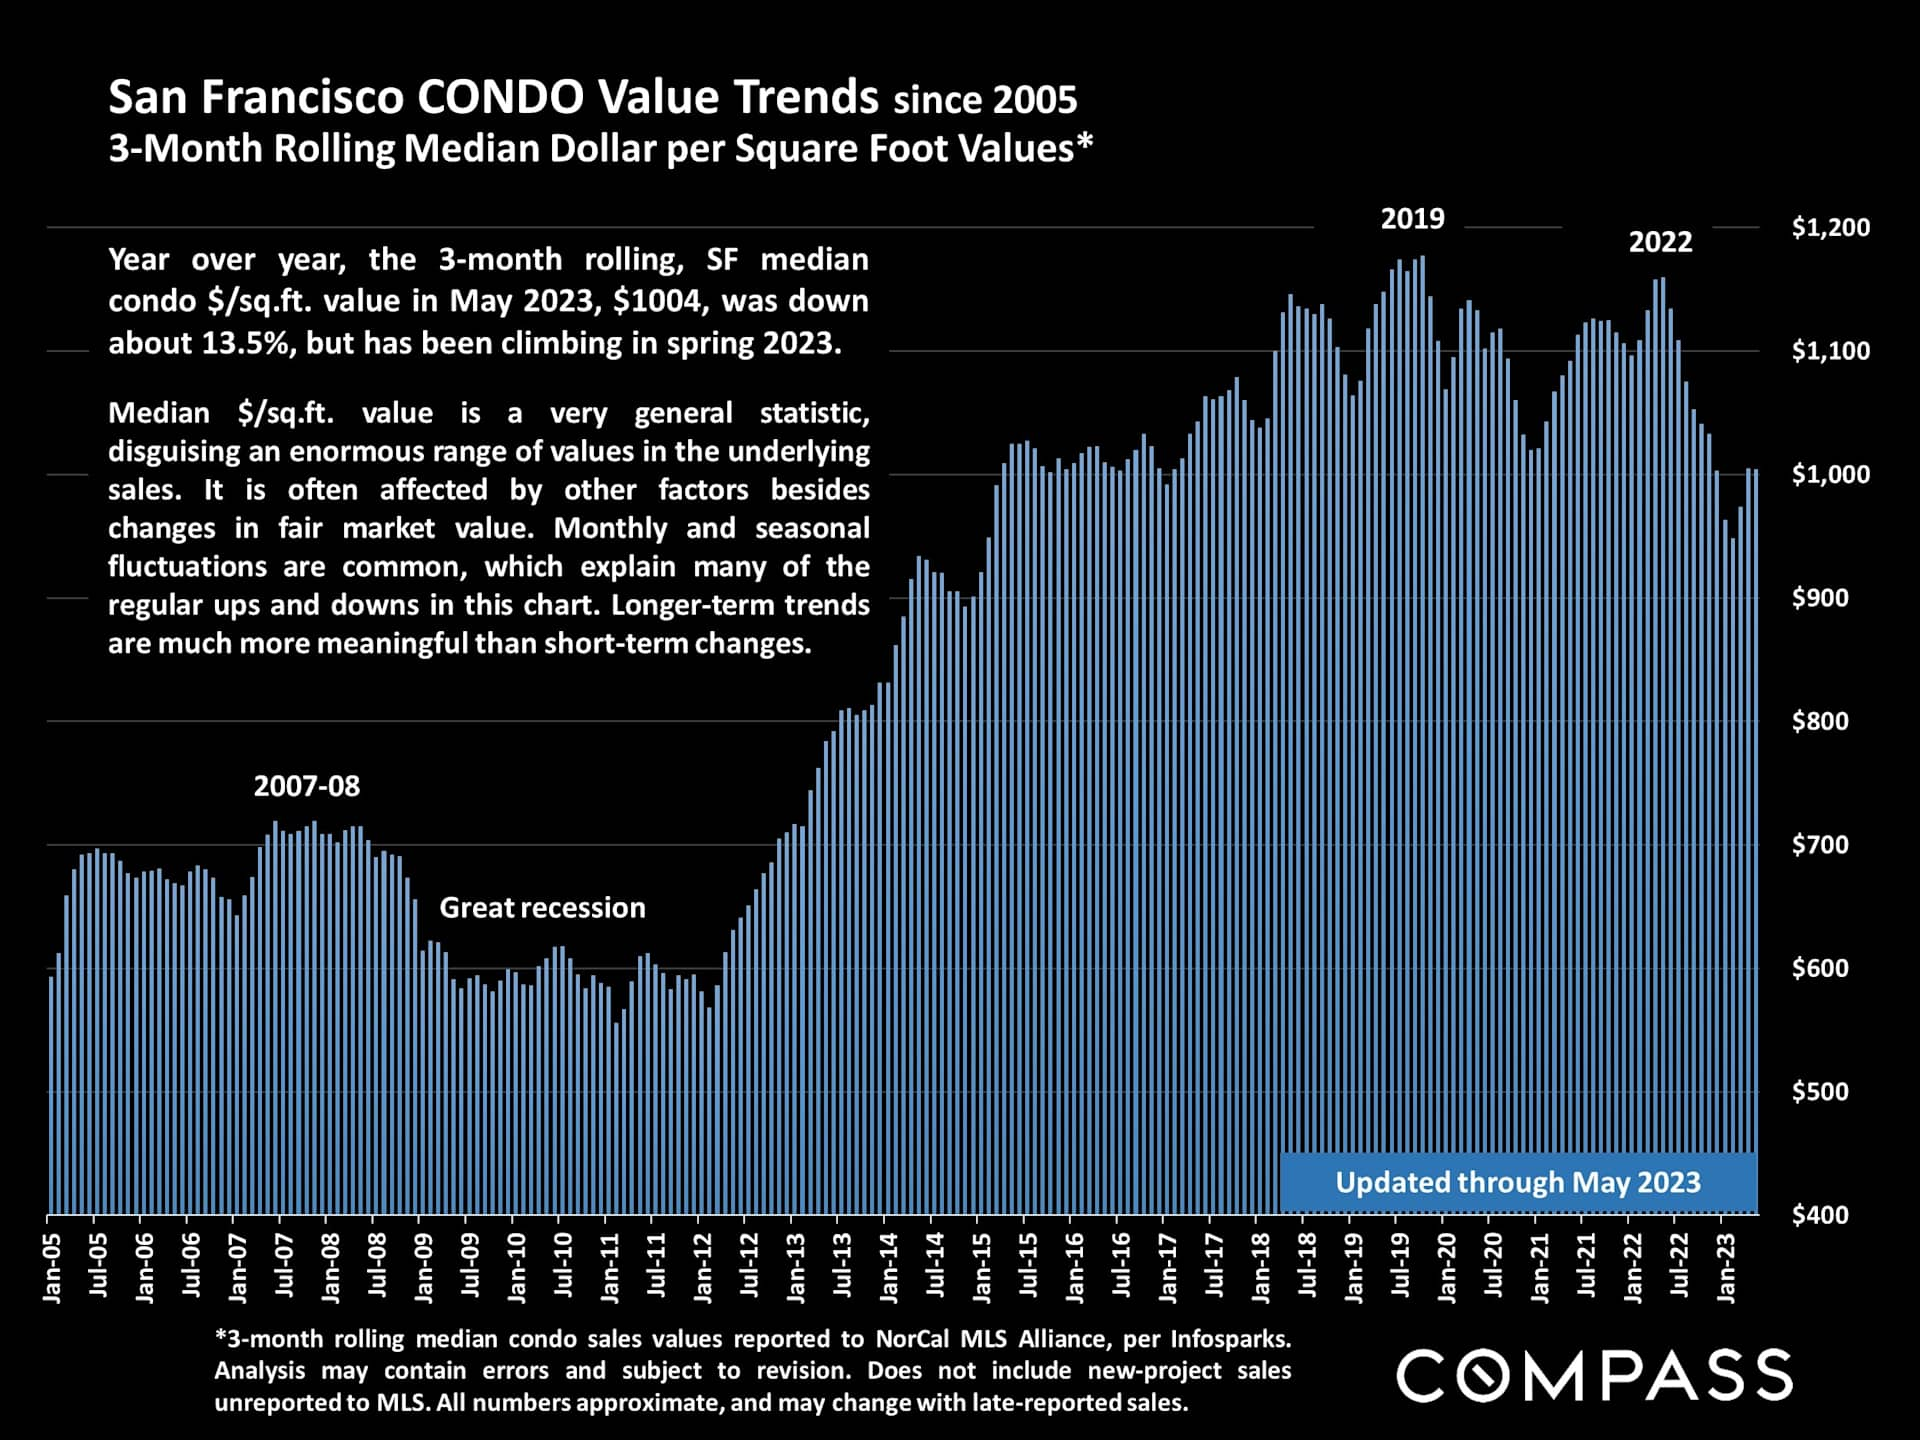
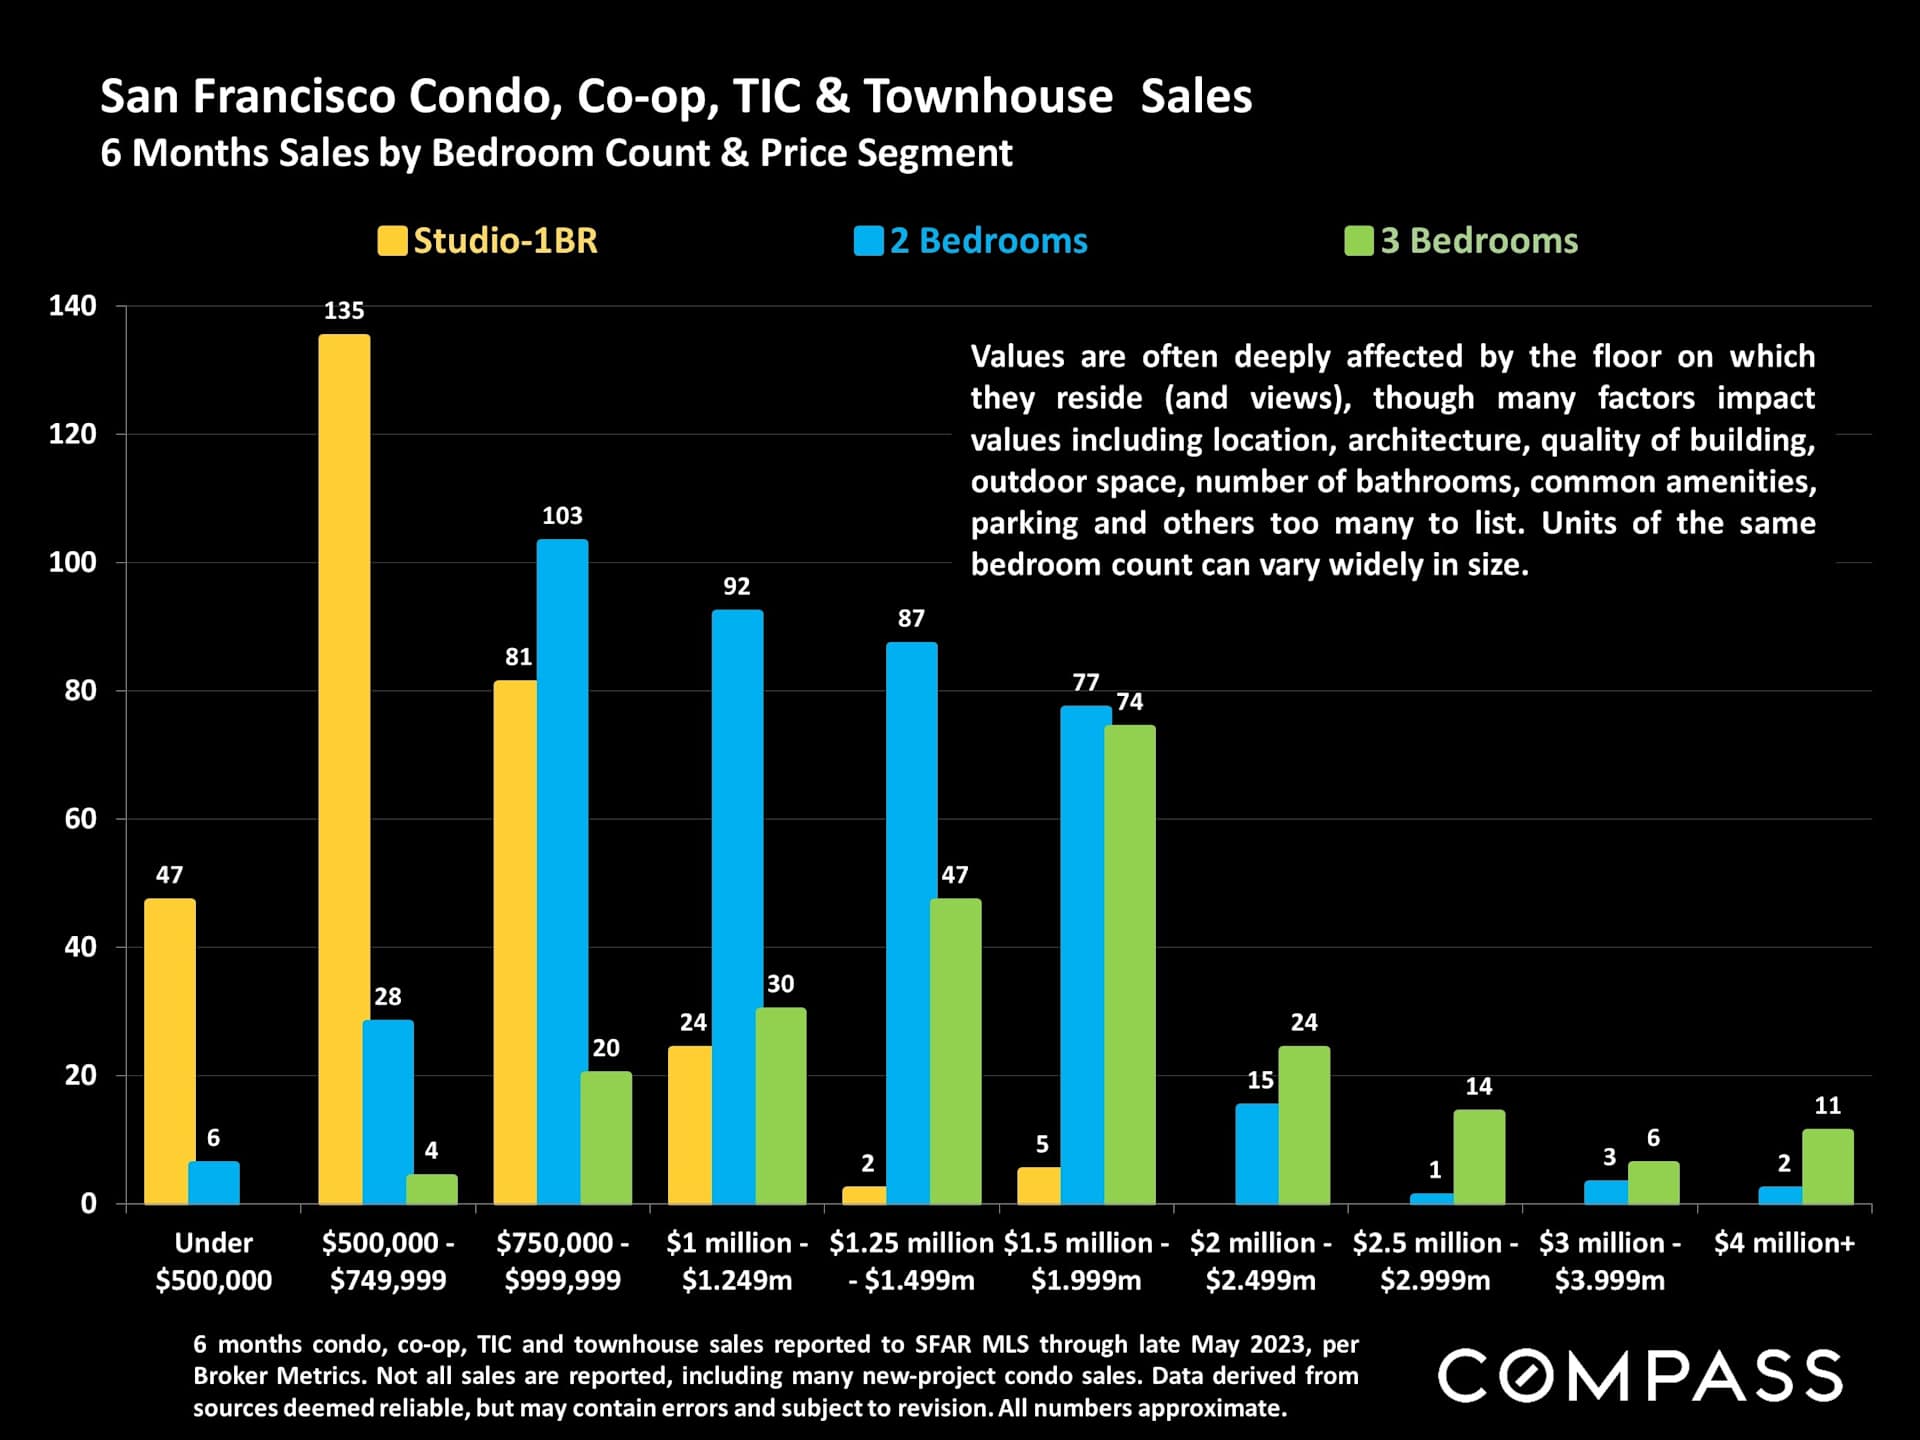
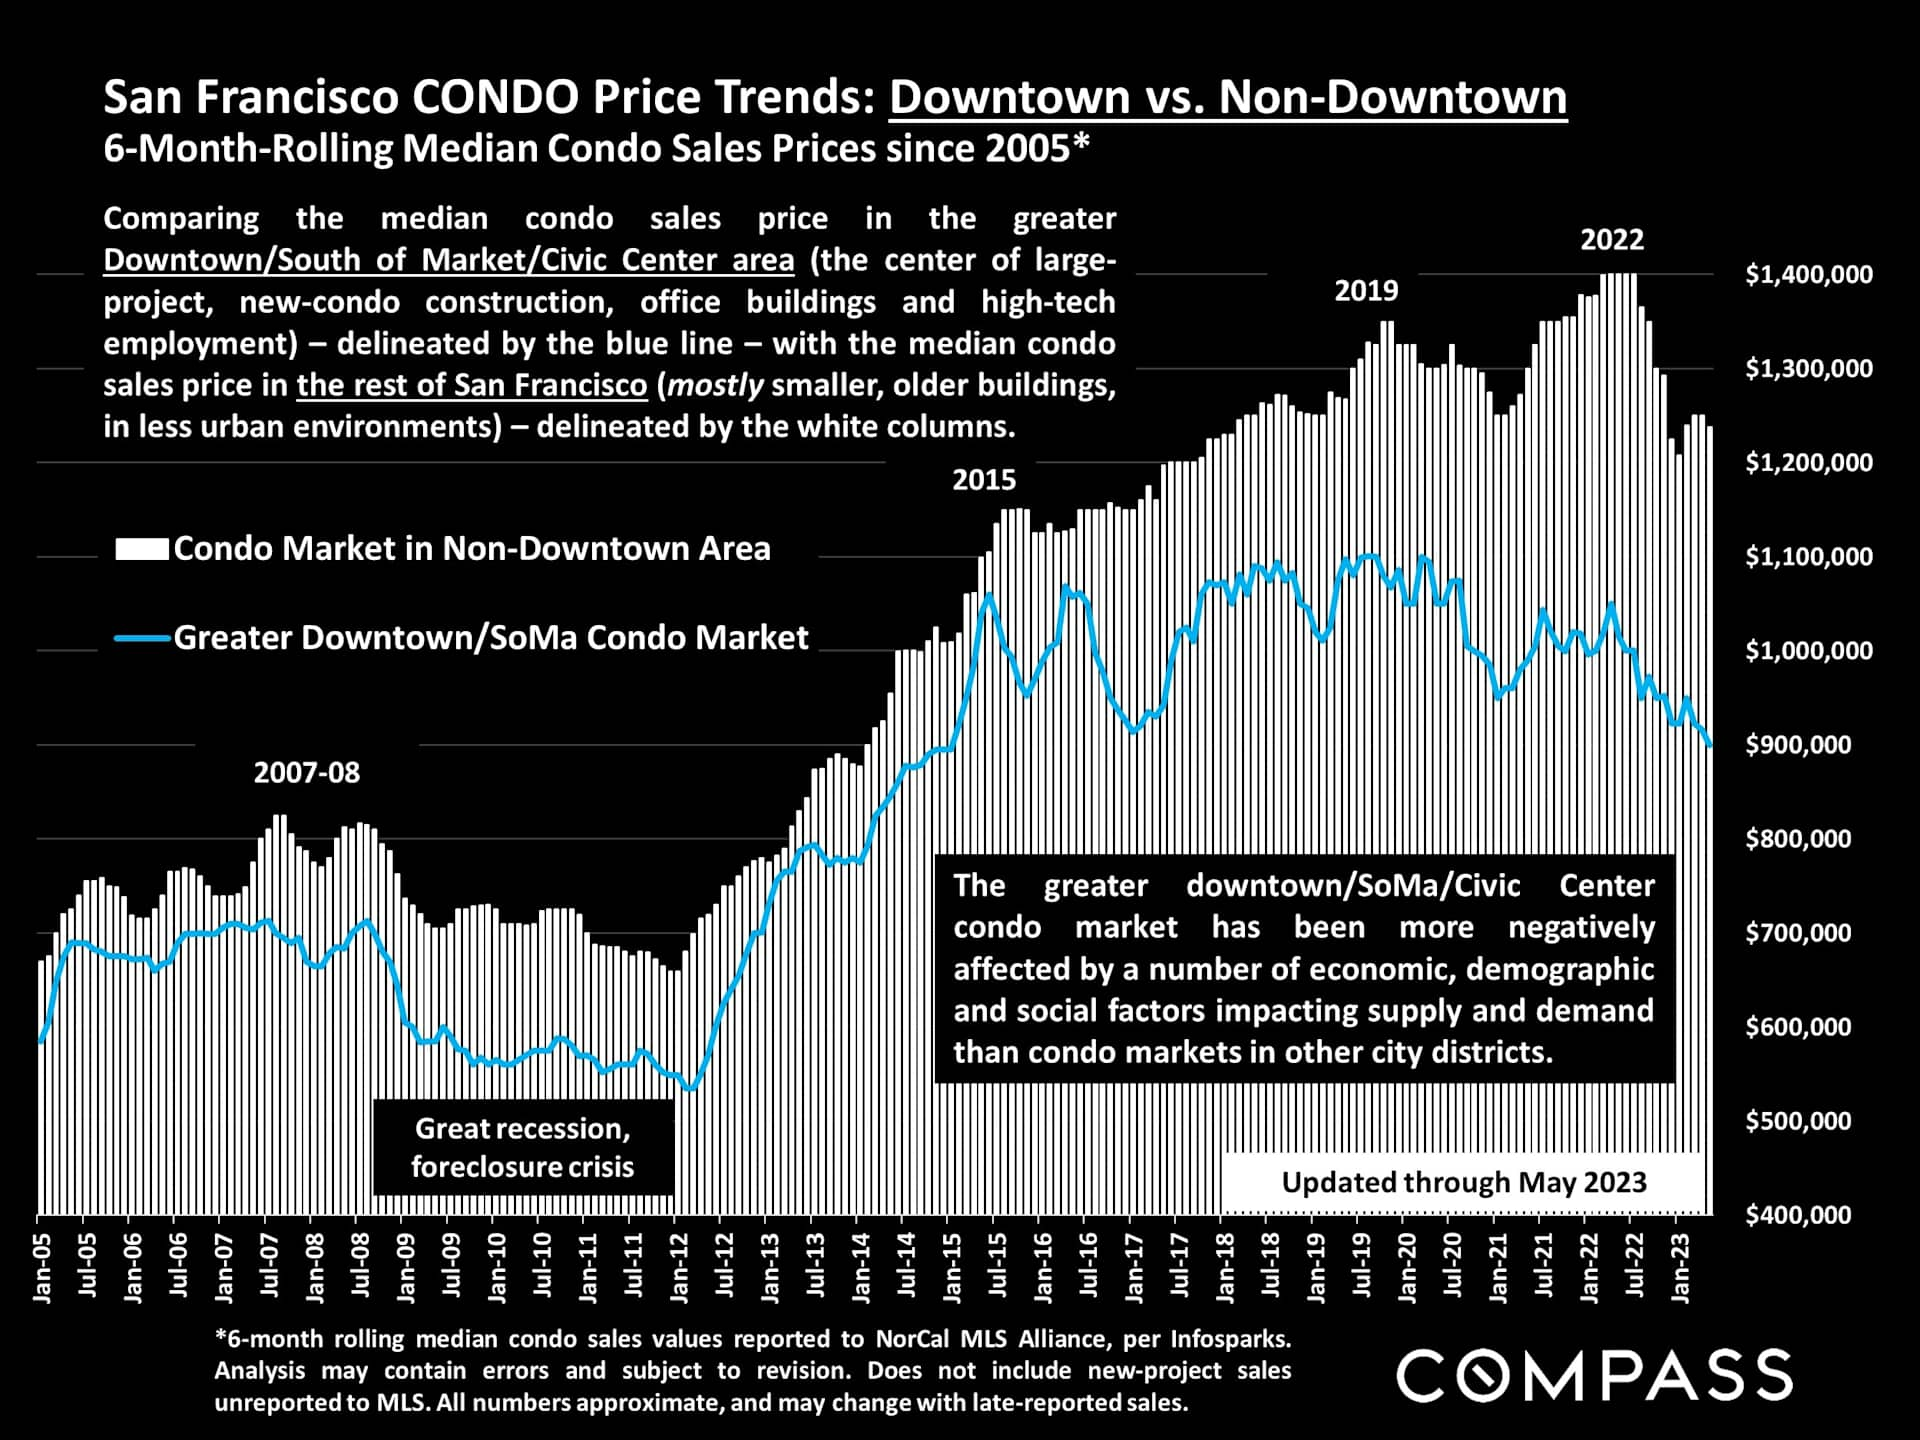
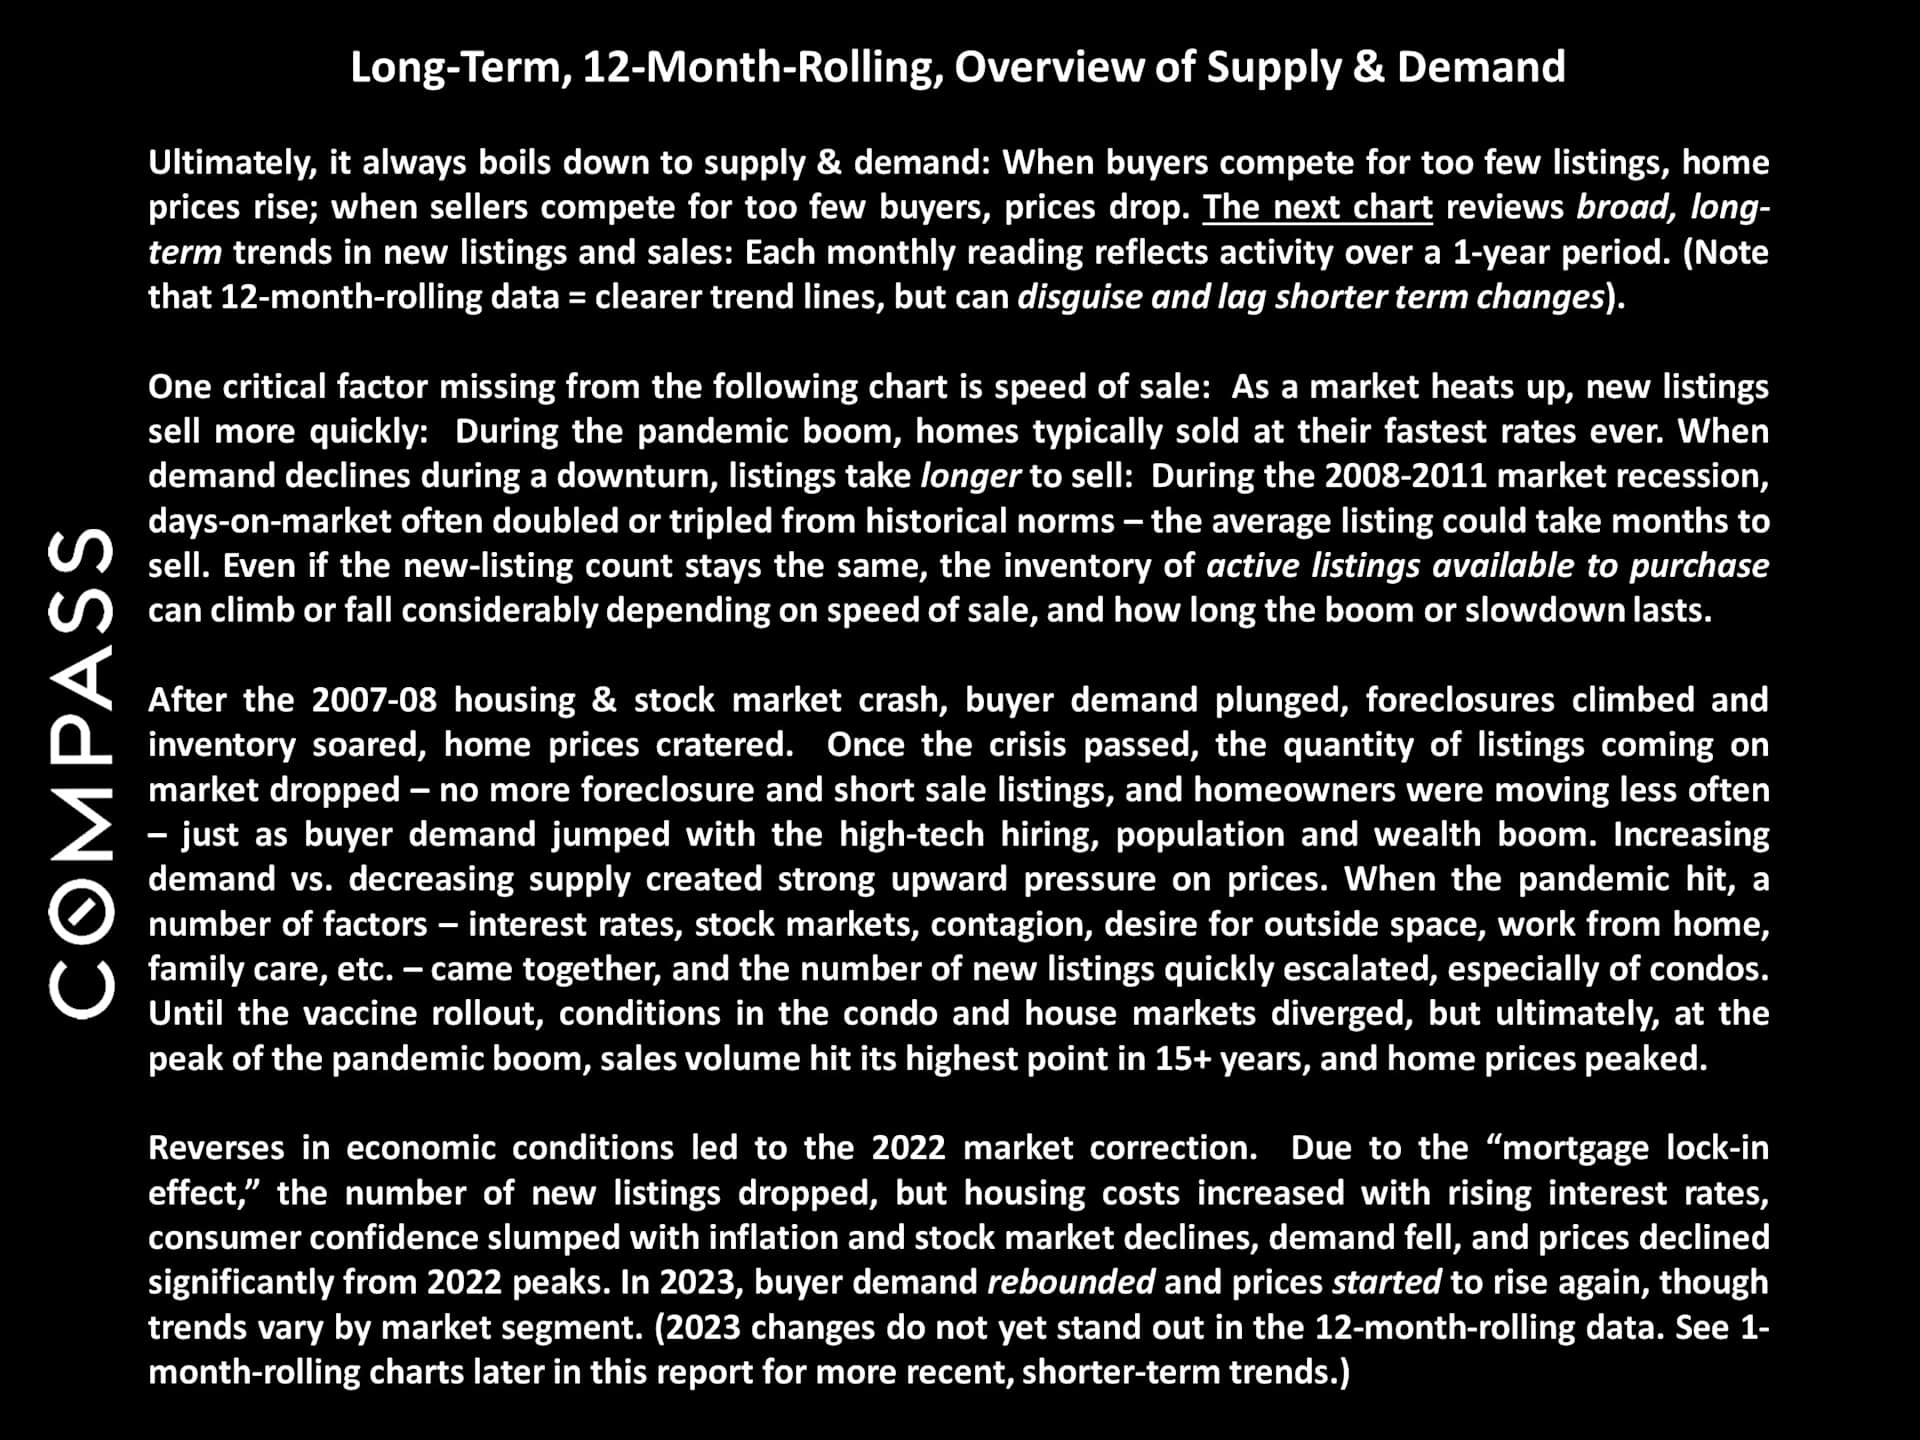
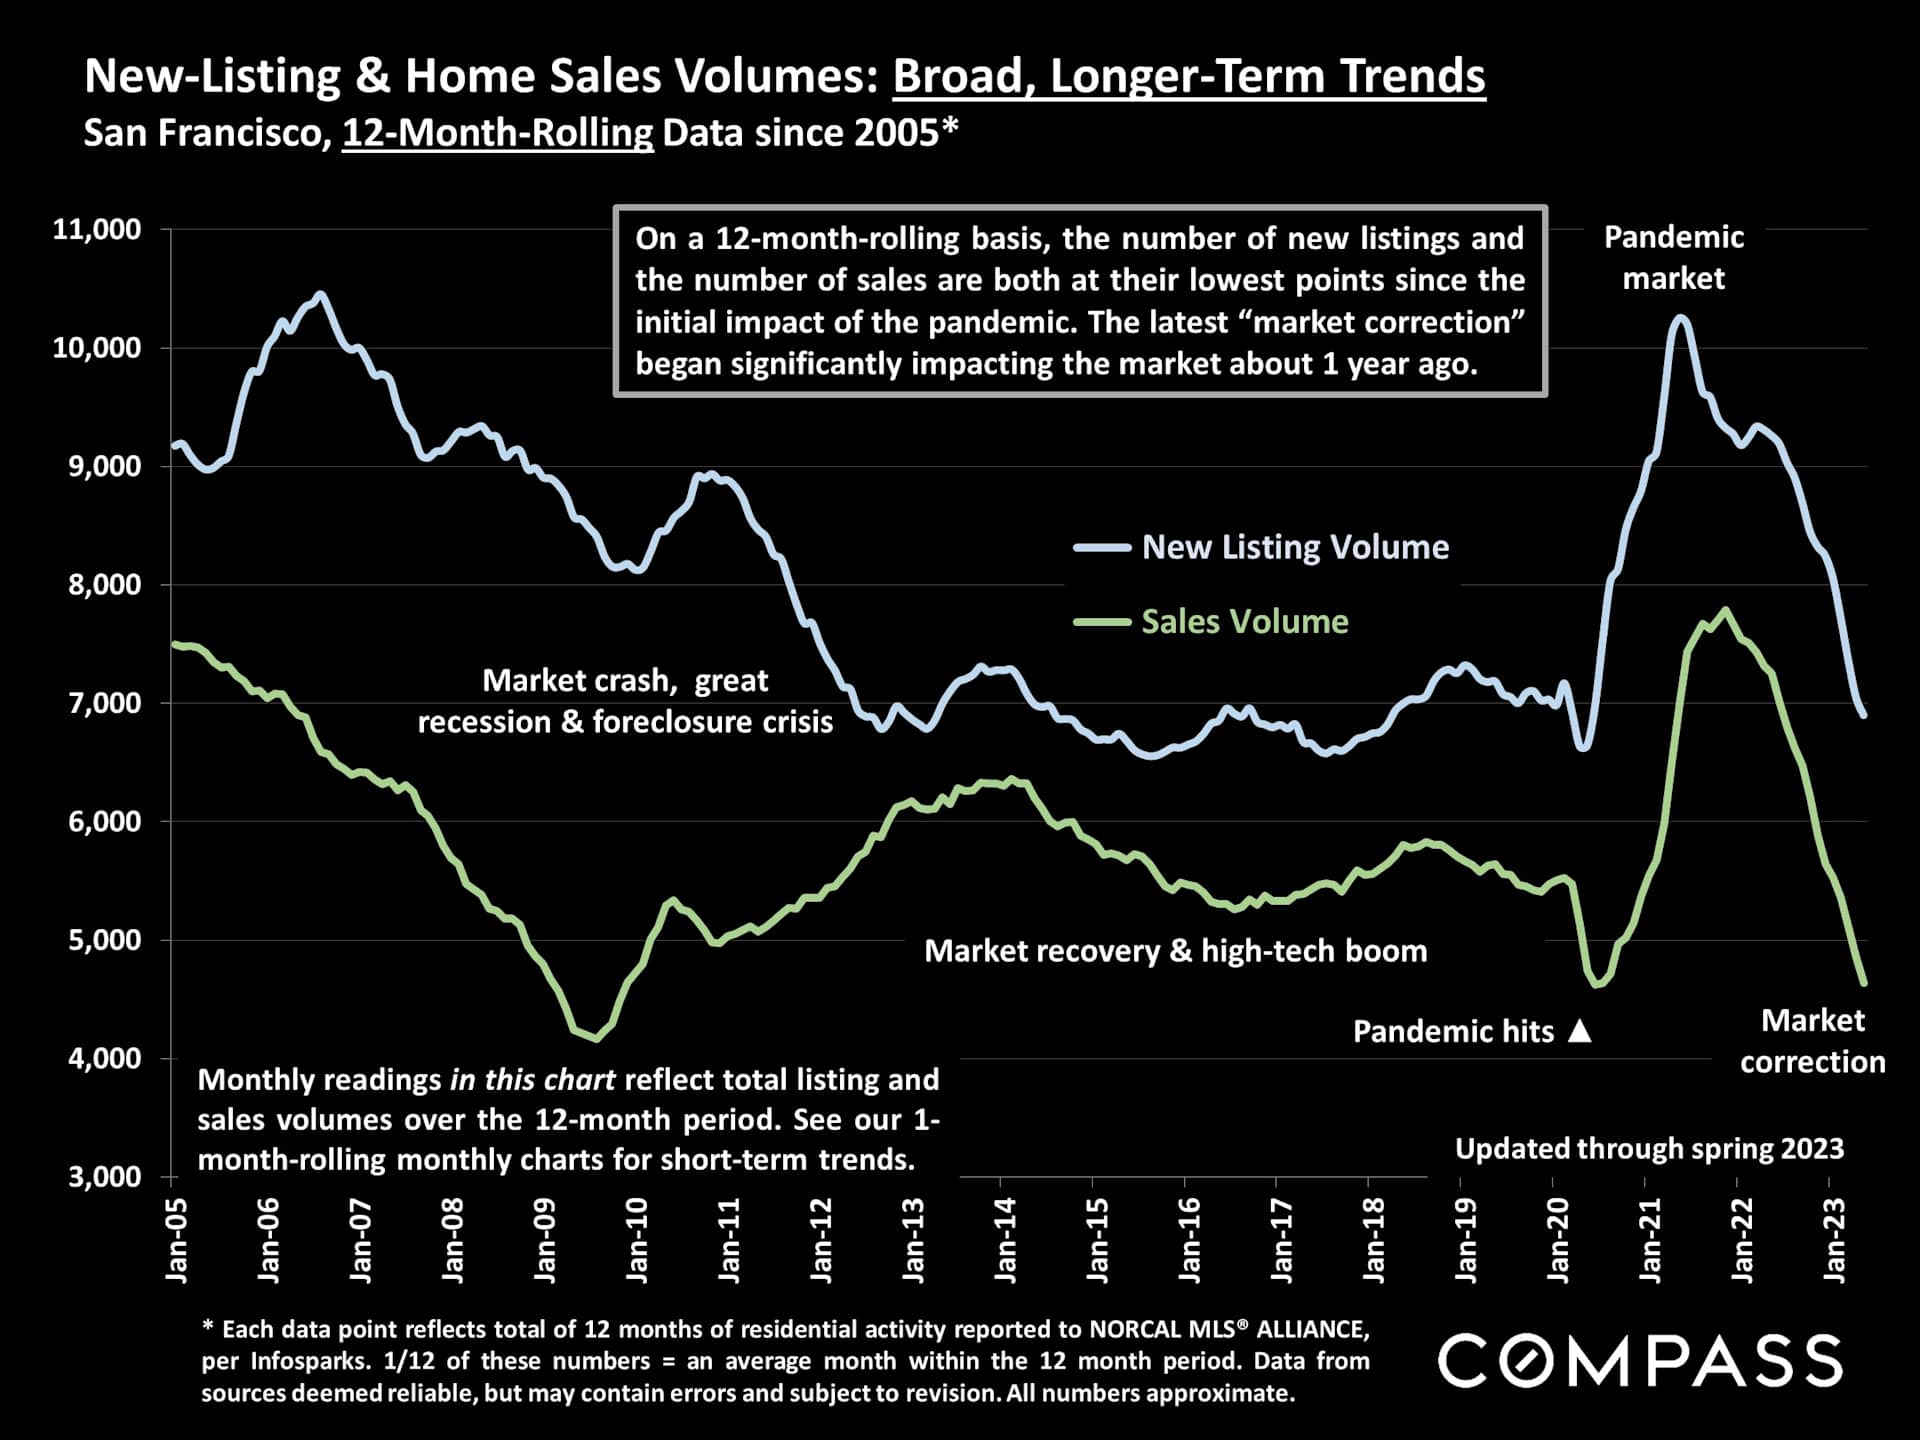
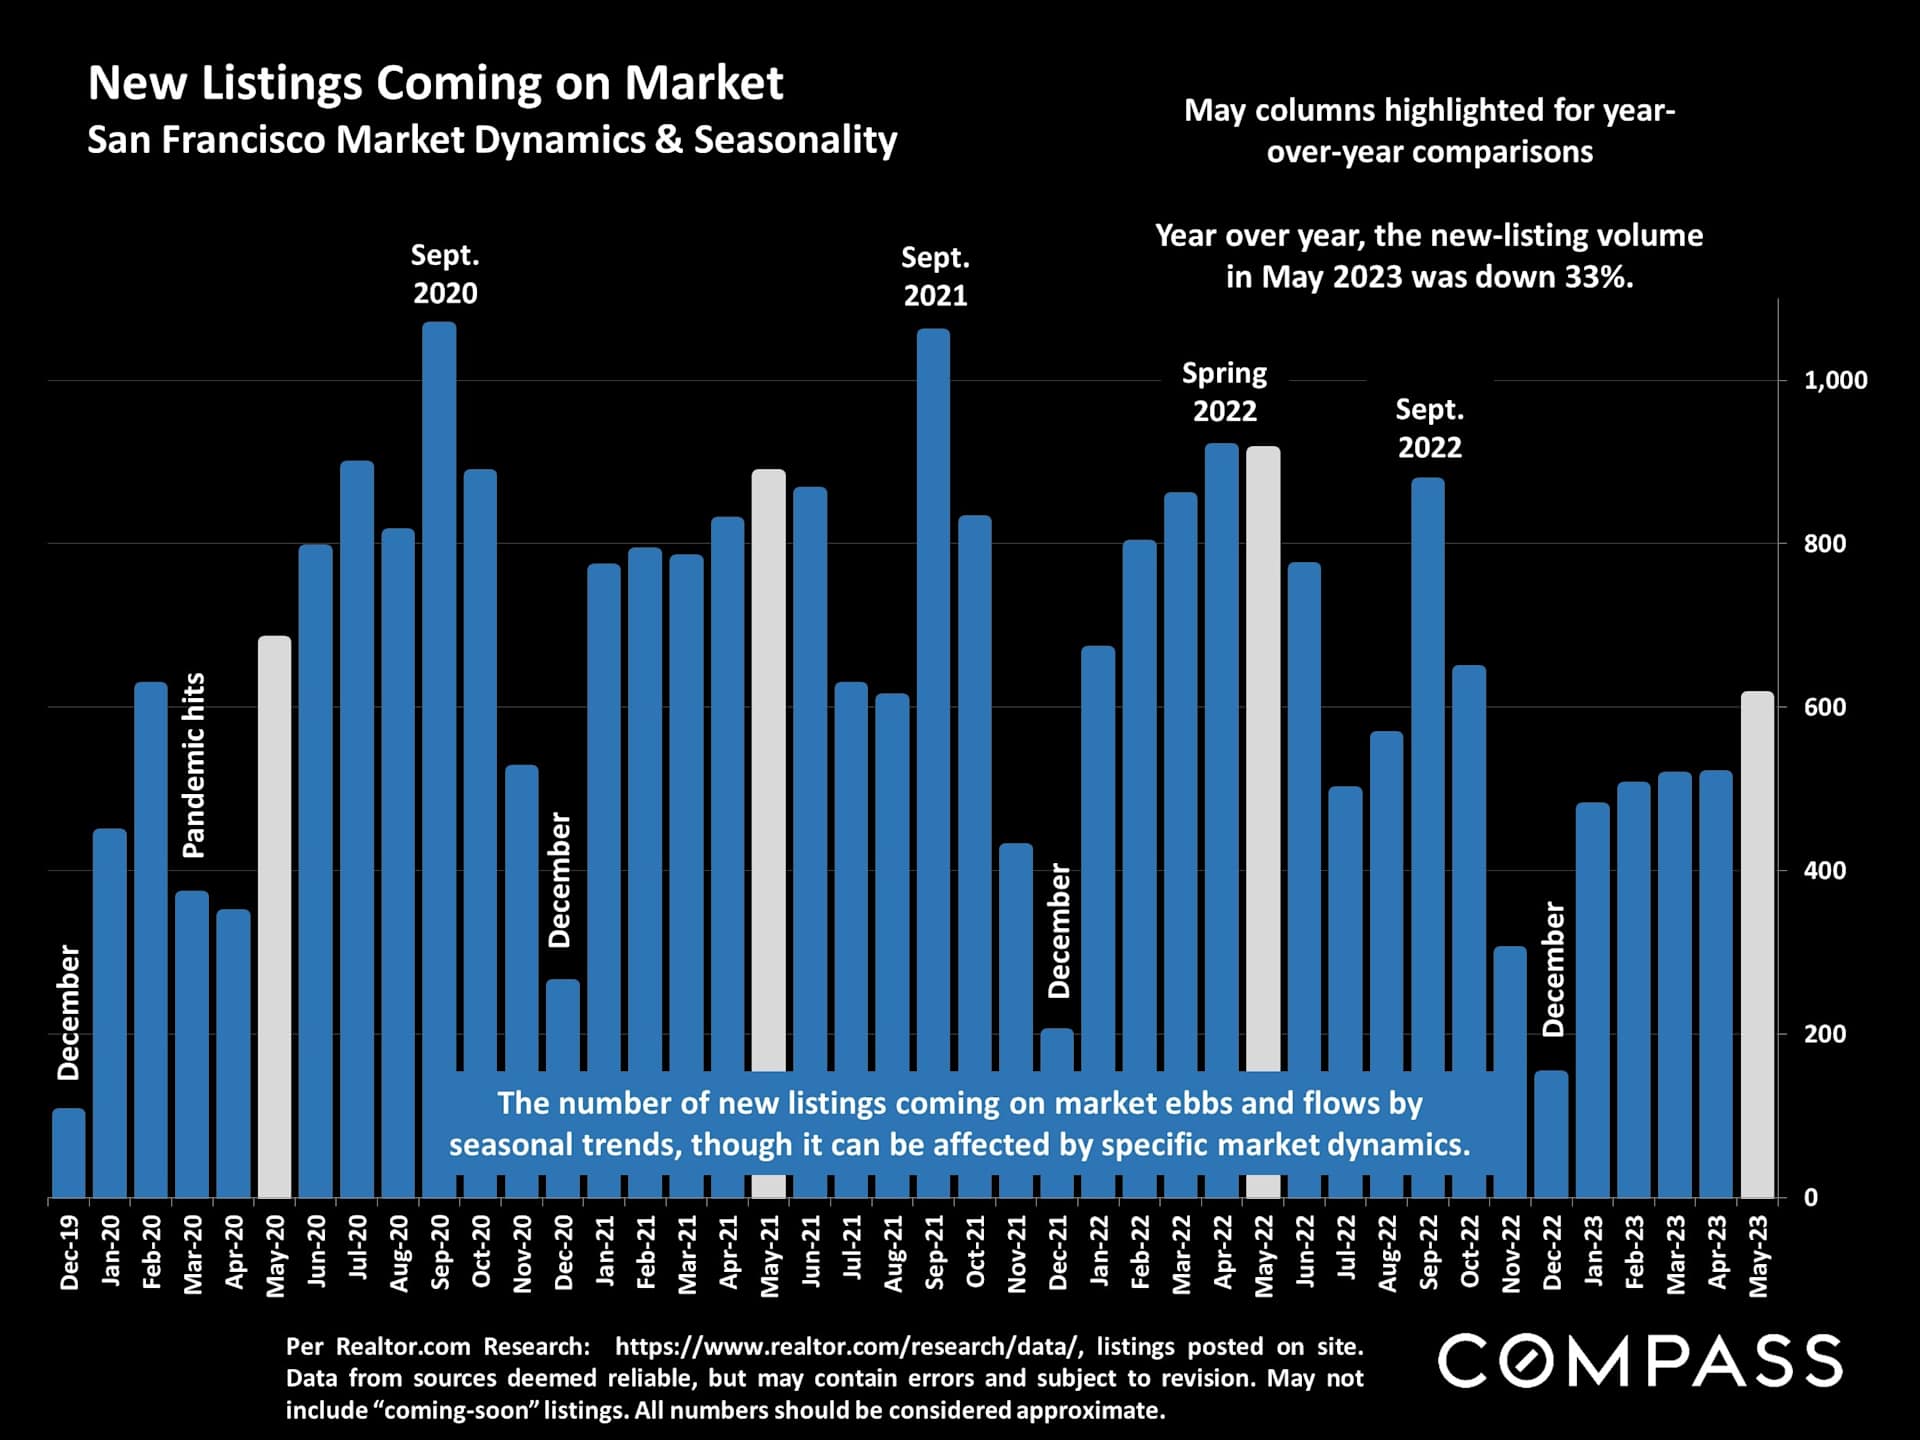
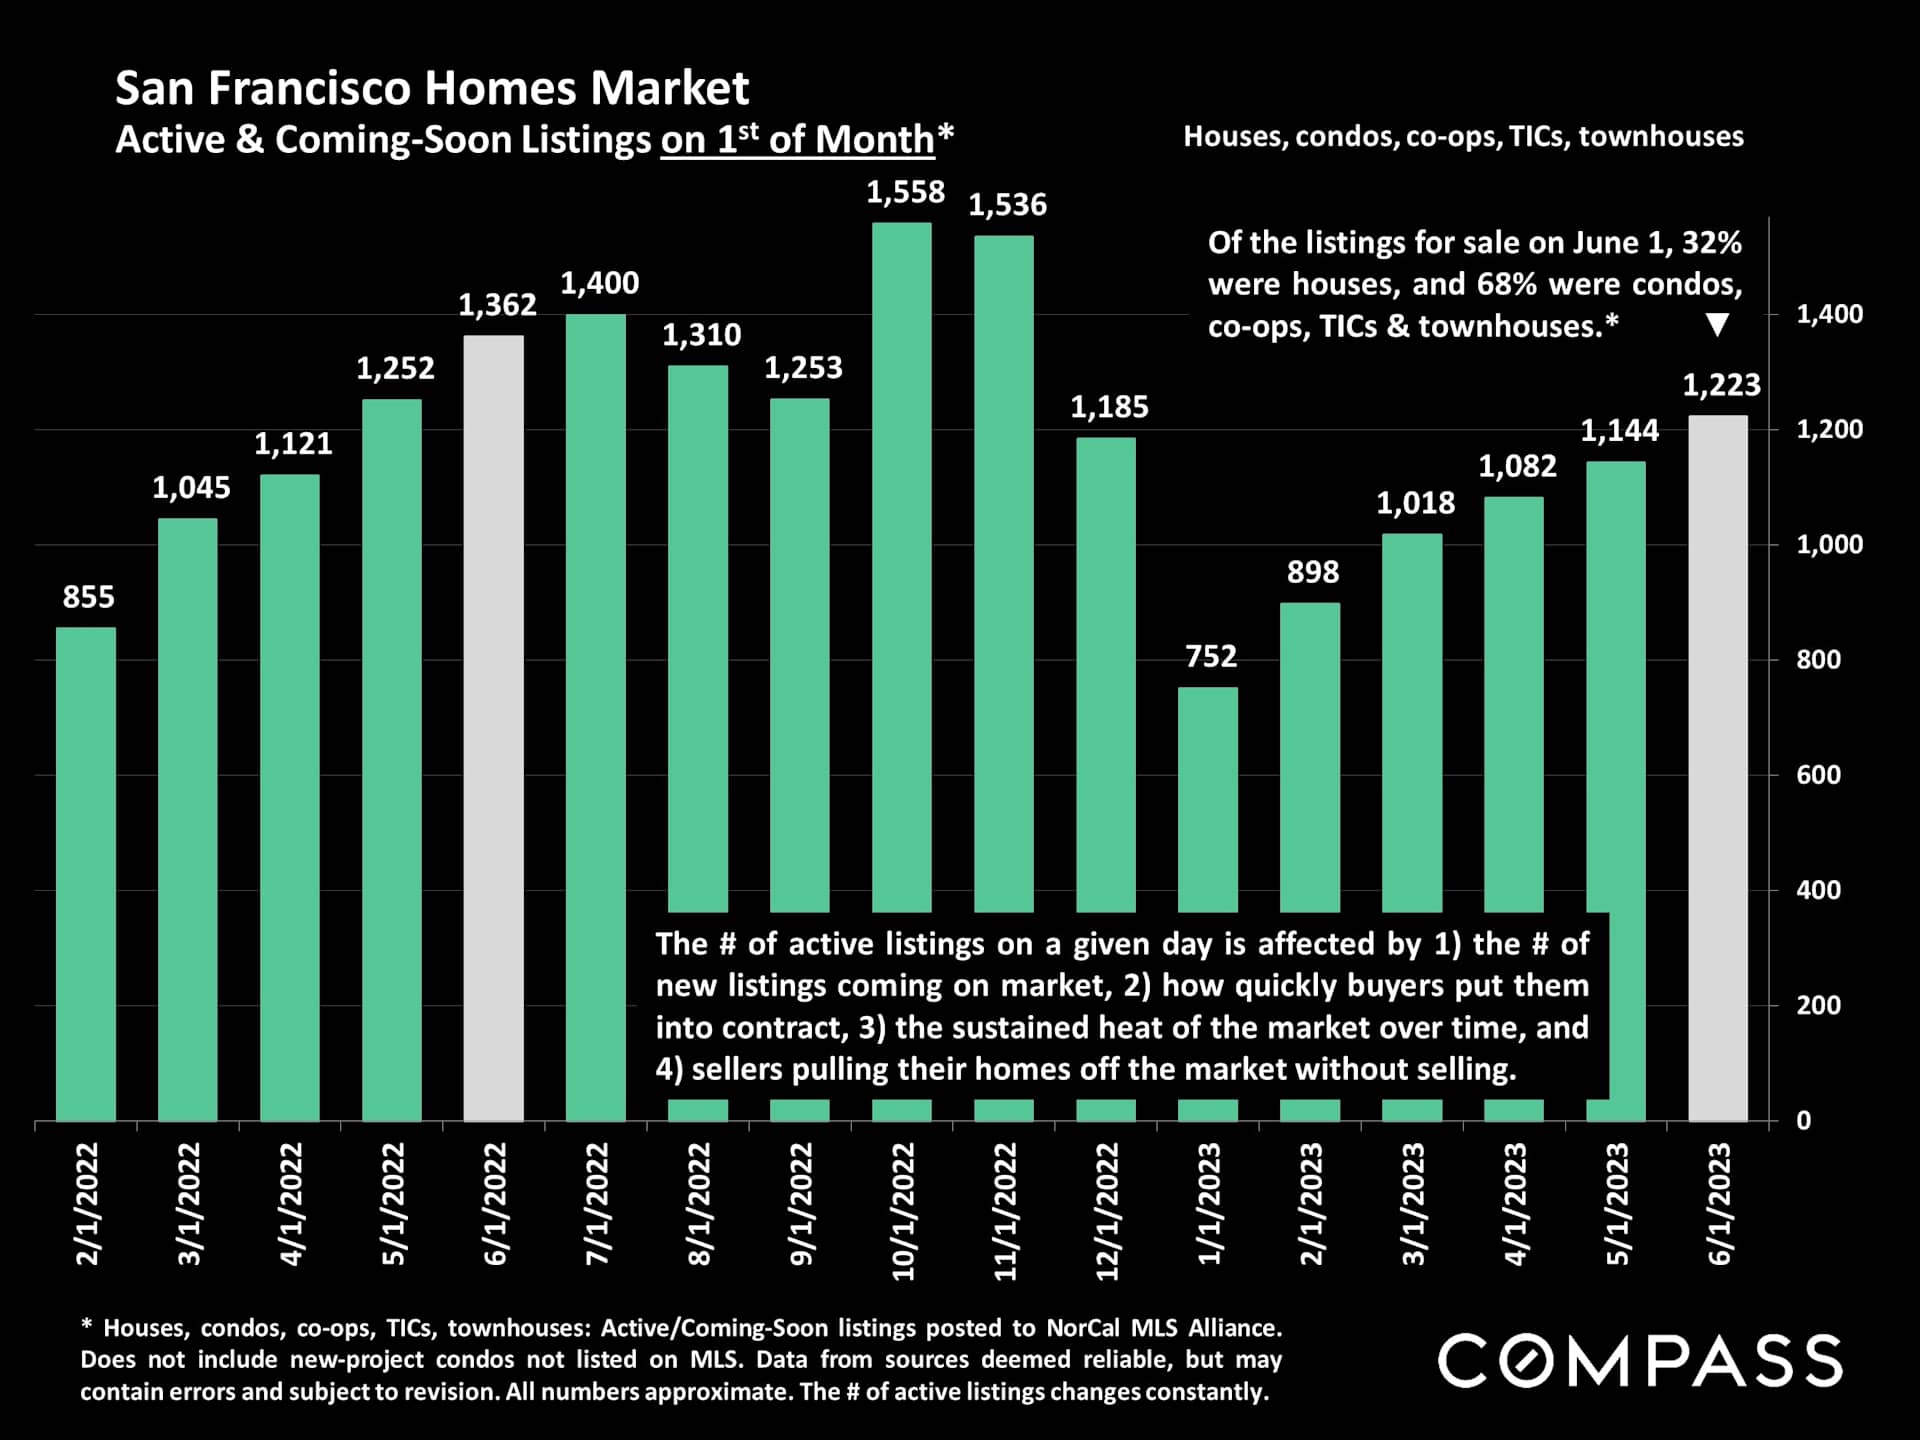
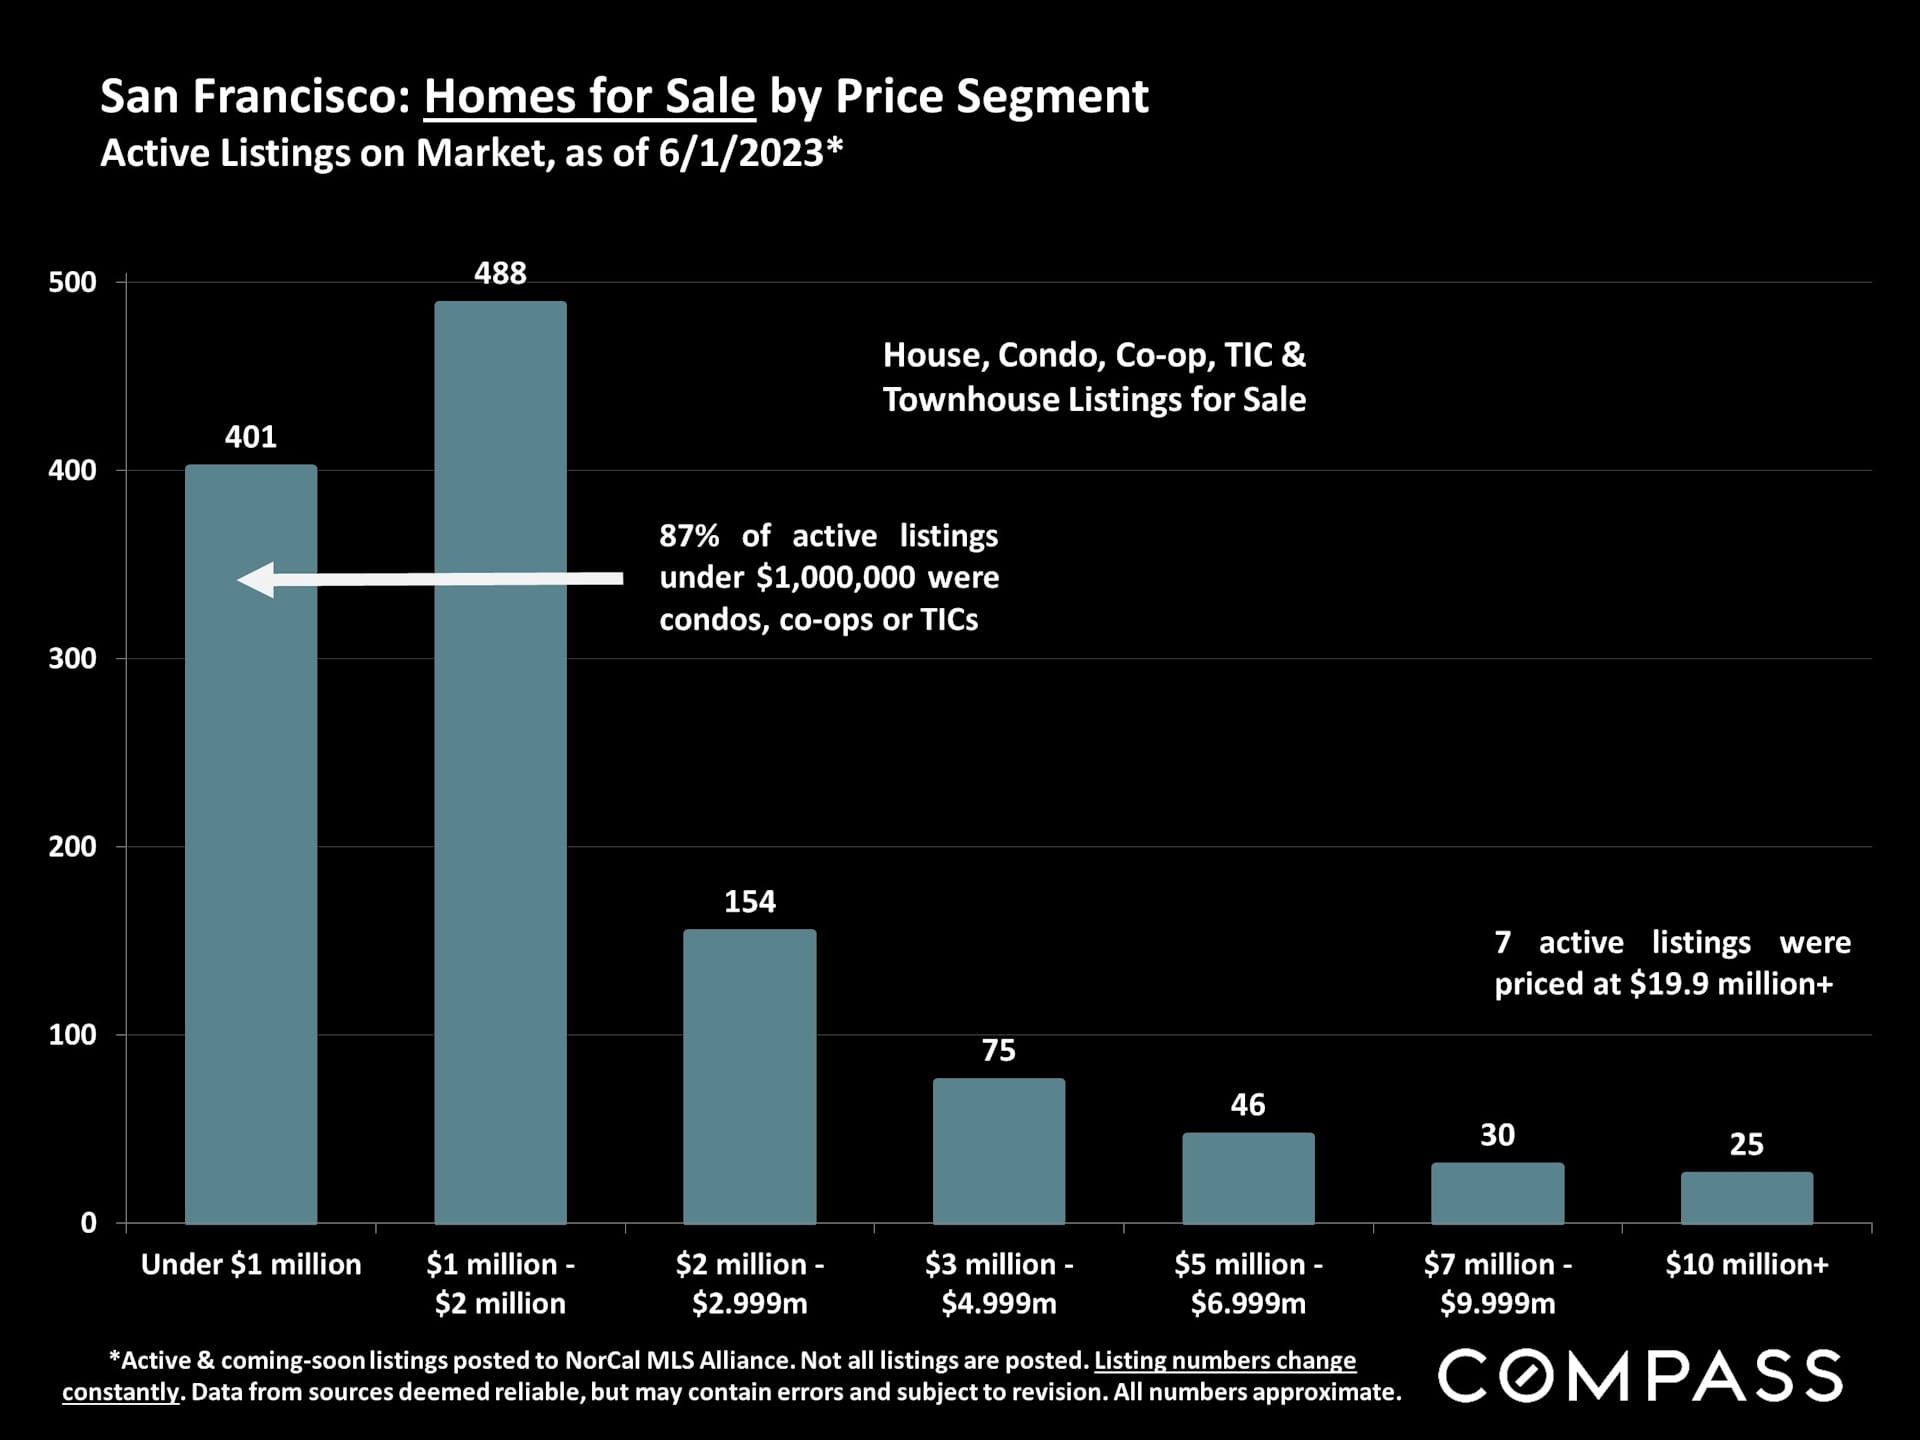
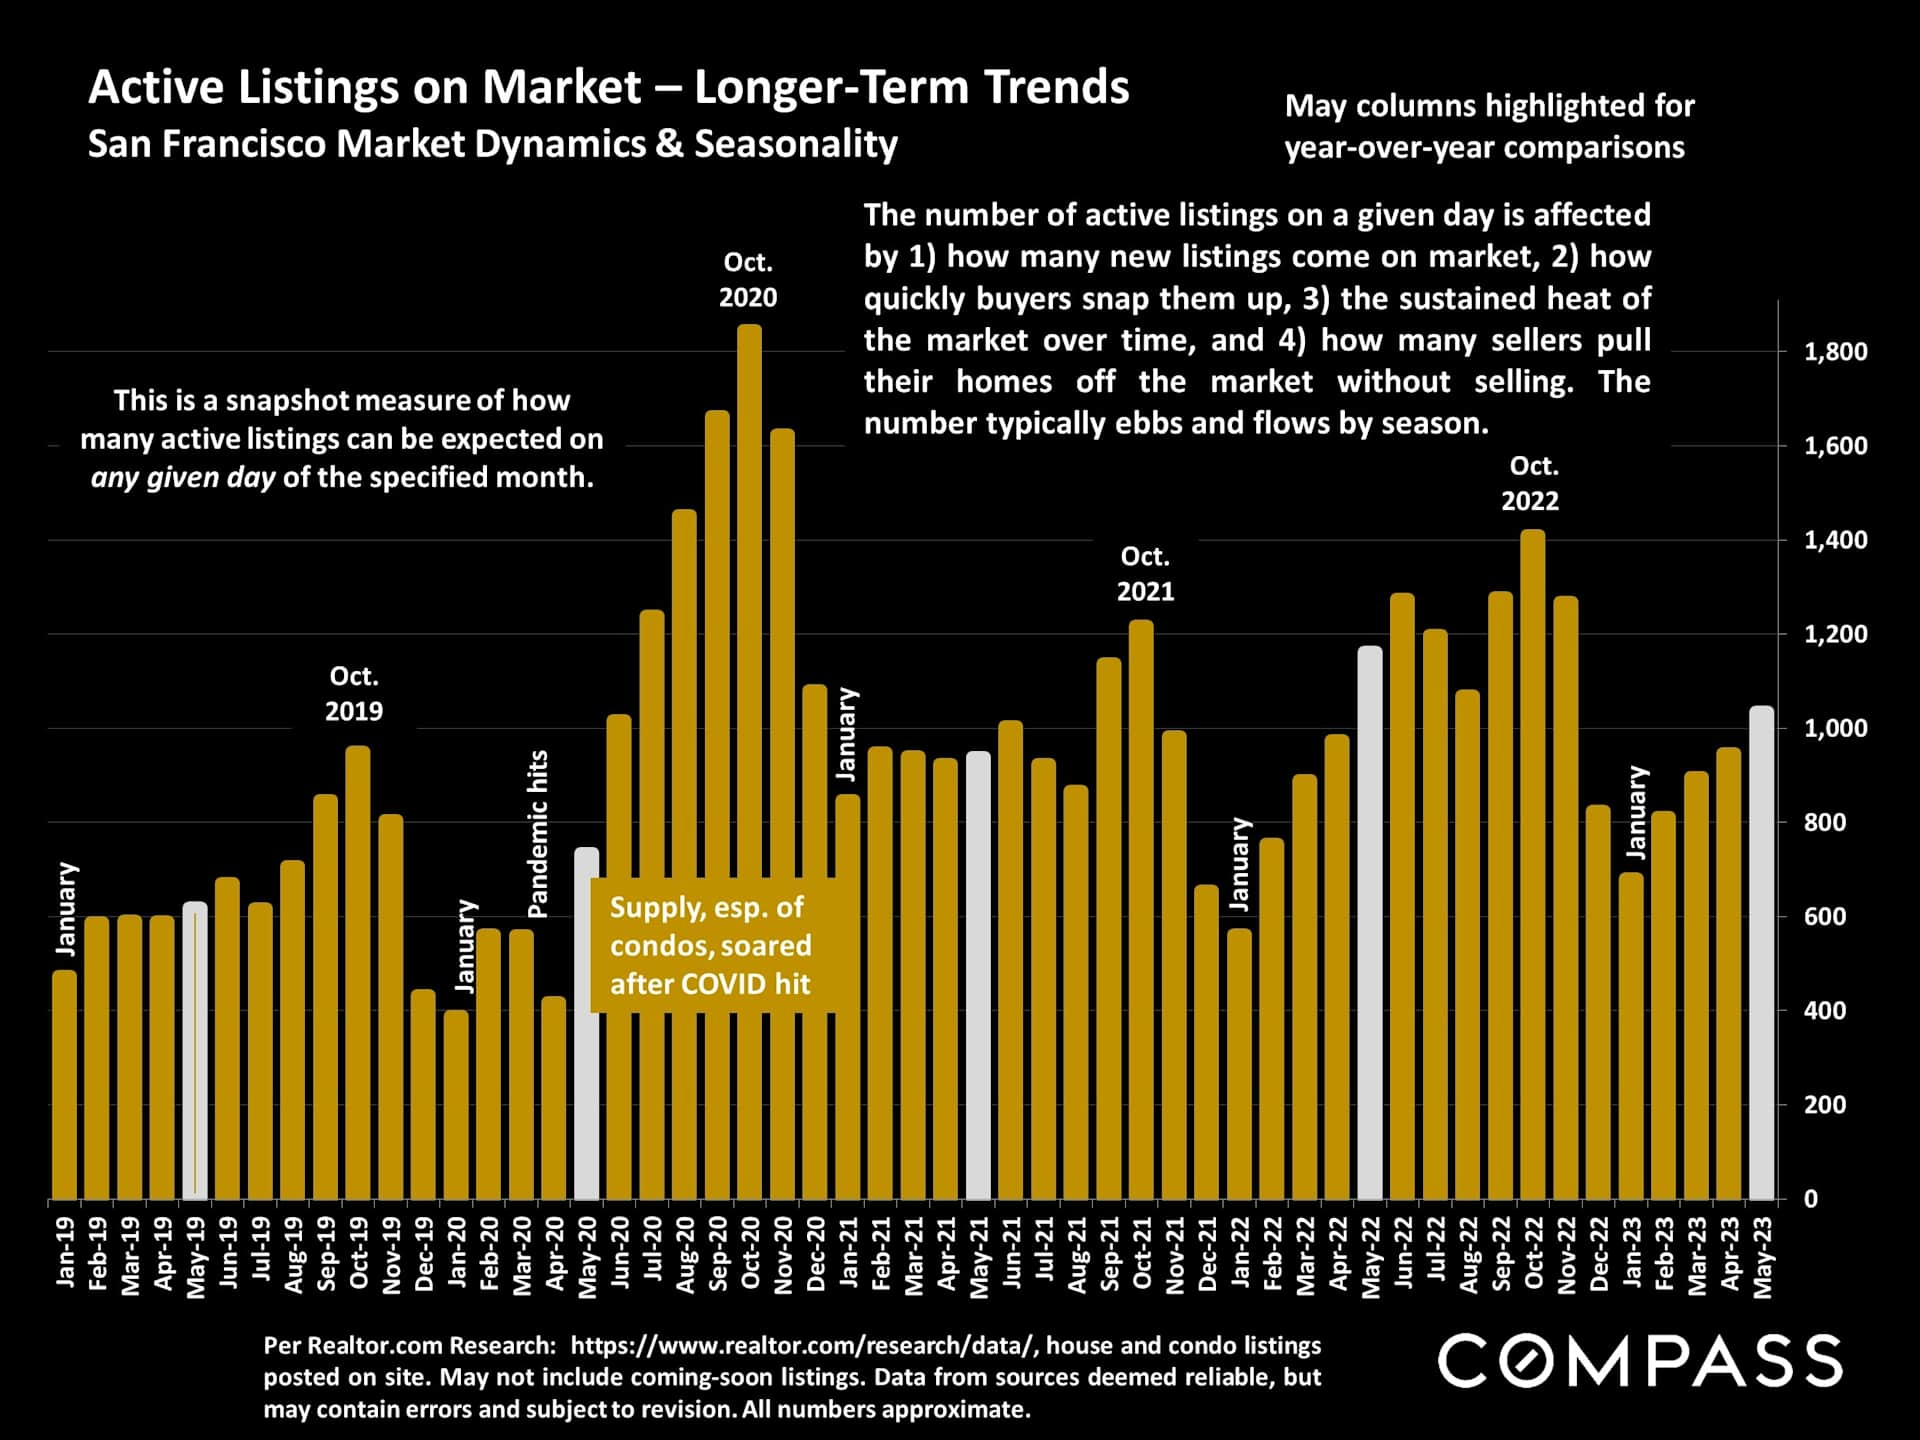
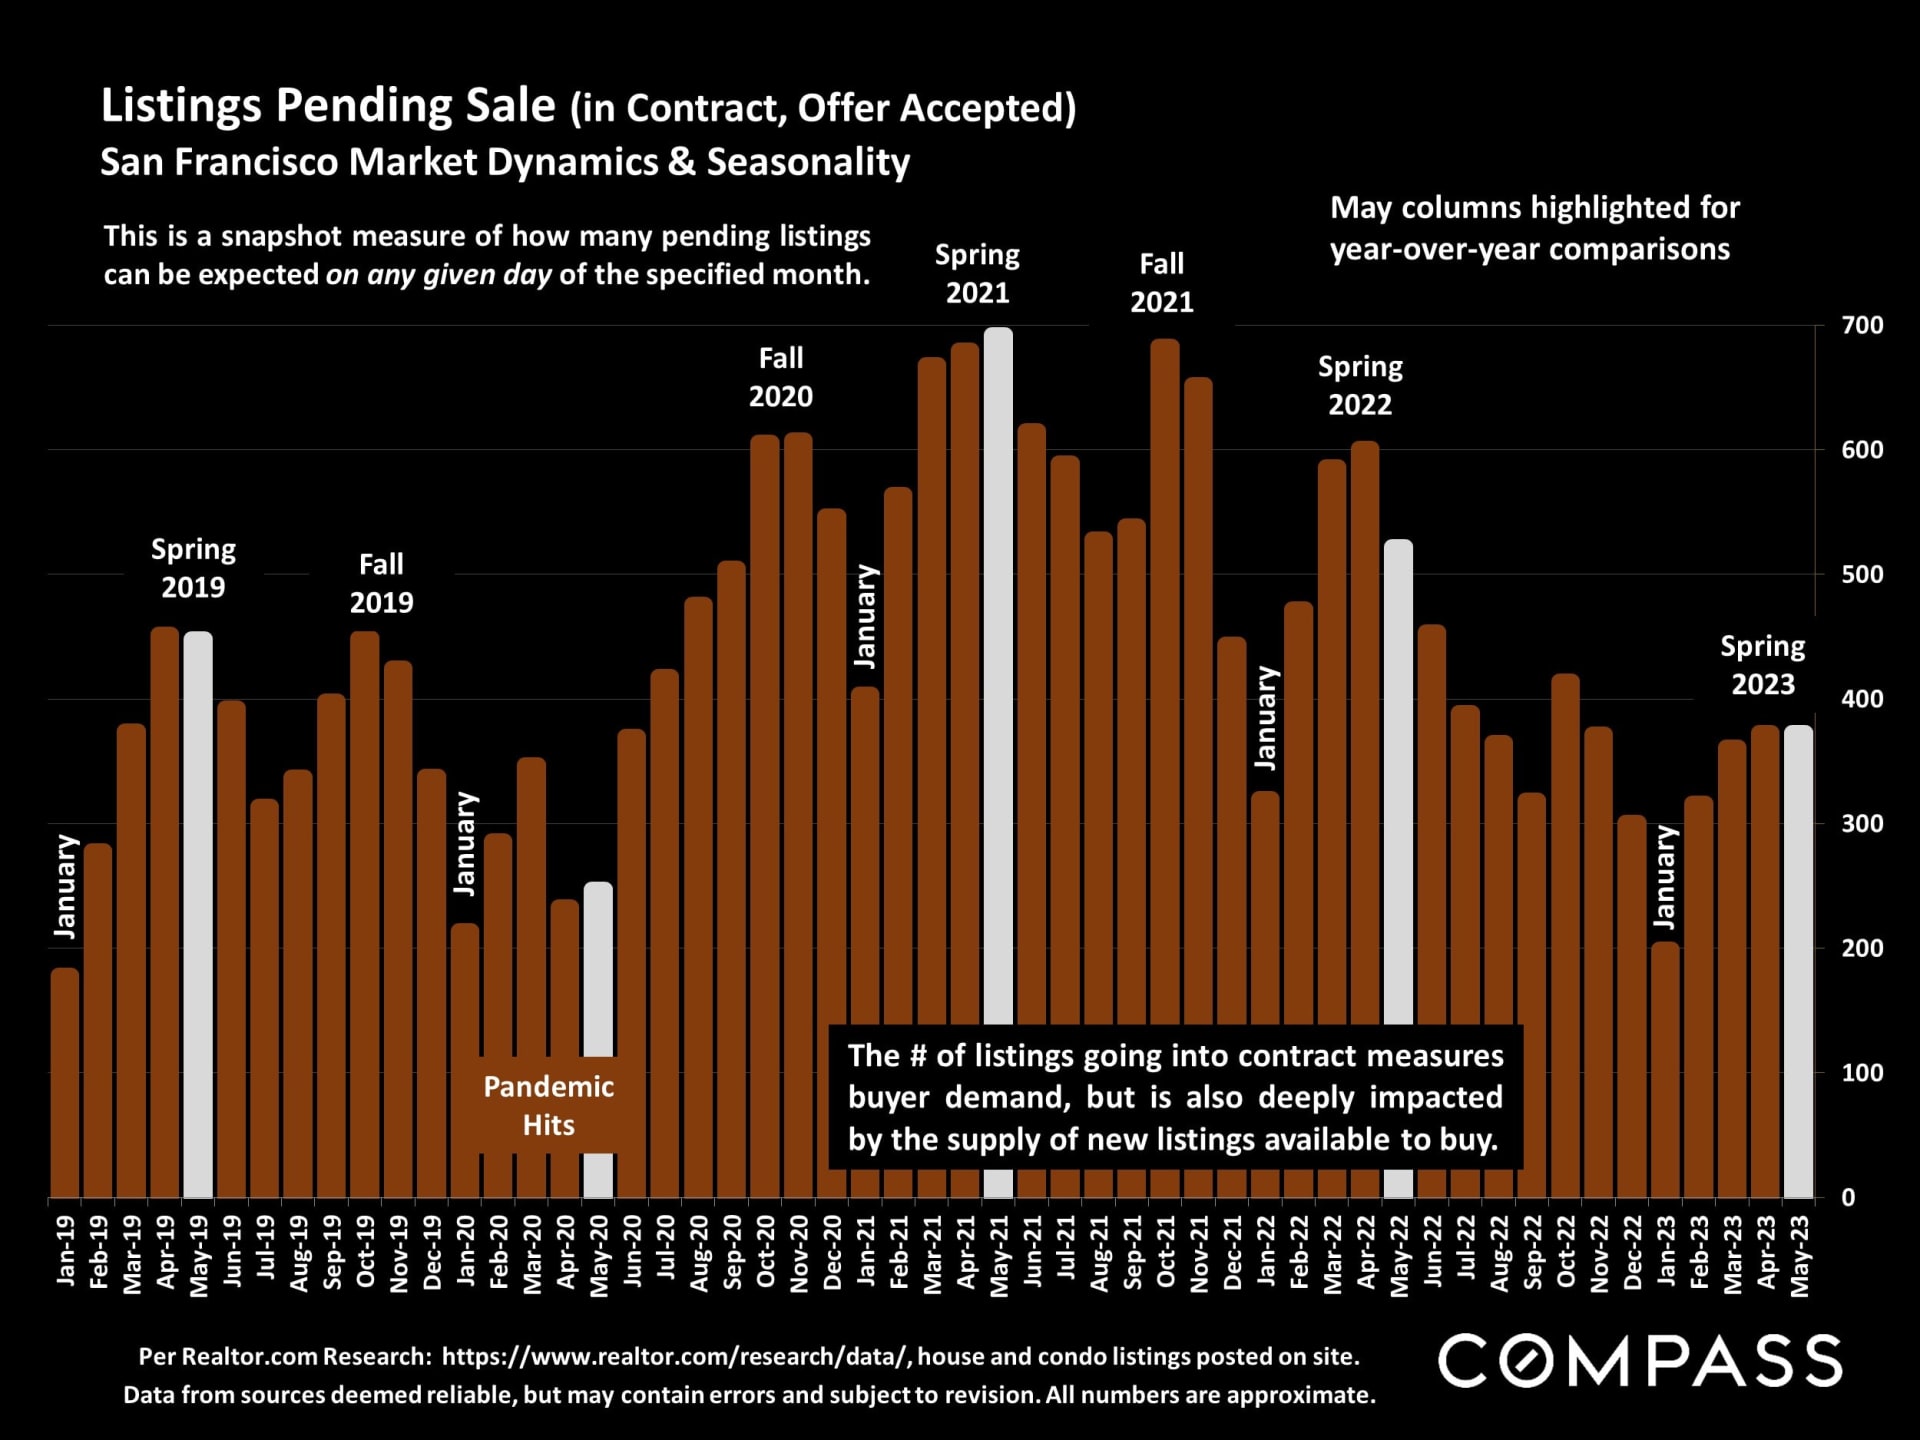
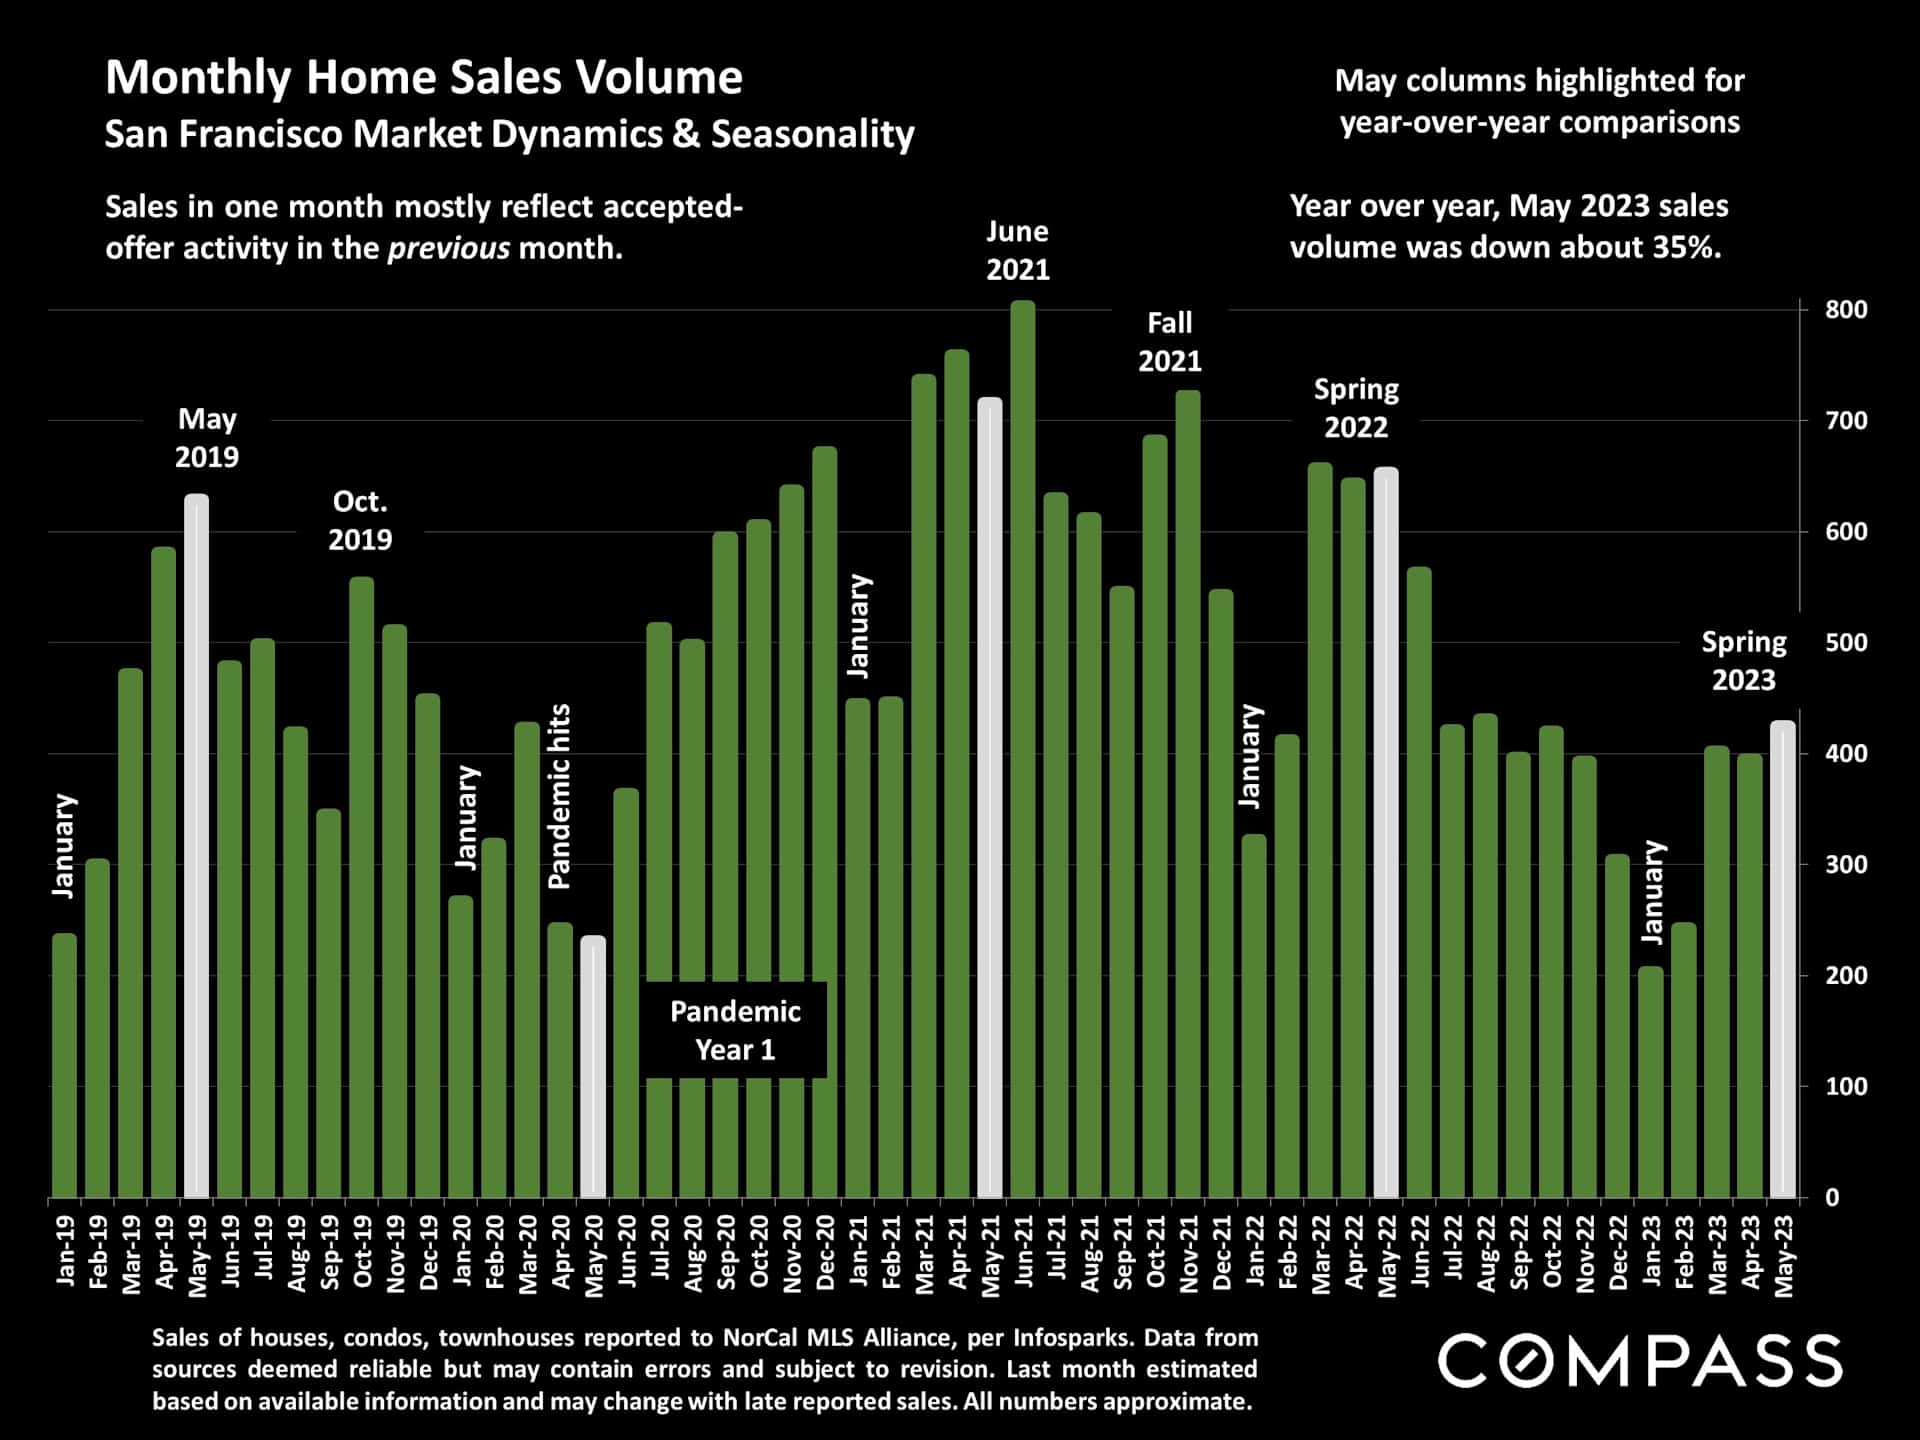
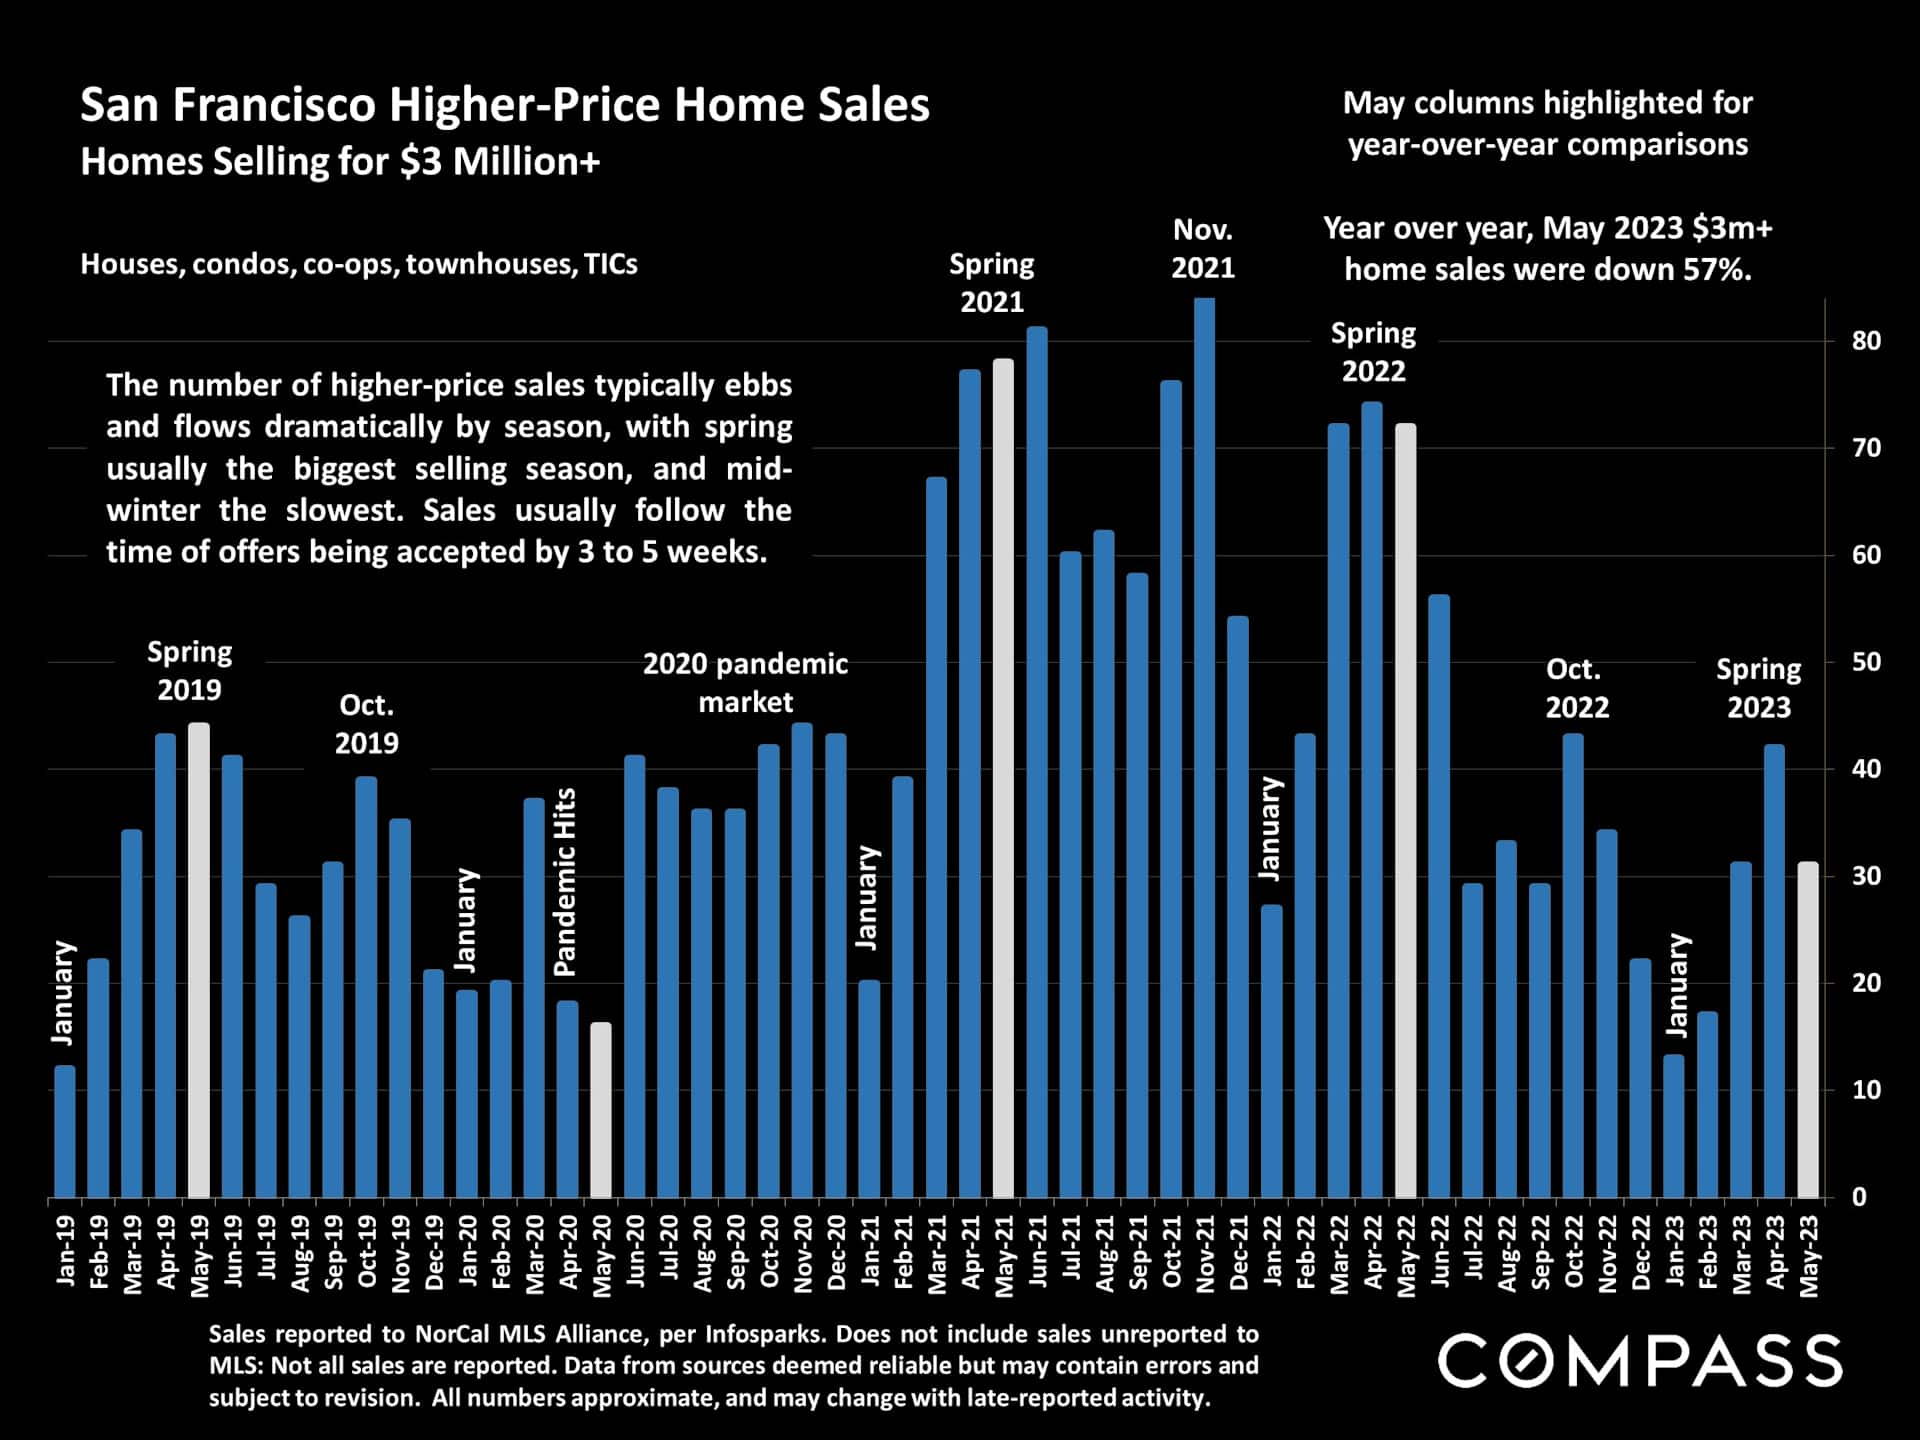
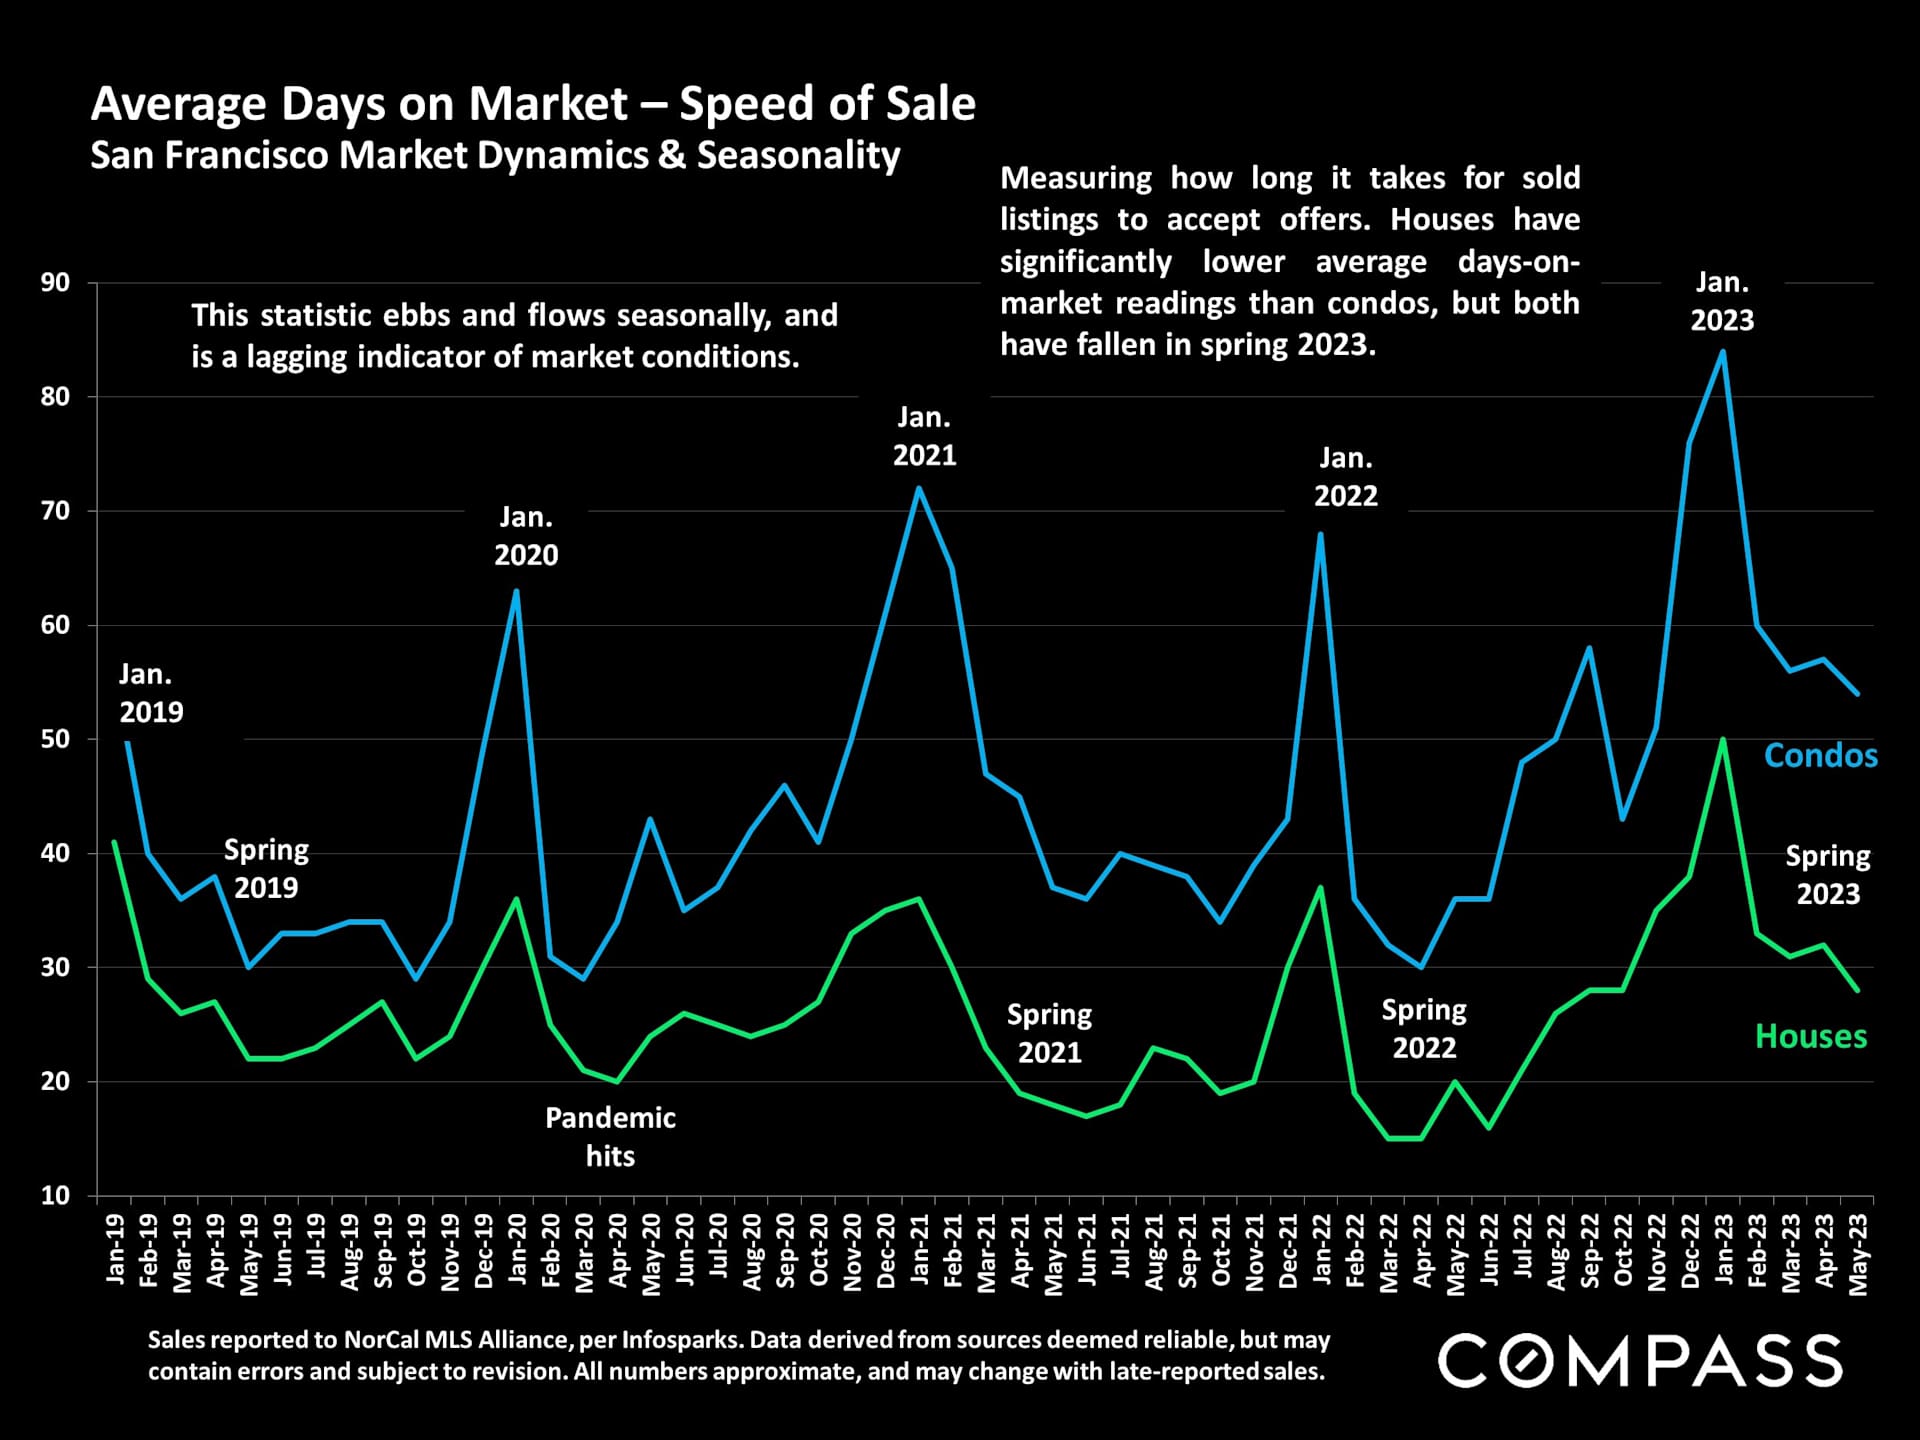
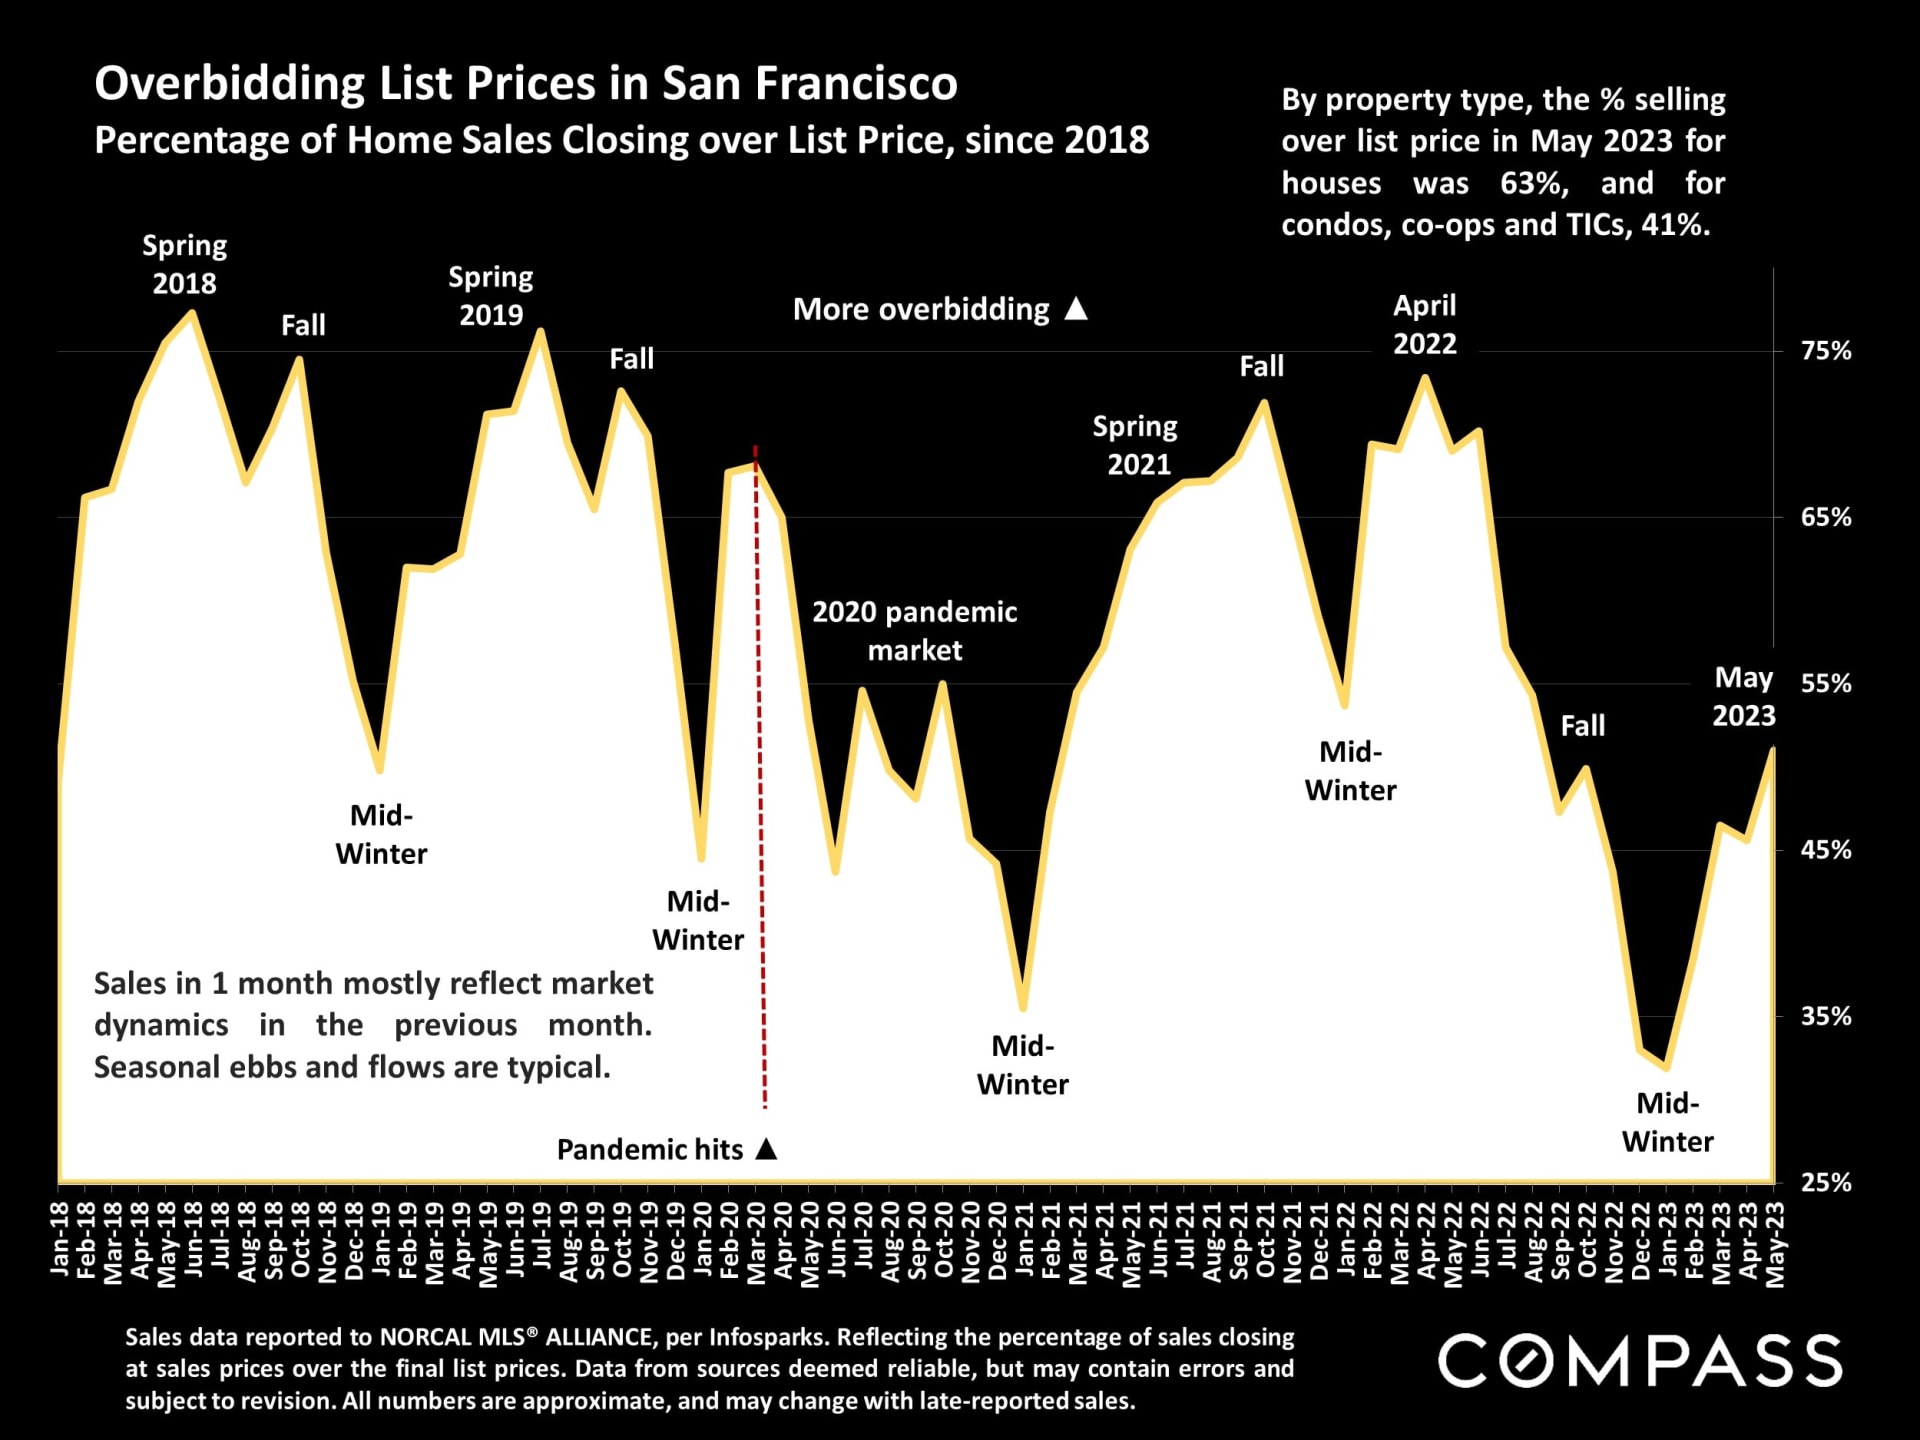
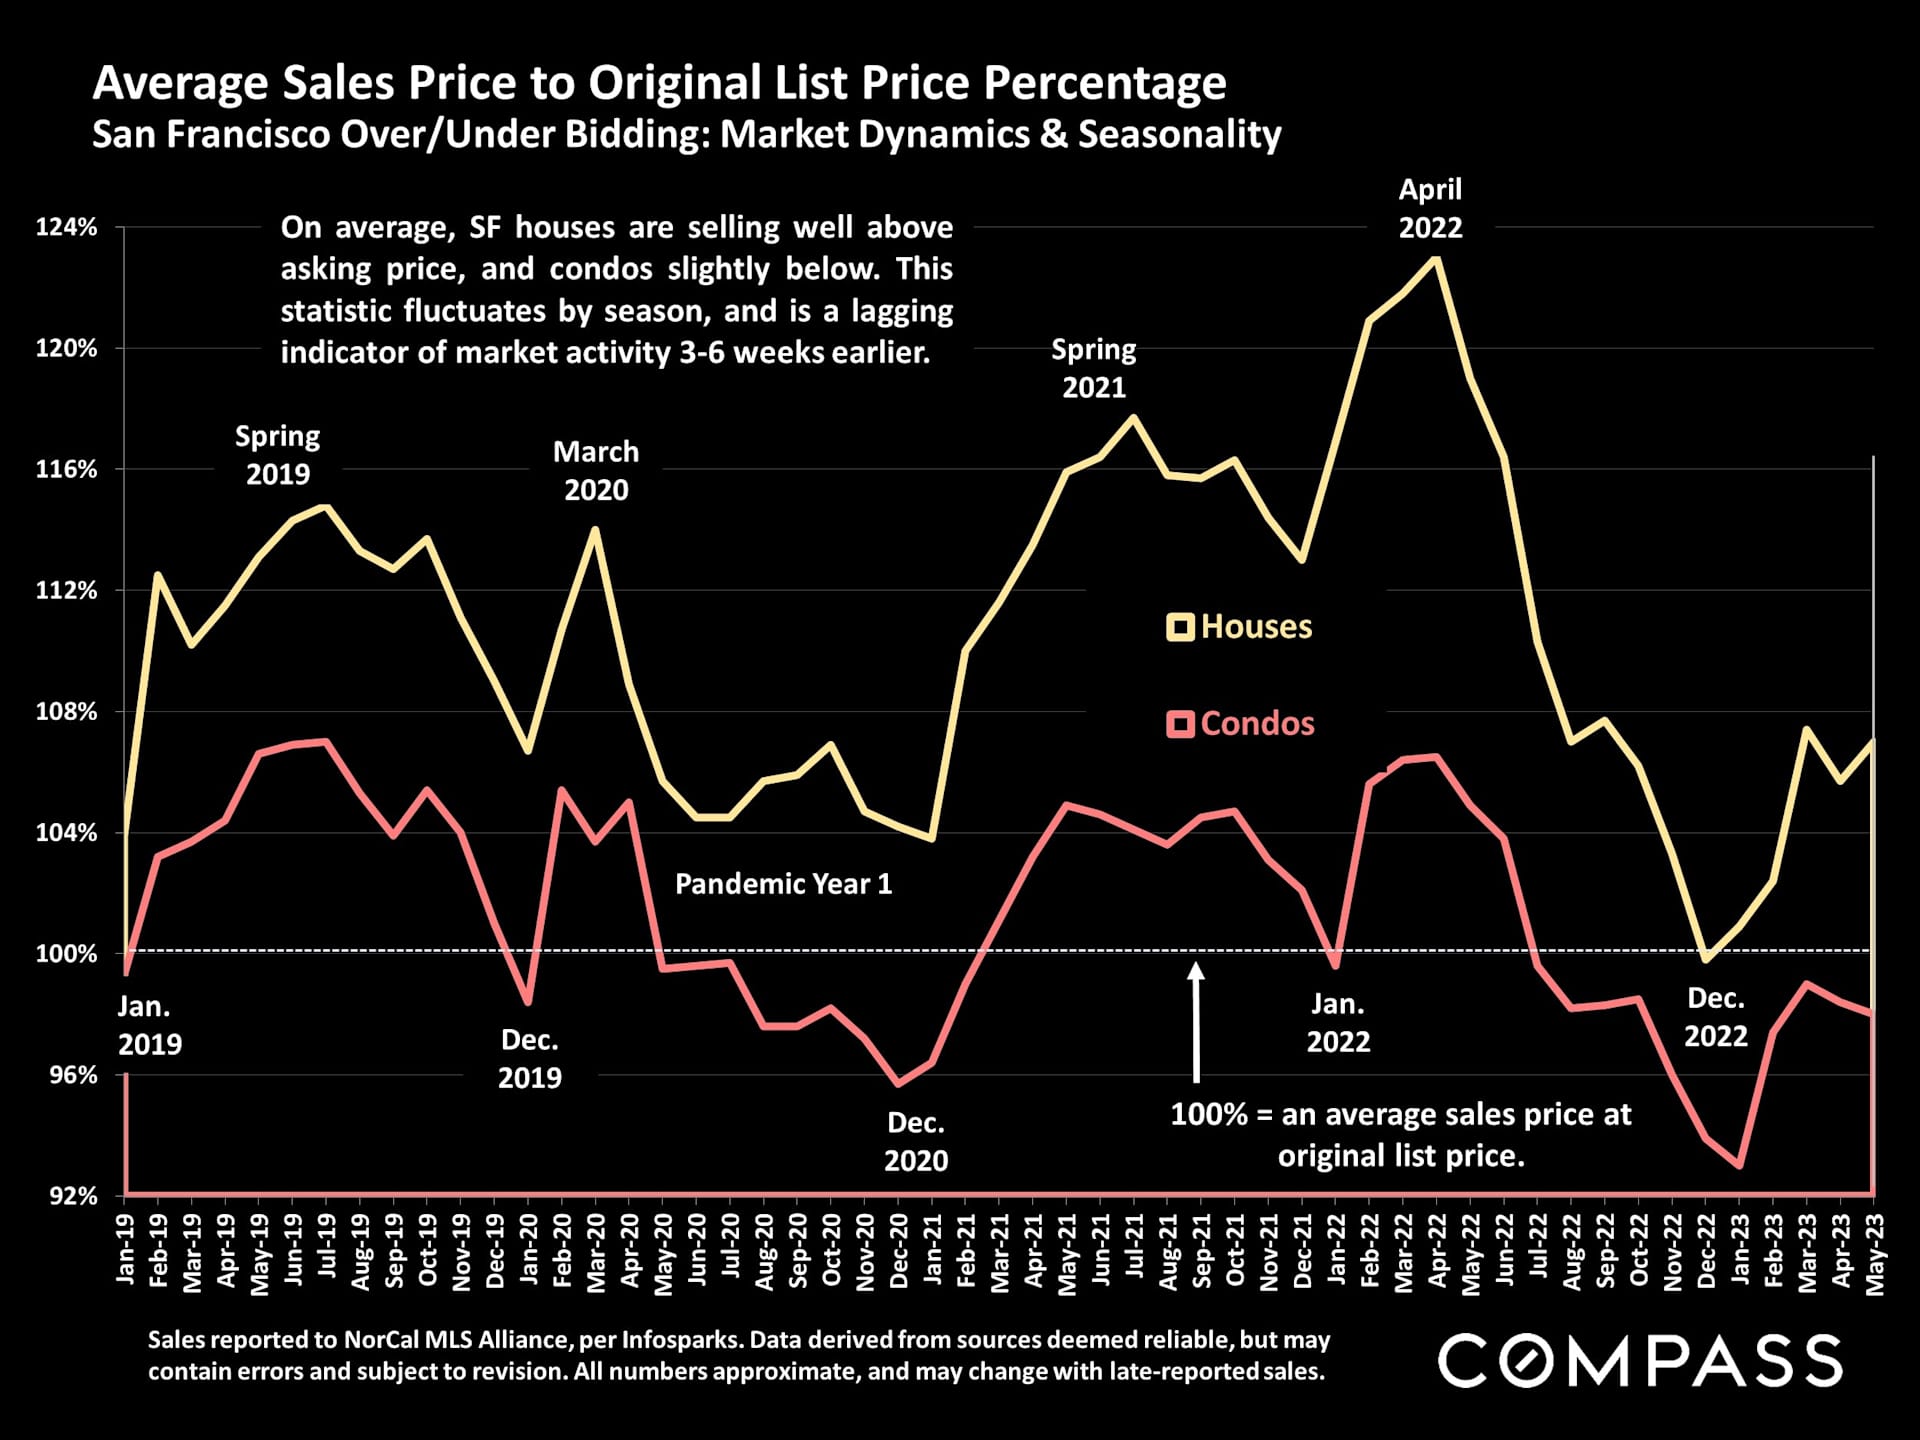
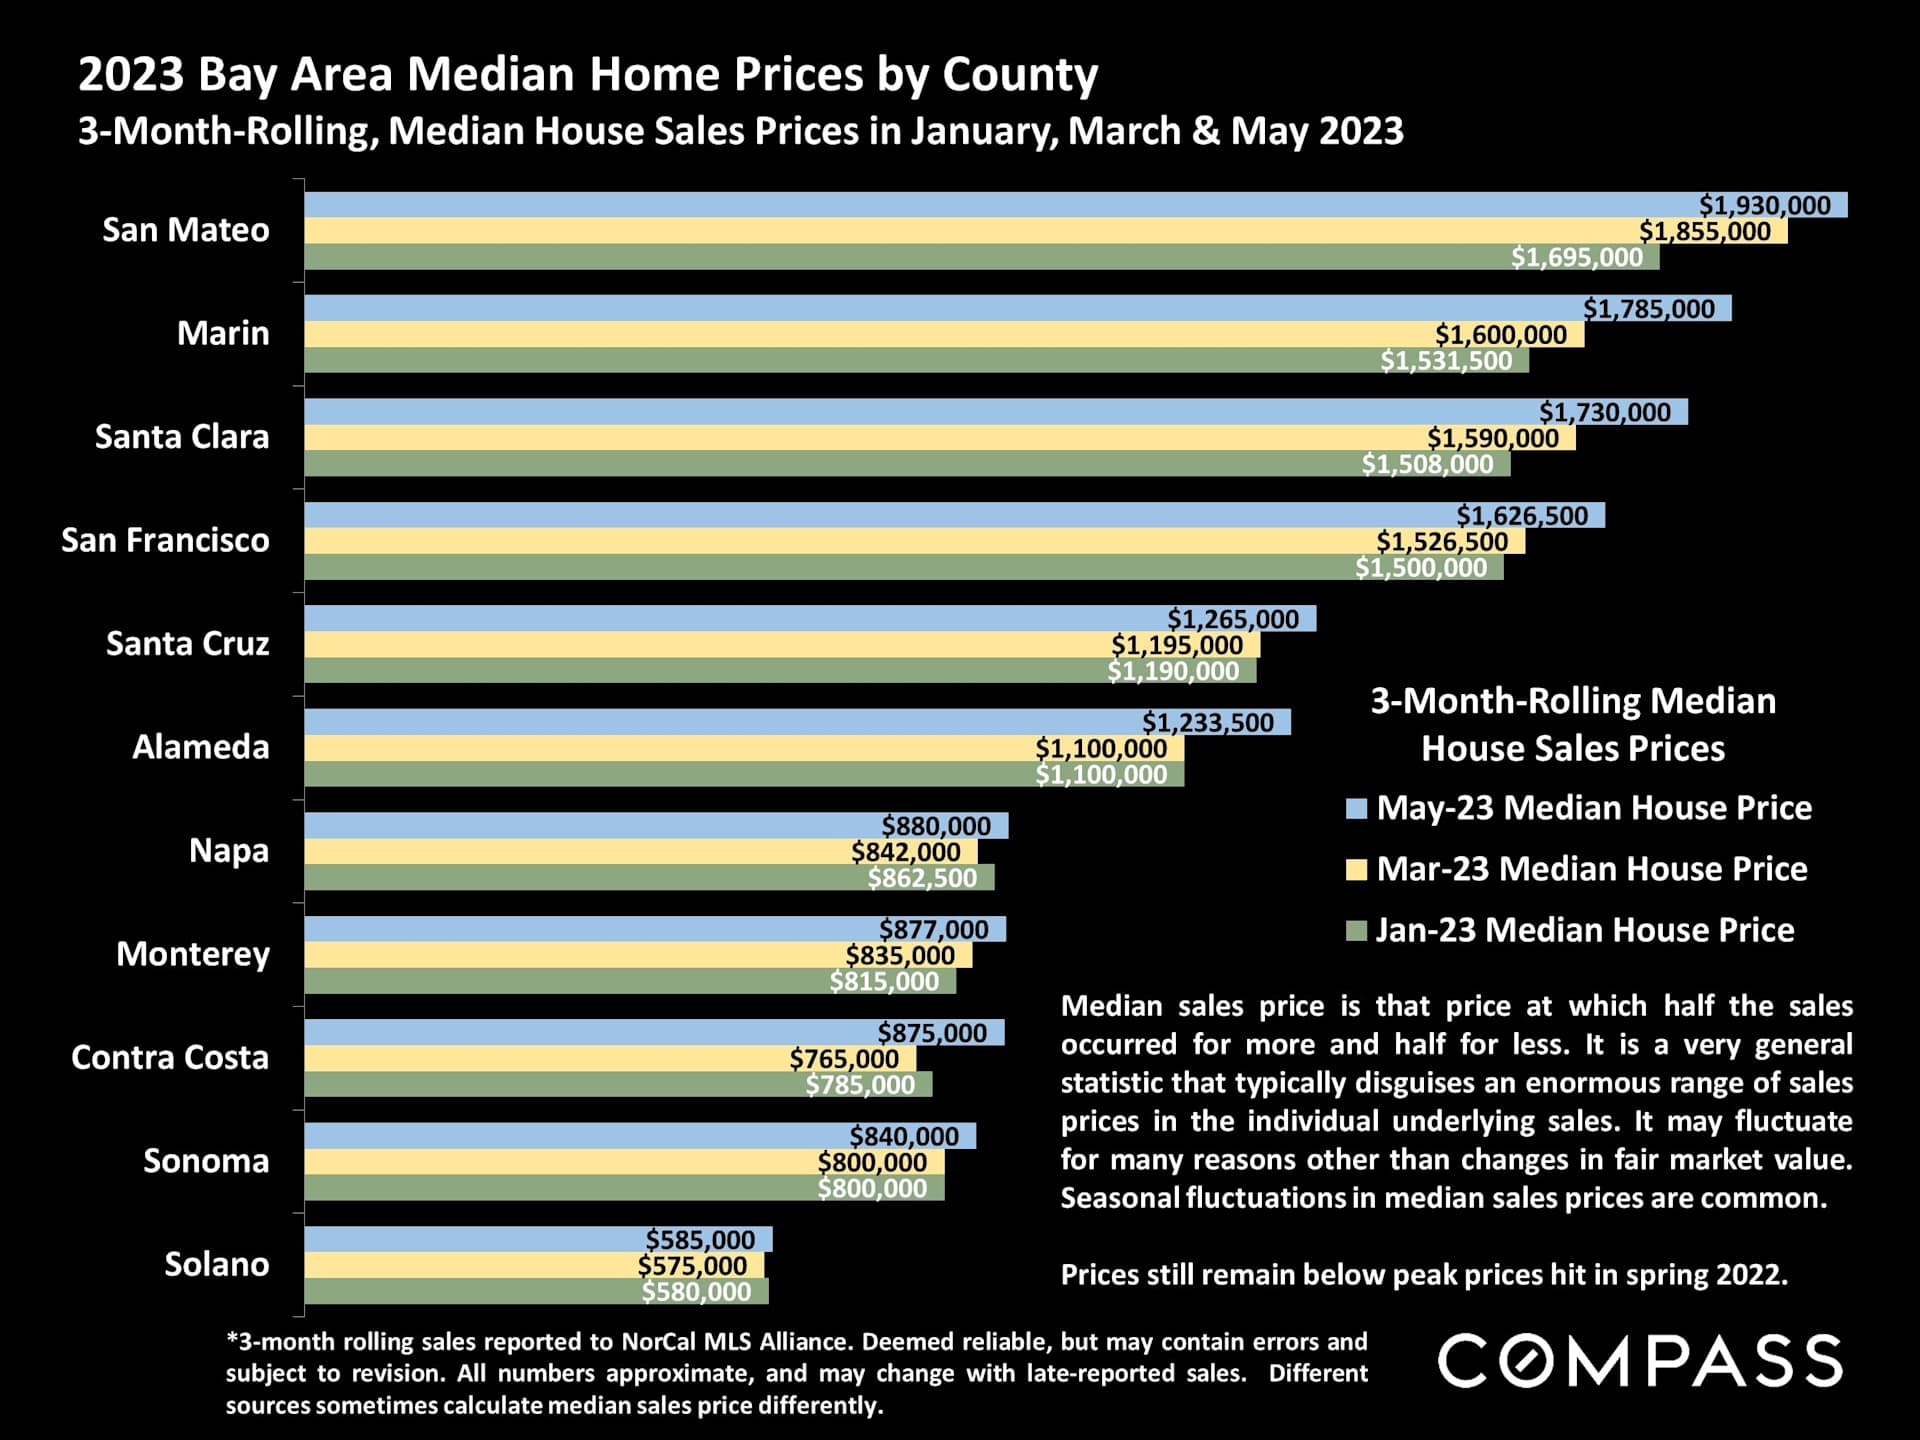
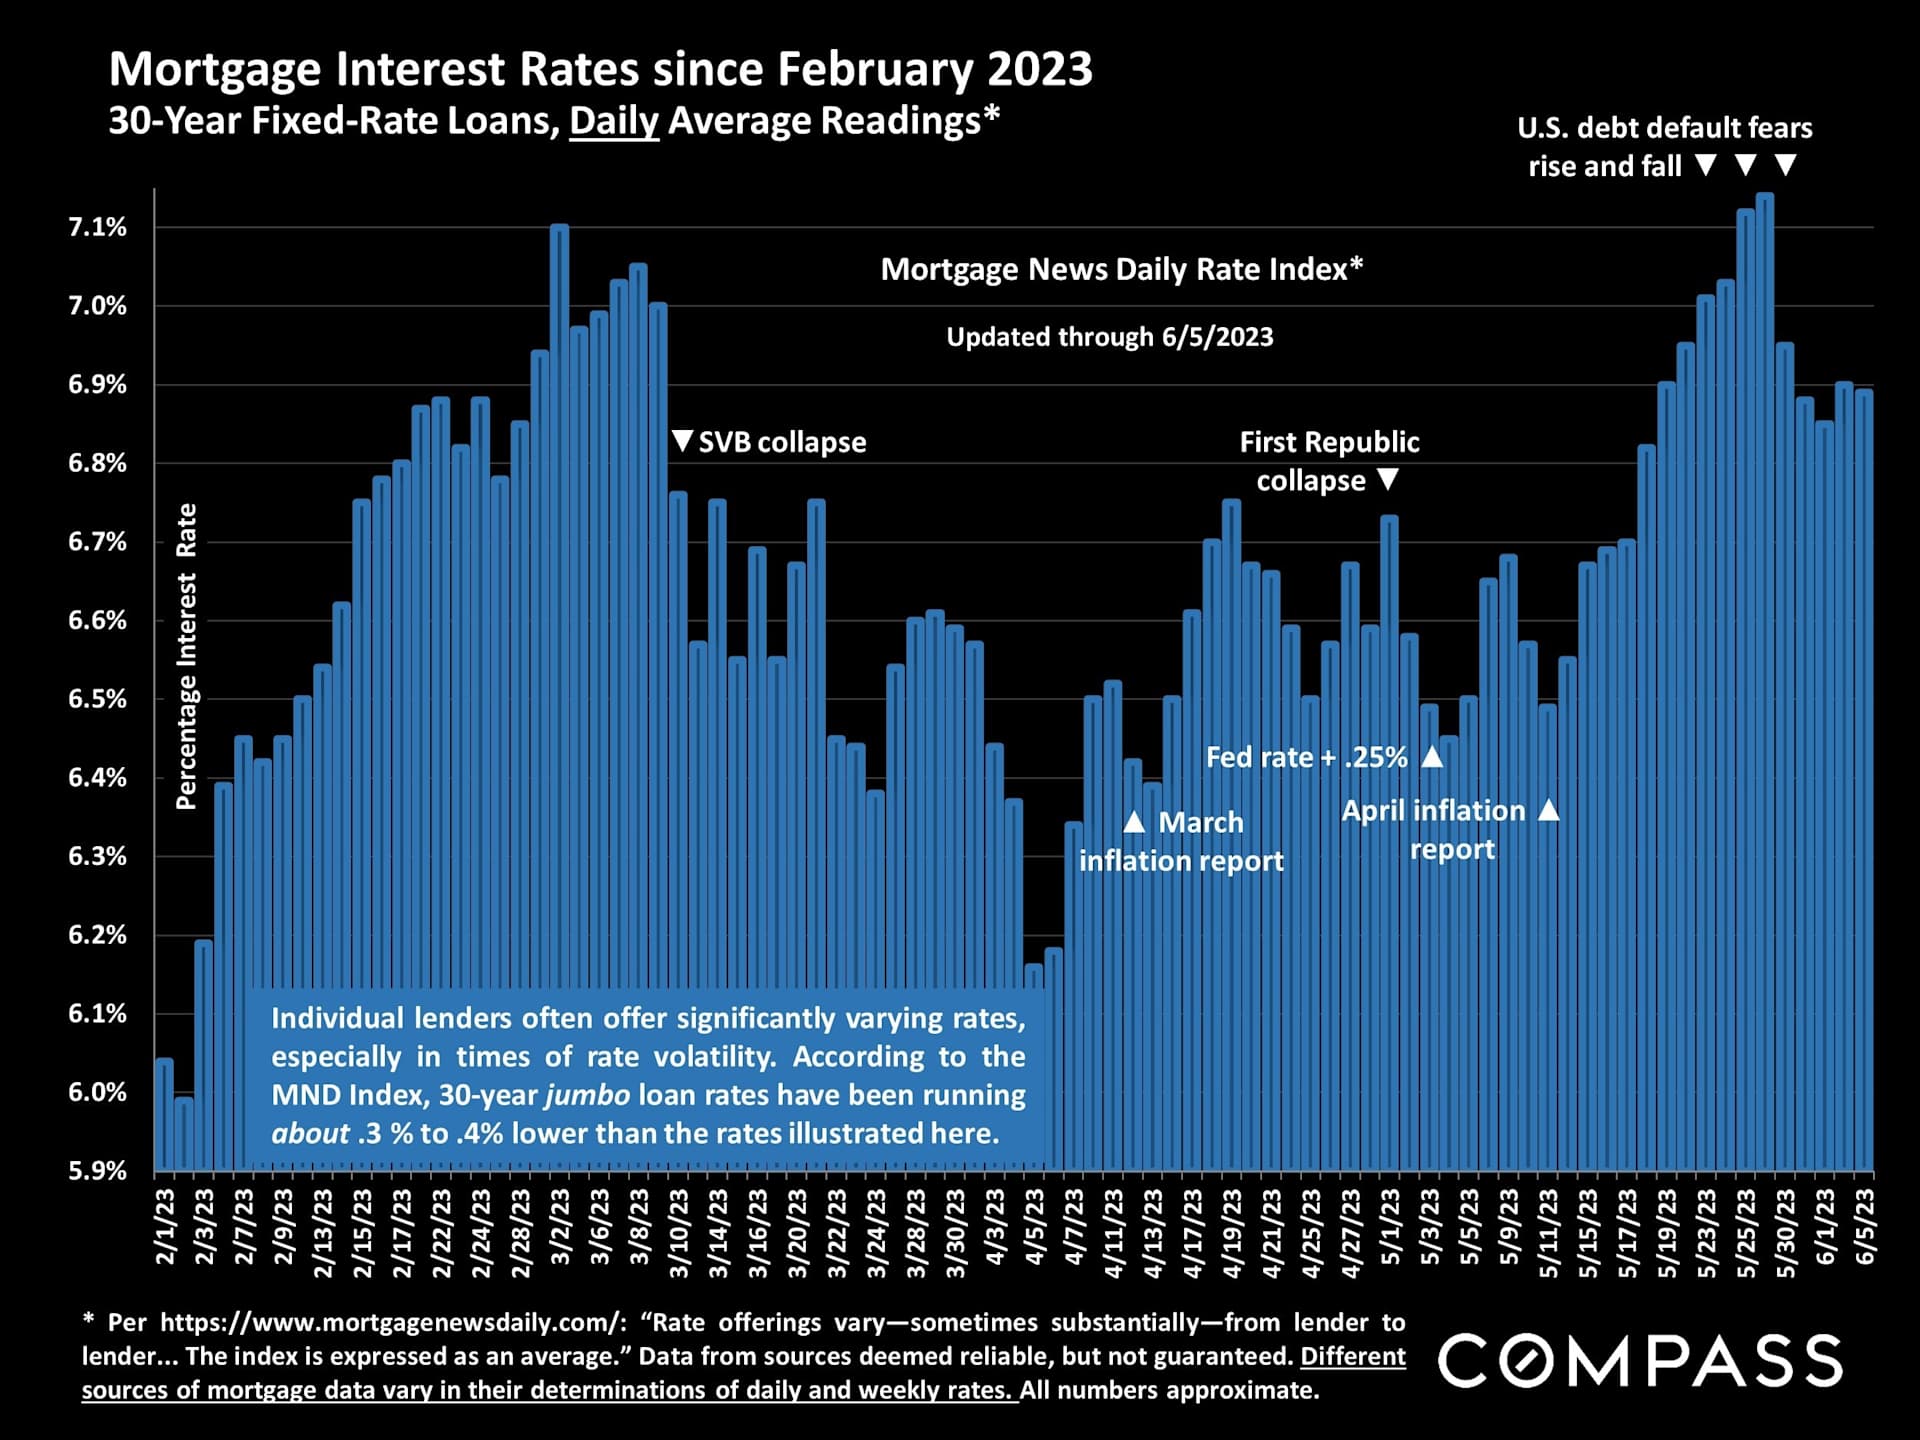
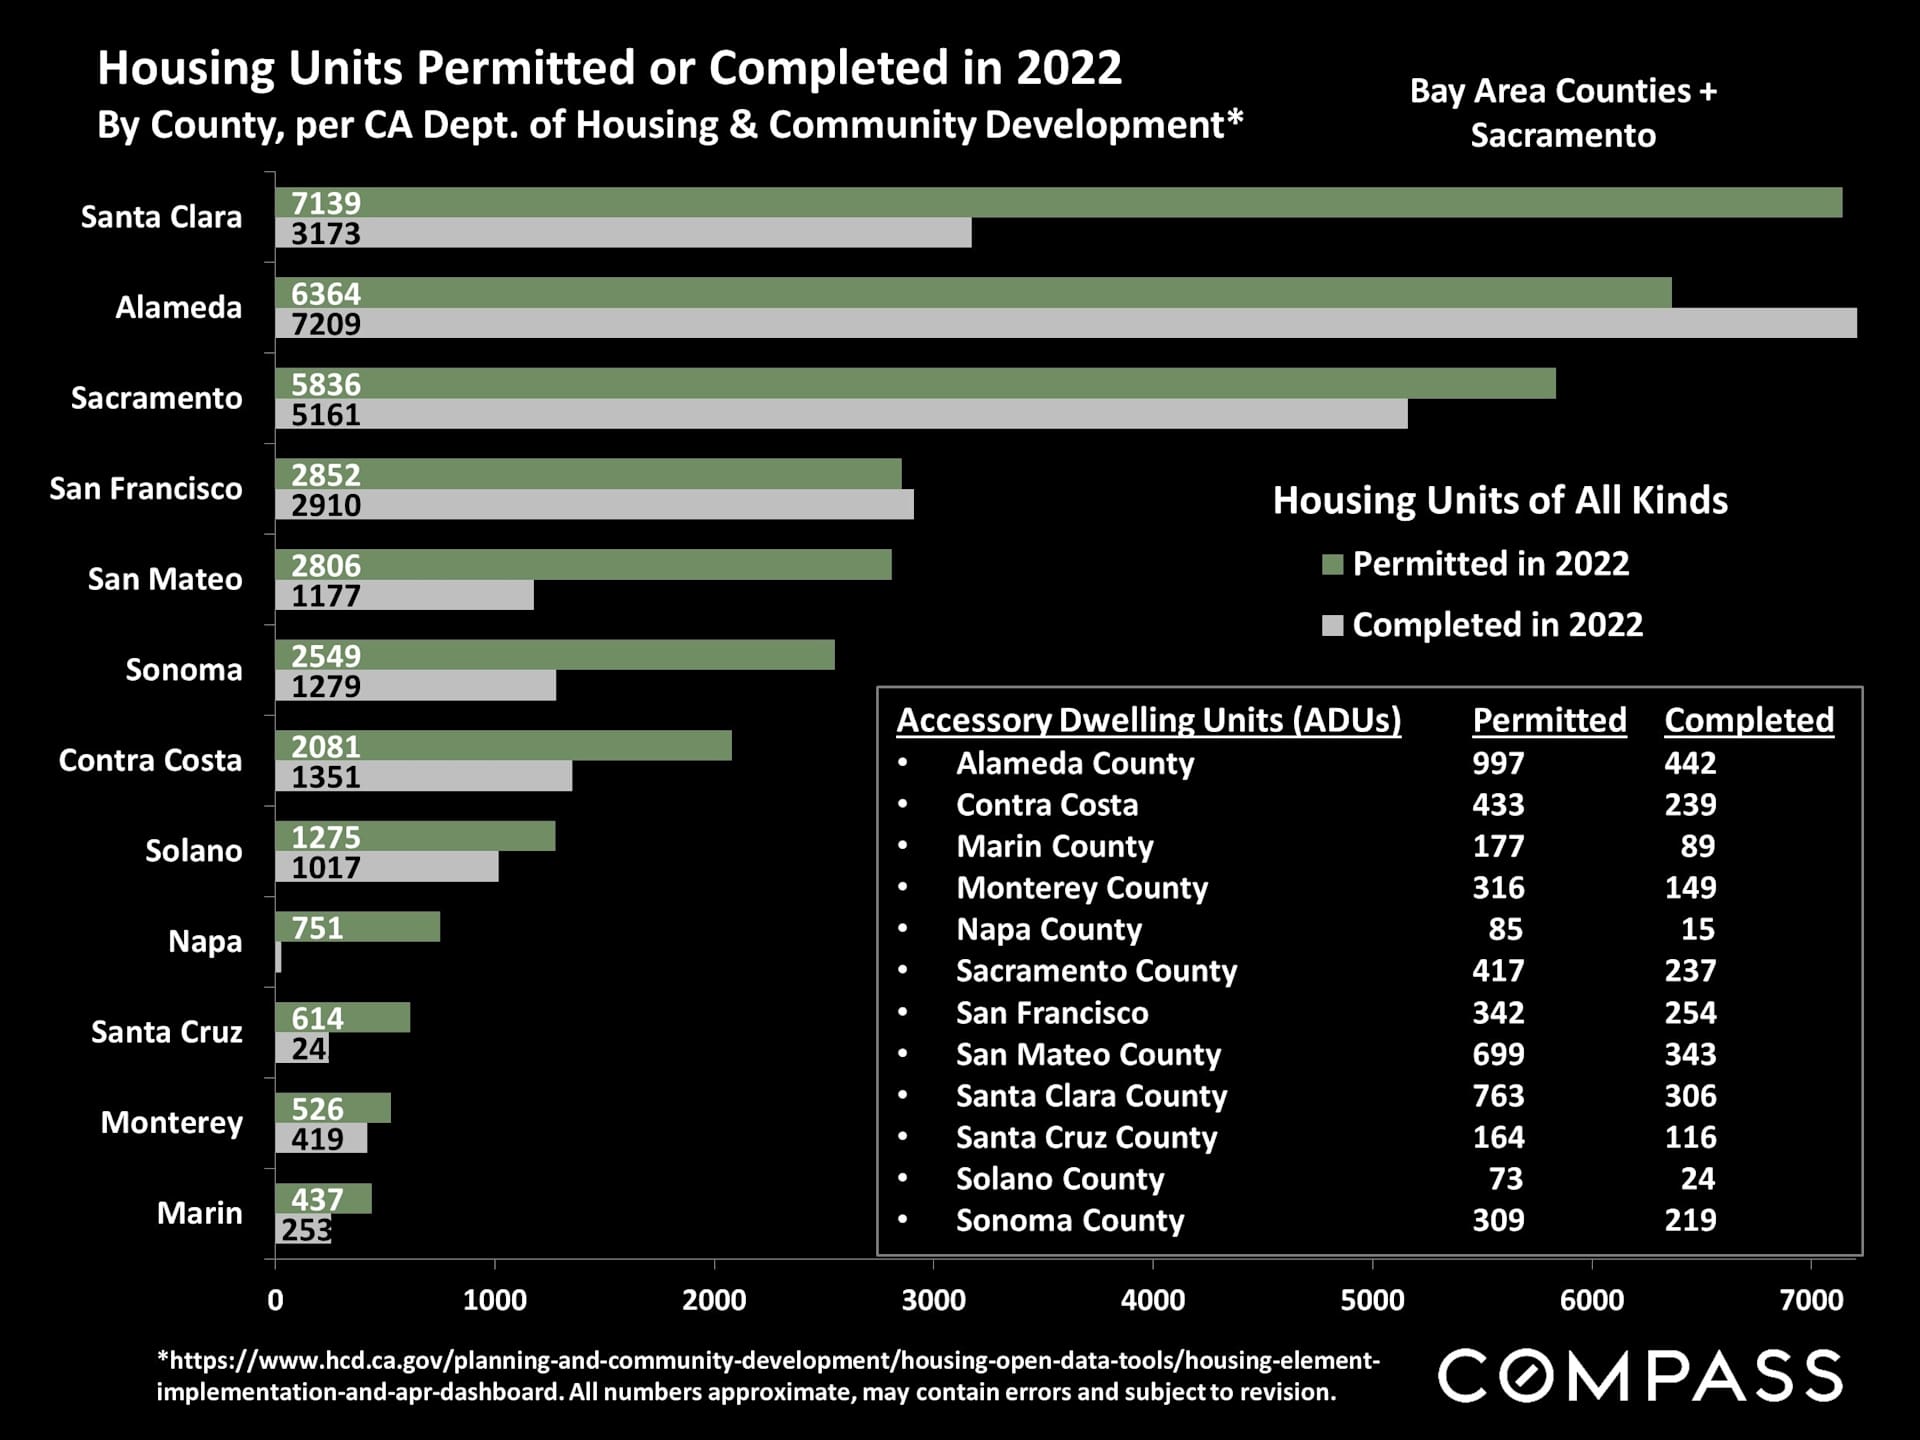
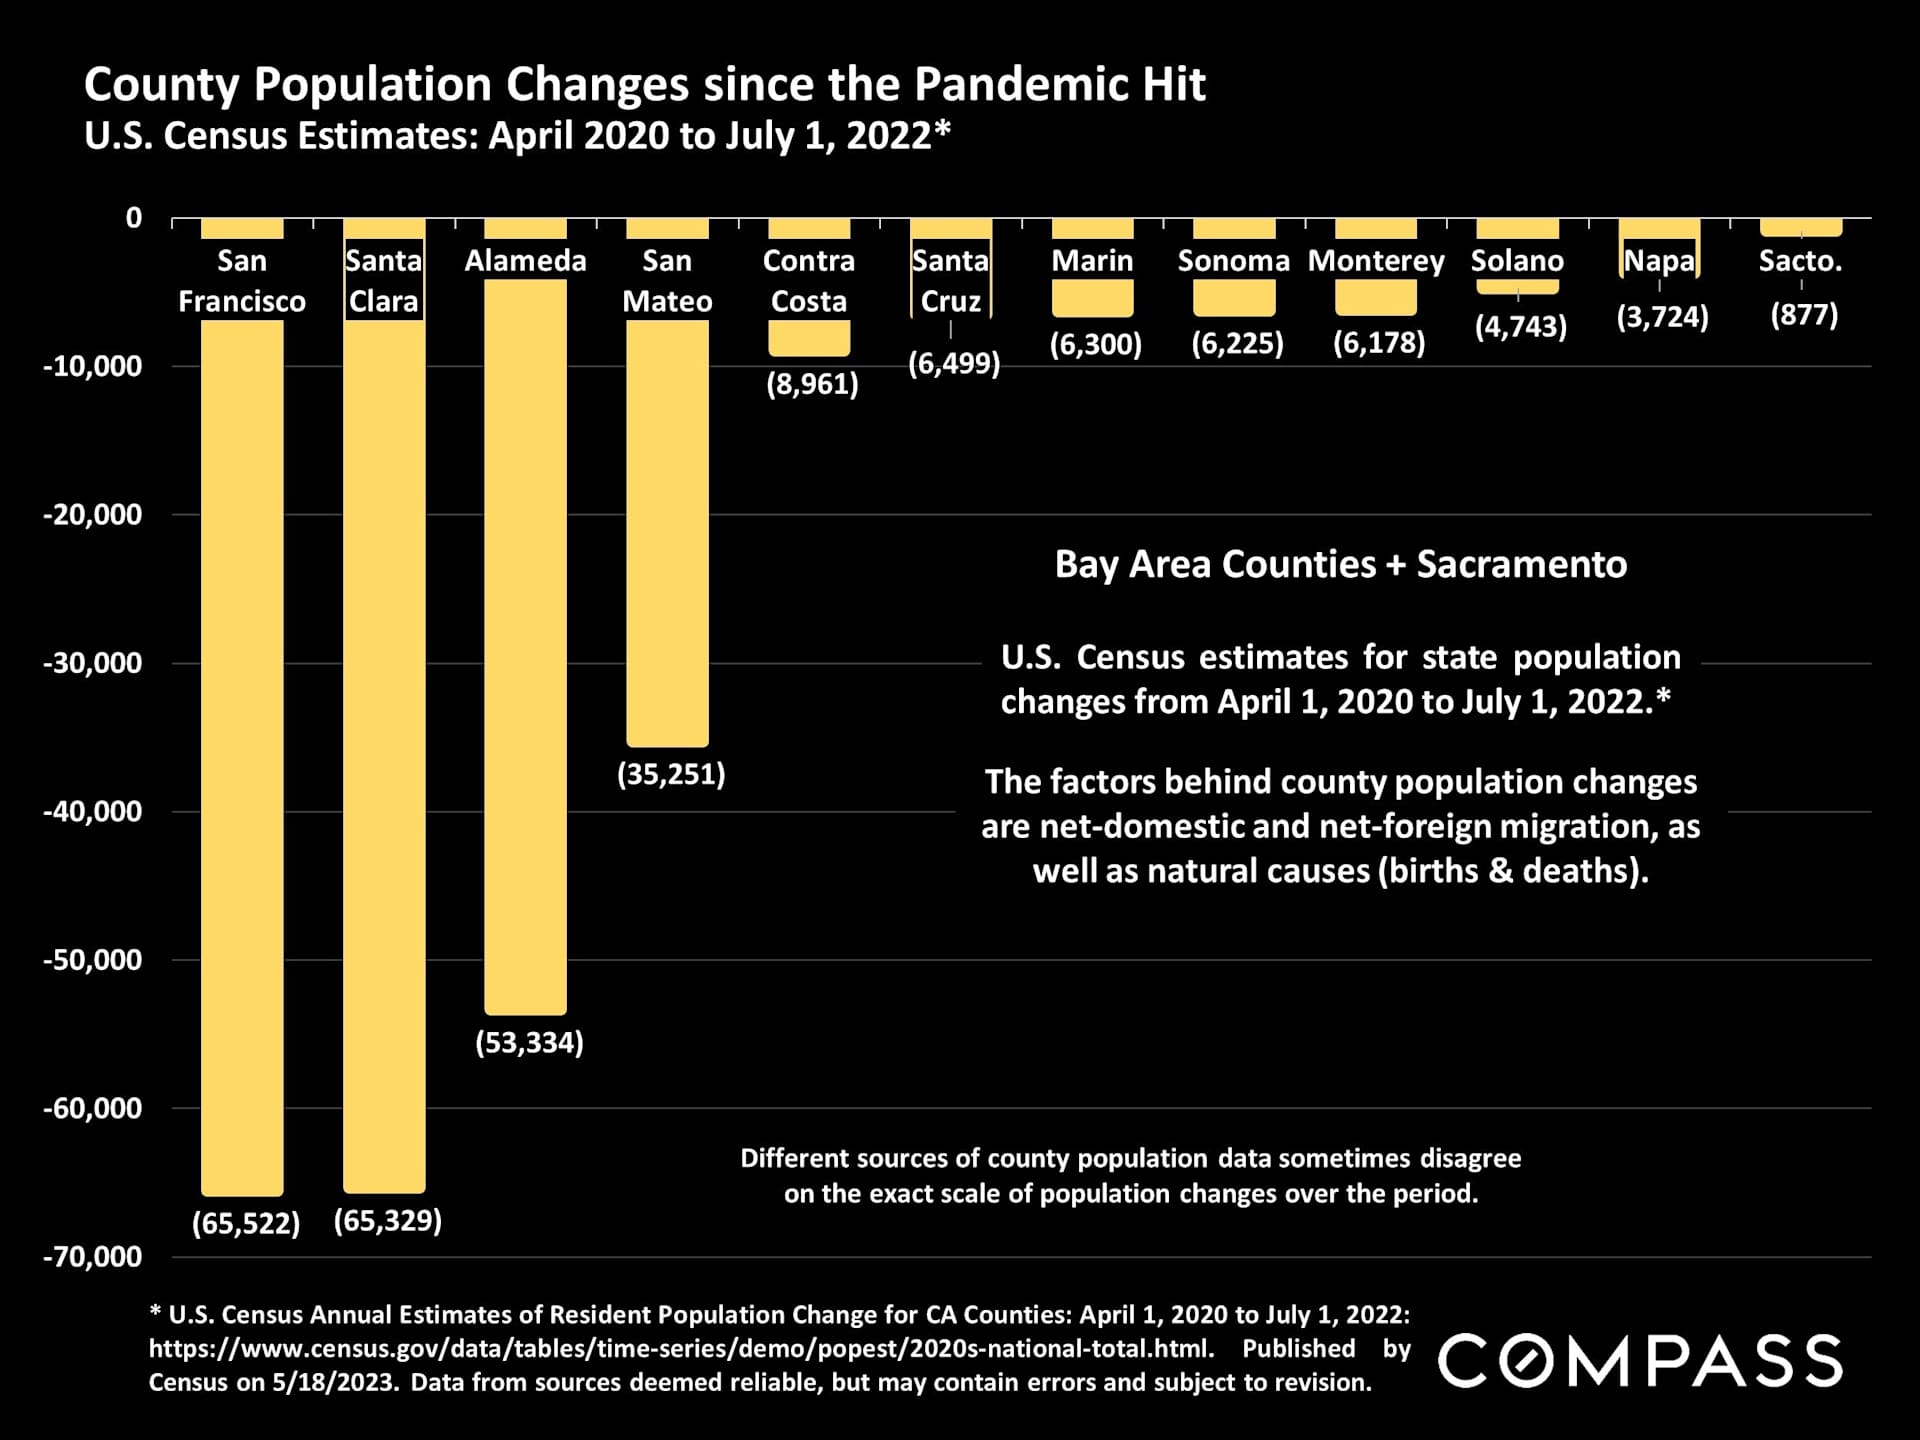
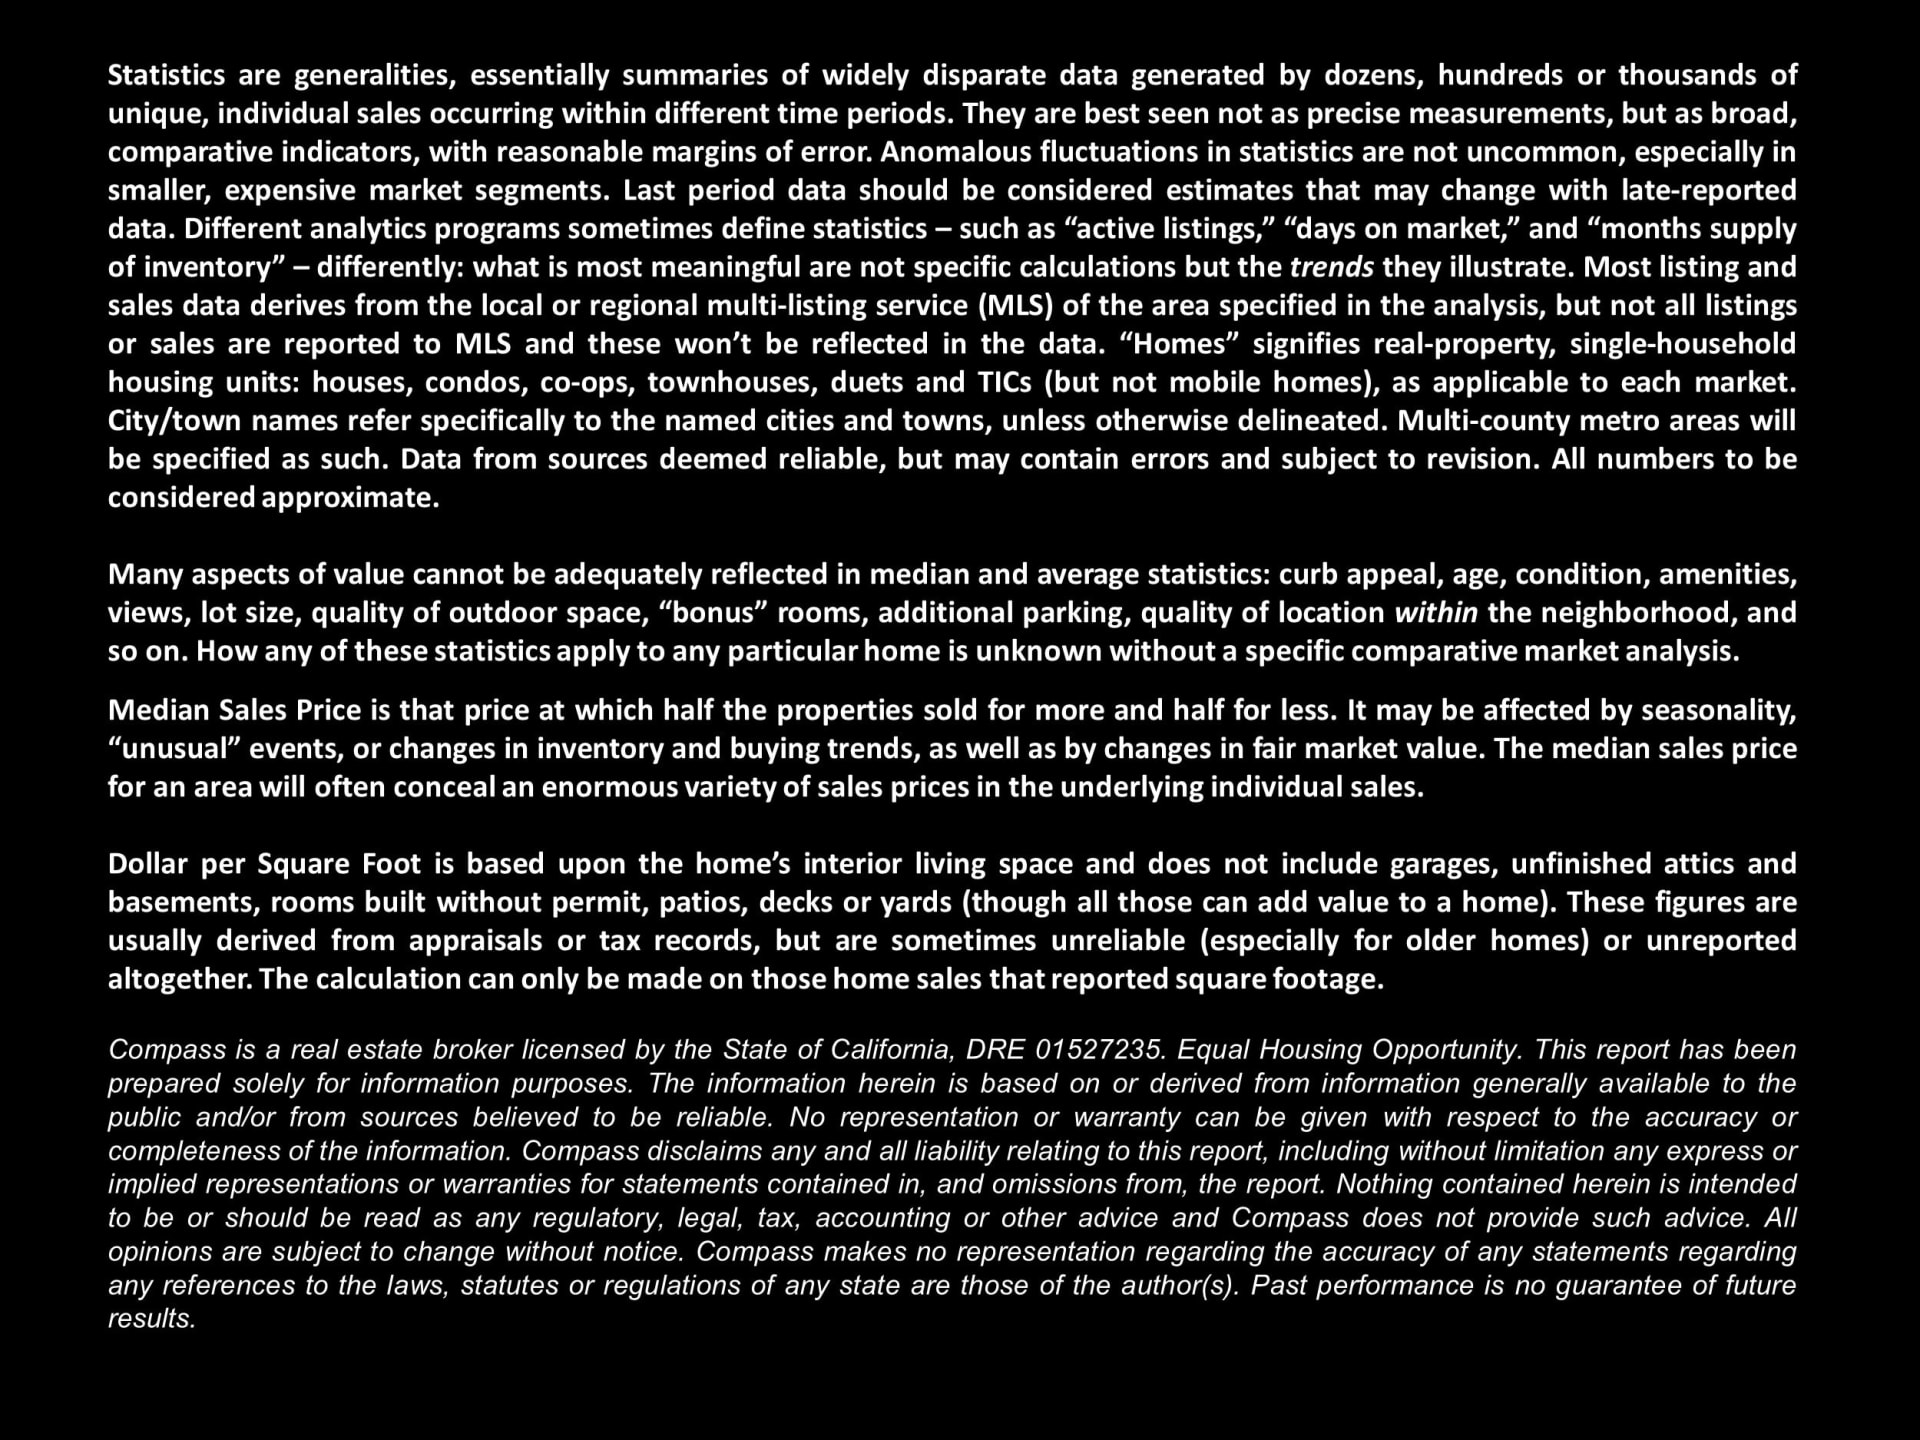
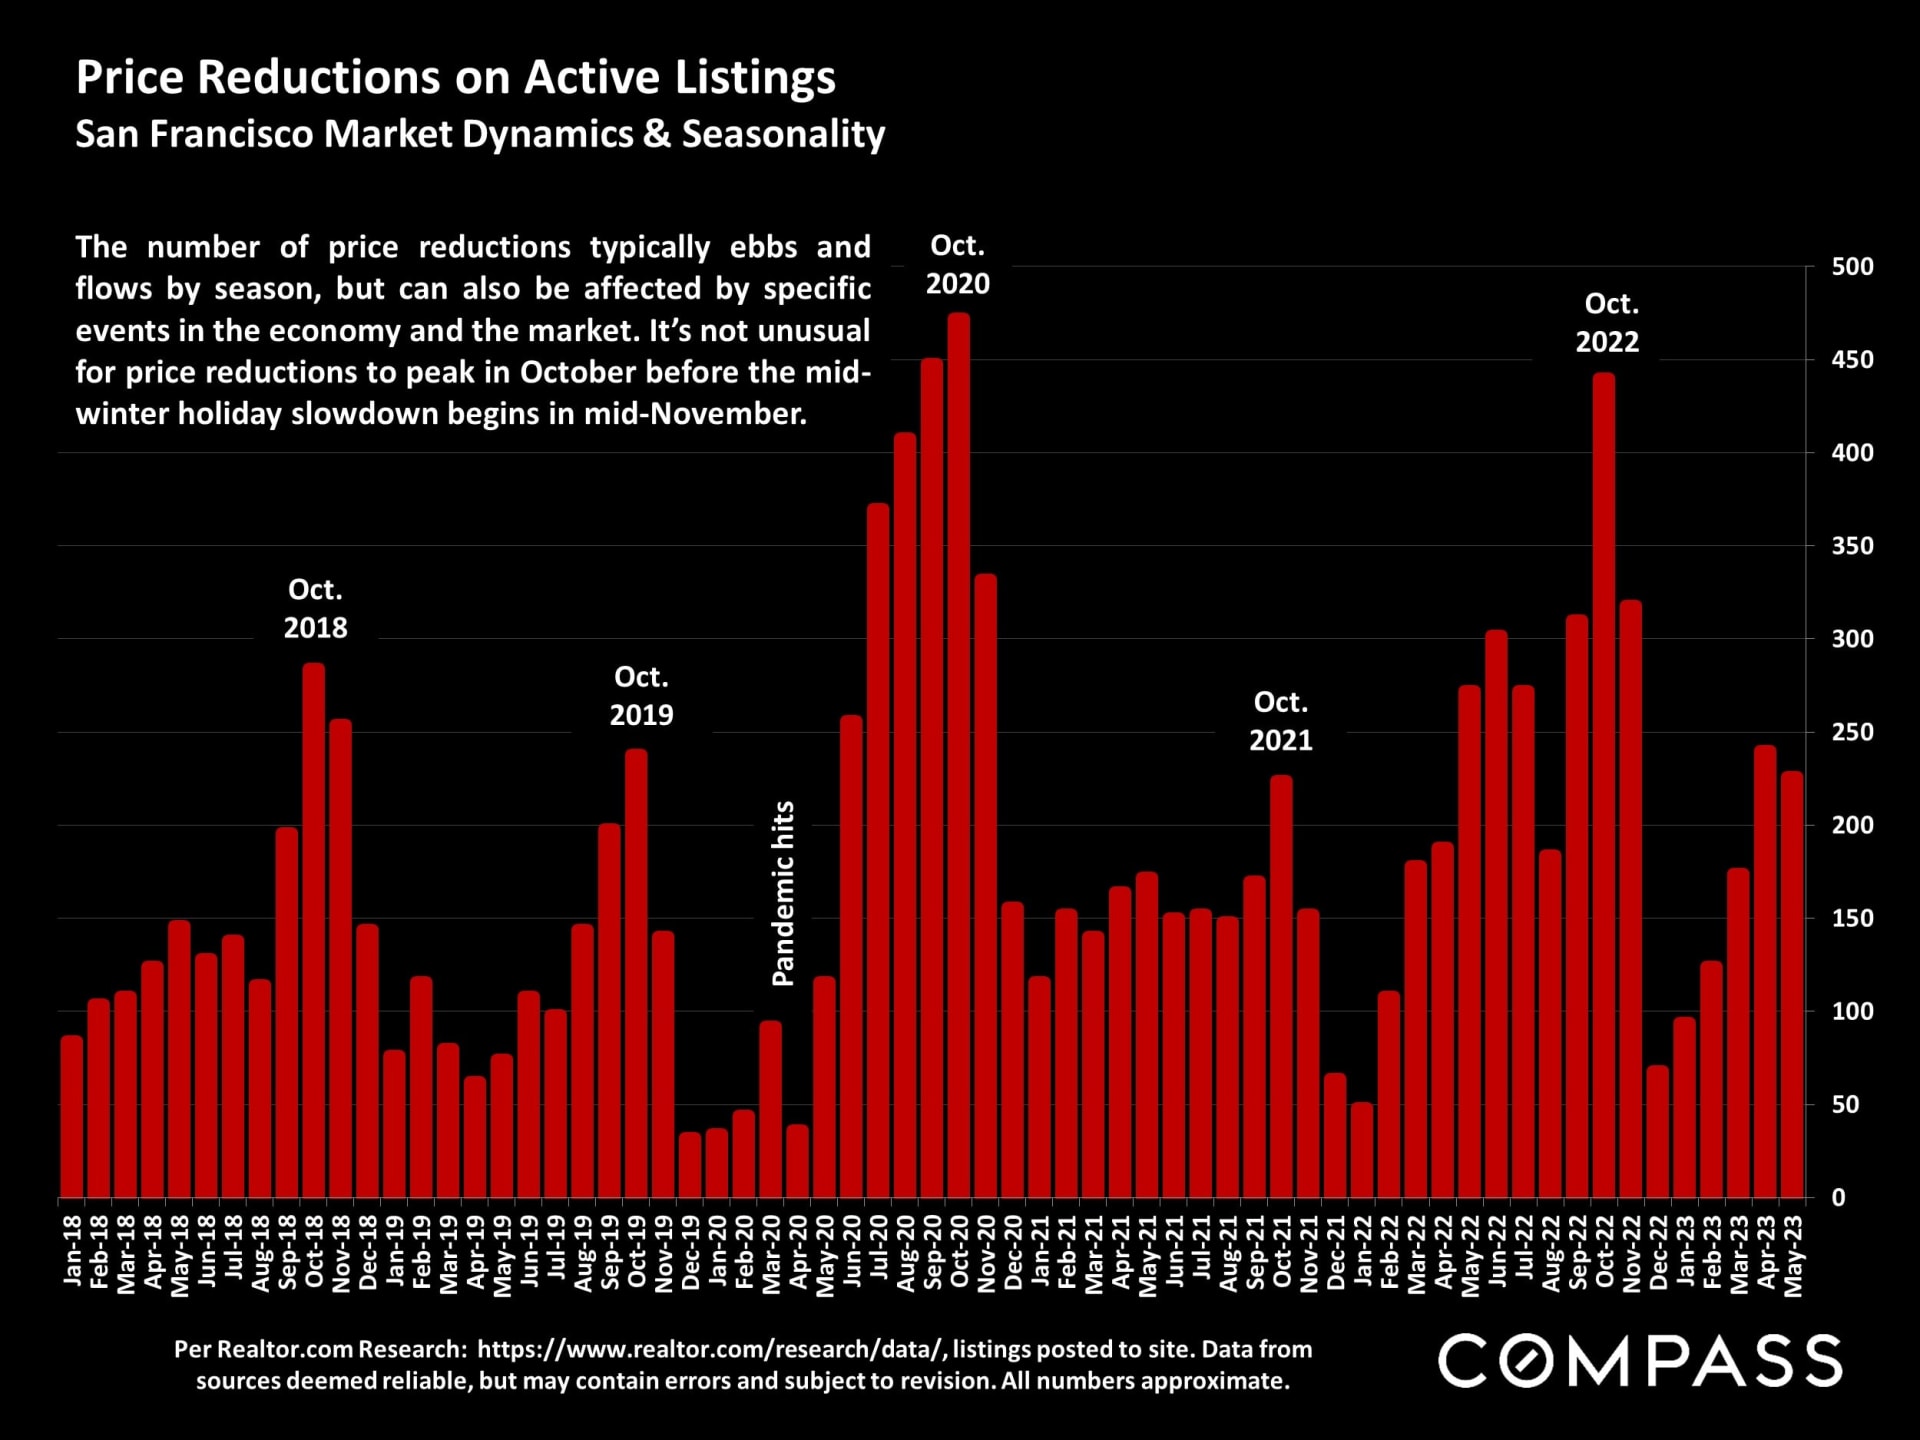
Spring 2023 San Francisco market recap covering home sales, listings, mortgage rates, and California insurance changes.Chart of San Francisco median house prices since 1990, highlighting $1,626,500 in May 2023 and prior peaks in 2007 and 2022.San Francisco median house price per square foot chart, 2005–2023; May 2023 value was $1,002.Chart comparing six months of San Francisco house sales by bedroom count and price range.Chart of San Francisco median condo prices from 2005 to 2023, with May 2023 at $1.15 million.Chart of San Francisco condo median value per square foot, 2005–2023, with a May 2023 value of $1,004.Bar chart comparing San Francisco condo, co-op, TIC, and townhouse sales by bedroom count and price range.Chart comparing San Francisco downtown and non-downtown condo prices, with white bars and a blue line through May 2023.Text graphic explaining long-term housing supply, demand, and San Francisco market trends.San Francisco chart of rolling home listings and sales from 2005 to 2023, with recession and pandemic annotations.Chart of San Francisco new listings from December 2019 to May 2023, showing May 2023 down 33% year over year.San Francisco active and coming-soon home listings chart, February 2022–June 2023, ending at 1,223 listings.Bar chart of San Francisco active home listings by price segment as of June 1, 2023.Bar chart of San Francisco active listings, January 2019–May 2023, with October peaks and May comparisons highlighted.Bar chart tracking San Francisco pending listings from January 2019 to May 2023, with May values highlighted.Bar chart of monthly San Francisco home sales, January 2019 to May 2023.Chart of San Francisco $3 million-plus home sales by month, highlighting a 57% year-over-year drop in May 2023.Chart of San Francisco active-listing price reductions, with October peaks in 2020 and 2022.œChart comparing San Francisco houses’ and condos’ average days on market from 2019 through spring 2023.San Francisco home sales closing over list price, monthly, January 2018–May 2023.Line chart comparing San Francisco house and condo sale prices to original list prices, January 2019–May 2023.Chart compares January, March, and May 2023 median home prices across 11 Bay Area counties.Chart of daily 30-year fixed mortgage rates from February through June 2023, with rate changes and economic events annotated.Chart compares 2022 permitted and completed housing units by county, with a separate table of accessory dwelling unit totals.Chart of county population declines since the pandemic, with San Francisco and Santa Clara showing the largest losses.Real estate report notes on market statistics, valuation measures, and Compass’s disclaimer.

Work With Us

We will help you understand the complex aspects of the transaction and share our expertise so that you can make the best decisions possible. We are experienced, market savvy, and energetic. With both of us working for our clients, you get twice the amount of attention and insight.