

The SF Team, Eva + James, Compass

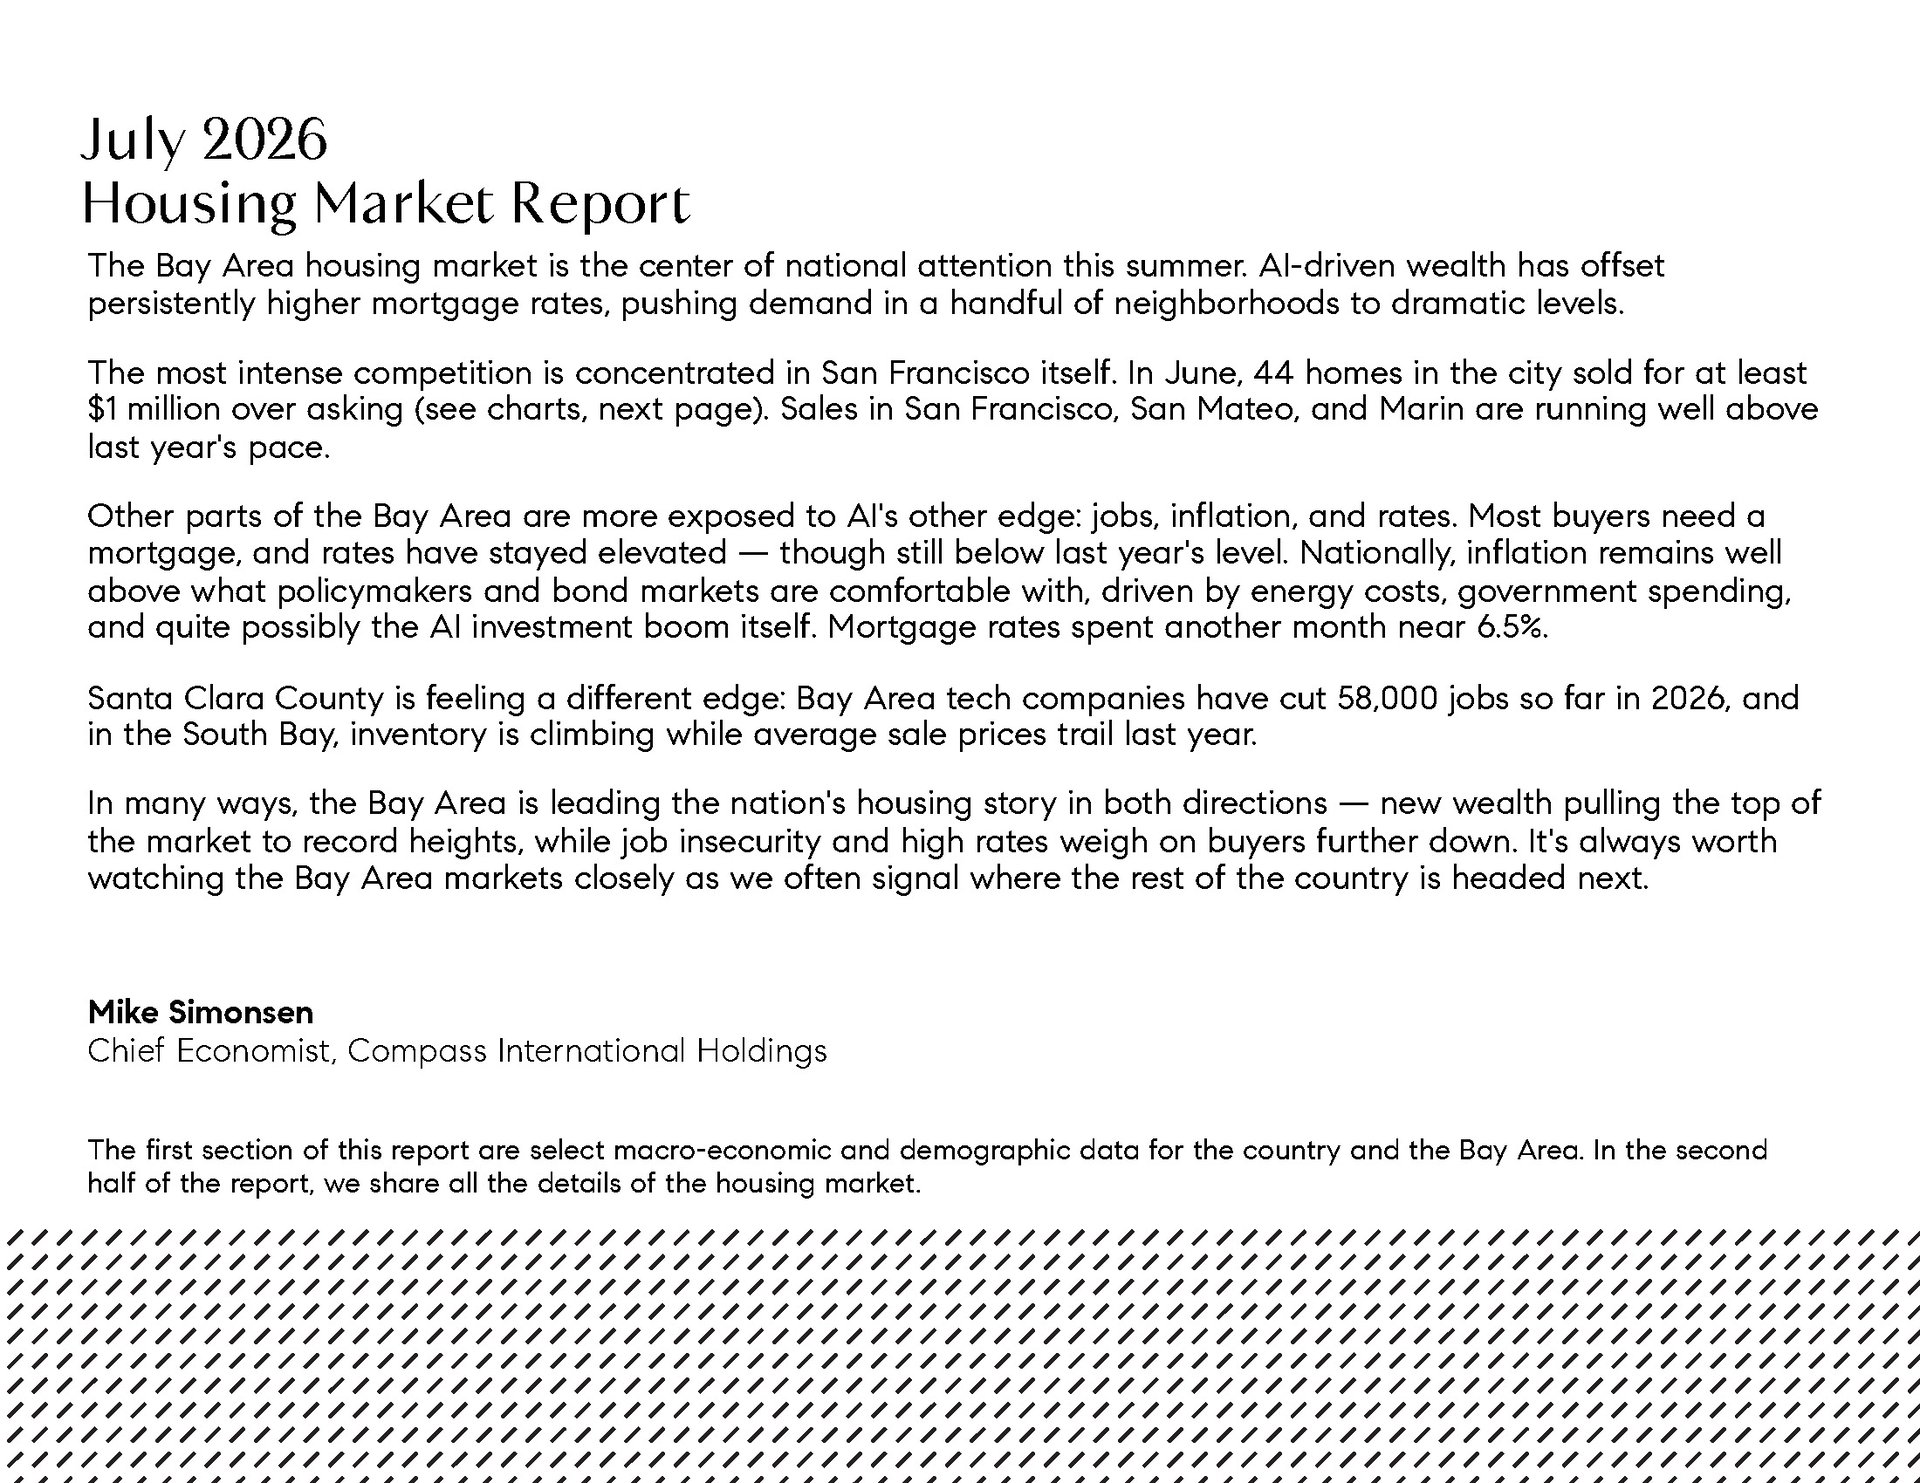
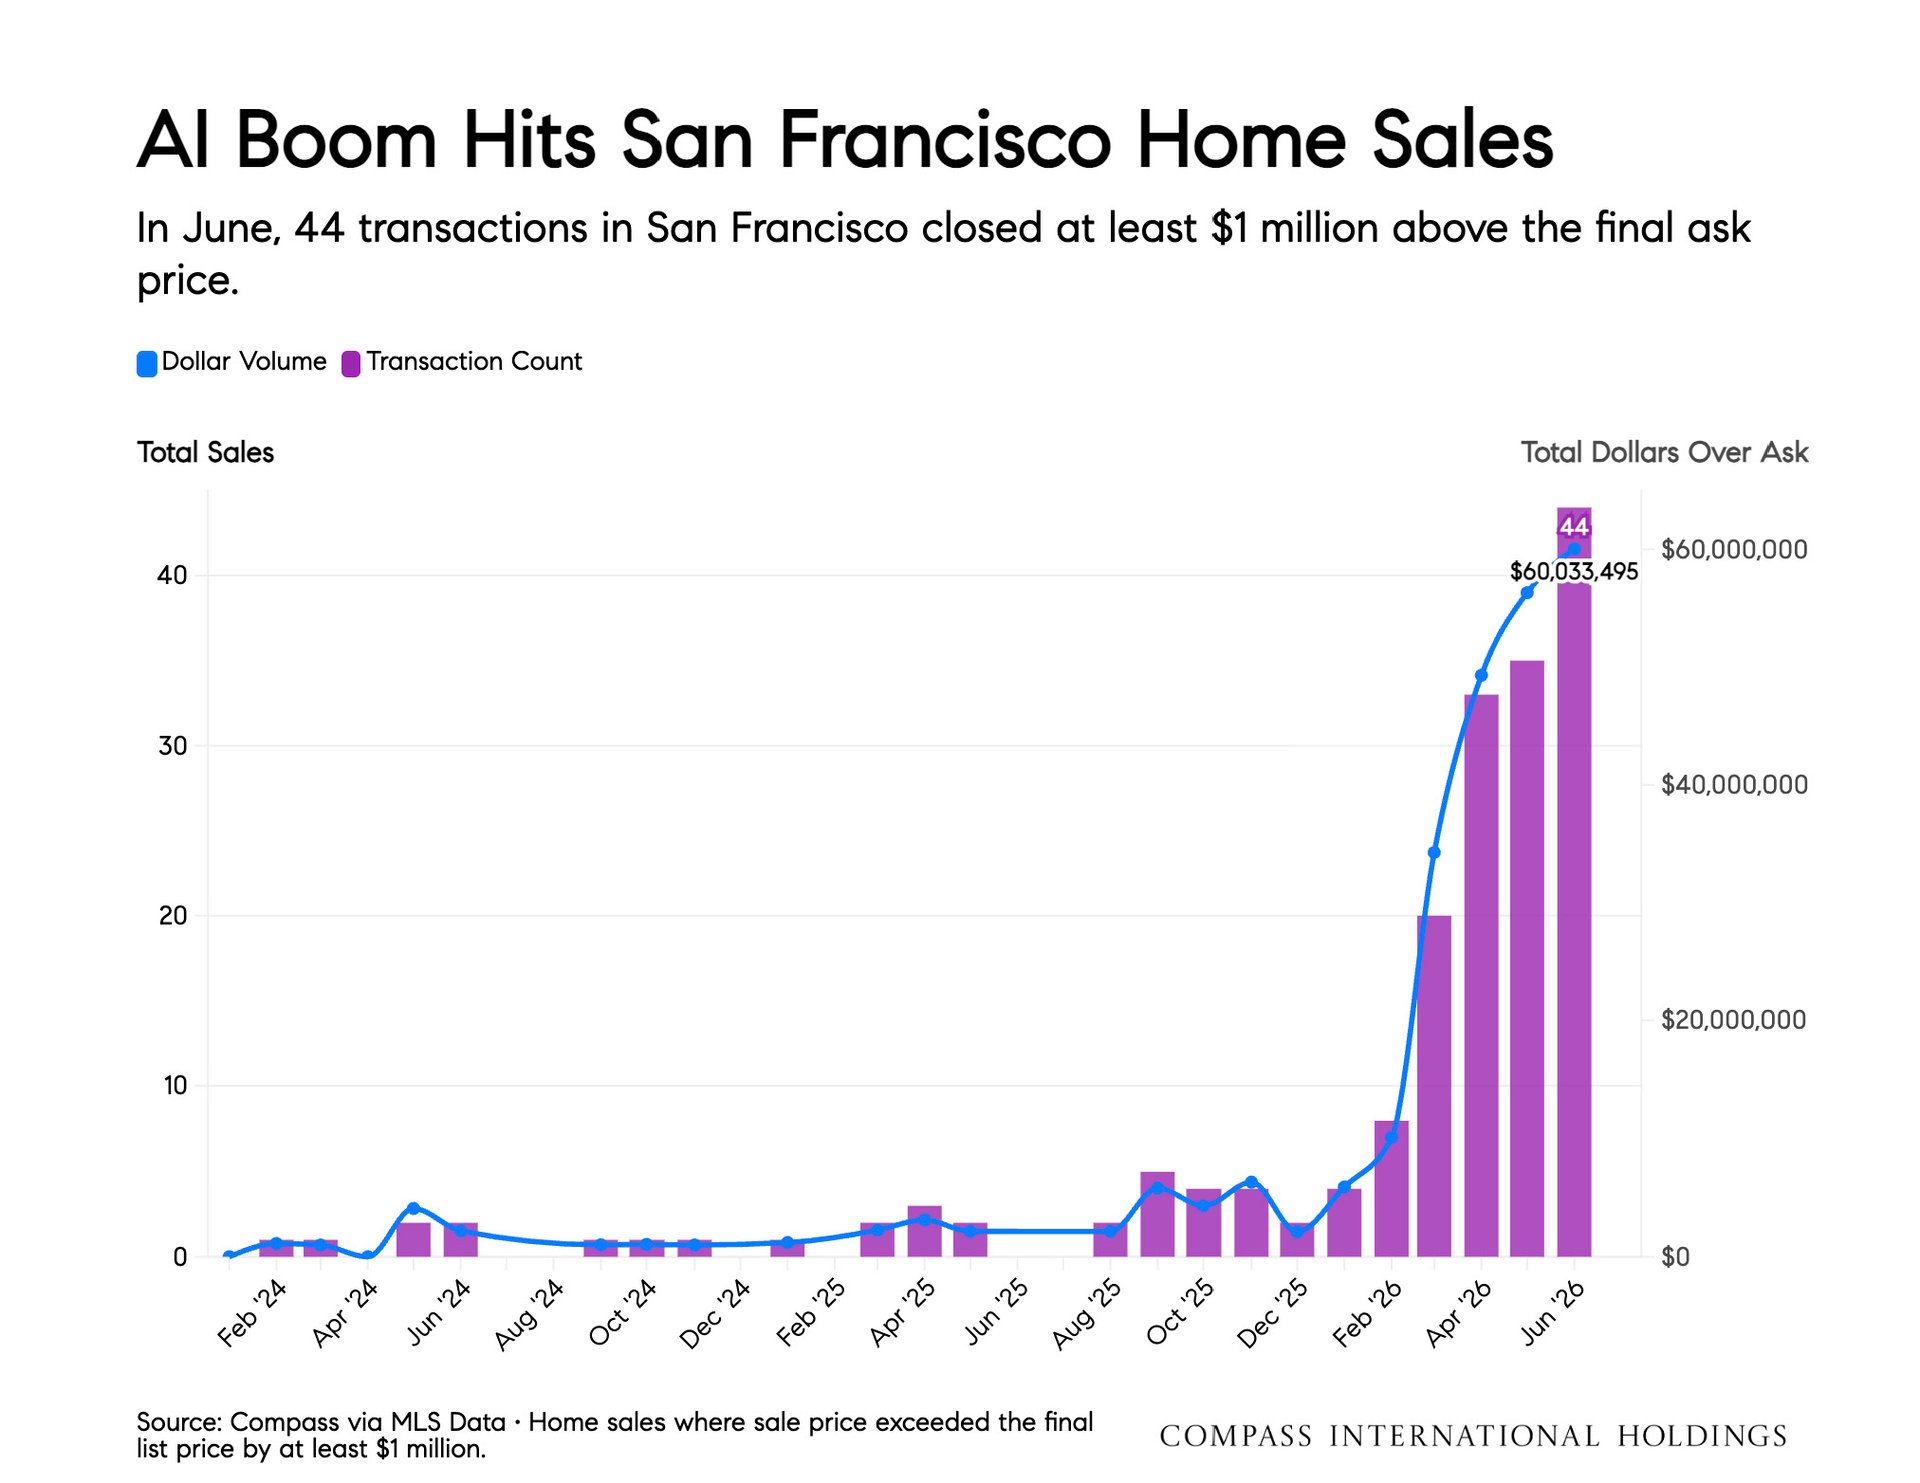
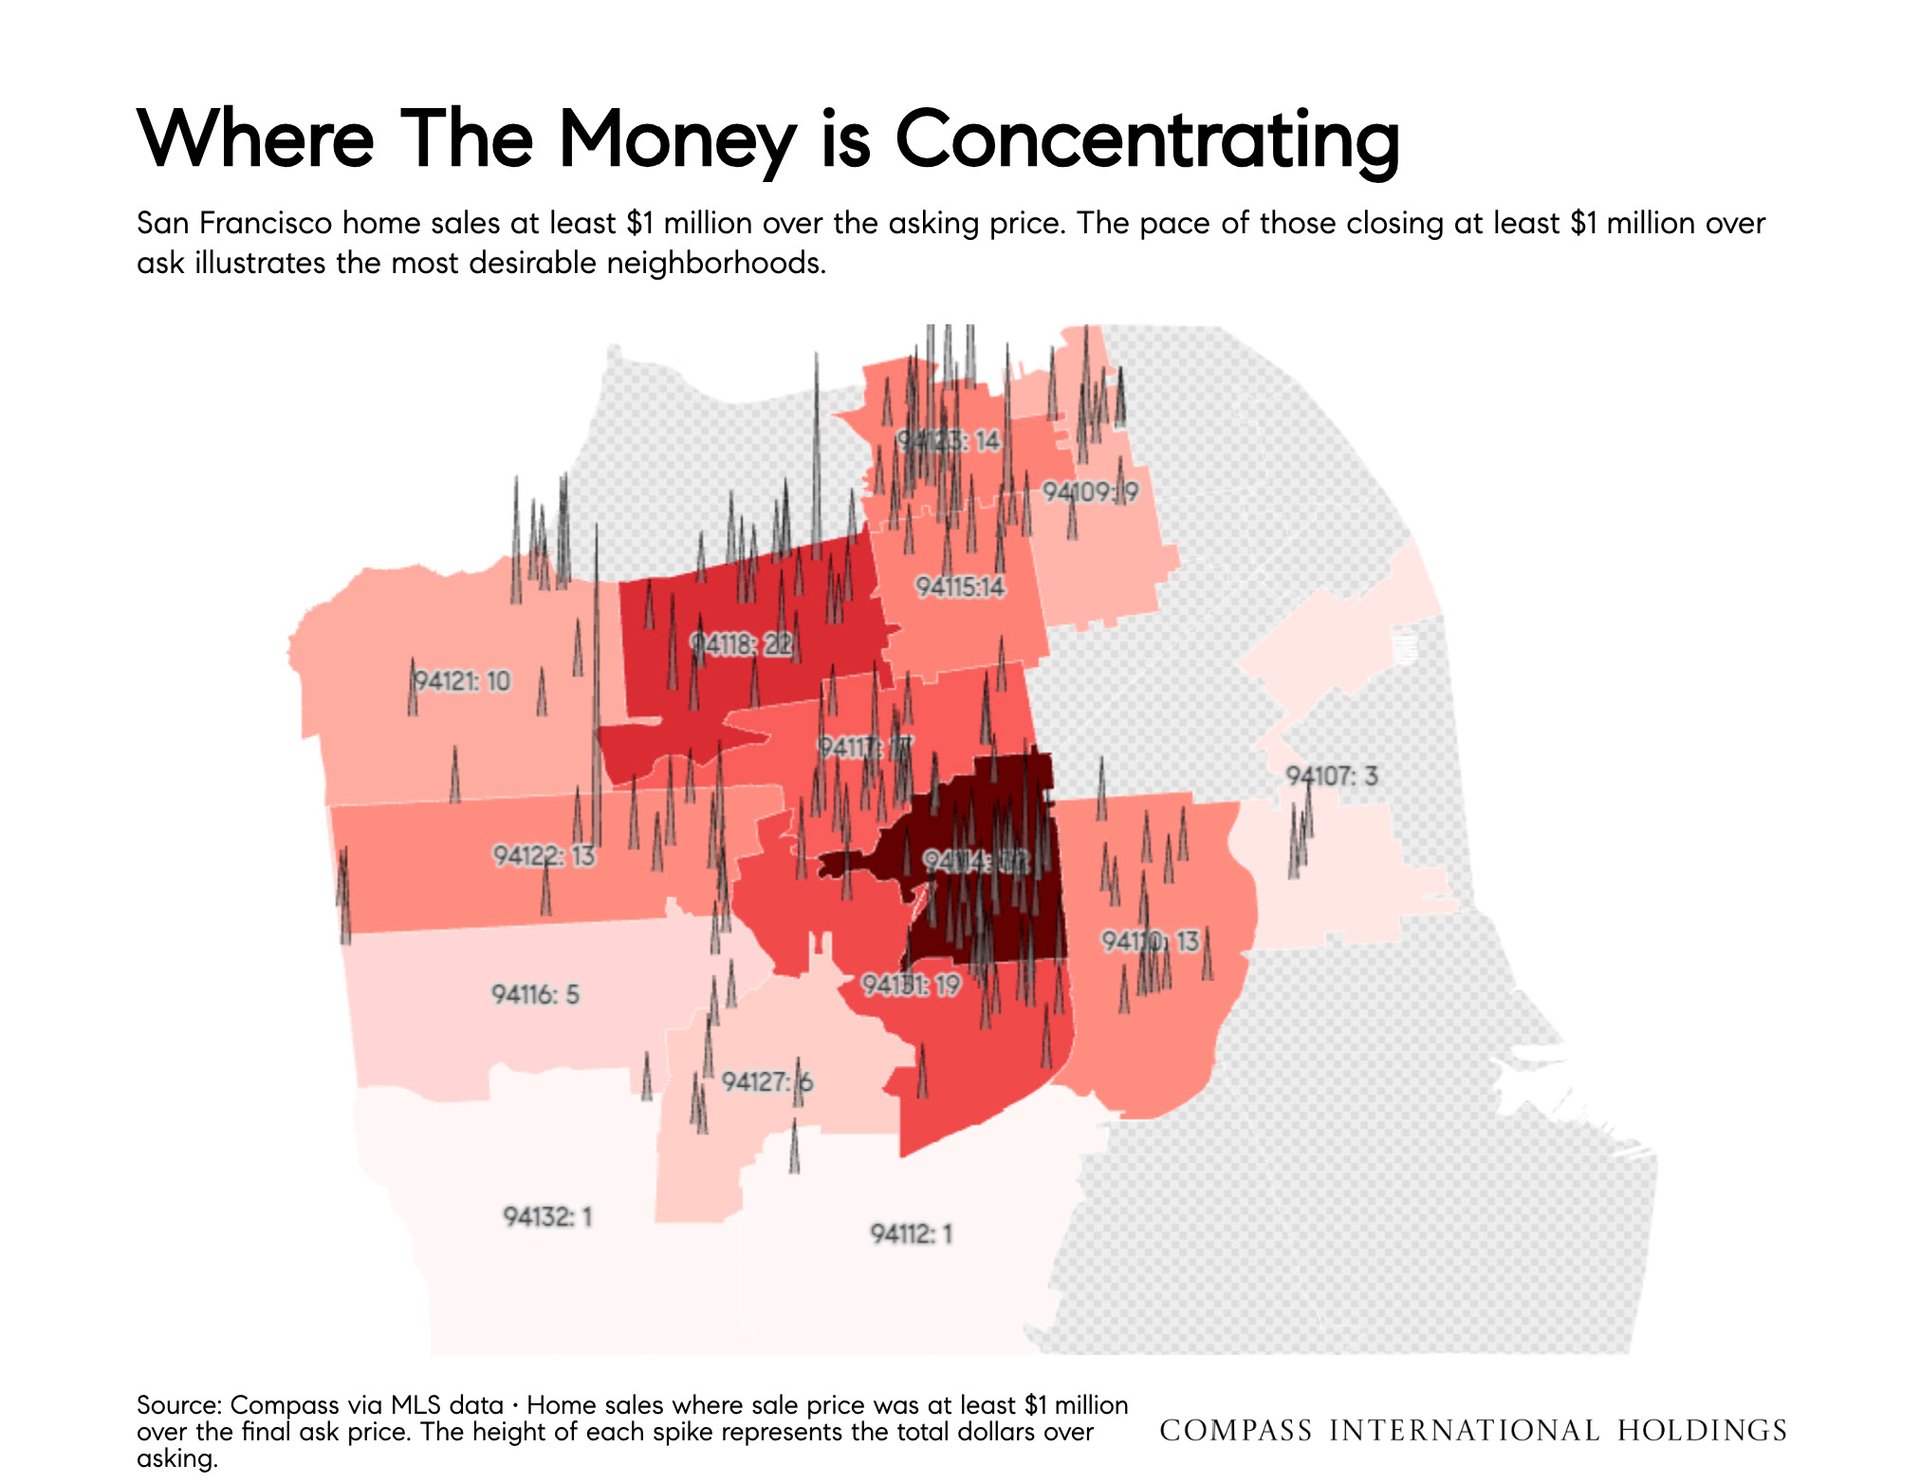
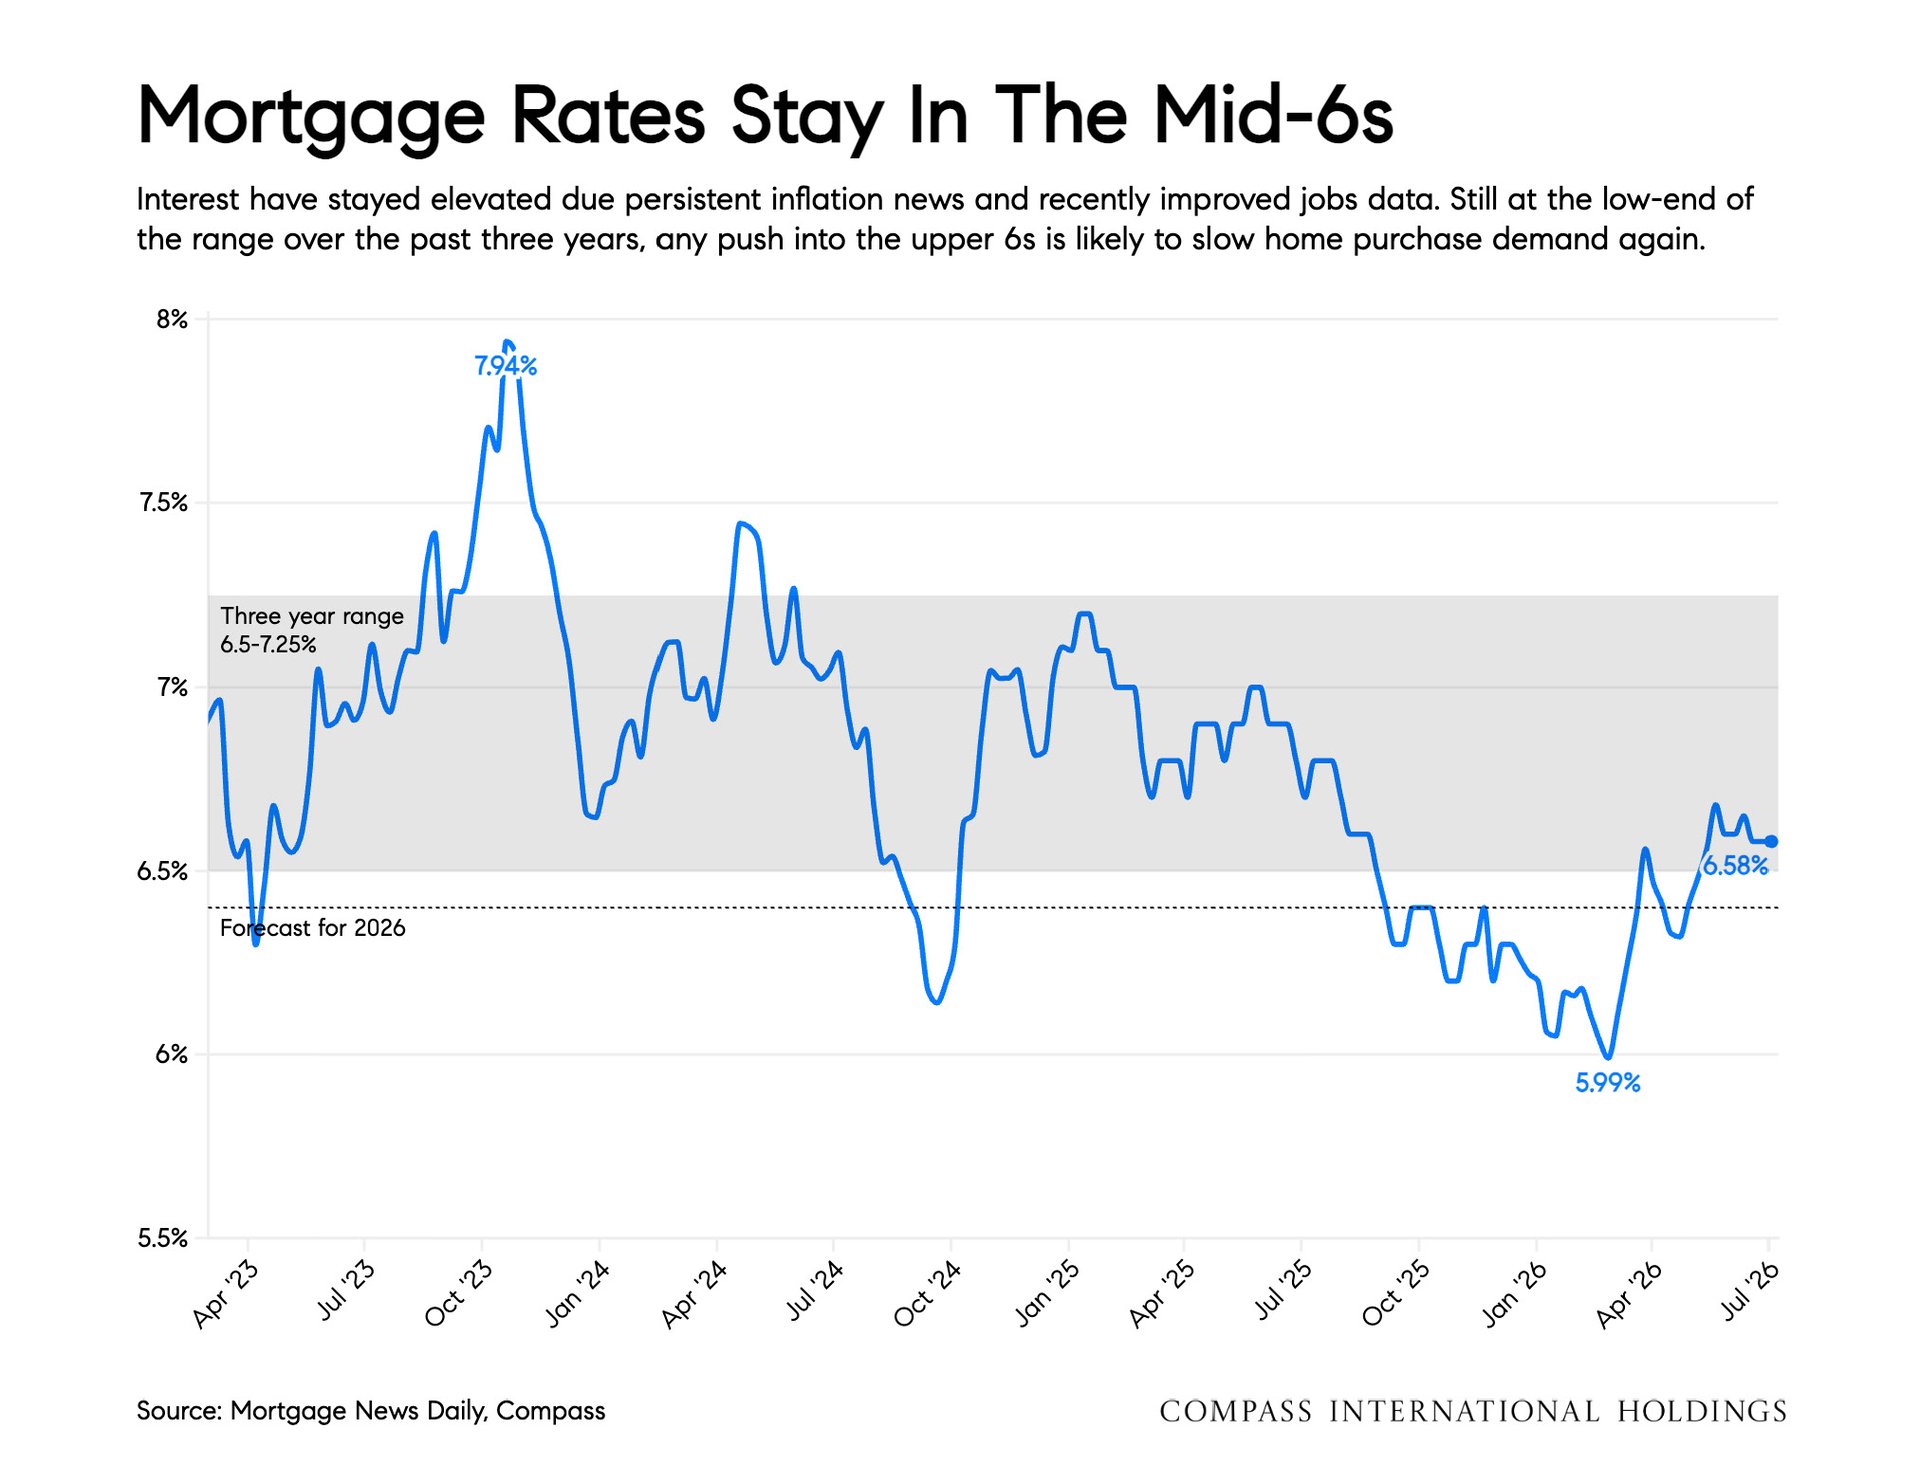
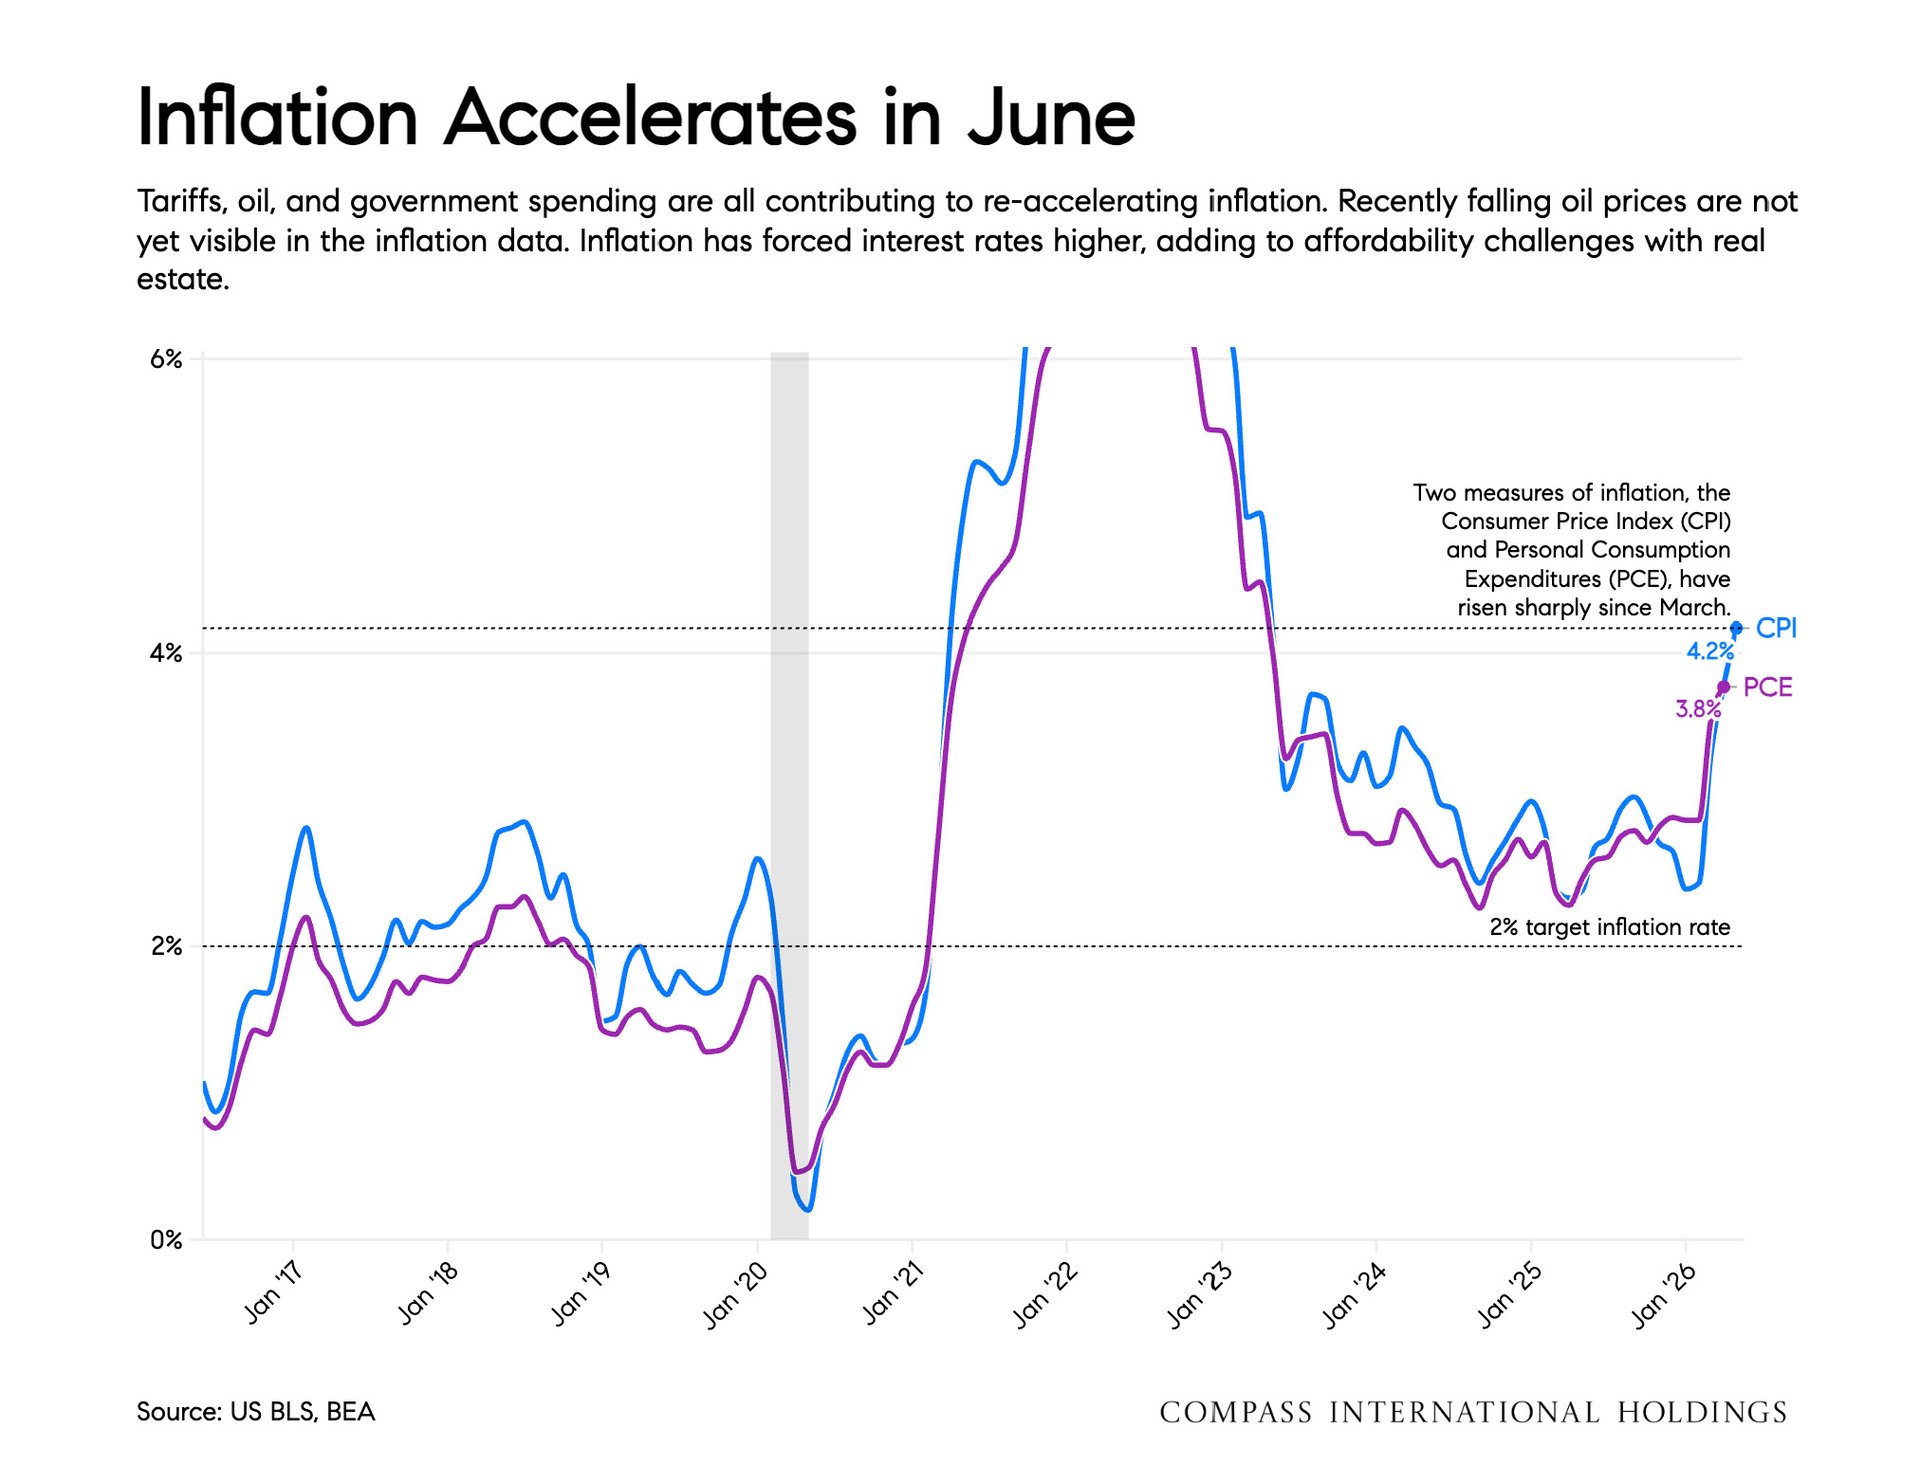
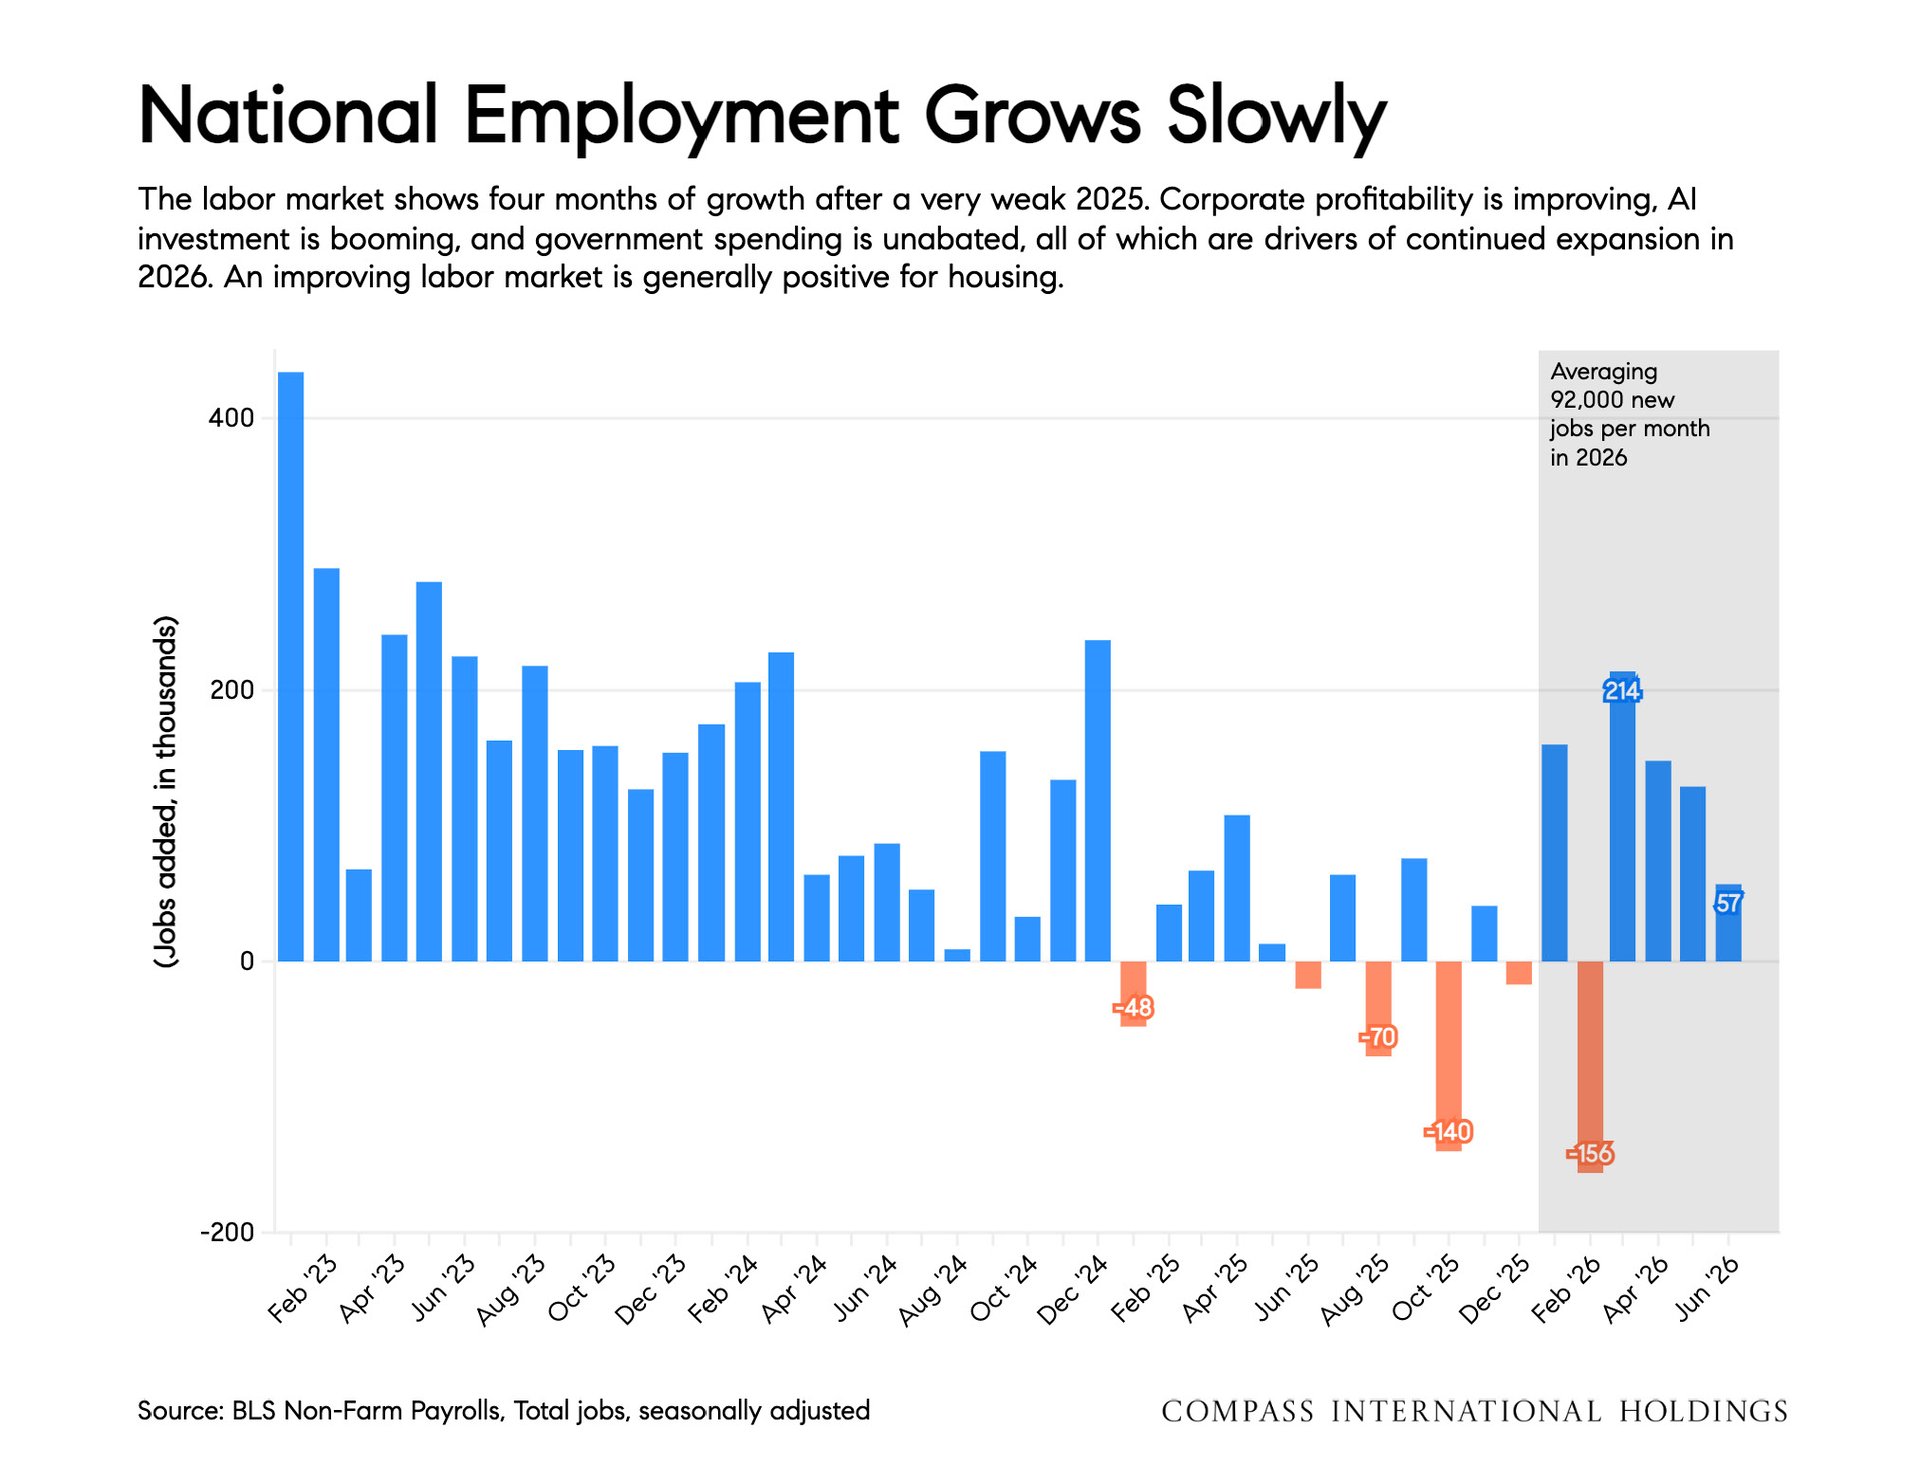
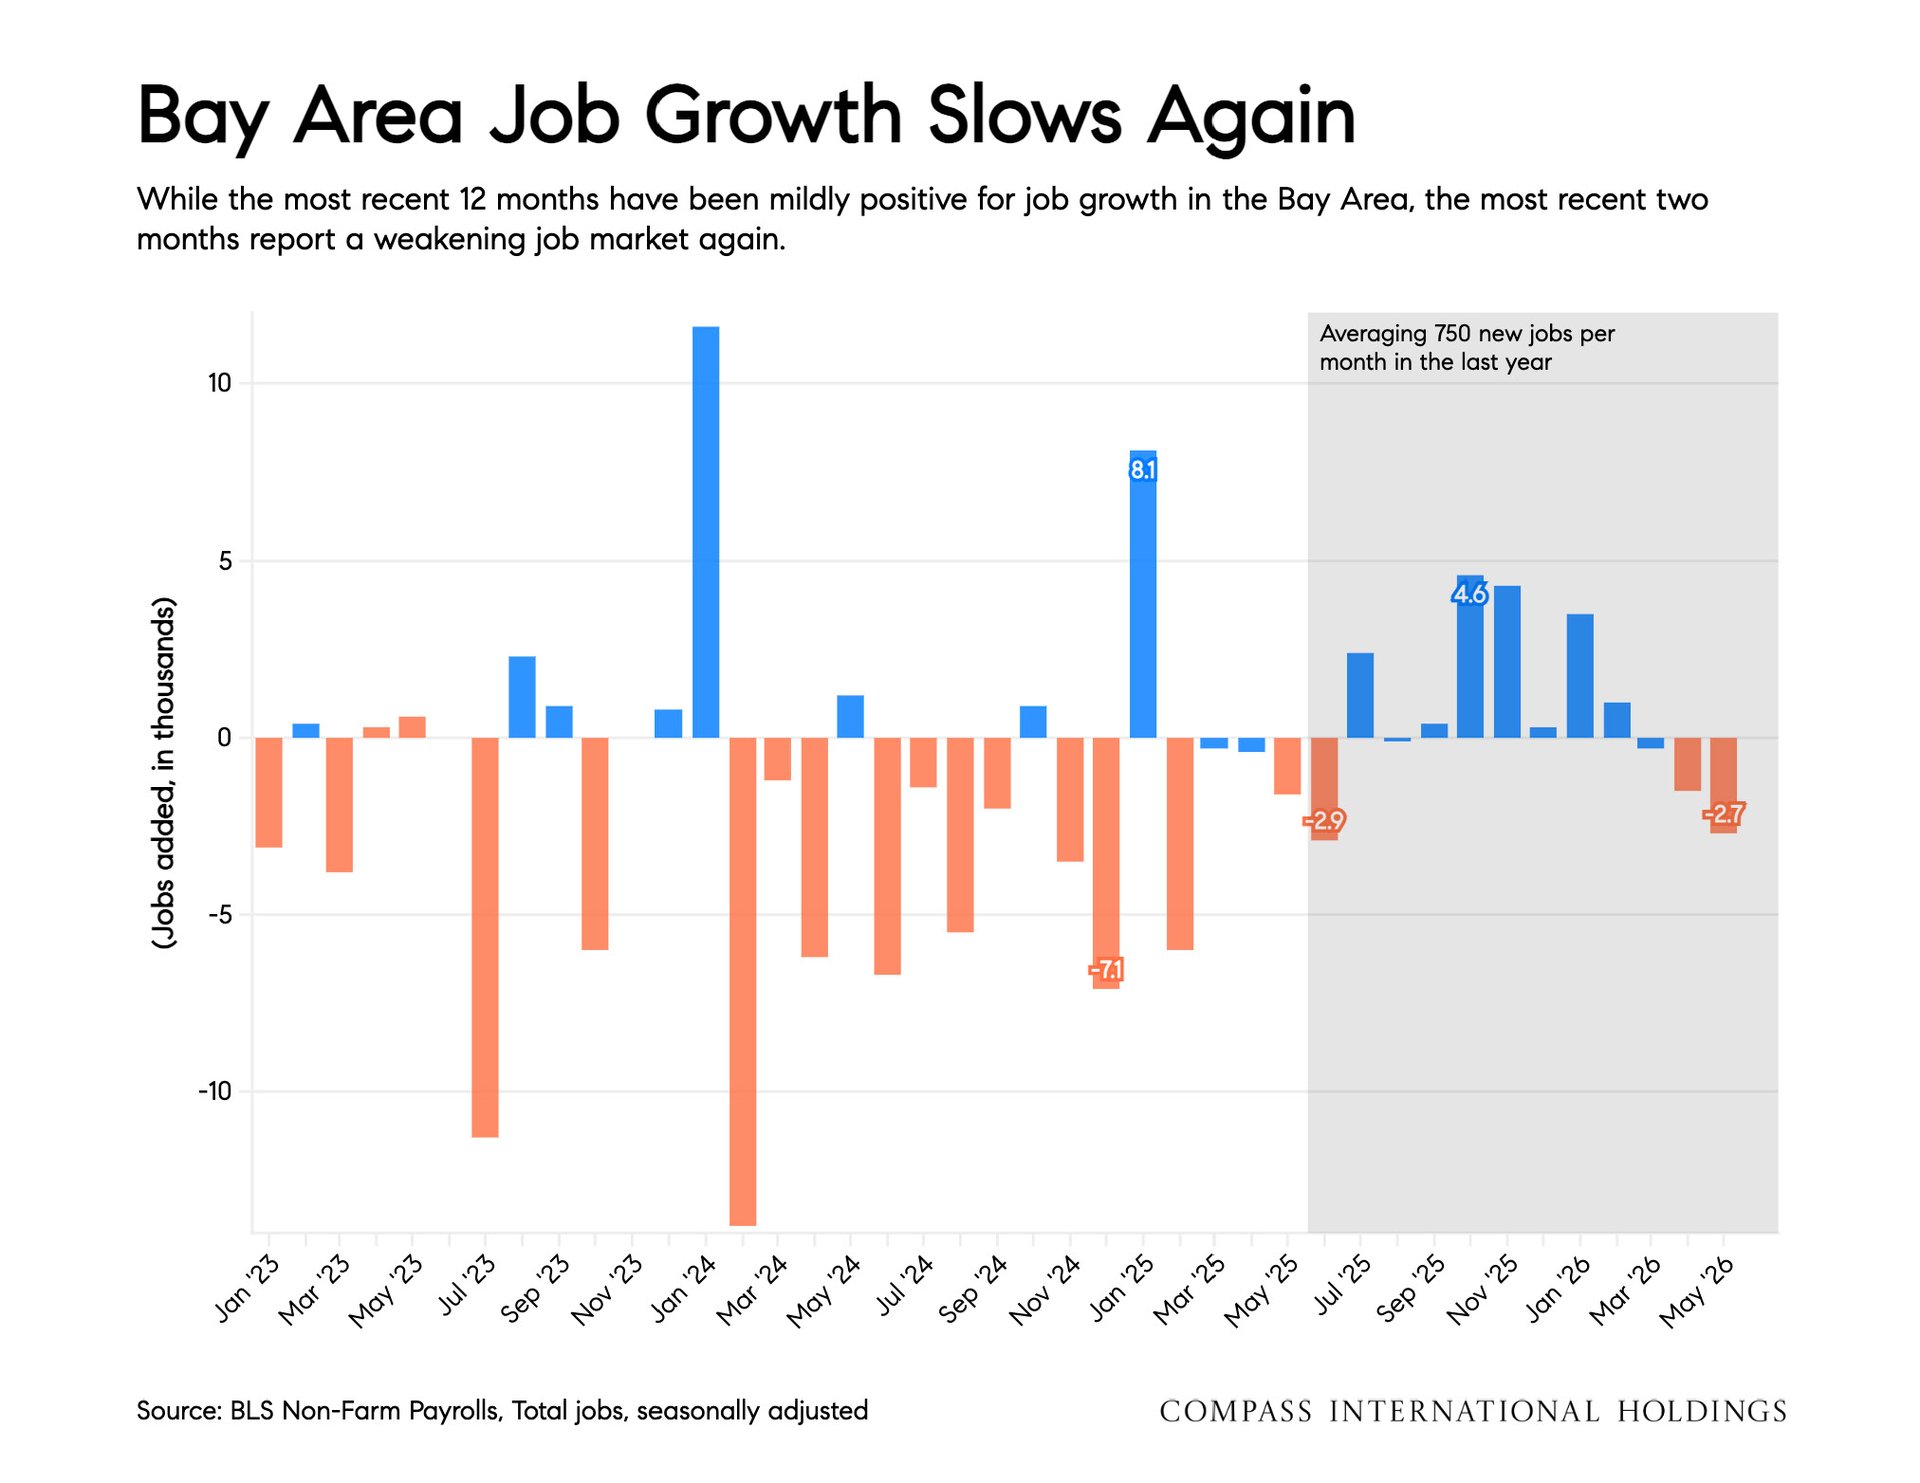
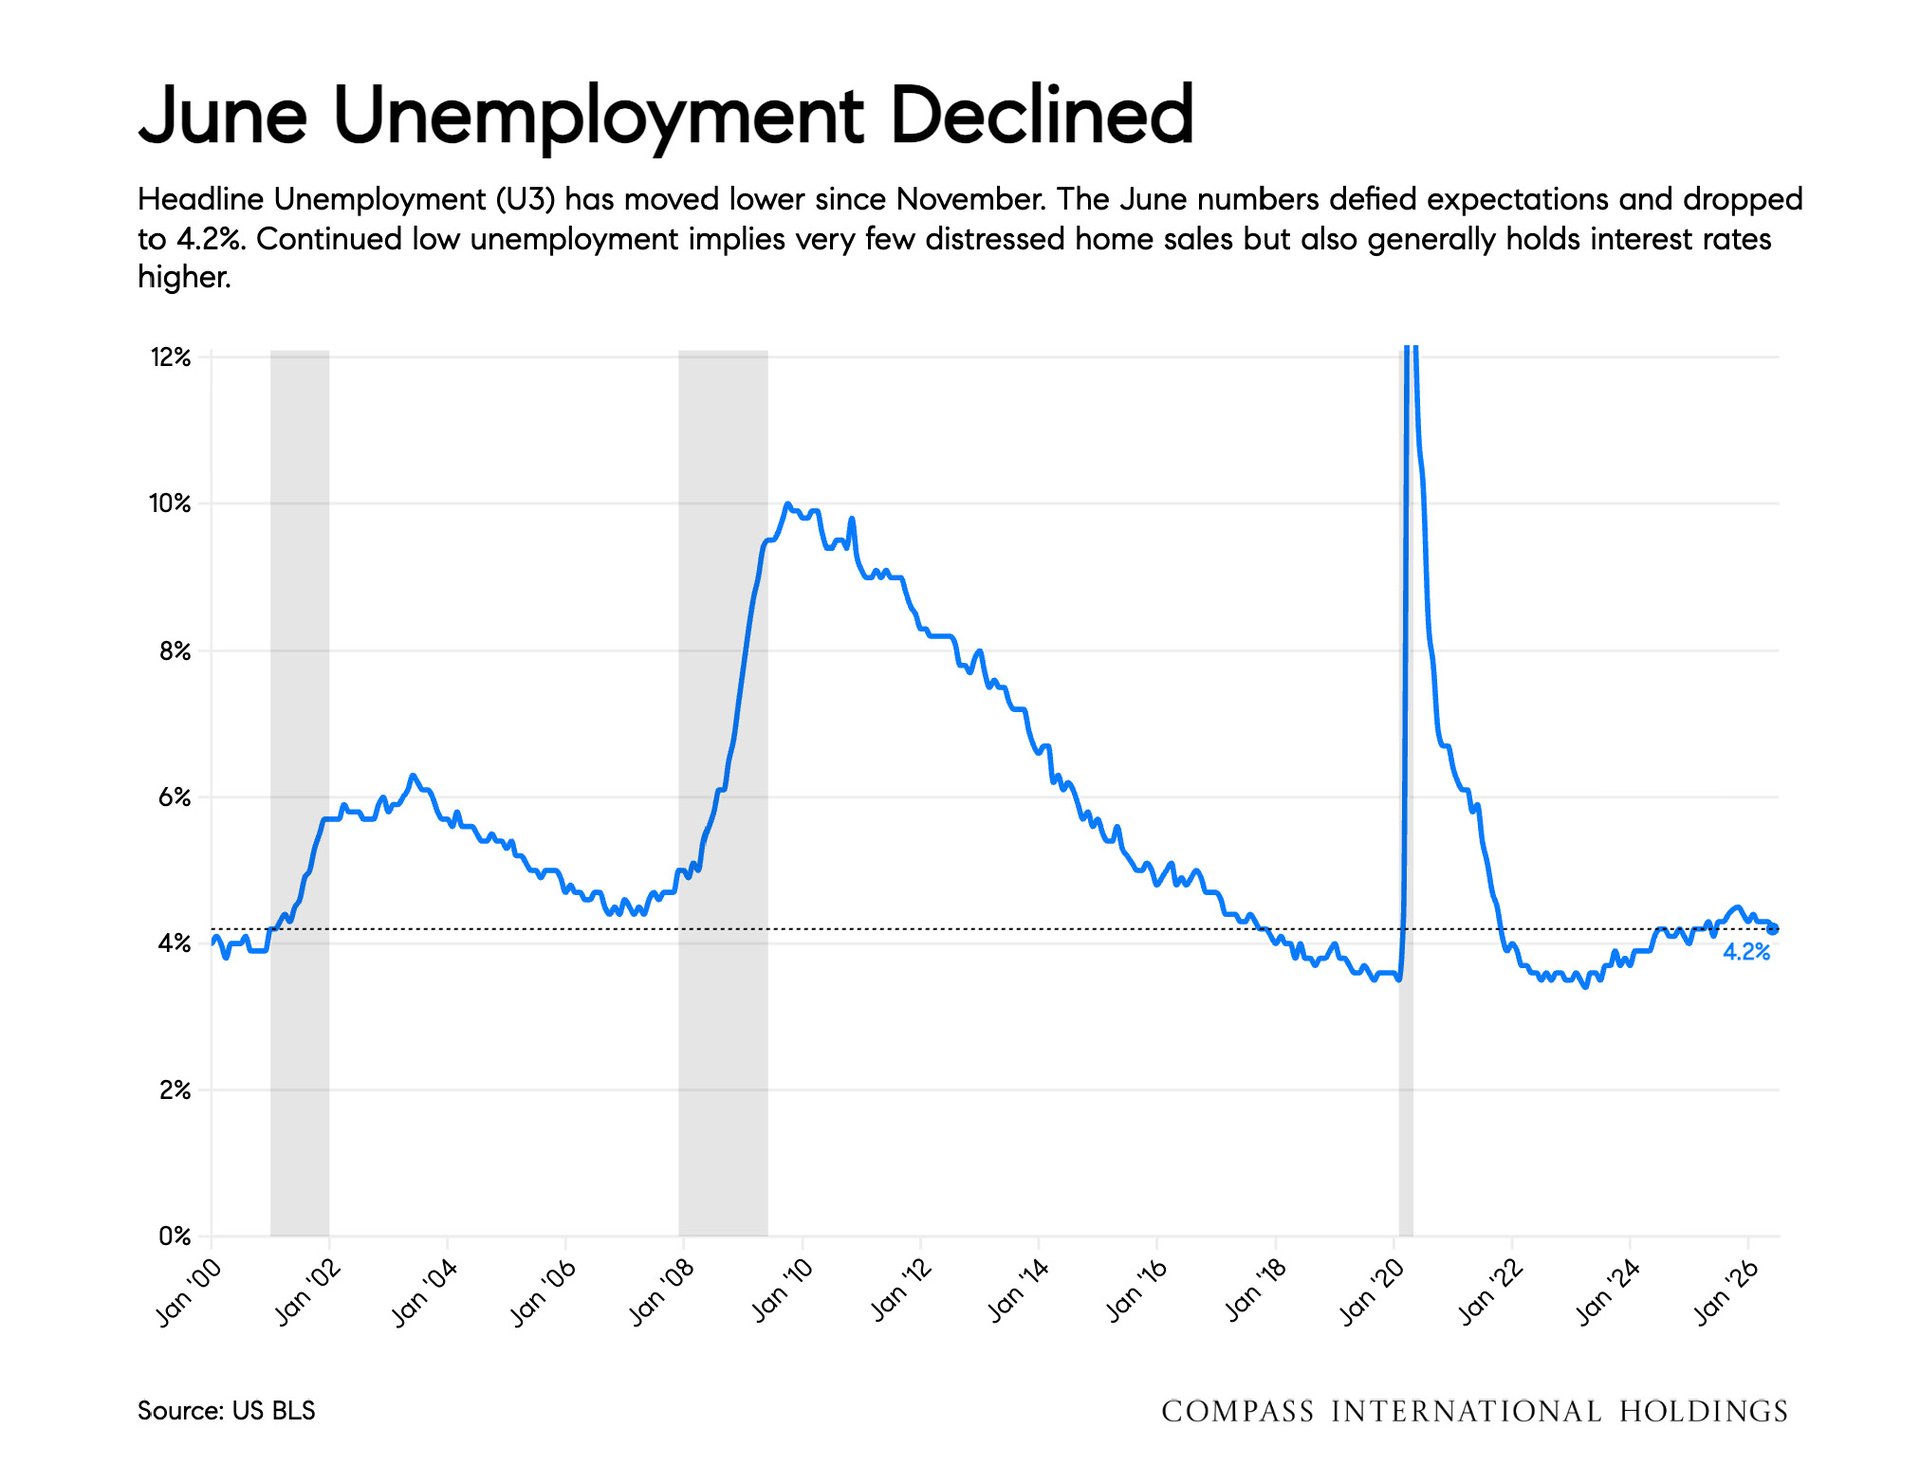
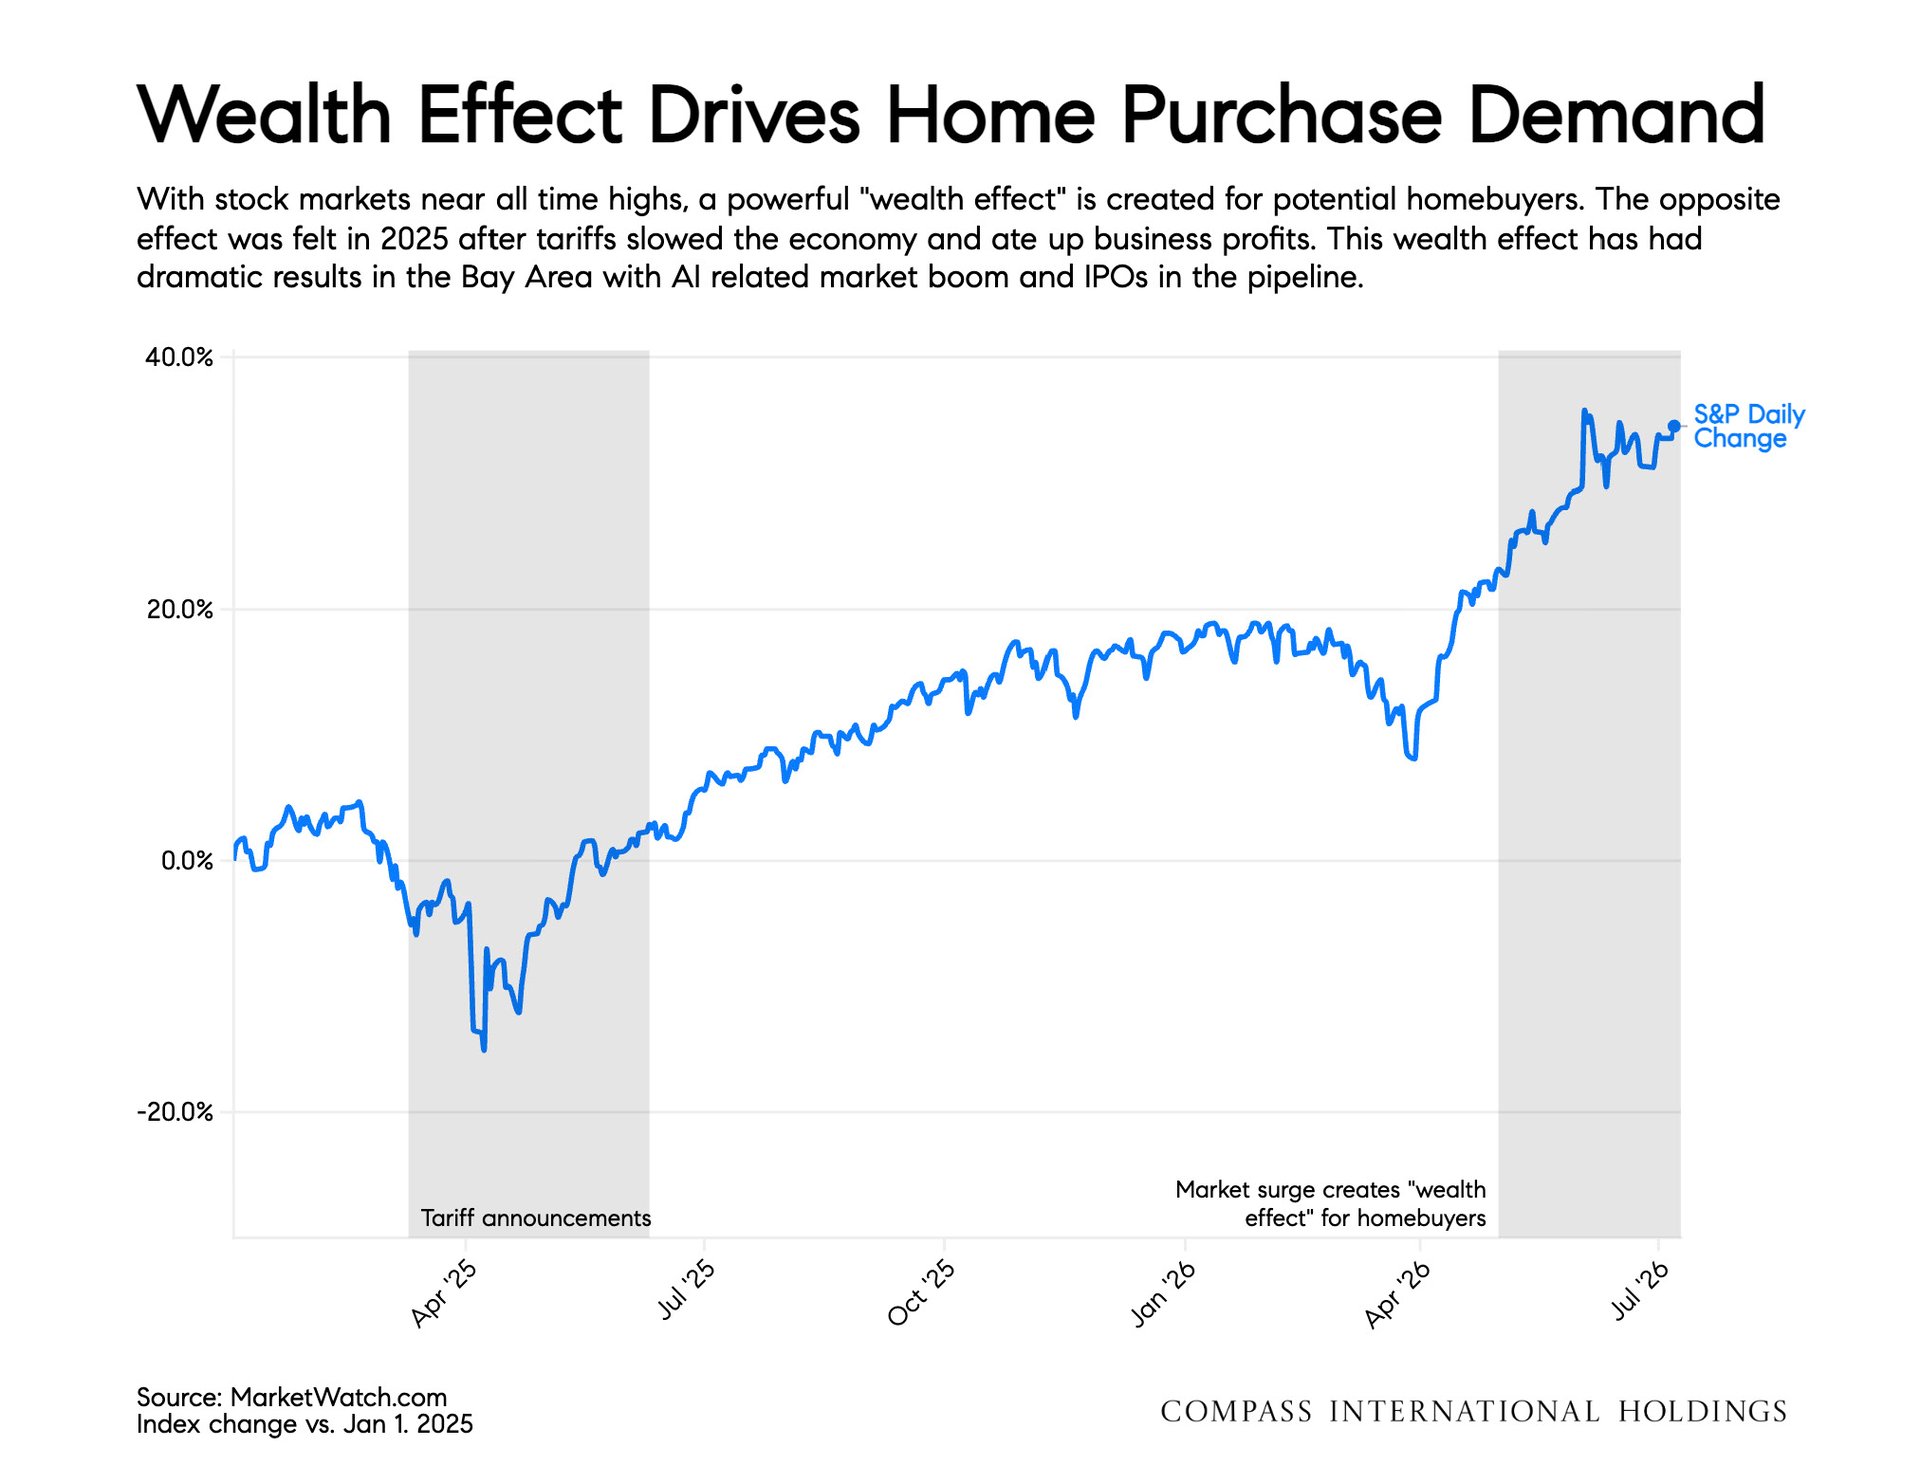
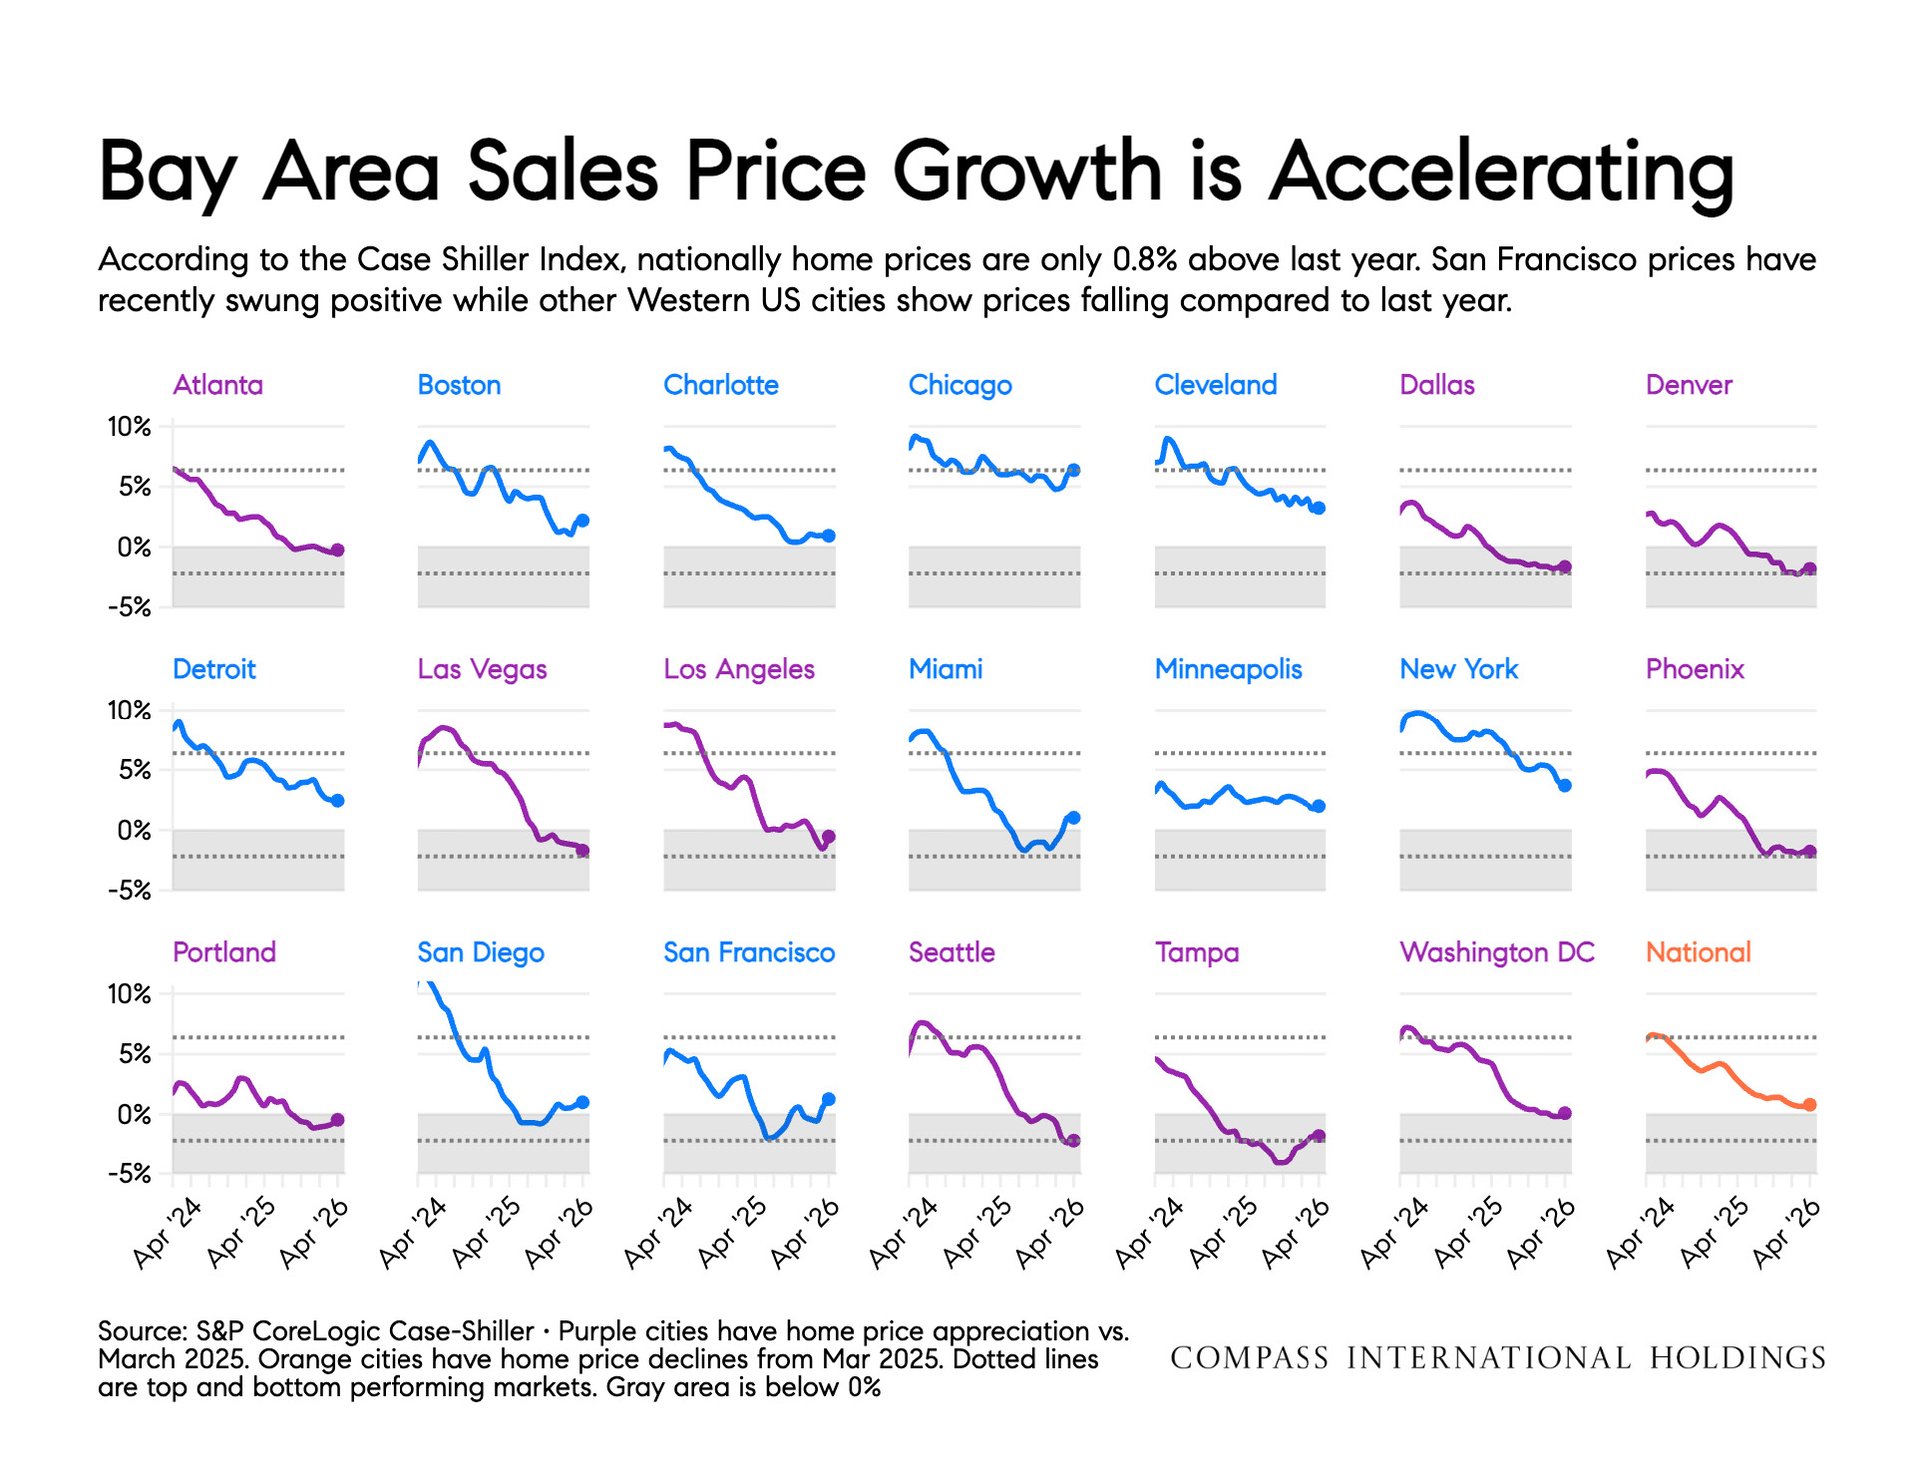
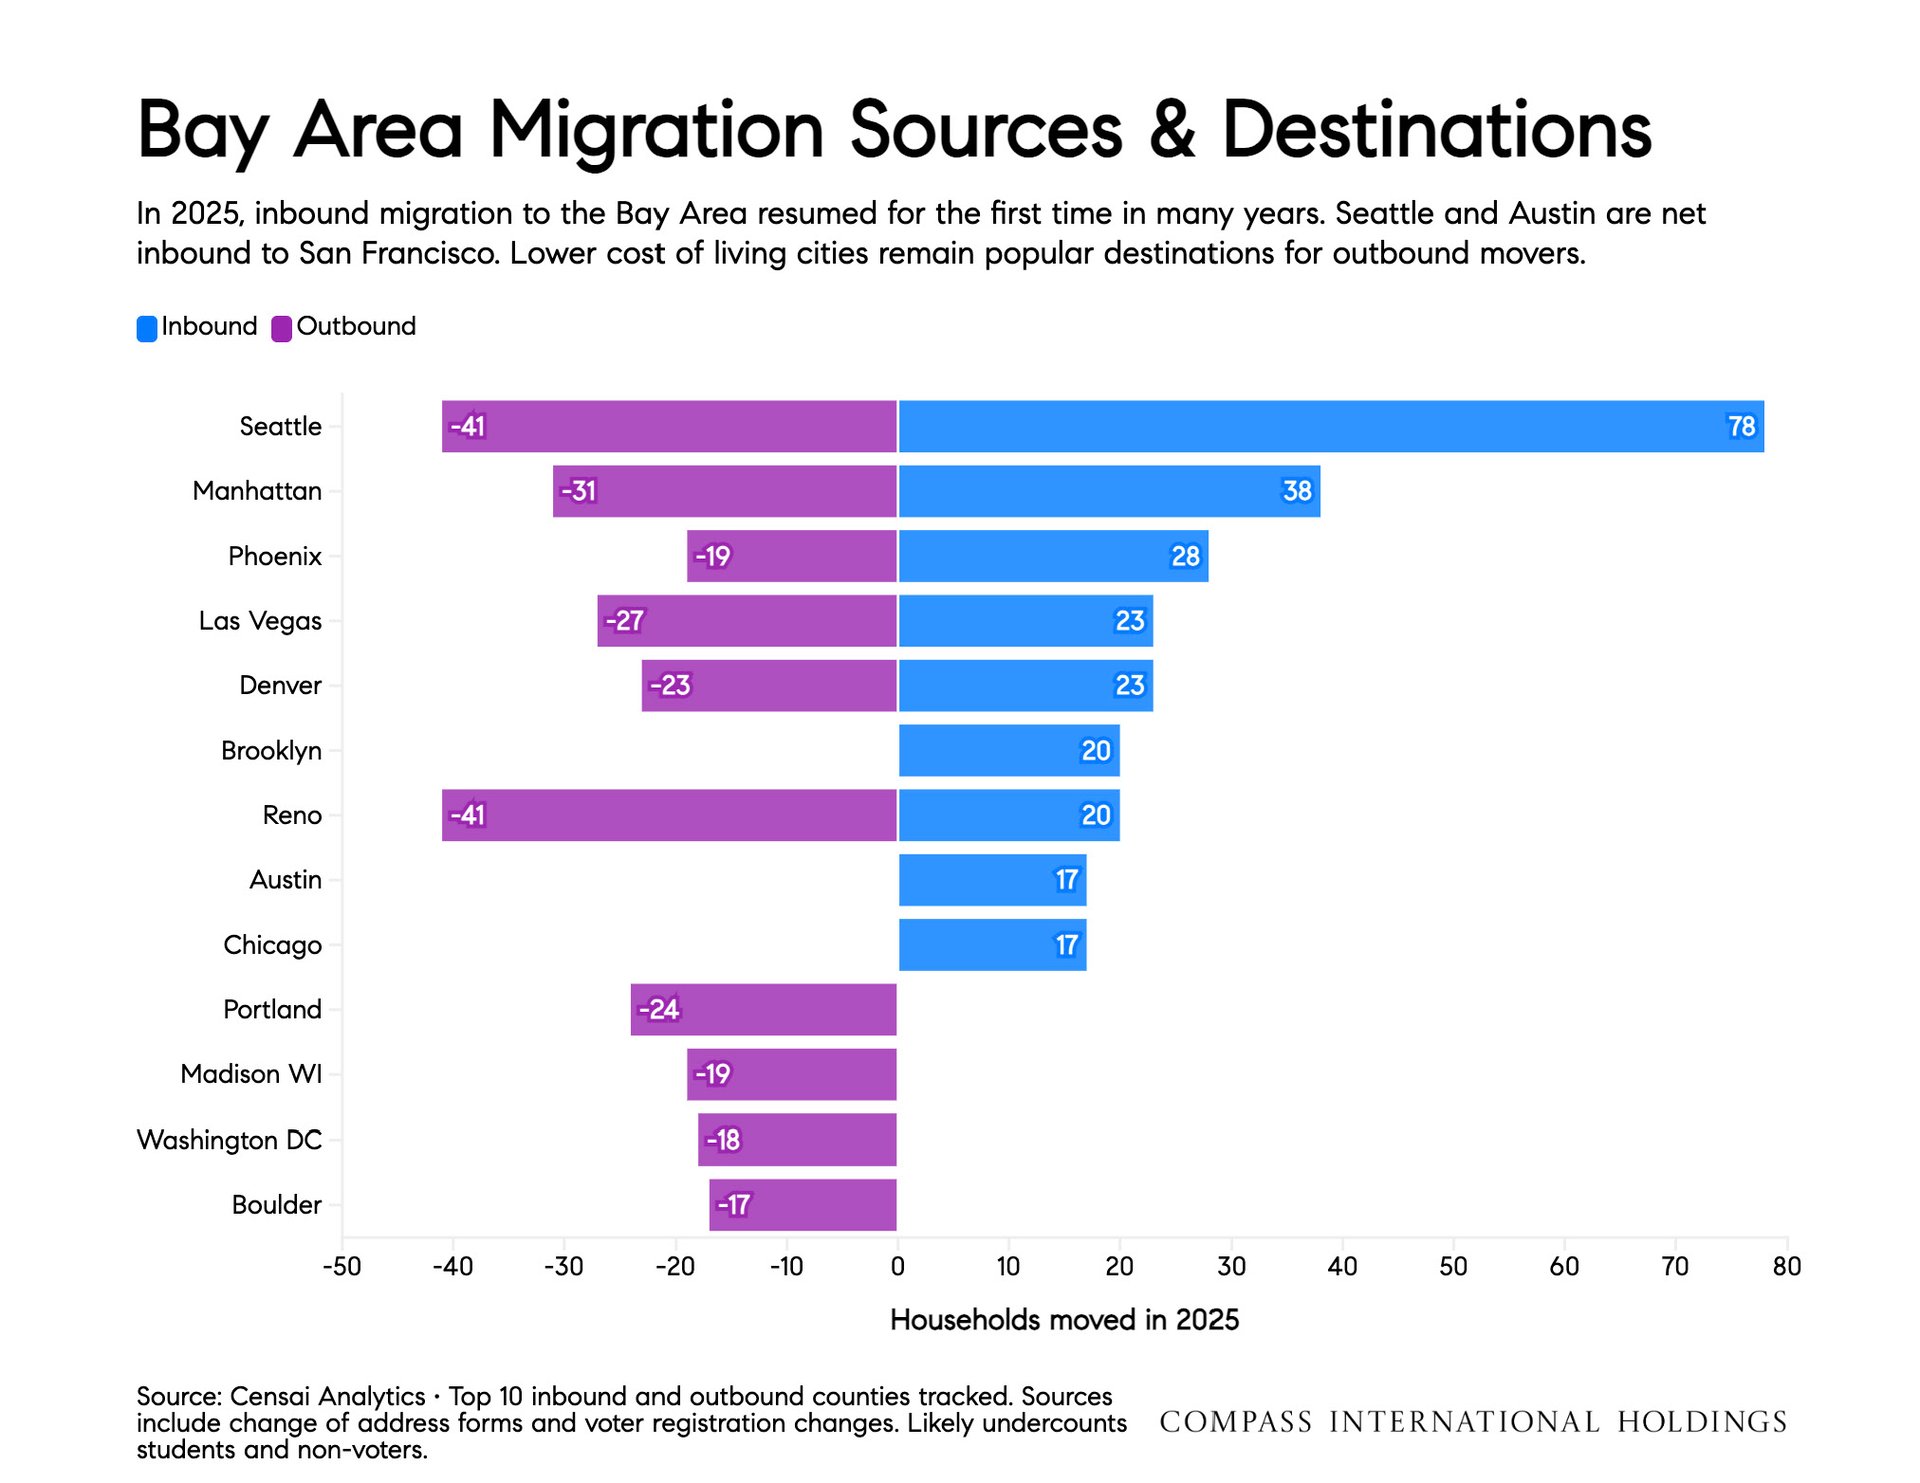
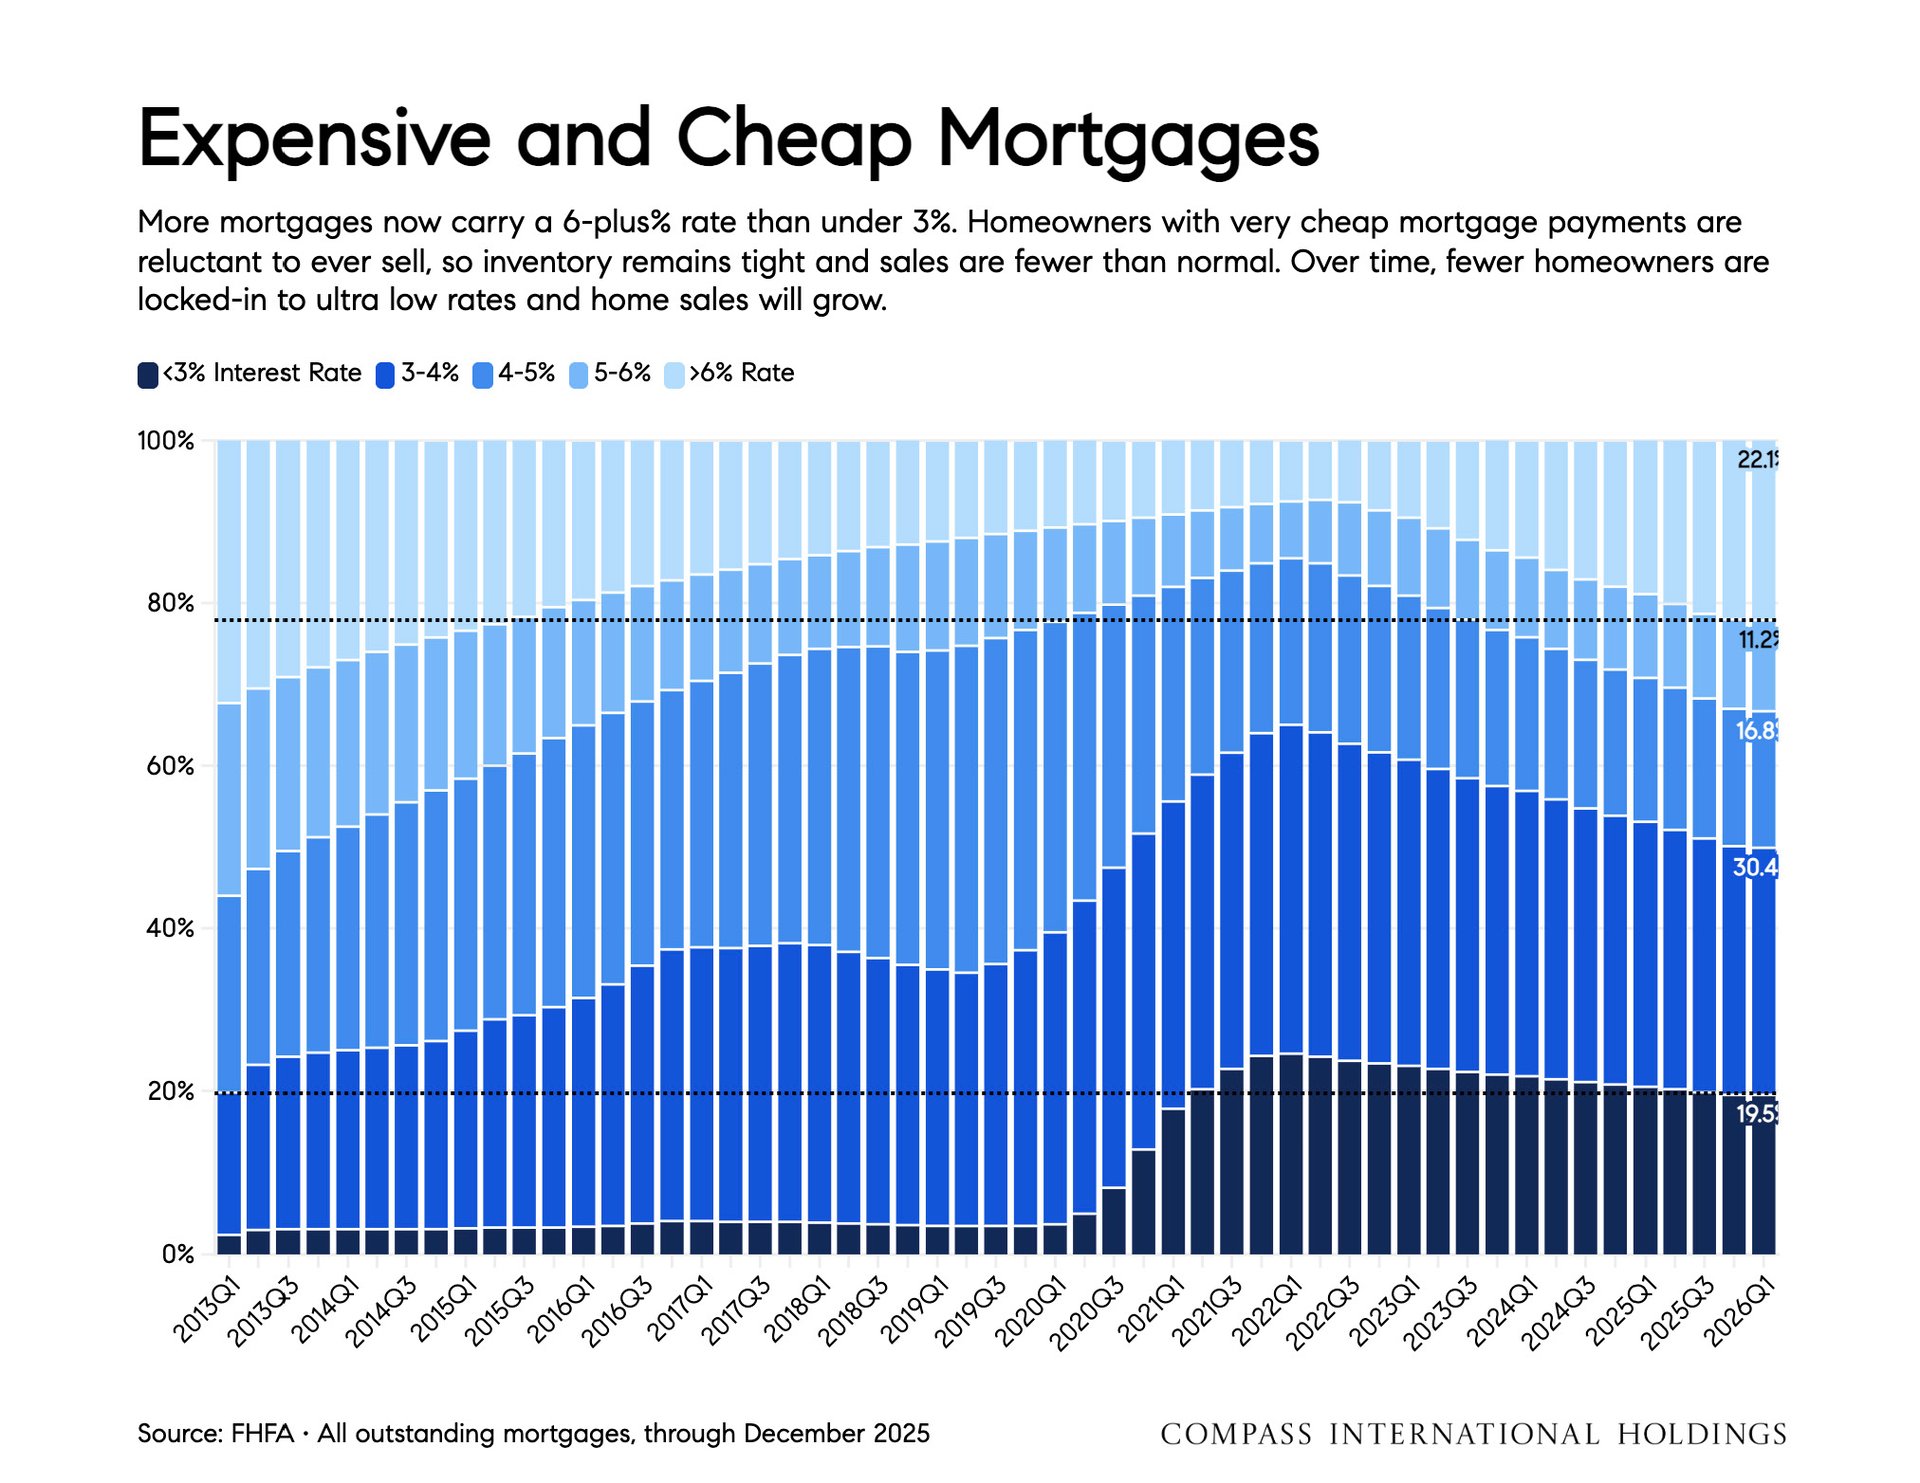
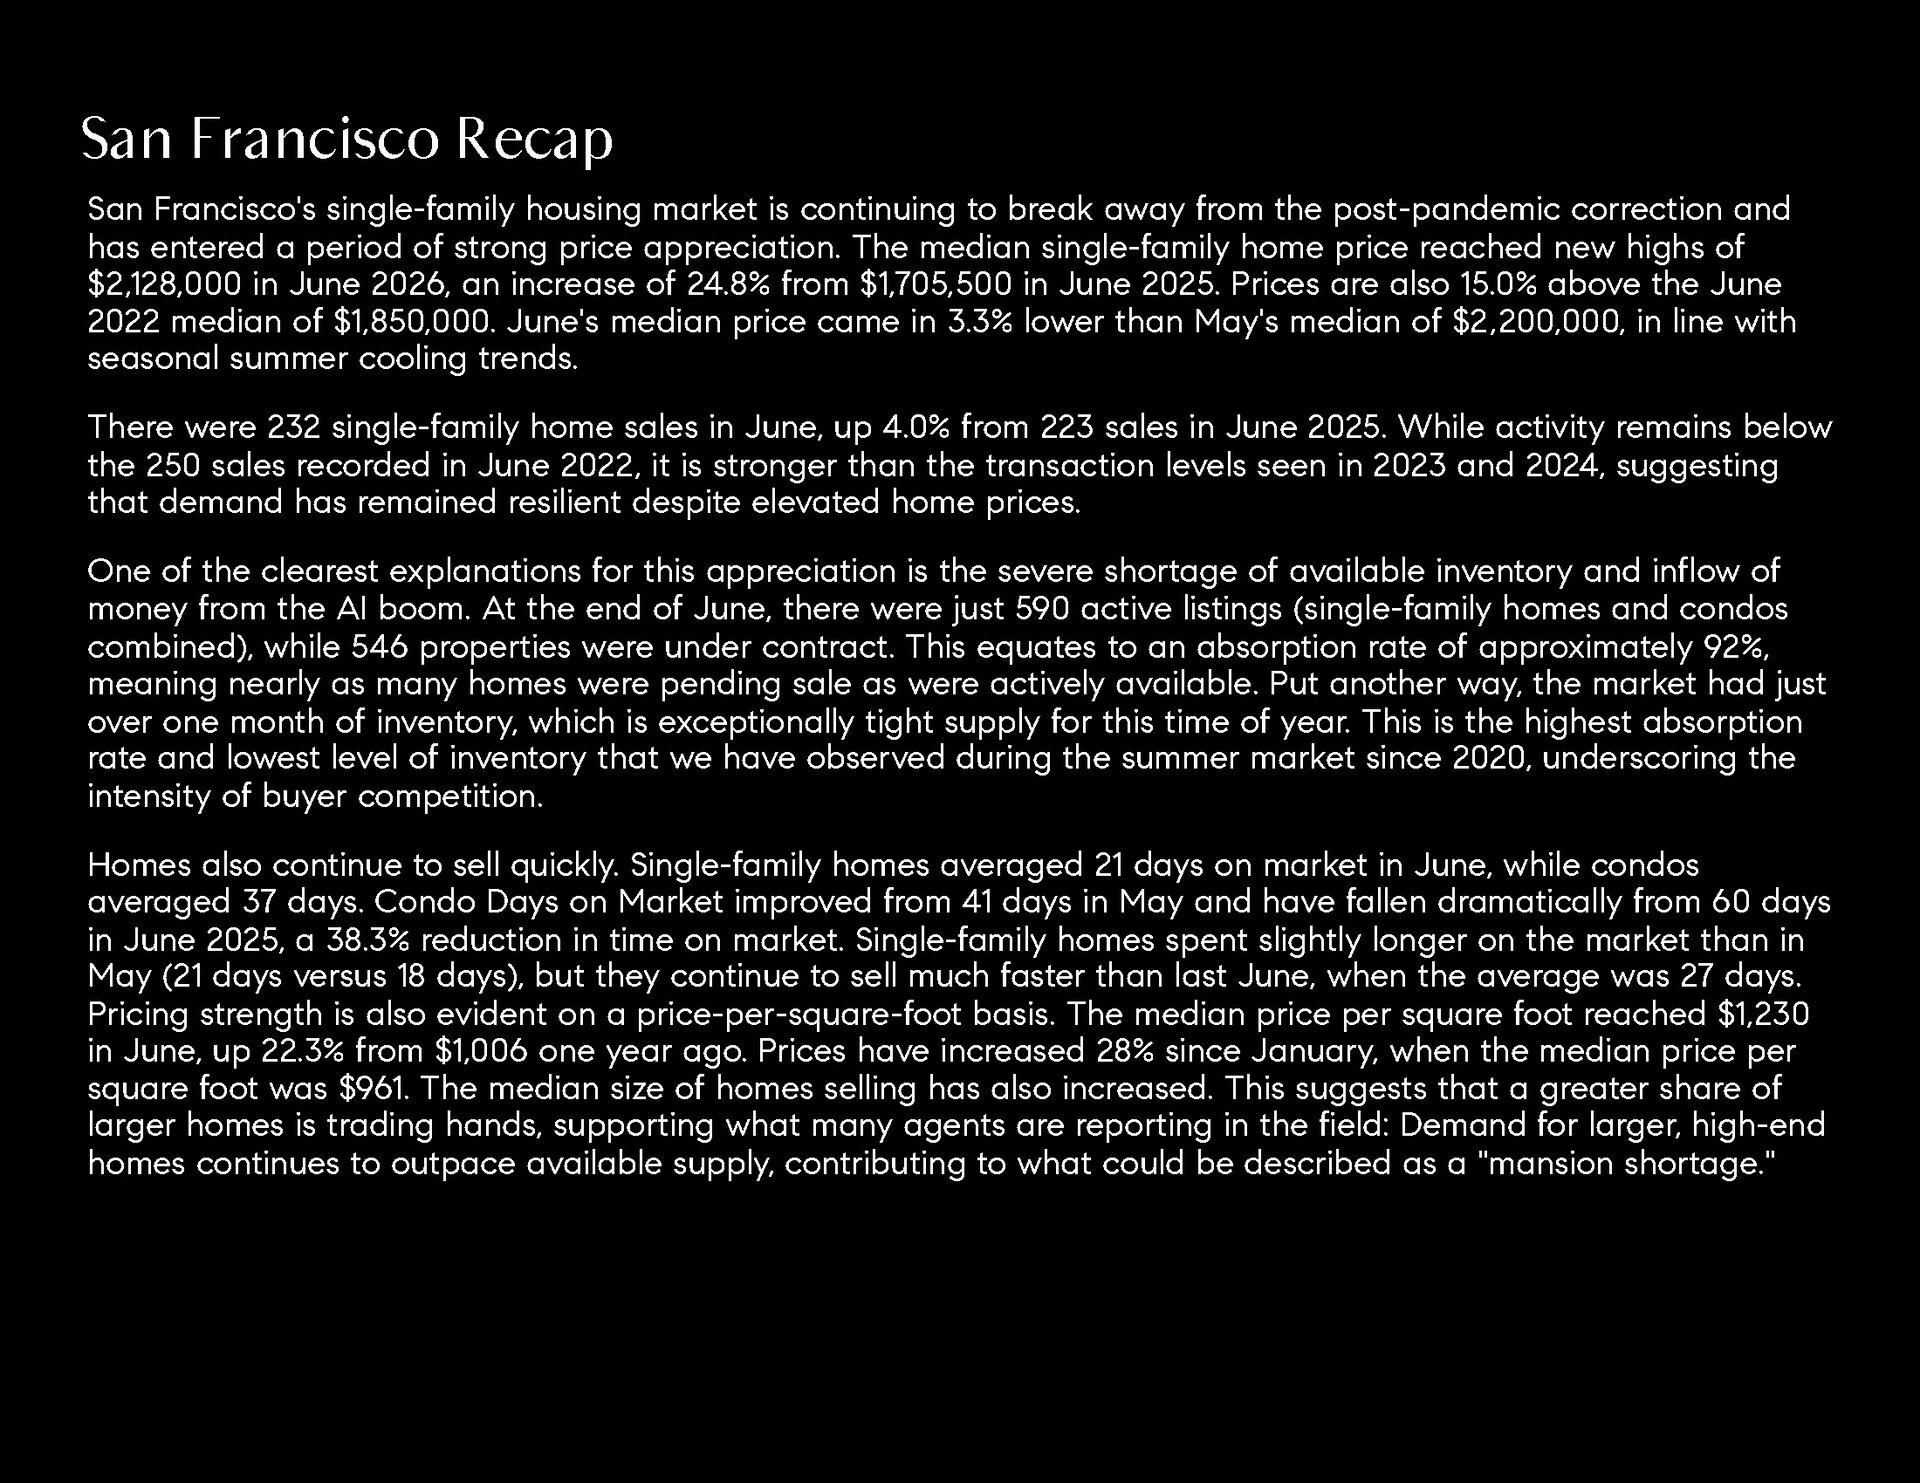
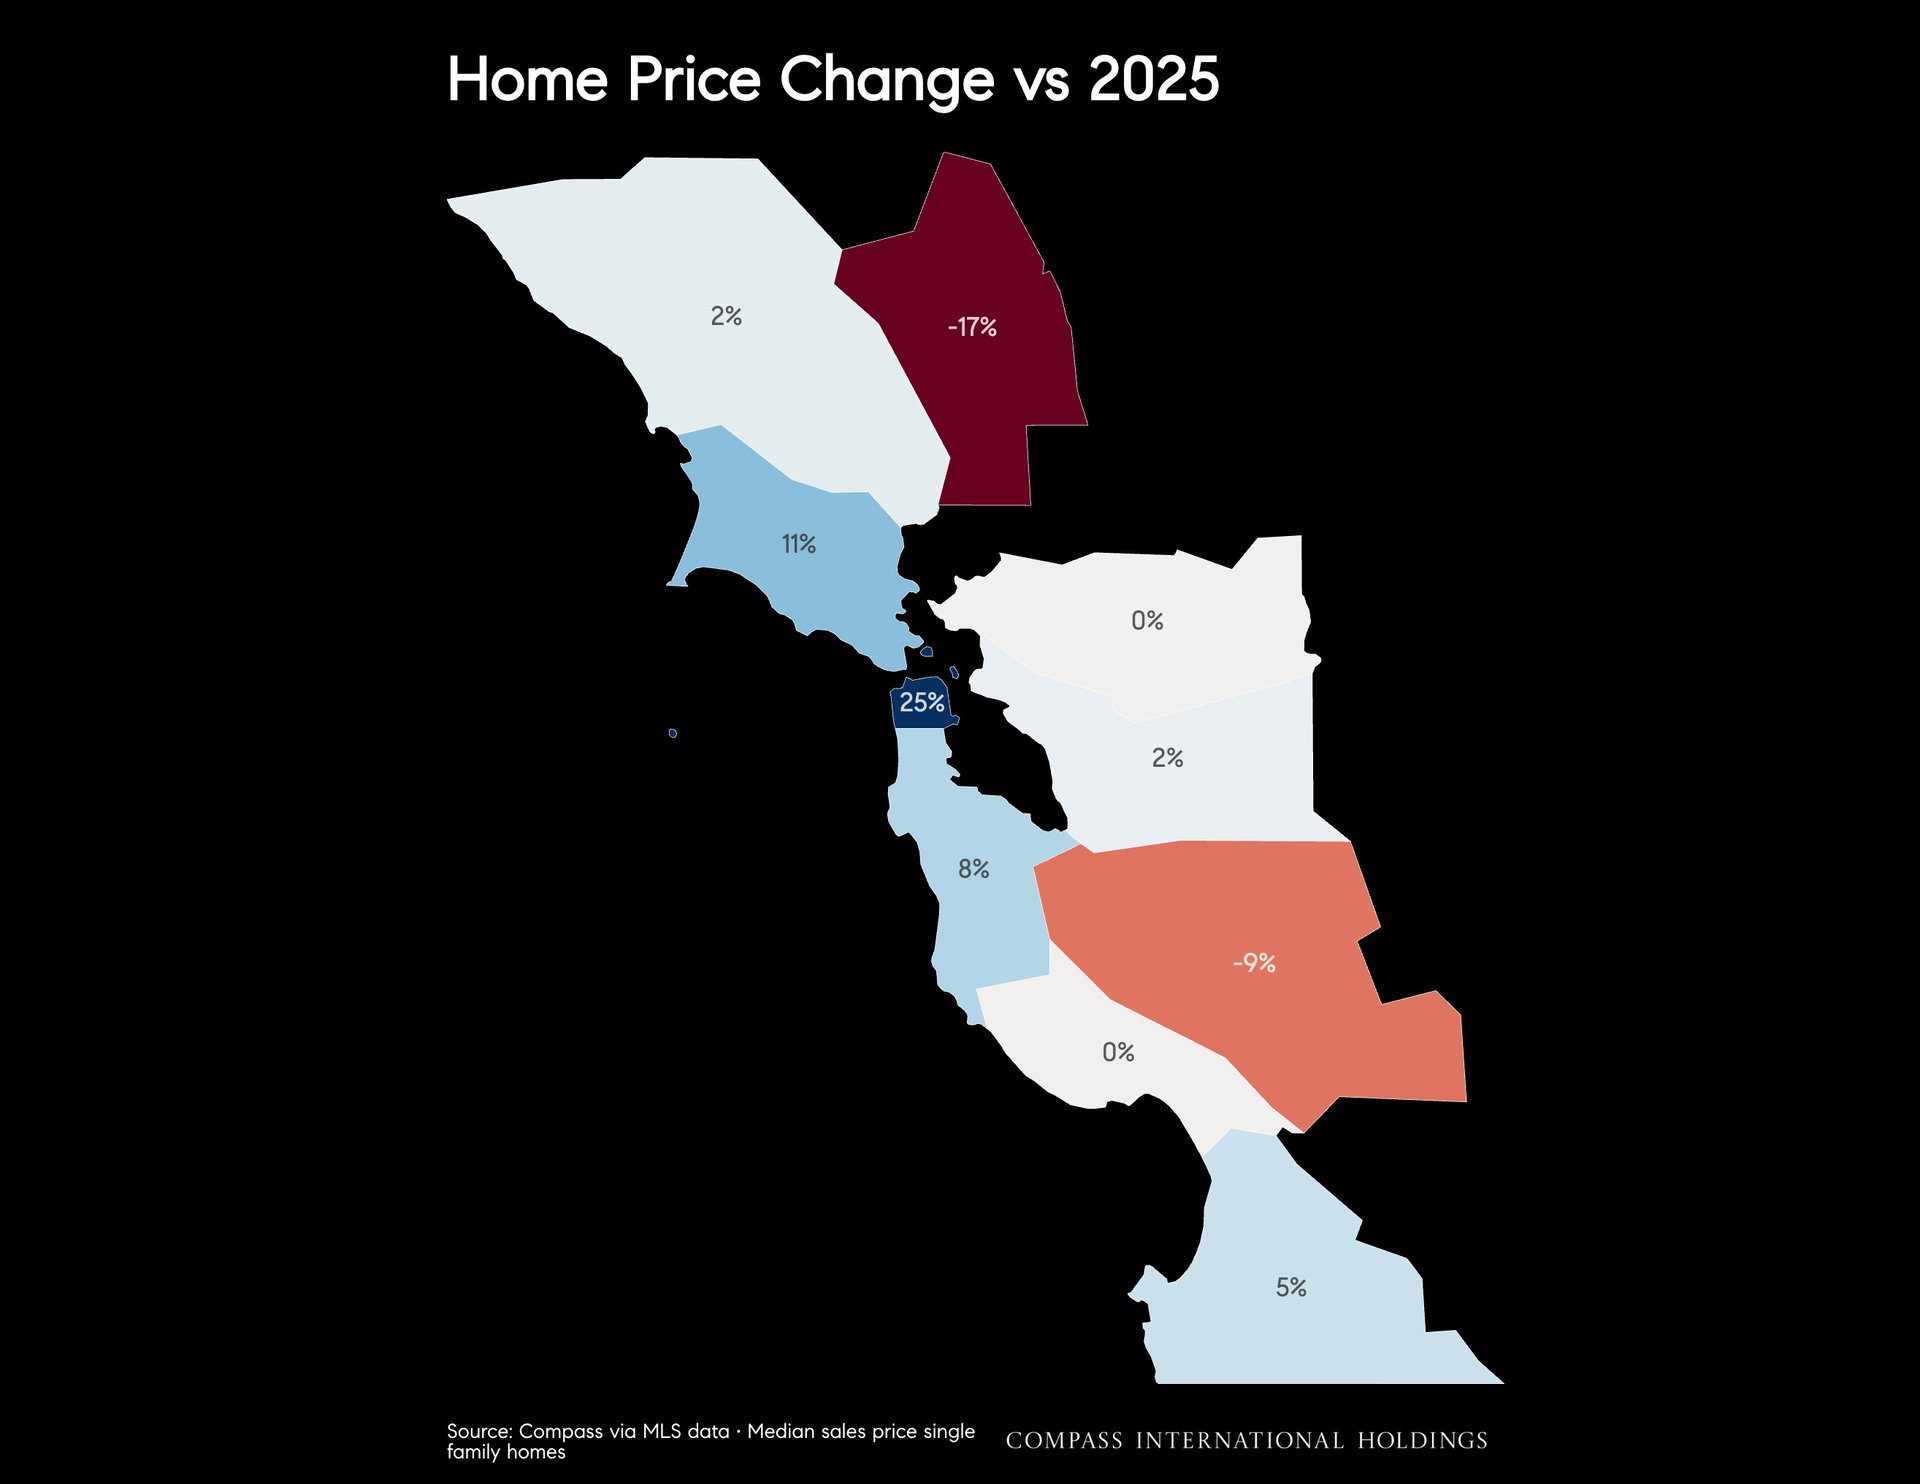
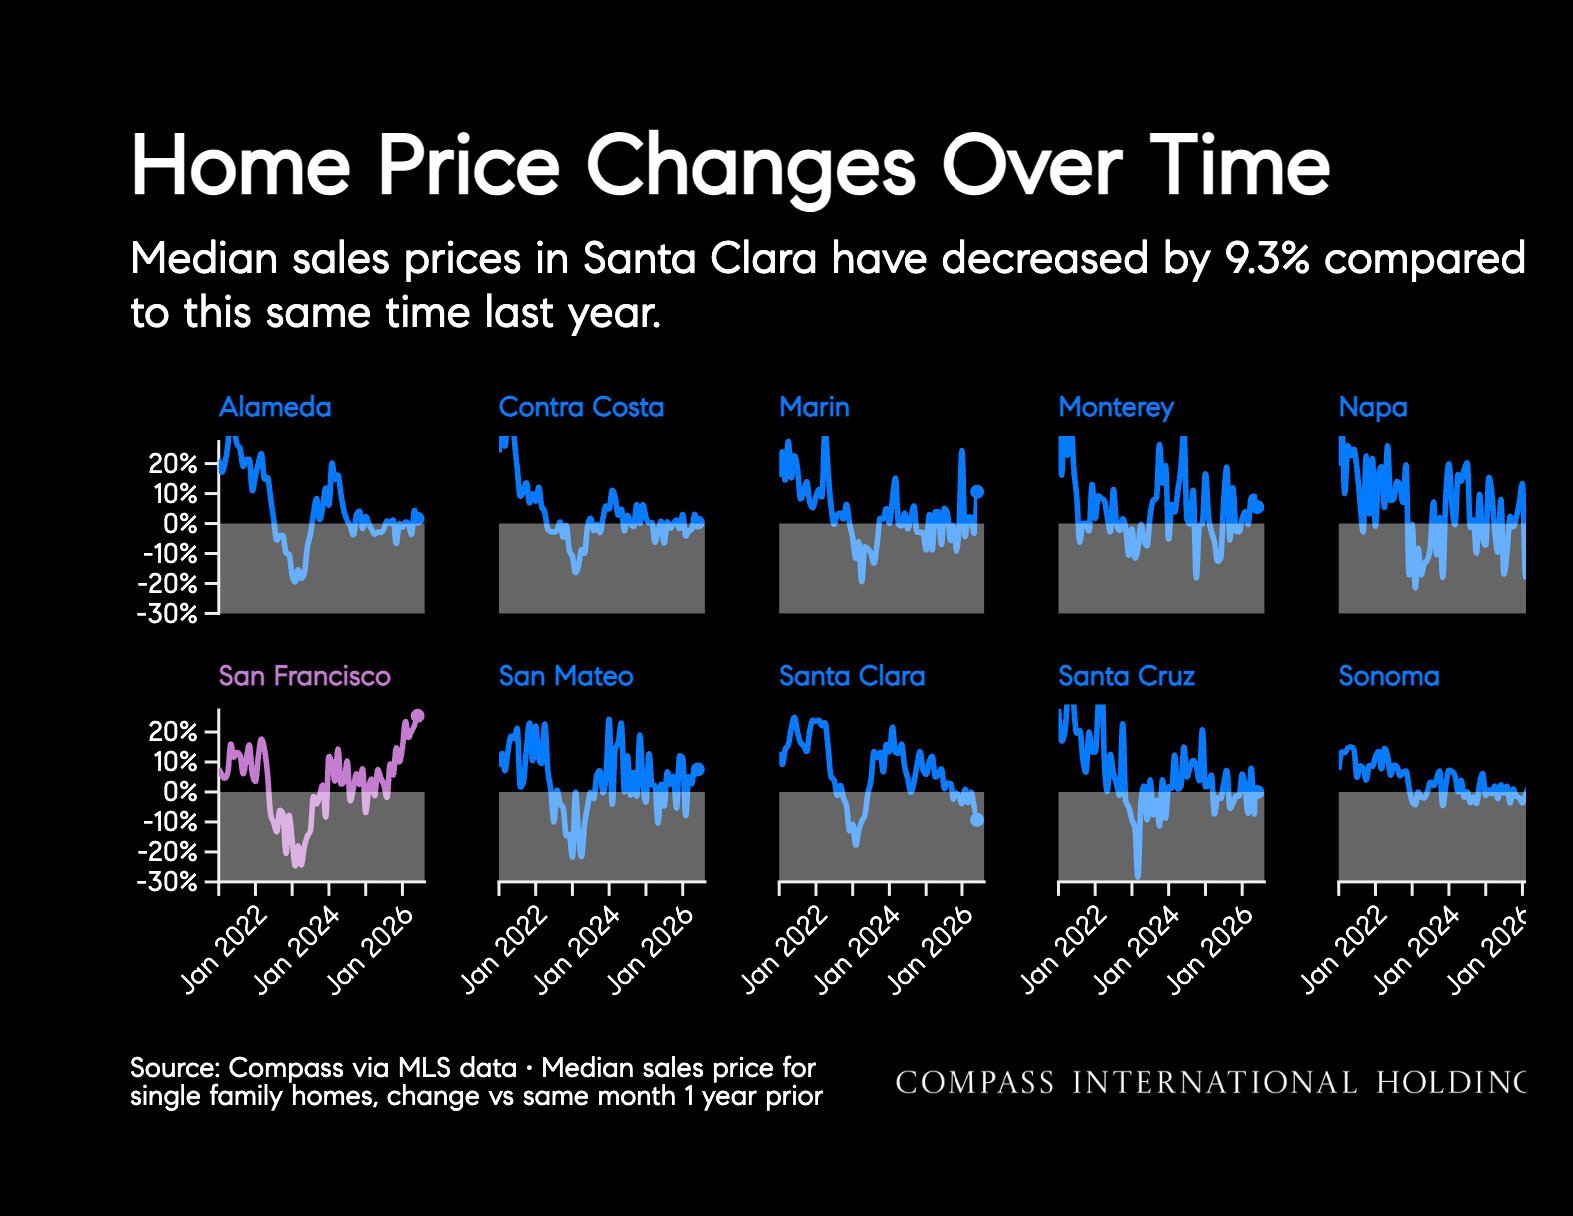
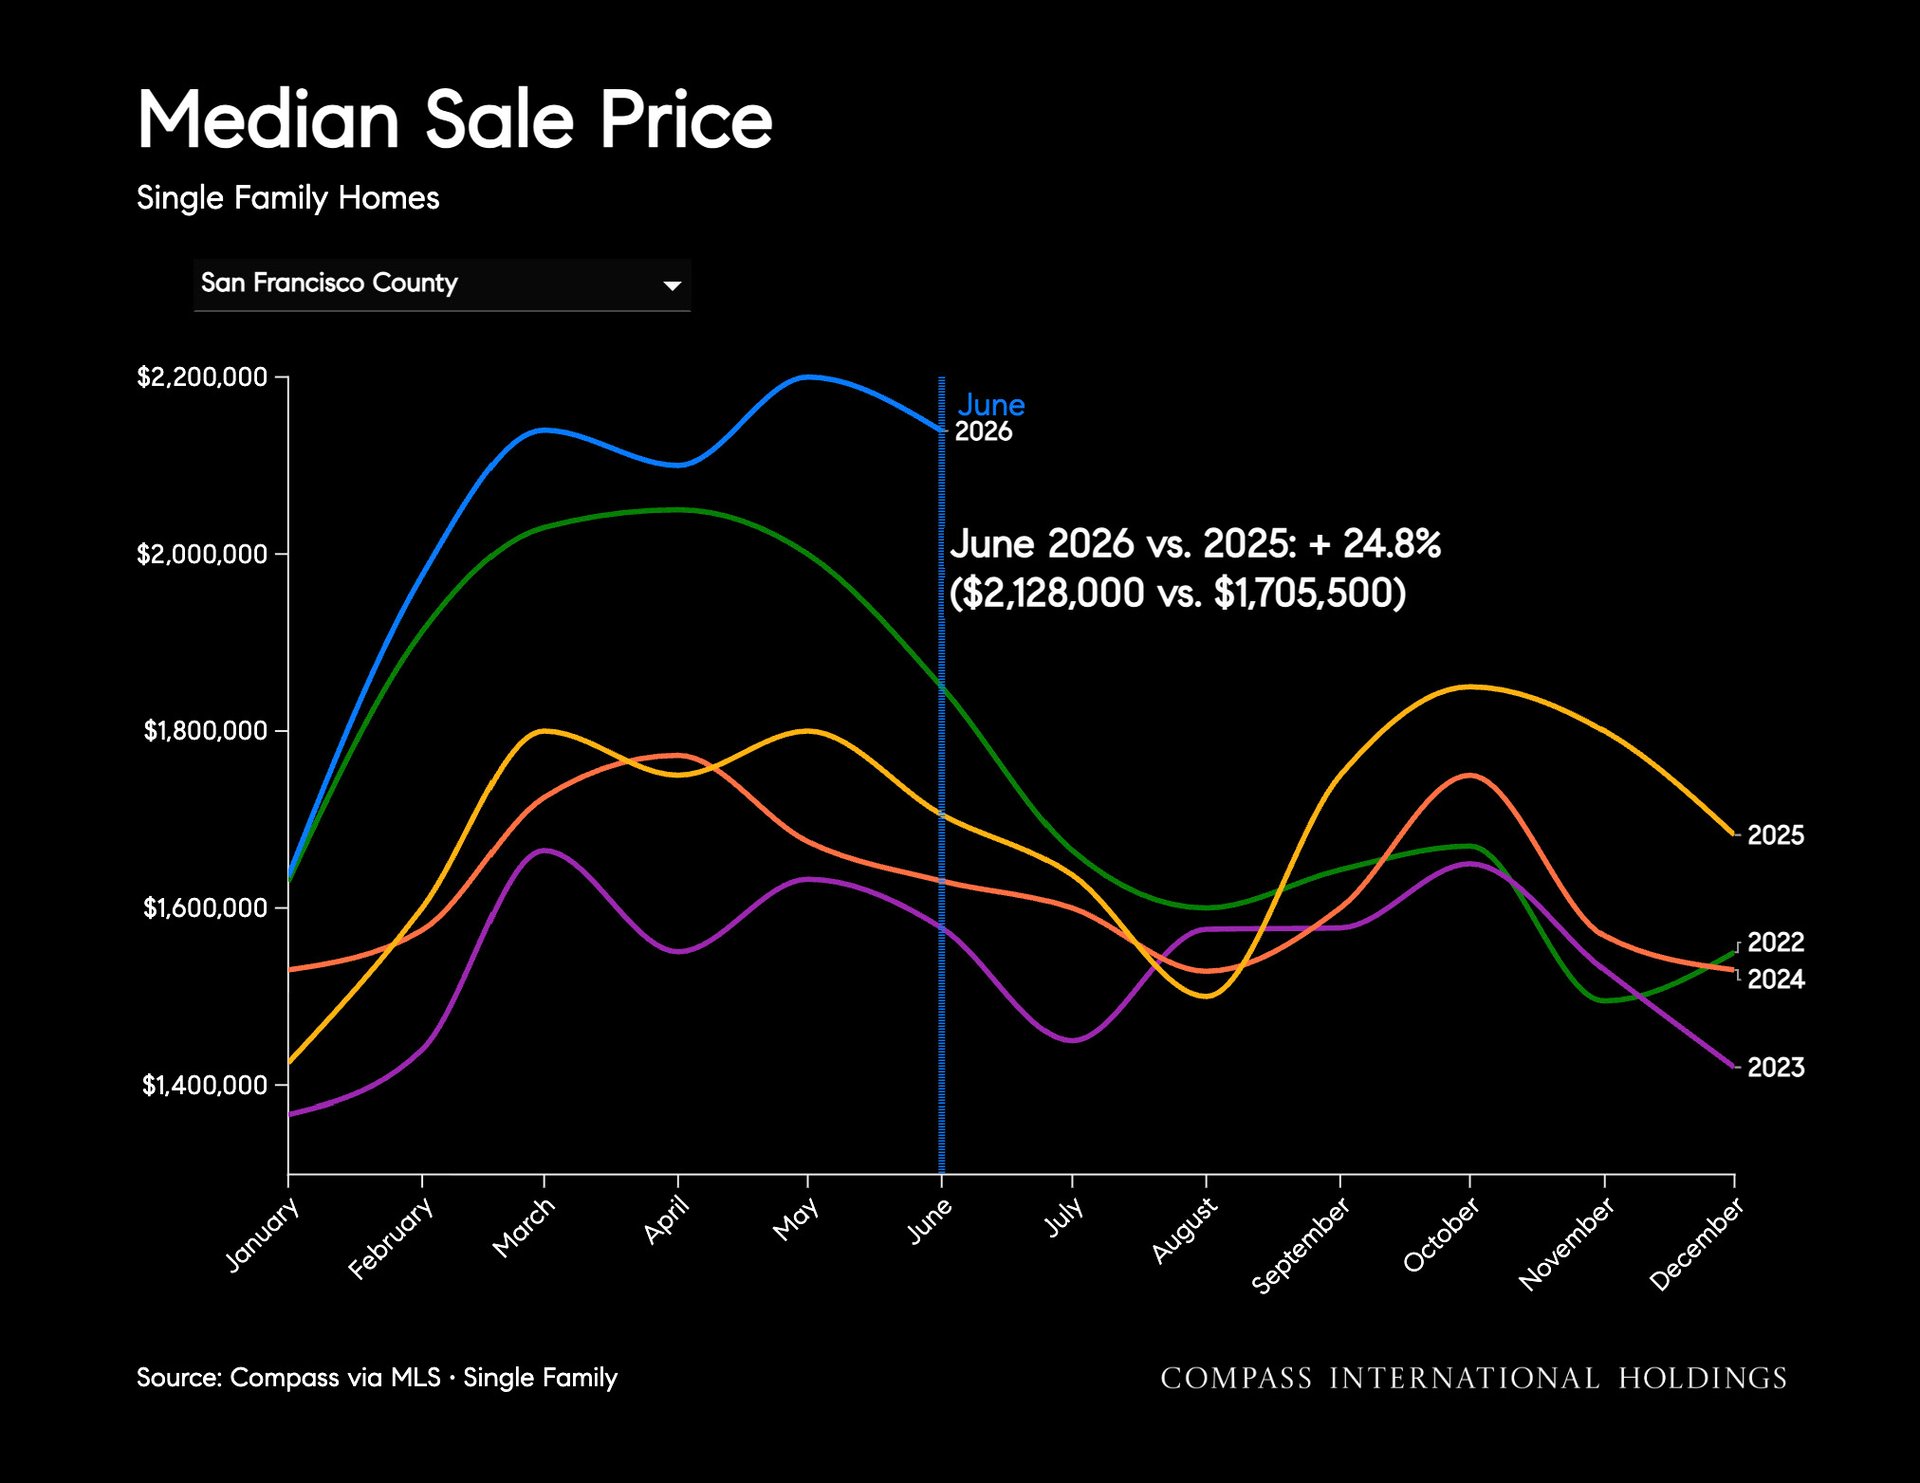
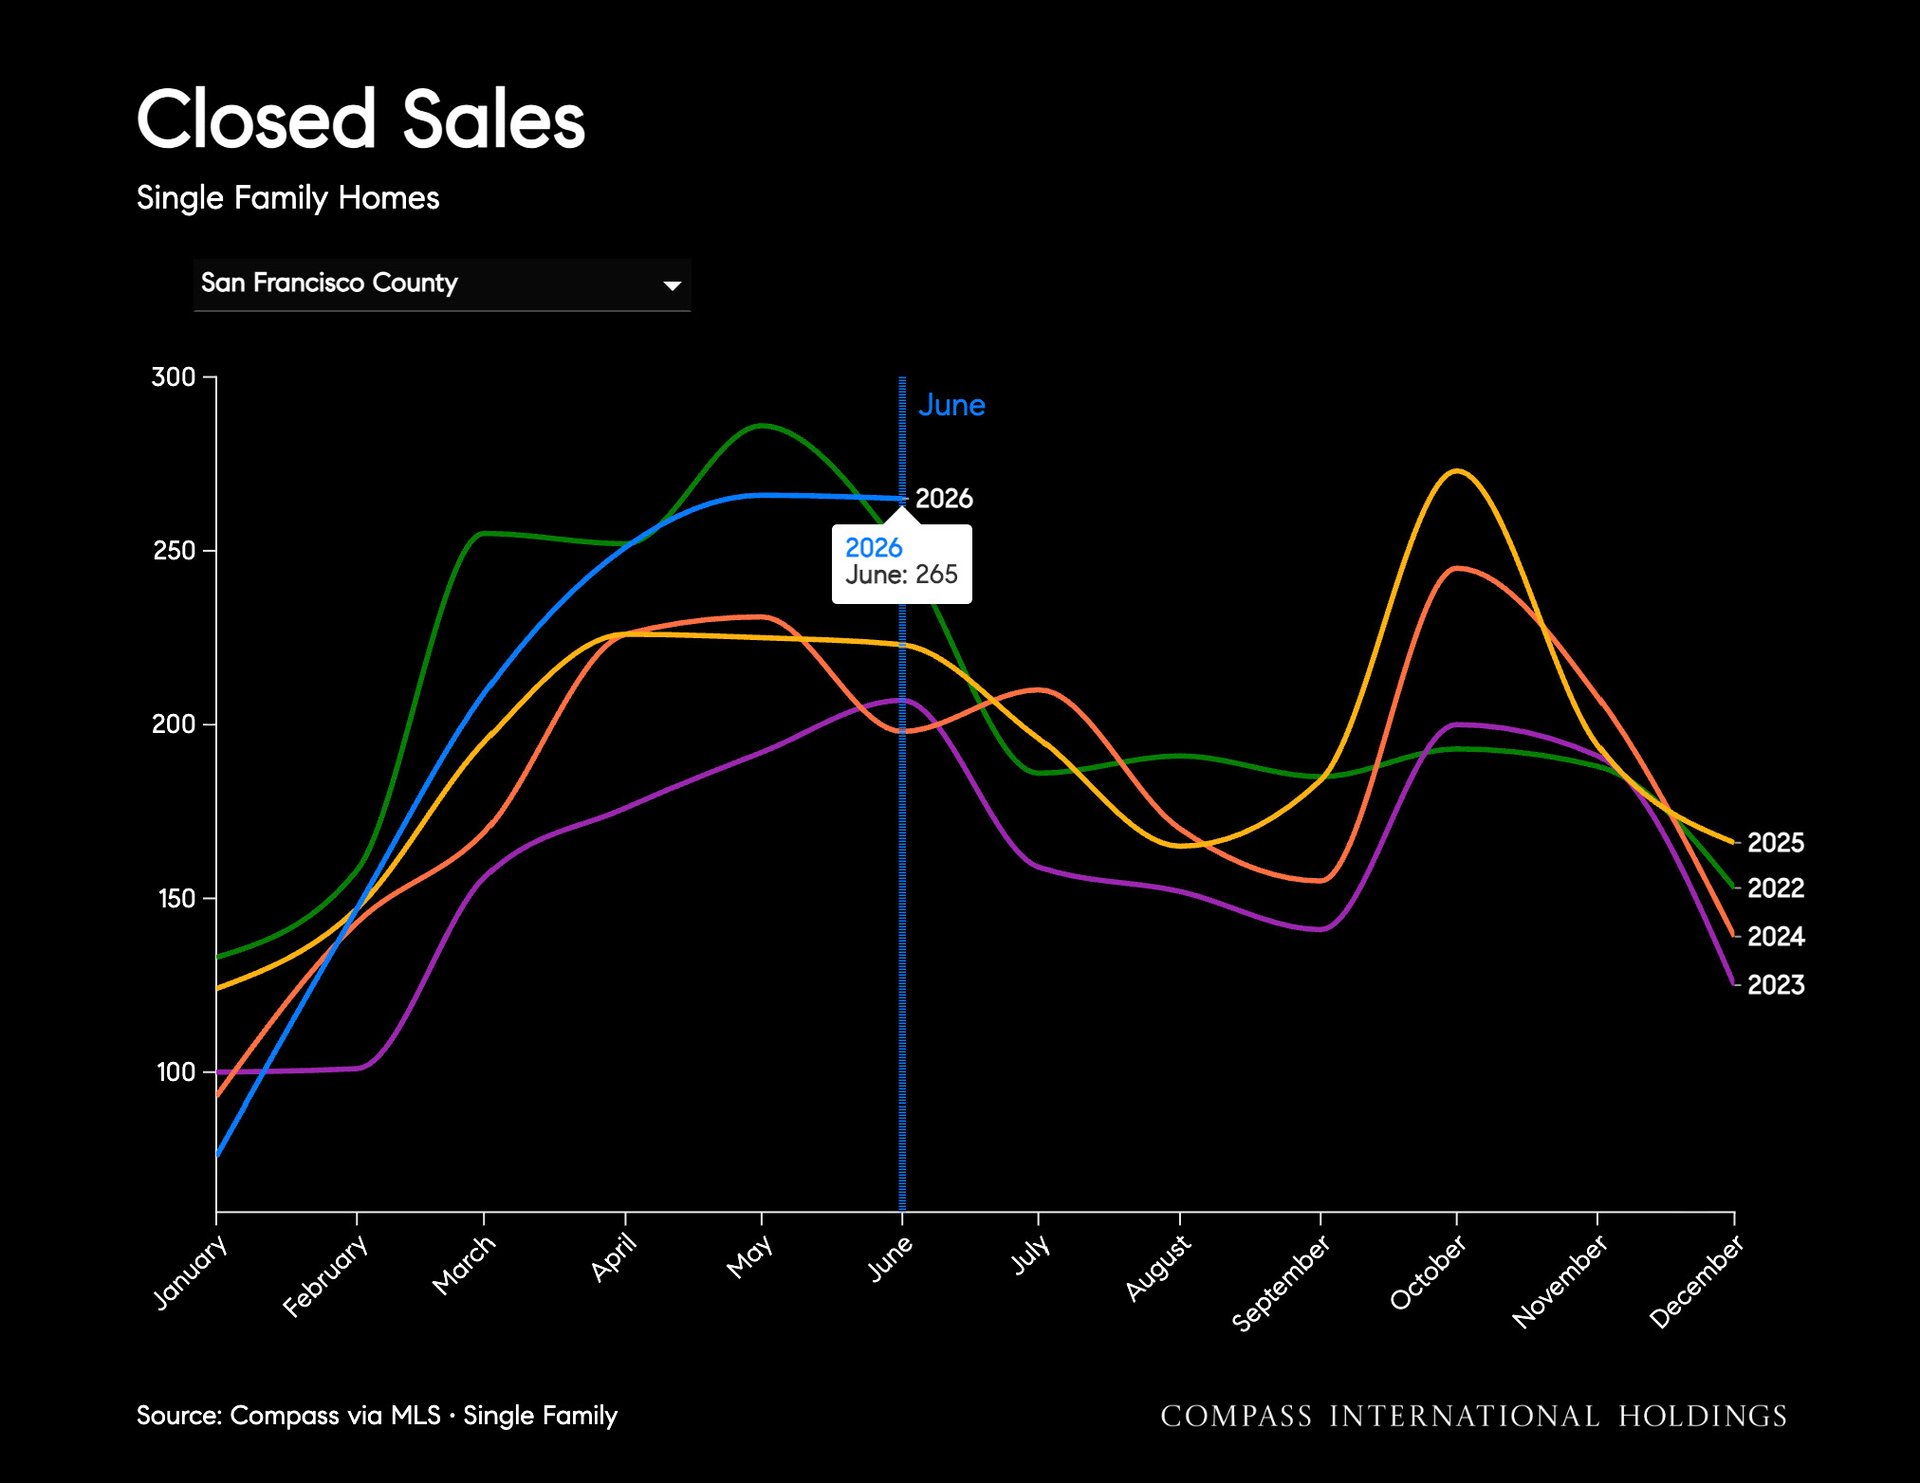
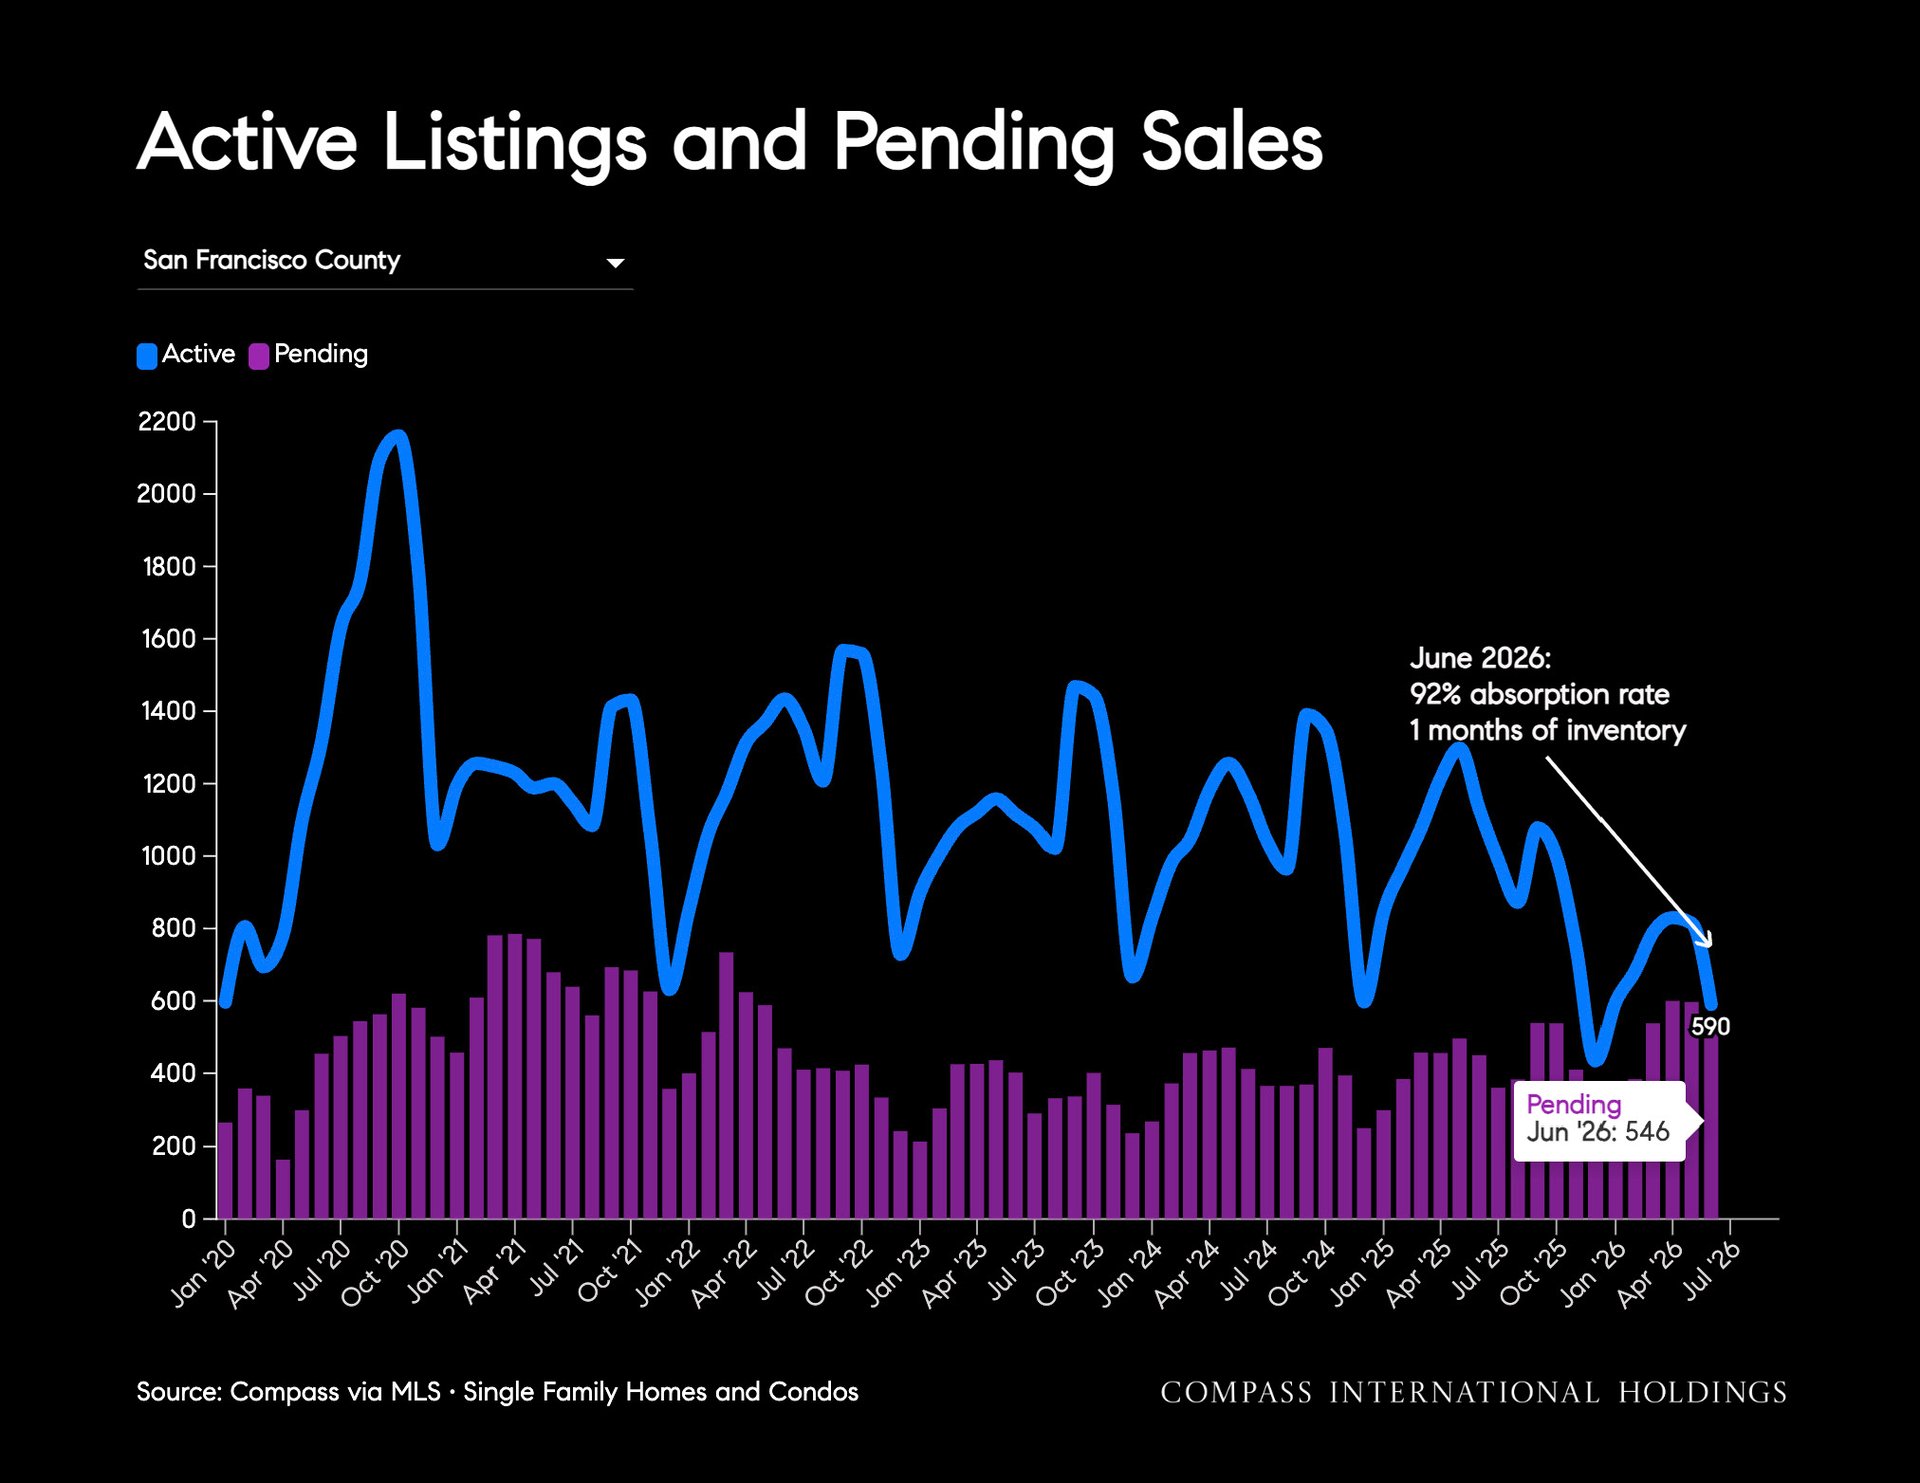
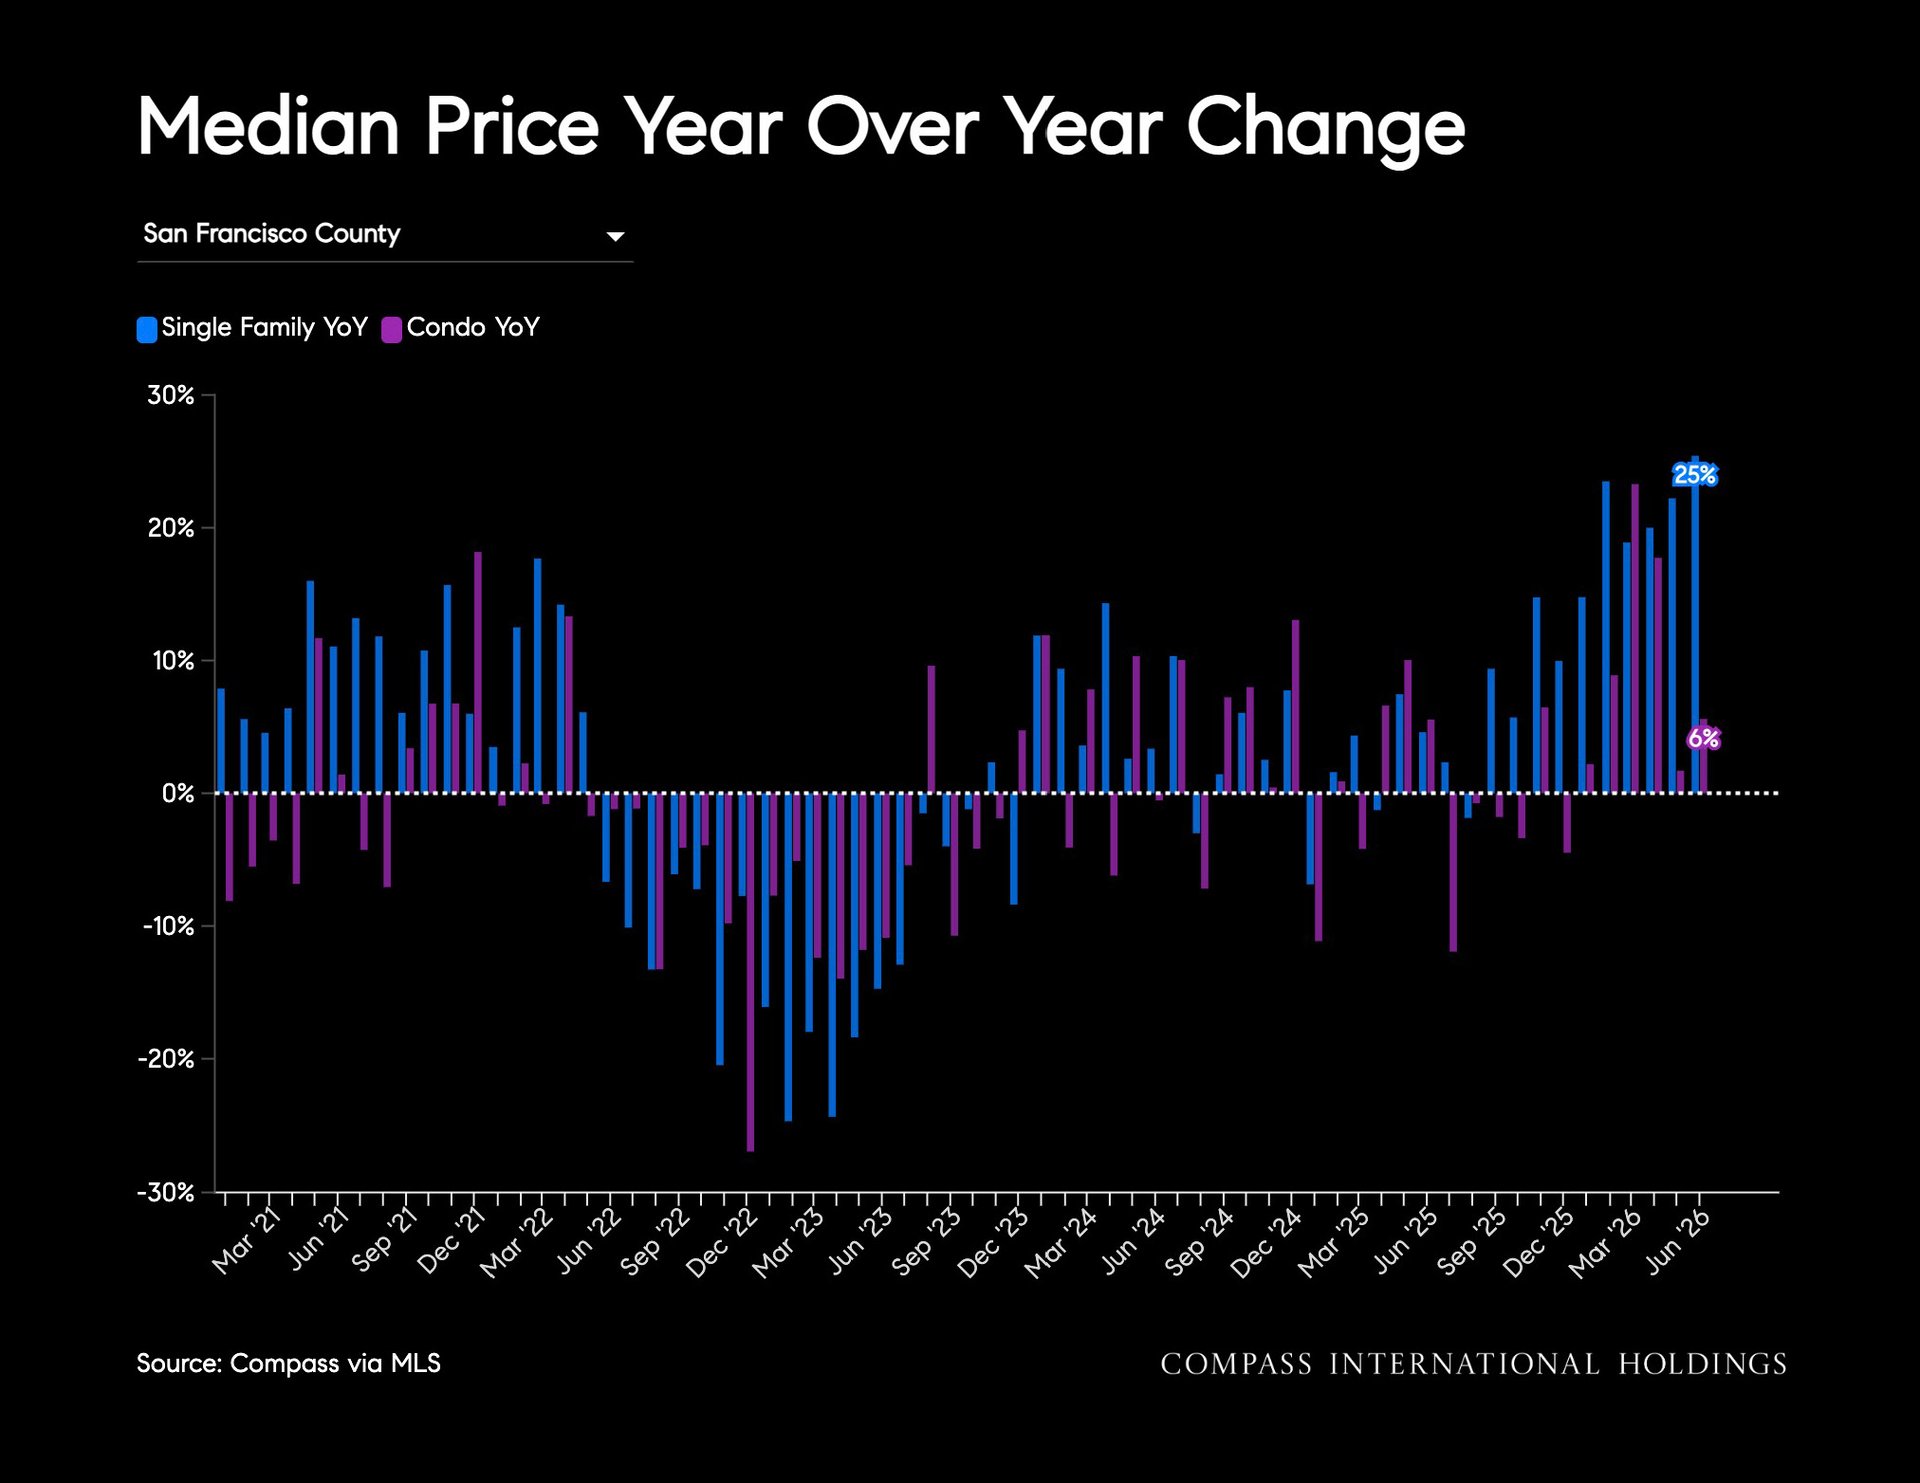
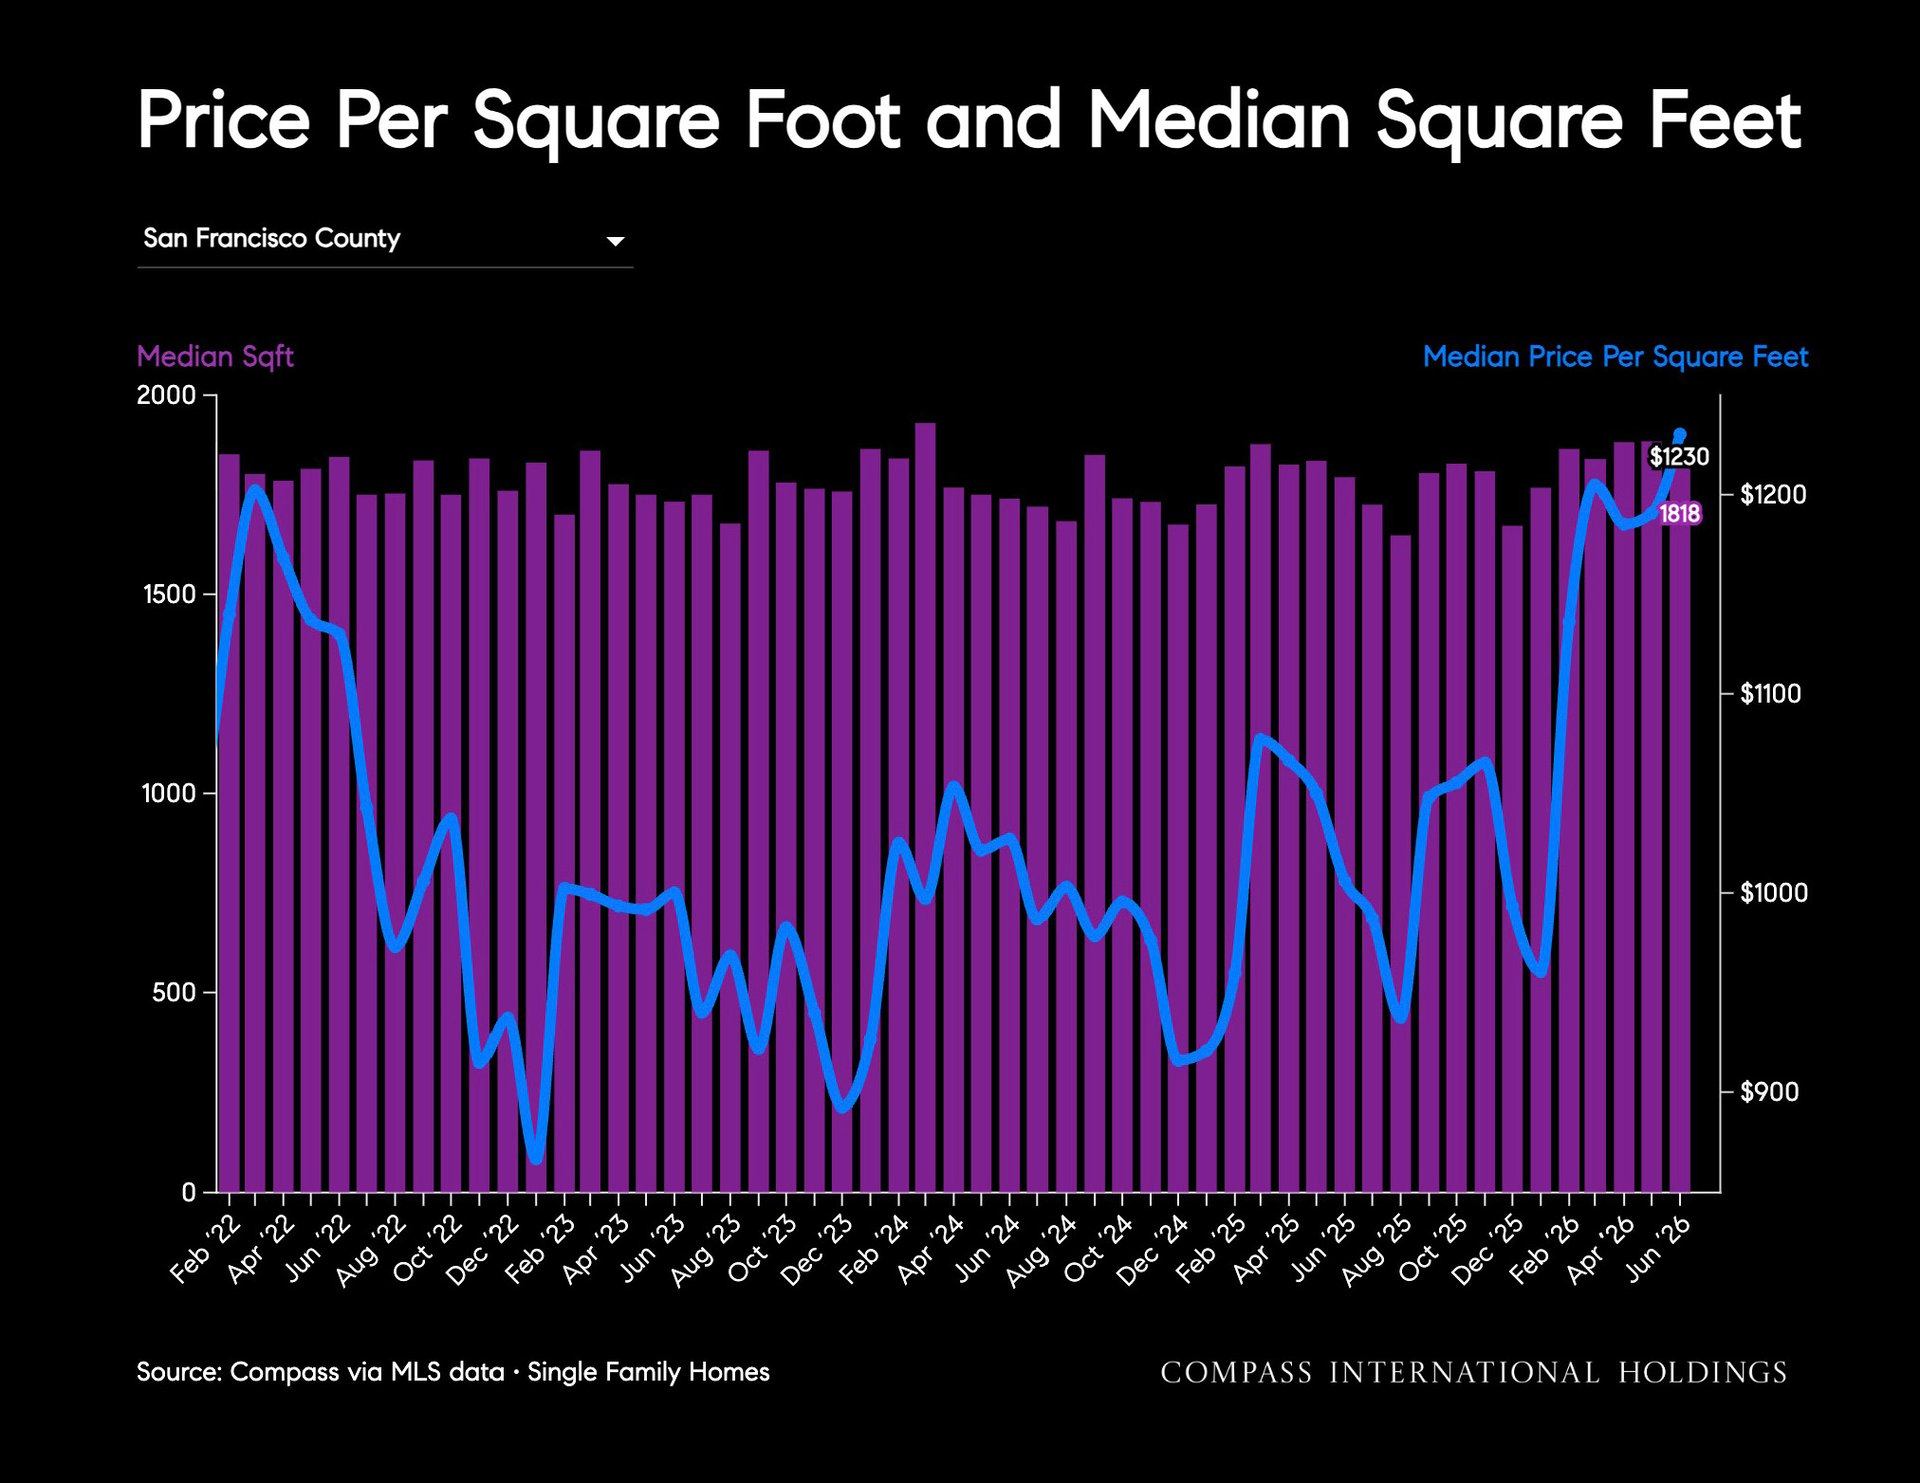
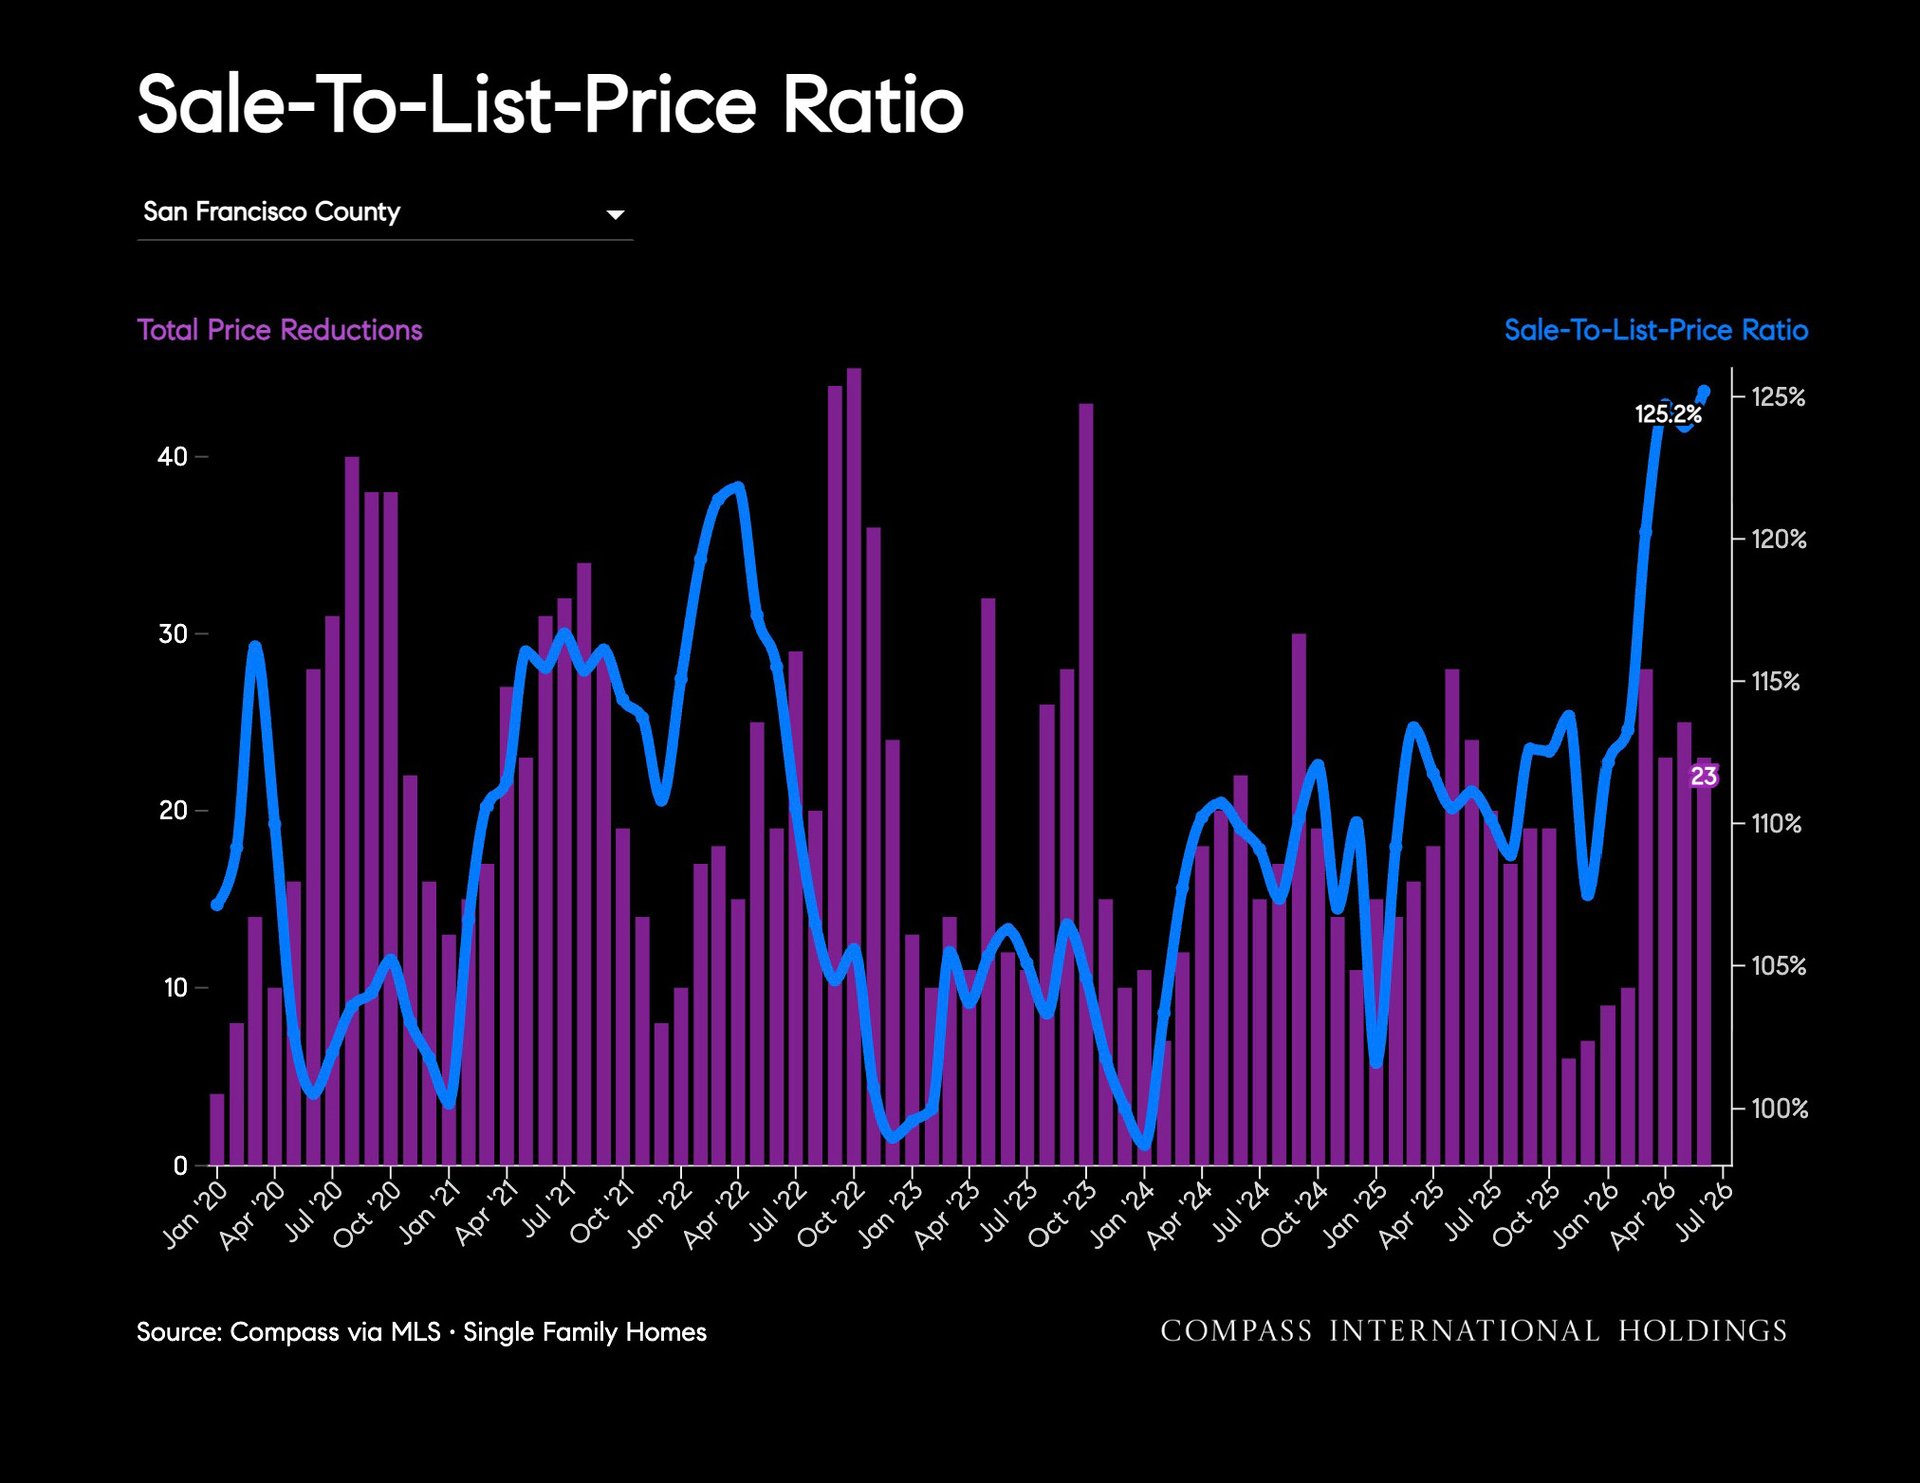
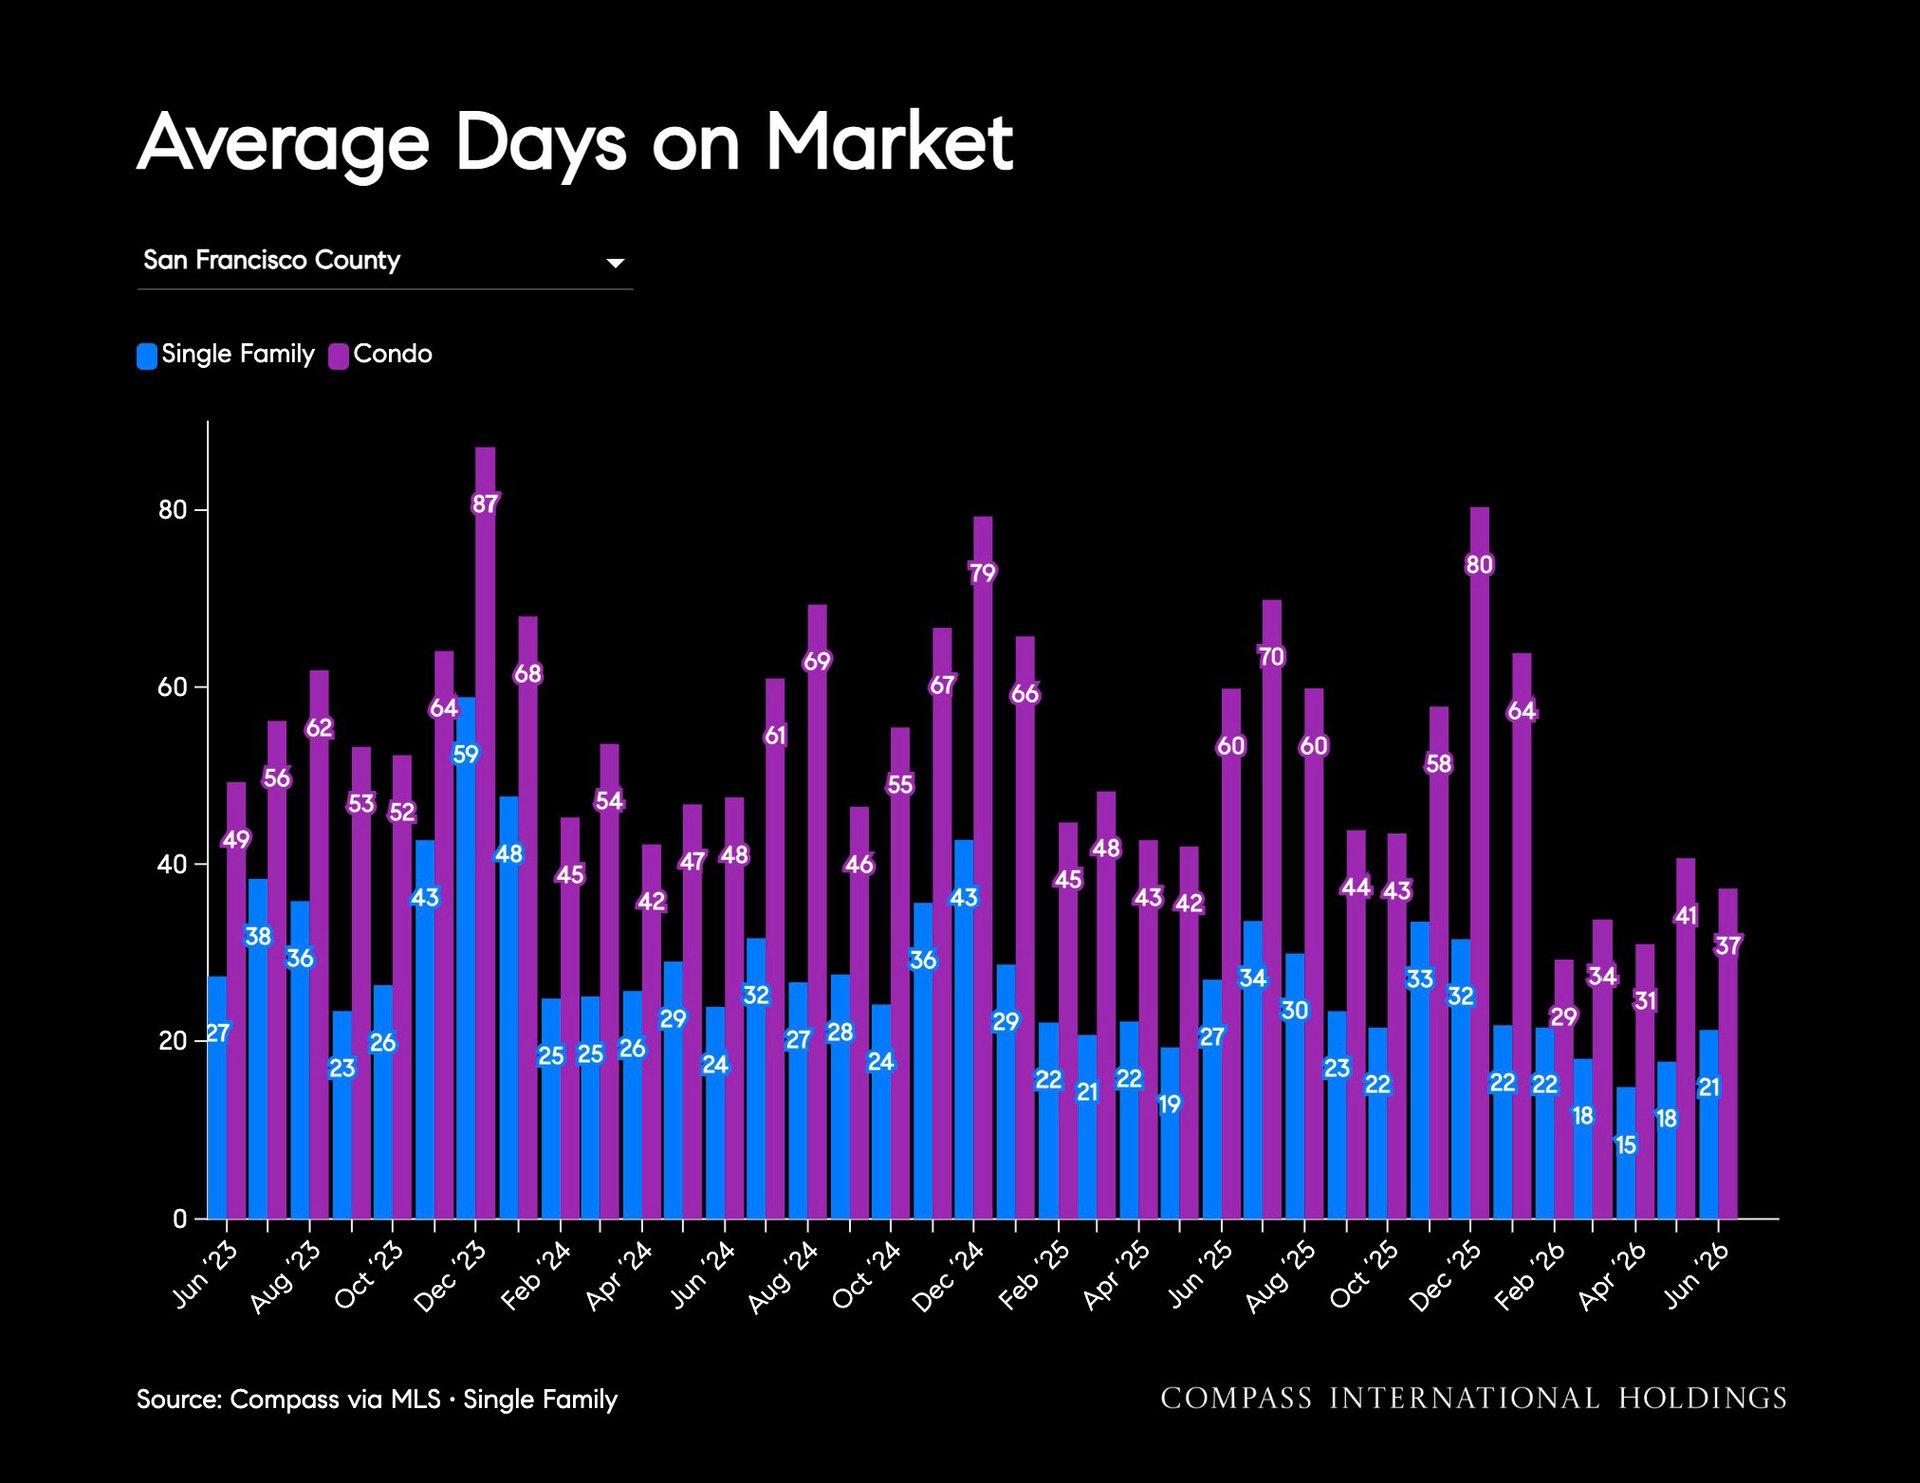
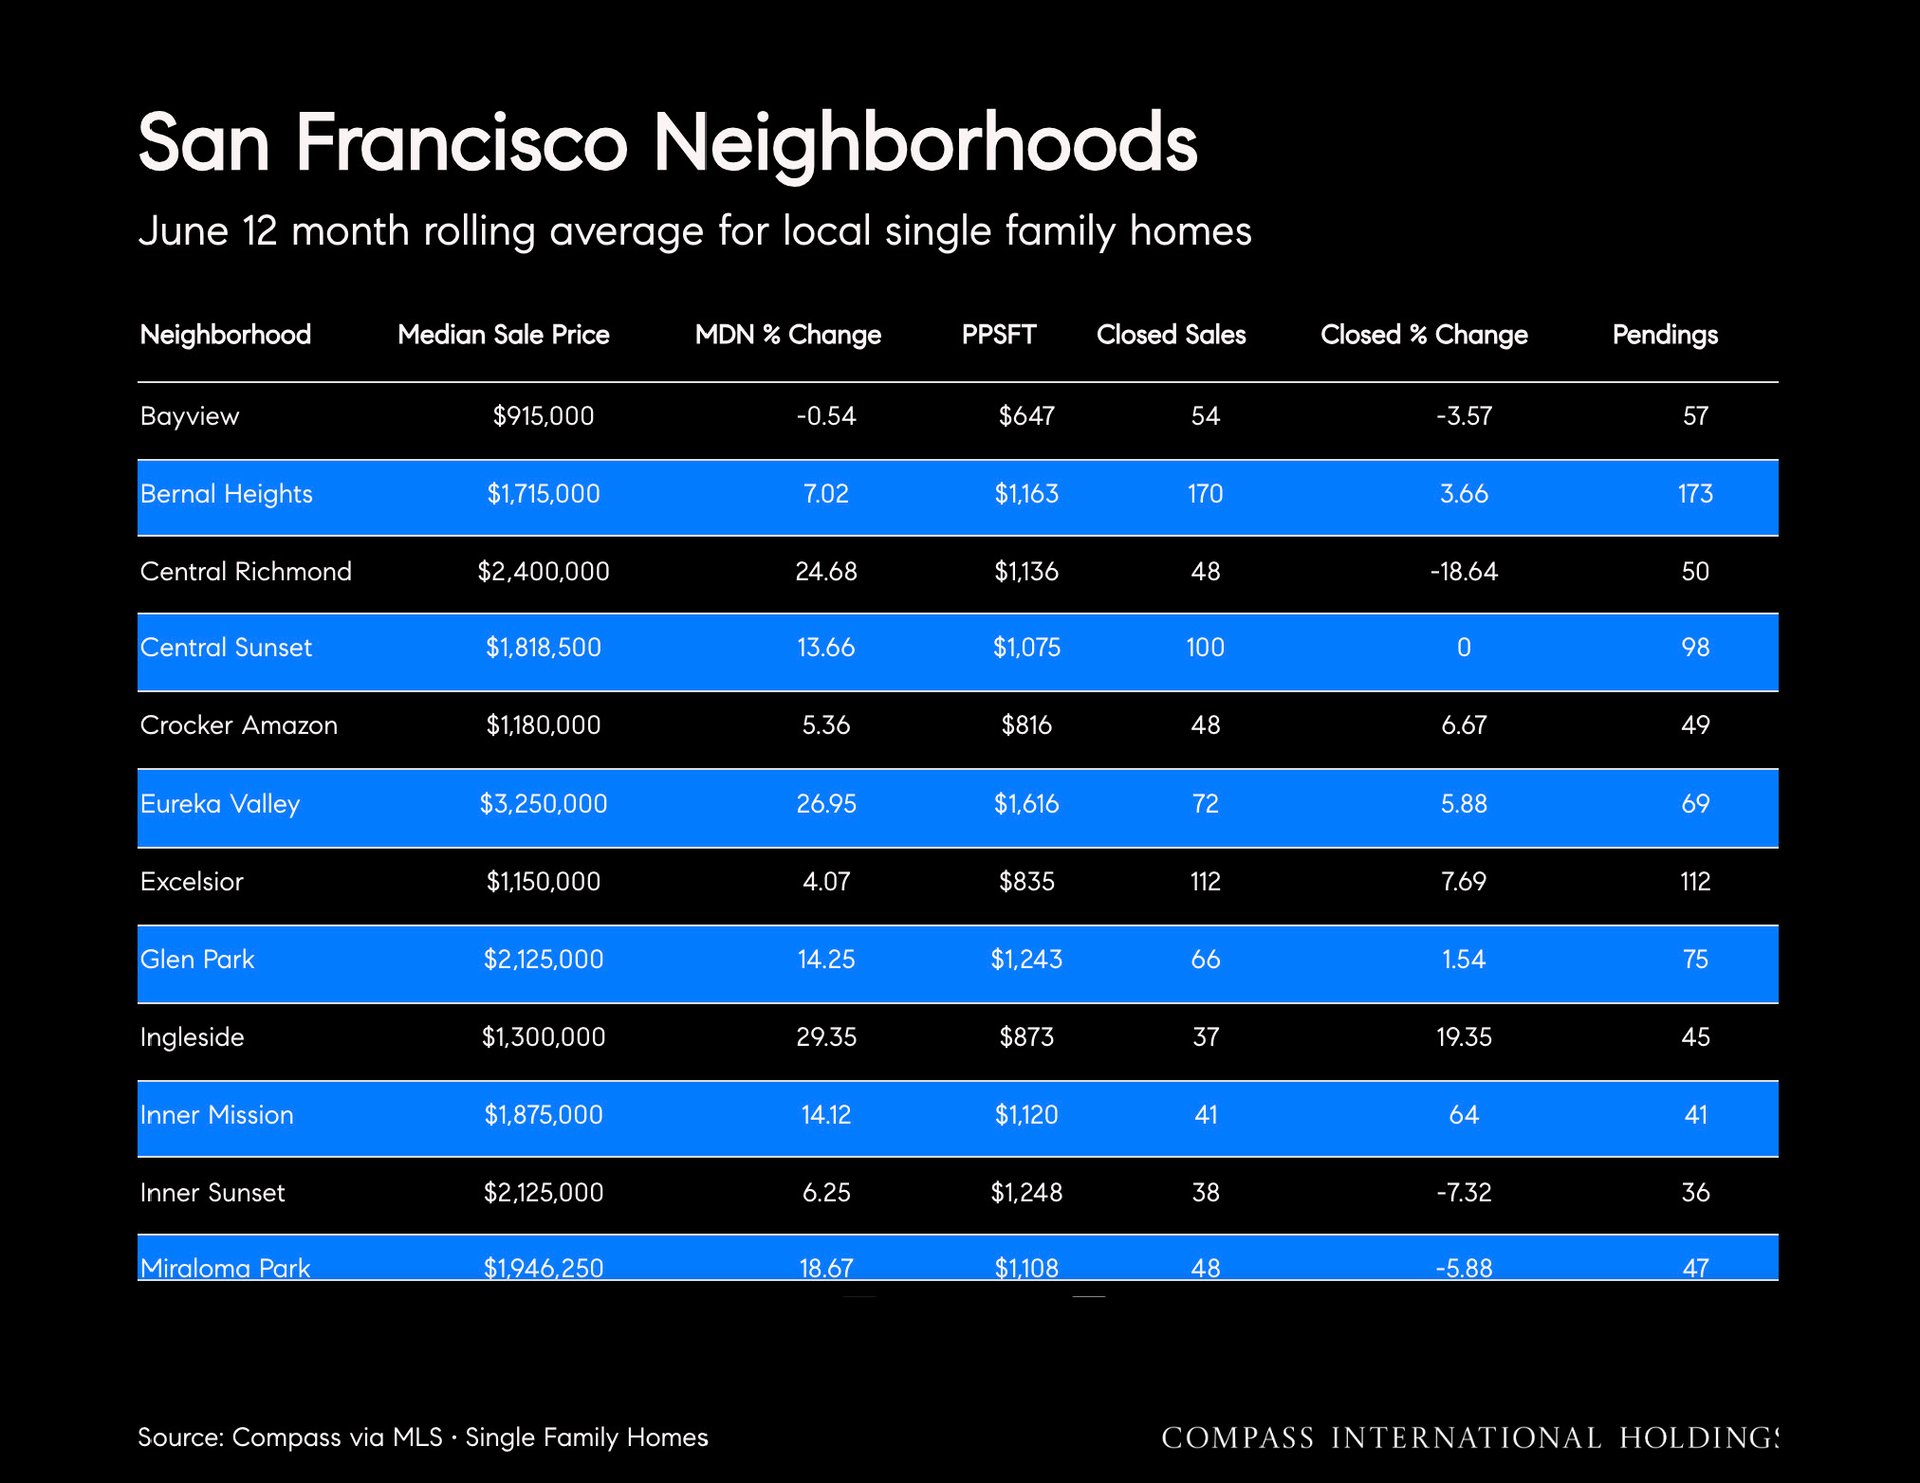
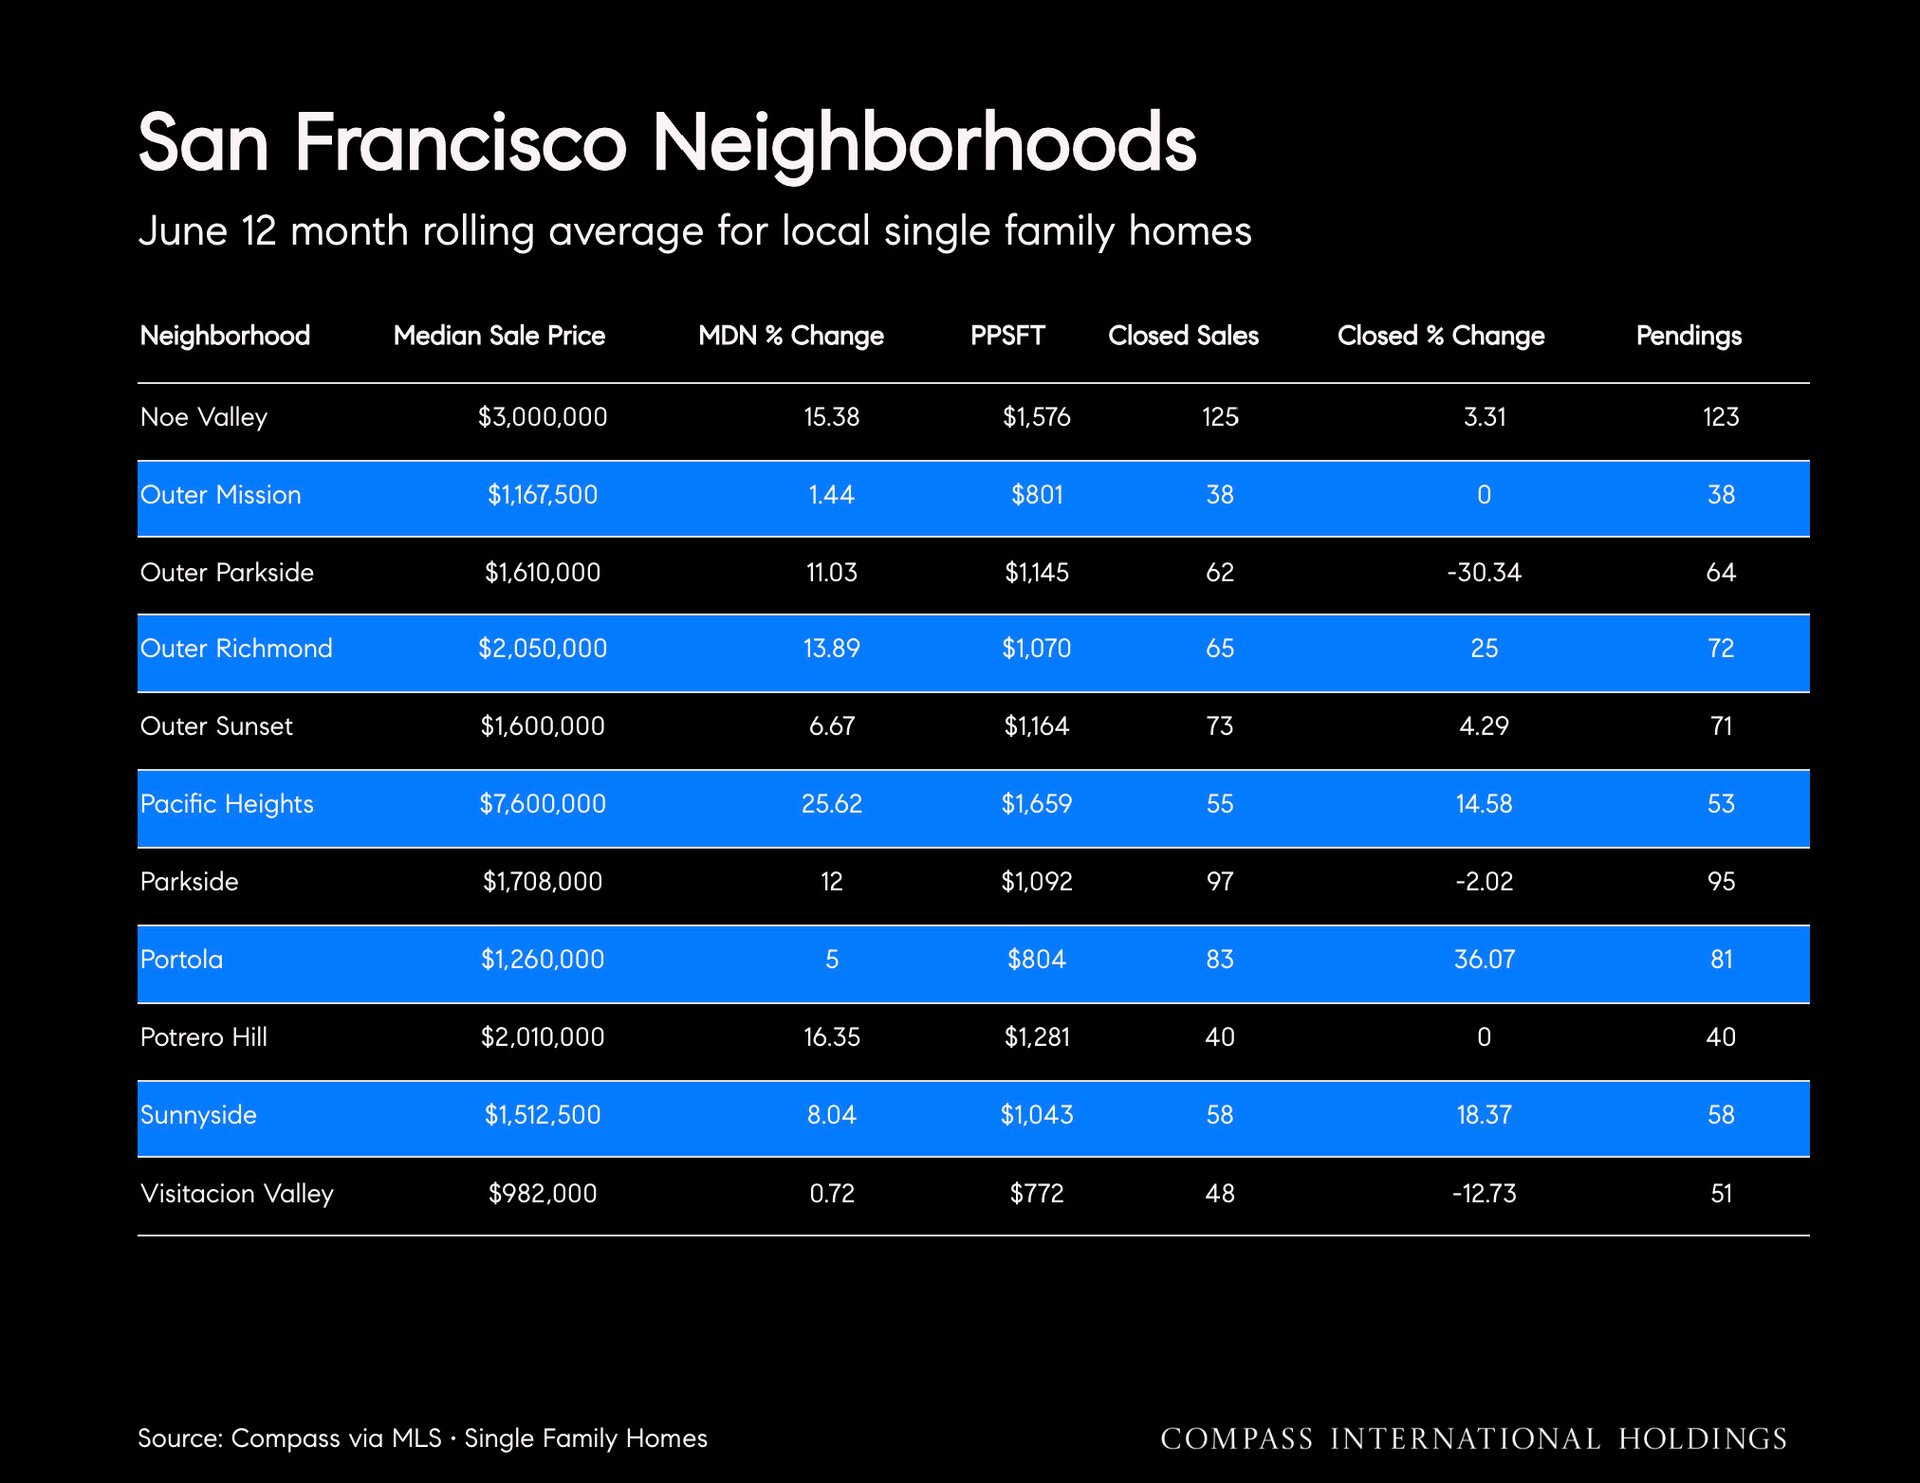
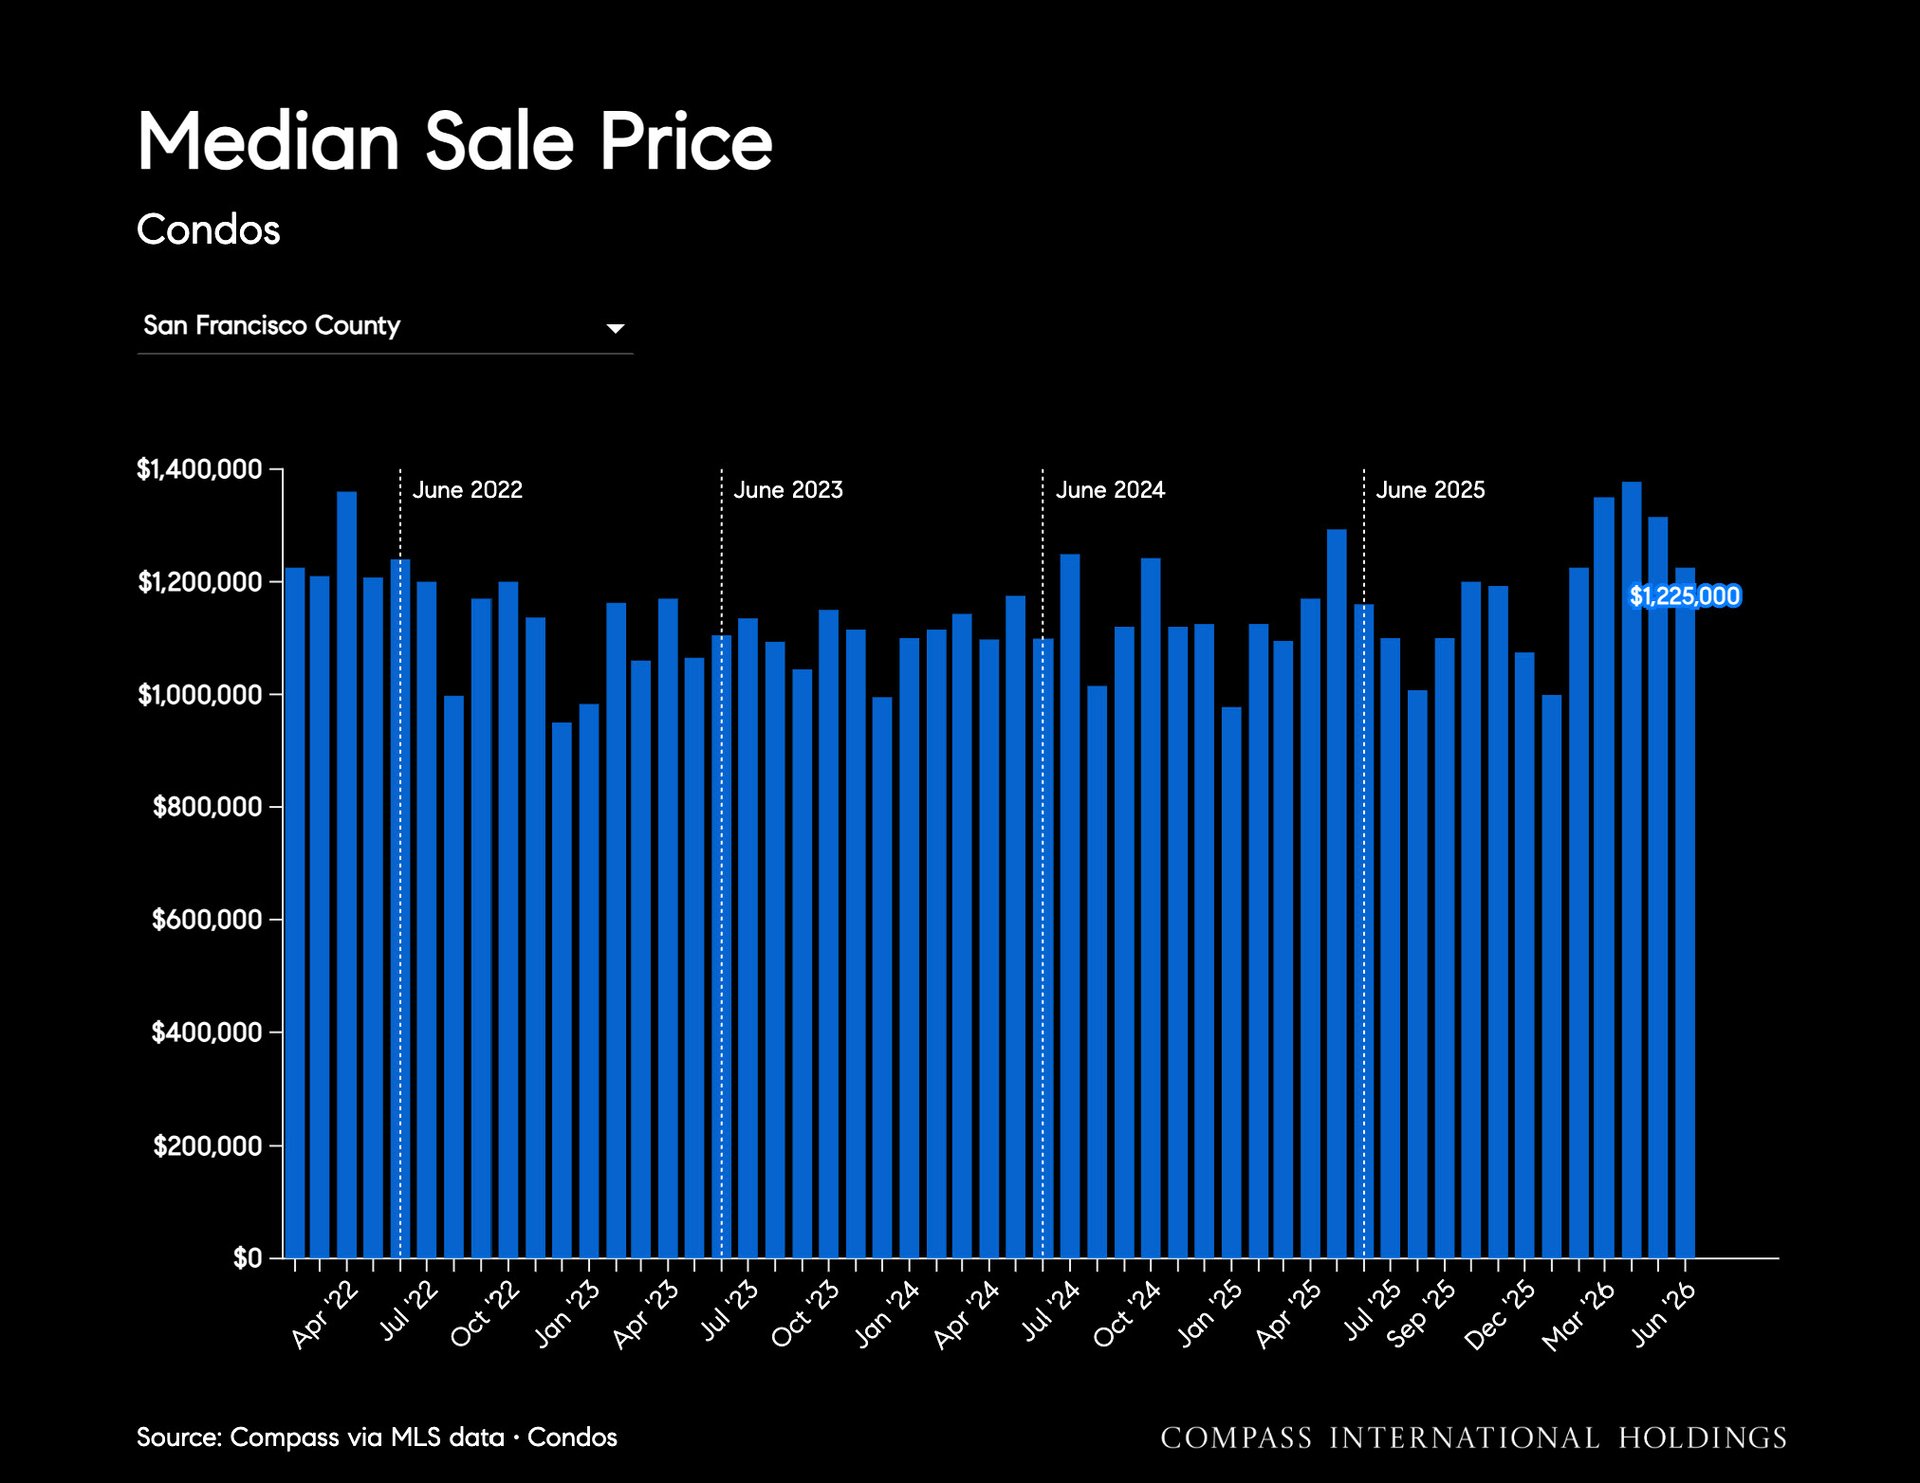
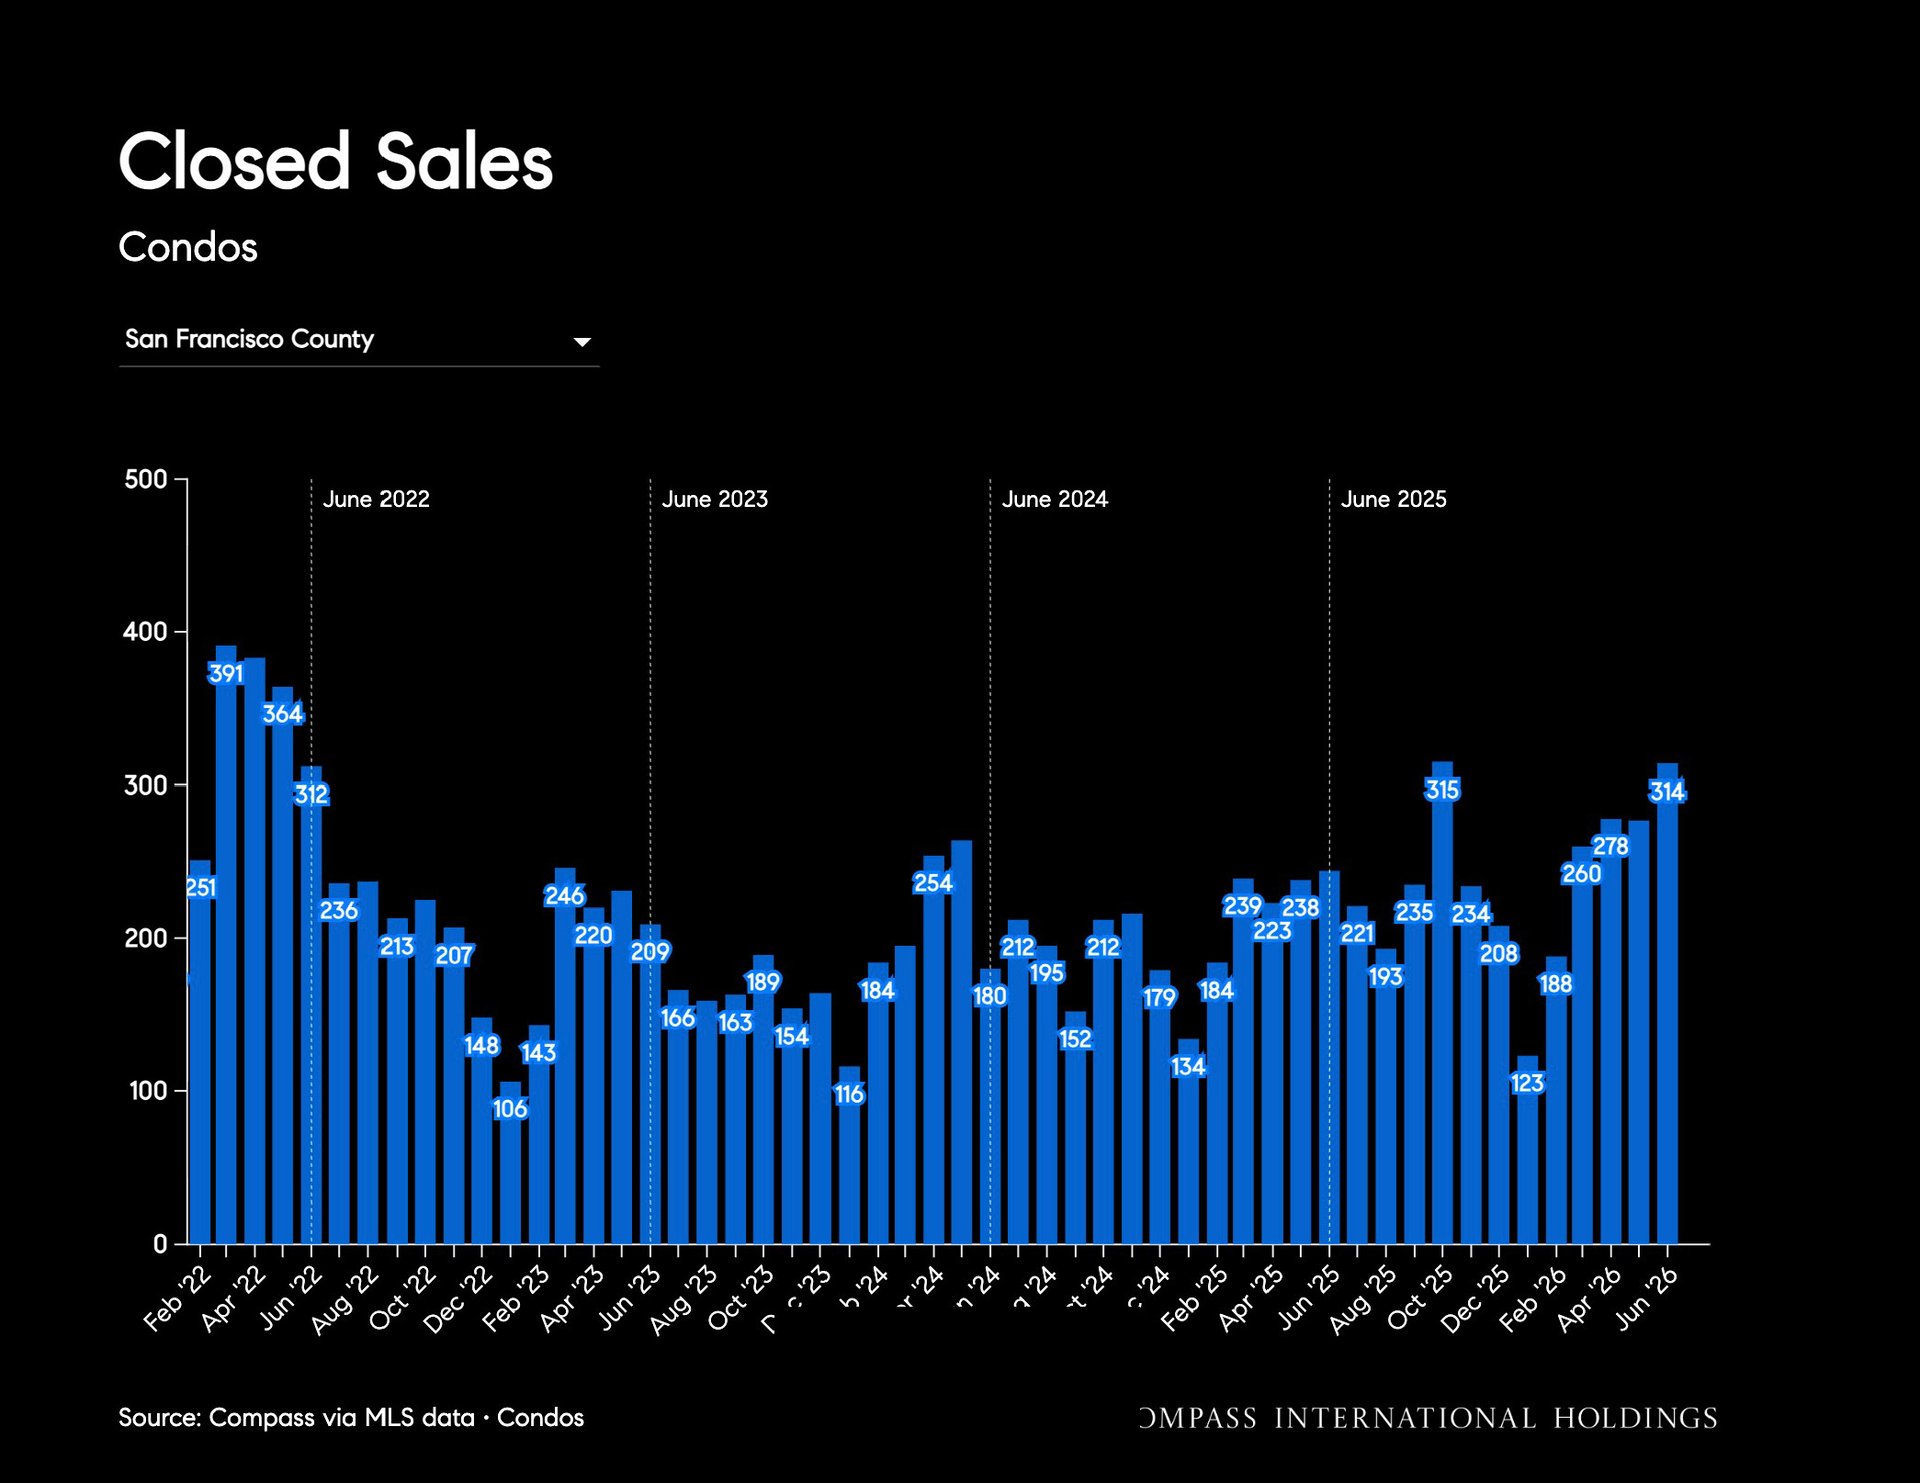
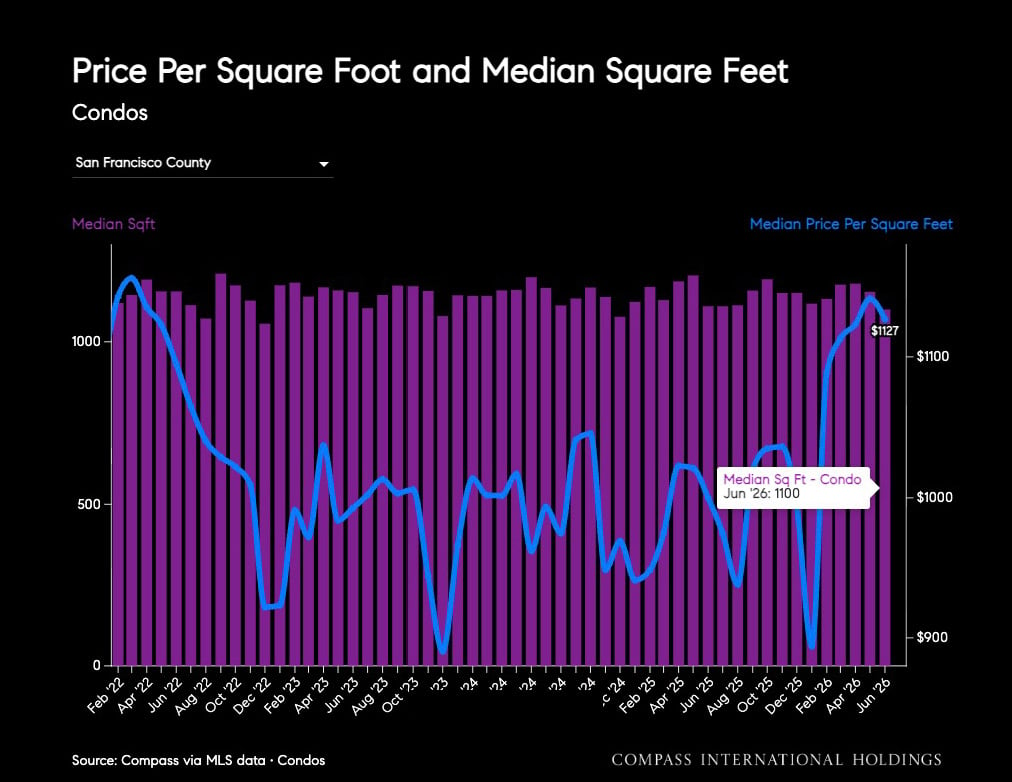
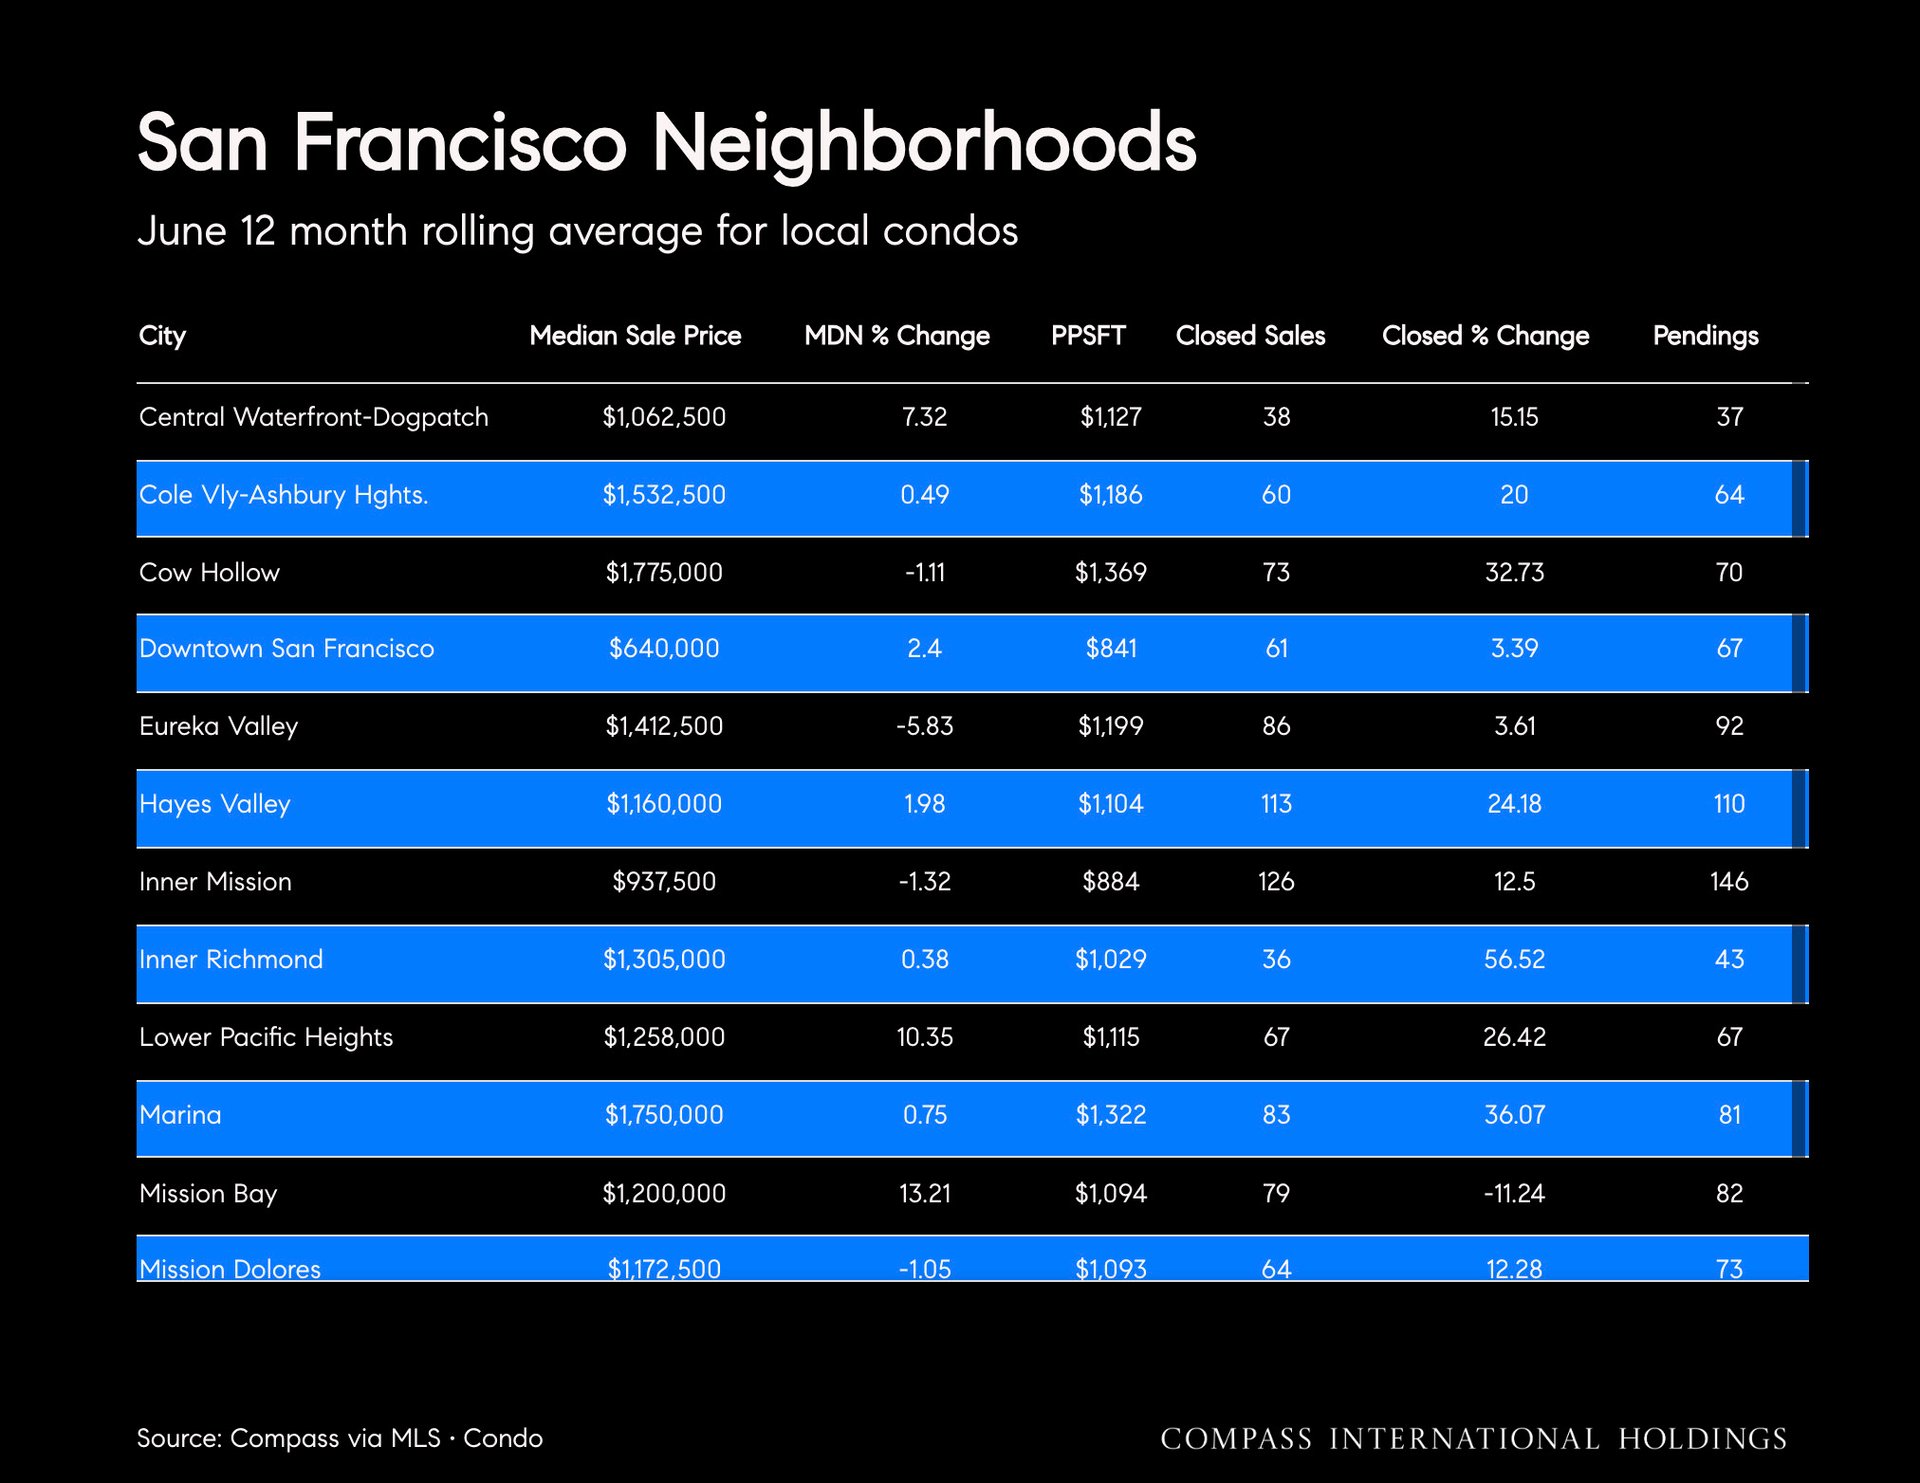
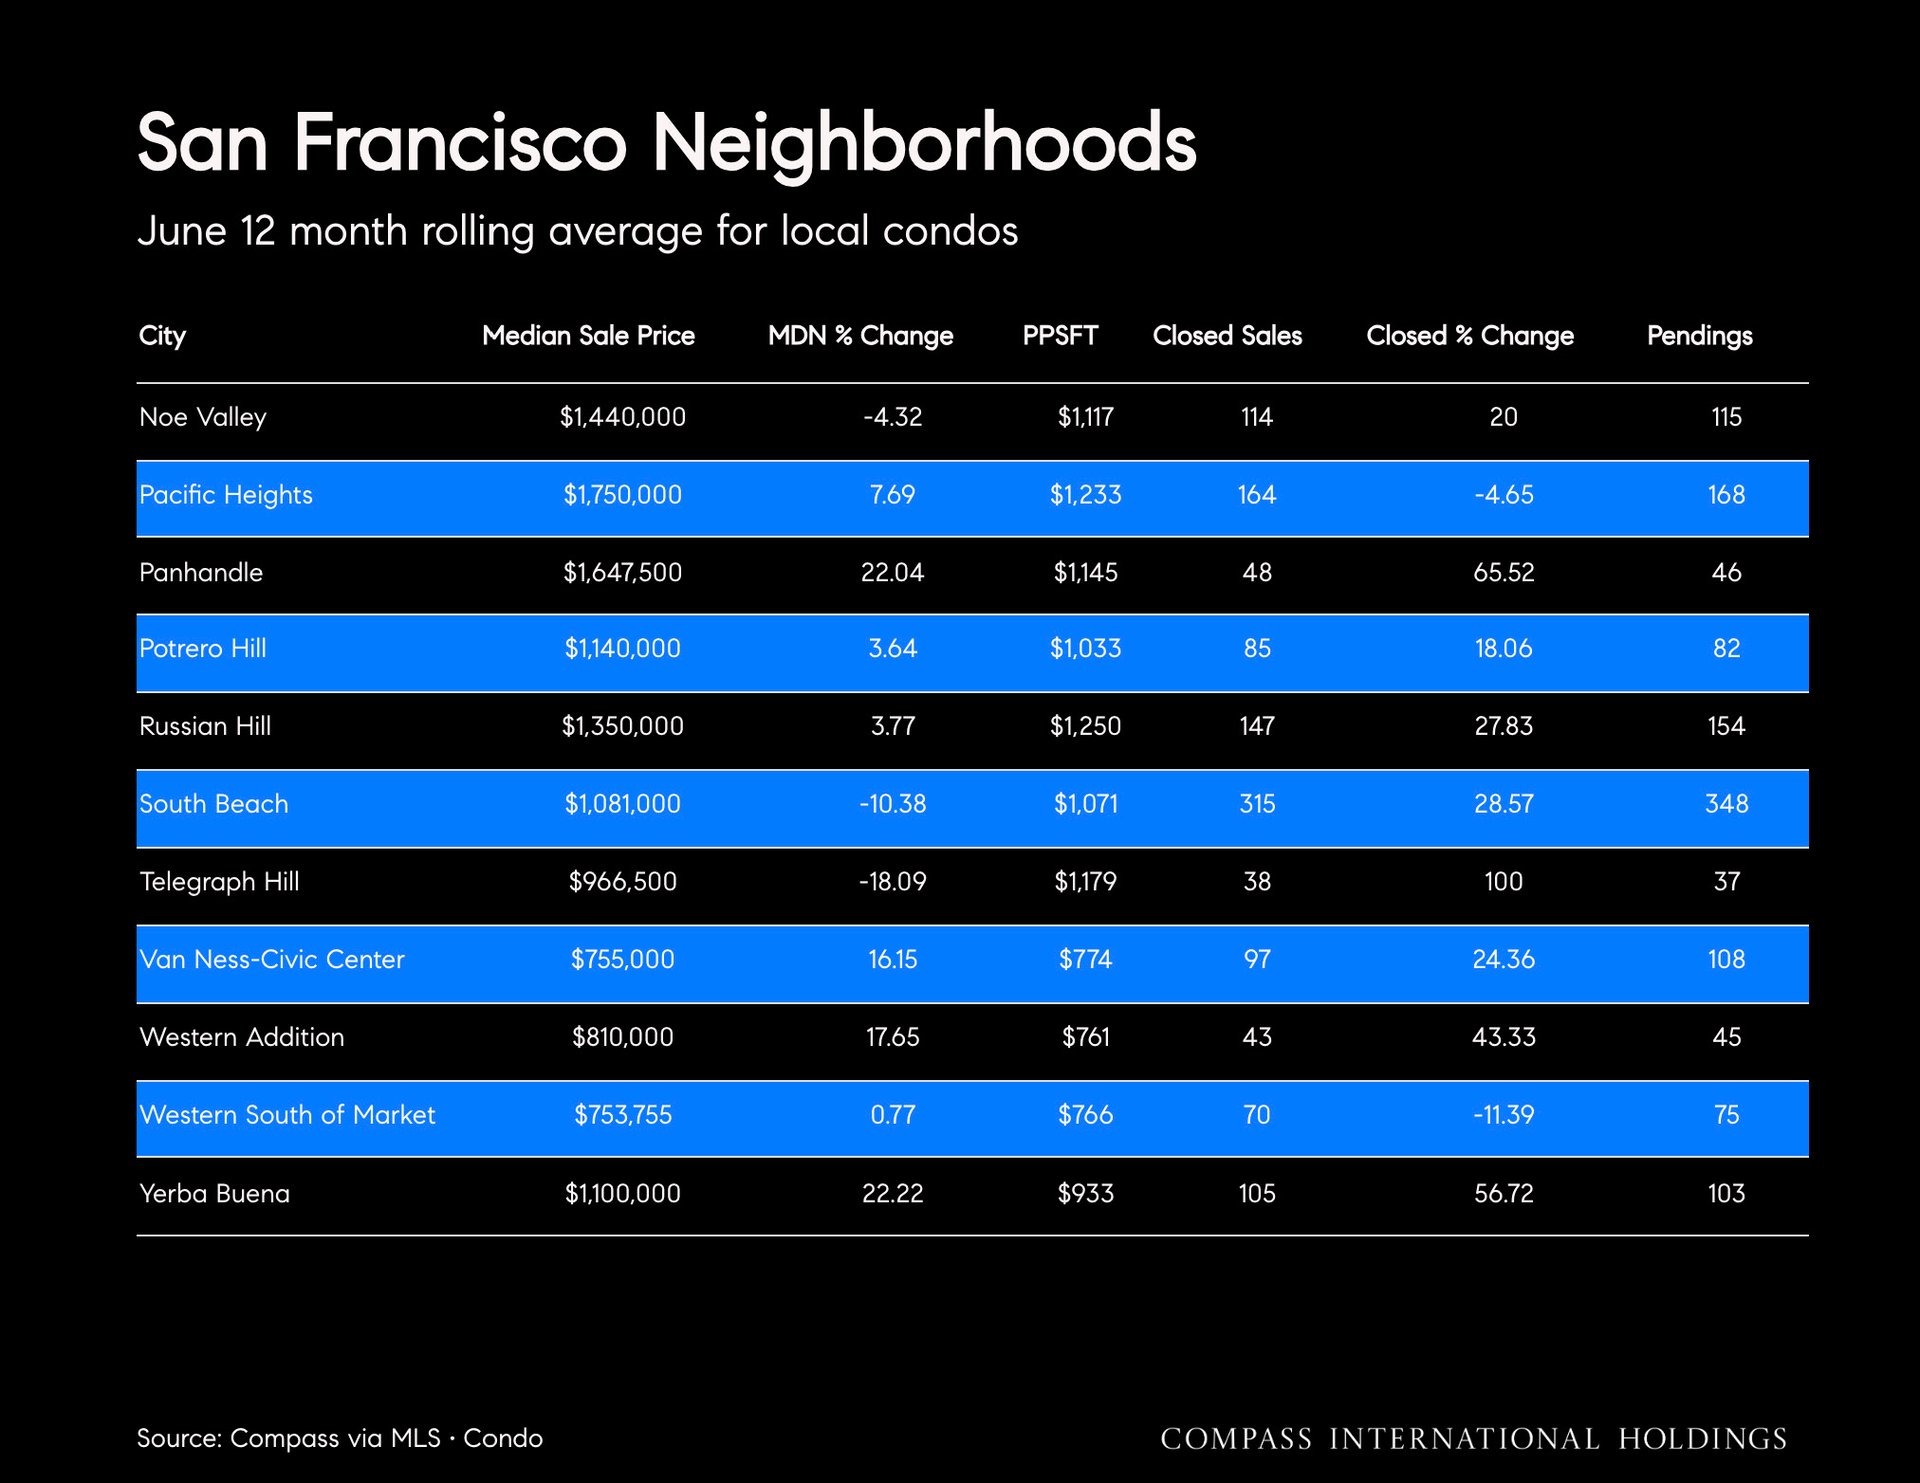
July 2026 Housing Market ReportChart of San Francisco home sales closing at least $1 million over asking, with 44 transactions in June 2026.Map of San Francisco showing neighborhoods with home sales at least $1 million over asking.Chart showing mortgage rates fluctuating from 2023 to July 2026, ending at 6.58%.Chart comparing U.S. CPI and PCE inflation rates from 2016 to 2026, with both rising sharply in June.Bar chart showing monthly U.S. job growth from February 2023 through June 2026.Bay Area job growth chart showing monthly job gains and losses from January 2023 to May 2026.Chart showing U.S. unemployment declining to 4.2% in June.Chart showing the S&P’s rise through July 2026 and its market-driven wealth effect for homebuyers.Chart comparing home price appreciation across U.S. cities, with San Francisco prices recently turning upward.Bay Area migration chart comparing inbound and outbound household moves in 2025Stacked chart showing mortgage interest-rate shares from 2013 through 2026, with the largest share above 6%.San Francisco Market report cover featuring the Golden Gate Bridge.San Francisco housing market recap with June 2026 prices, sales, inventory, and market trends.Map infographic showing home price changes by San Francisco neighborhood compared with 2025.Chart compares year-over-year median single-family home price changes across ten Bay Area counties; Santa Clara is down 9.3%.Chart comparing monthly median San Francisco County single-family home sale prices from 2022 to 2026.Closed sales of San Francisco County single-family homes by month, with June 2026 at 265 sales.Chart comparing San Francisco active listings and pending sales from January 2020 through June 2026.Chart of San Francisco County year-over-year median price changes for single-family homes and condos, through June 2026.Chart of San Francisco County single-family home median square footage and price per square foot from February 2022 to June 2026.San Francisco County sale-to-list-price ratio and price reductions from January 2020 to July 2026.Average days on market in San Francisco County for single-family homes and condosSan Francisco neighborhood single-family home sales statistics, including median prices, price changes, closed sales, and pending sales.San Francisco neighborhood single-family home market statistics, including median prices and sales.Bar chart of San Francisco County condo median sale prices, April 2022–June 2026; June 2026 is $1,225,000.Bar chart of monthly closed condo sales in San Francisco County from February 2022 through June 2026.San Francisco County condo median price per square foot and median size, February 2022–June 2026.San Francisco neighborhood condo sales statistics for June, presented in a table.San Francisco neighborhood condo market statistics table for June, with prices, sales, changes, and pending listings.Compass

Work With Us

We will help you understand the complex aspects of the transaction and share our expertise so that you can make the best decisions possible. We are experienced, market savvy, and energetic. With both of us working for our clients, you get twice the amount of attention and insight.