
The SF Team, Eva + James, Compass

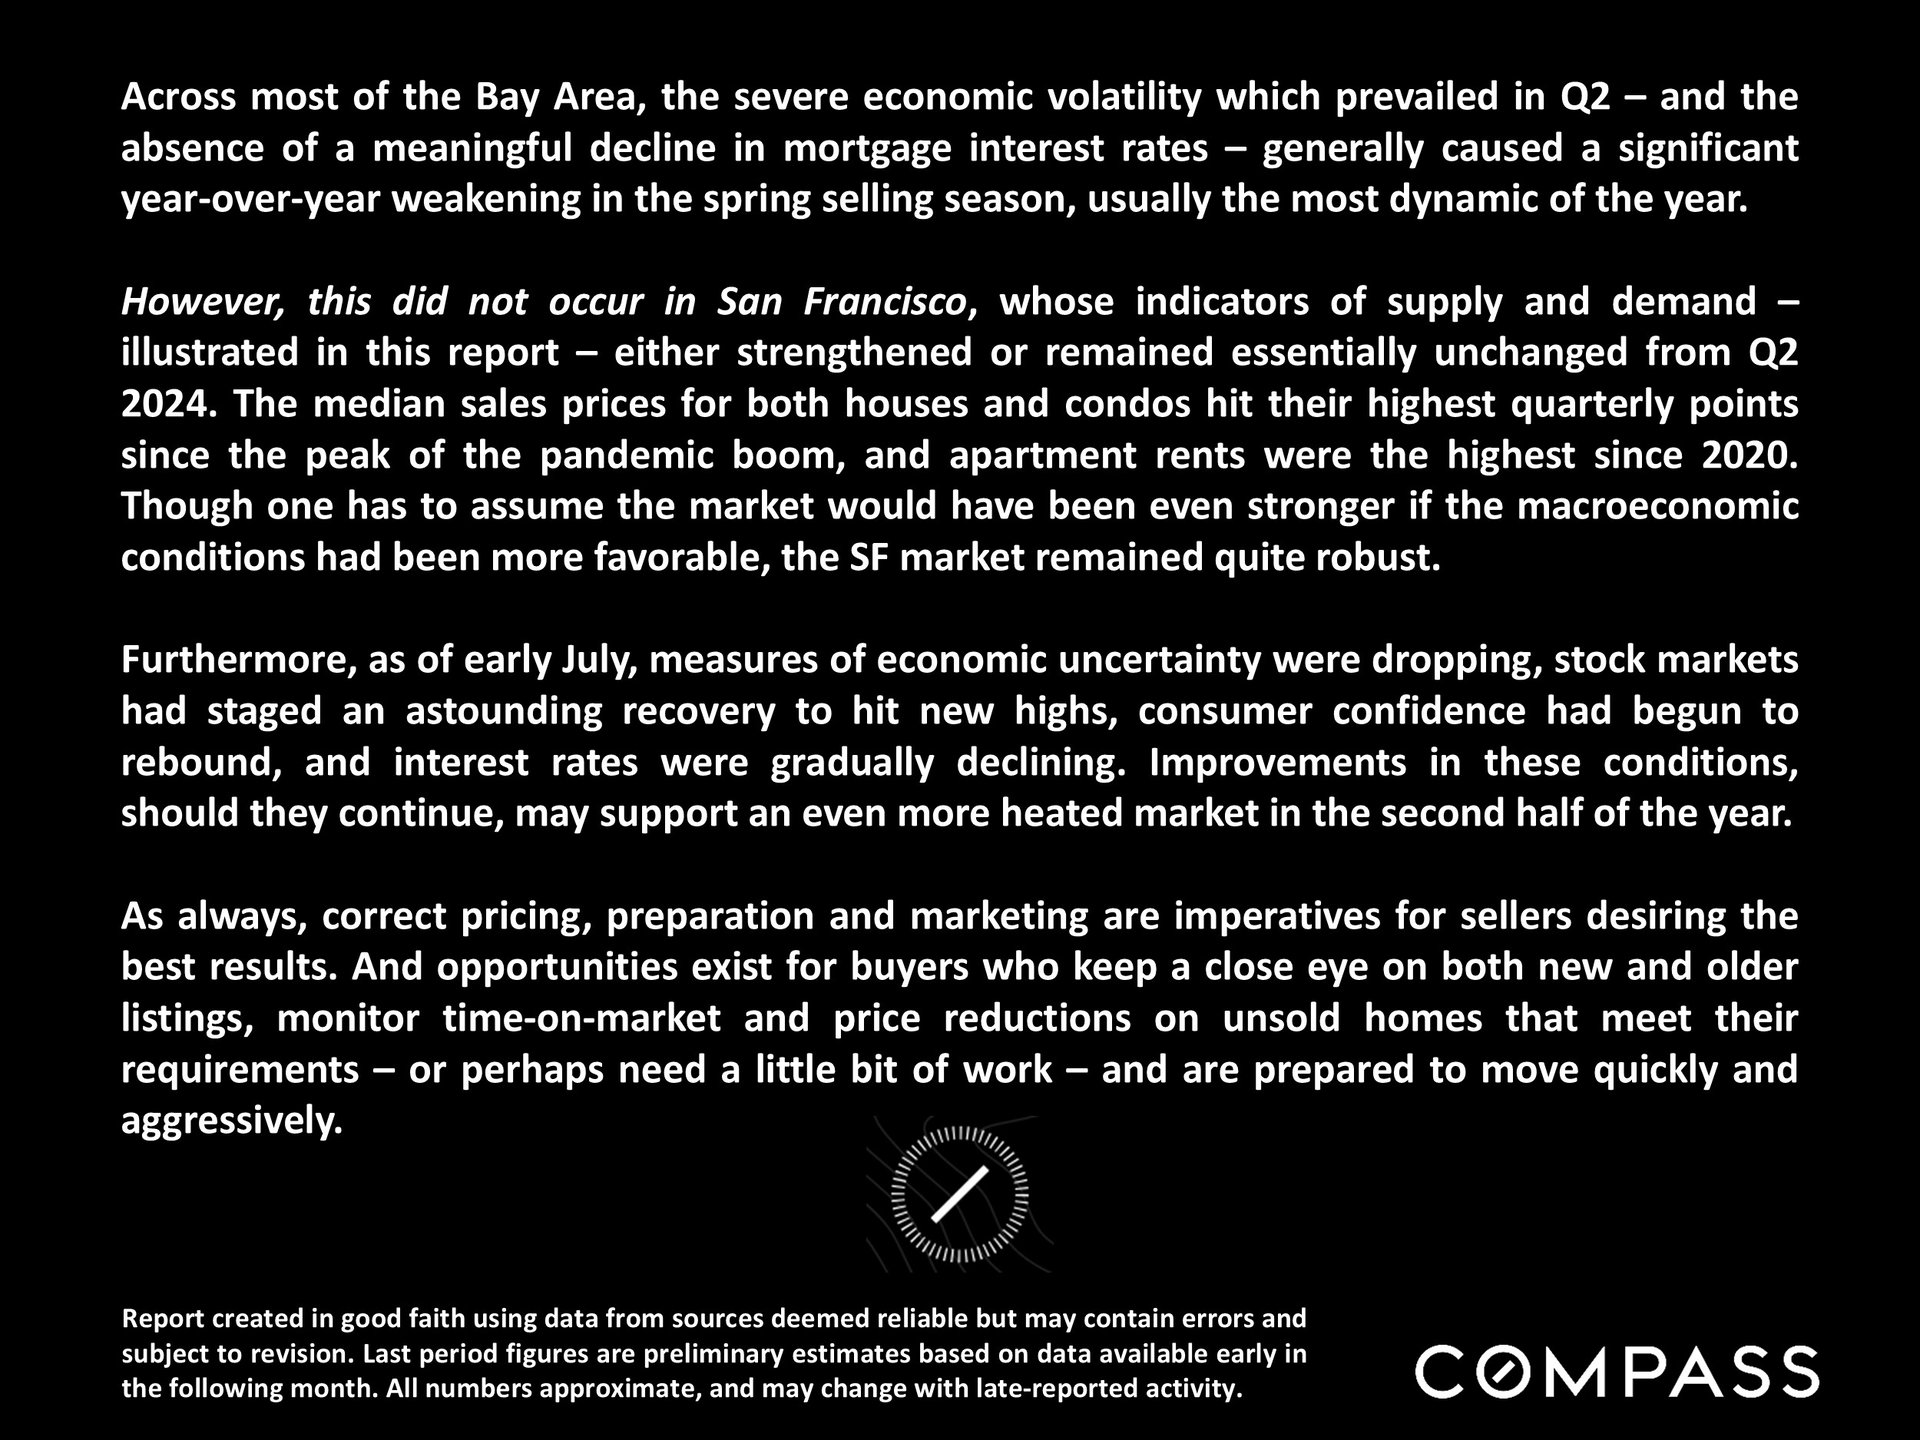
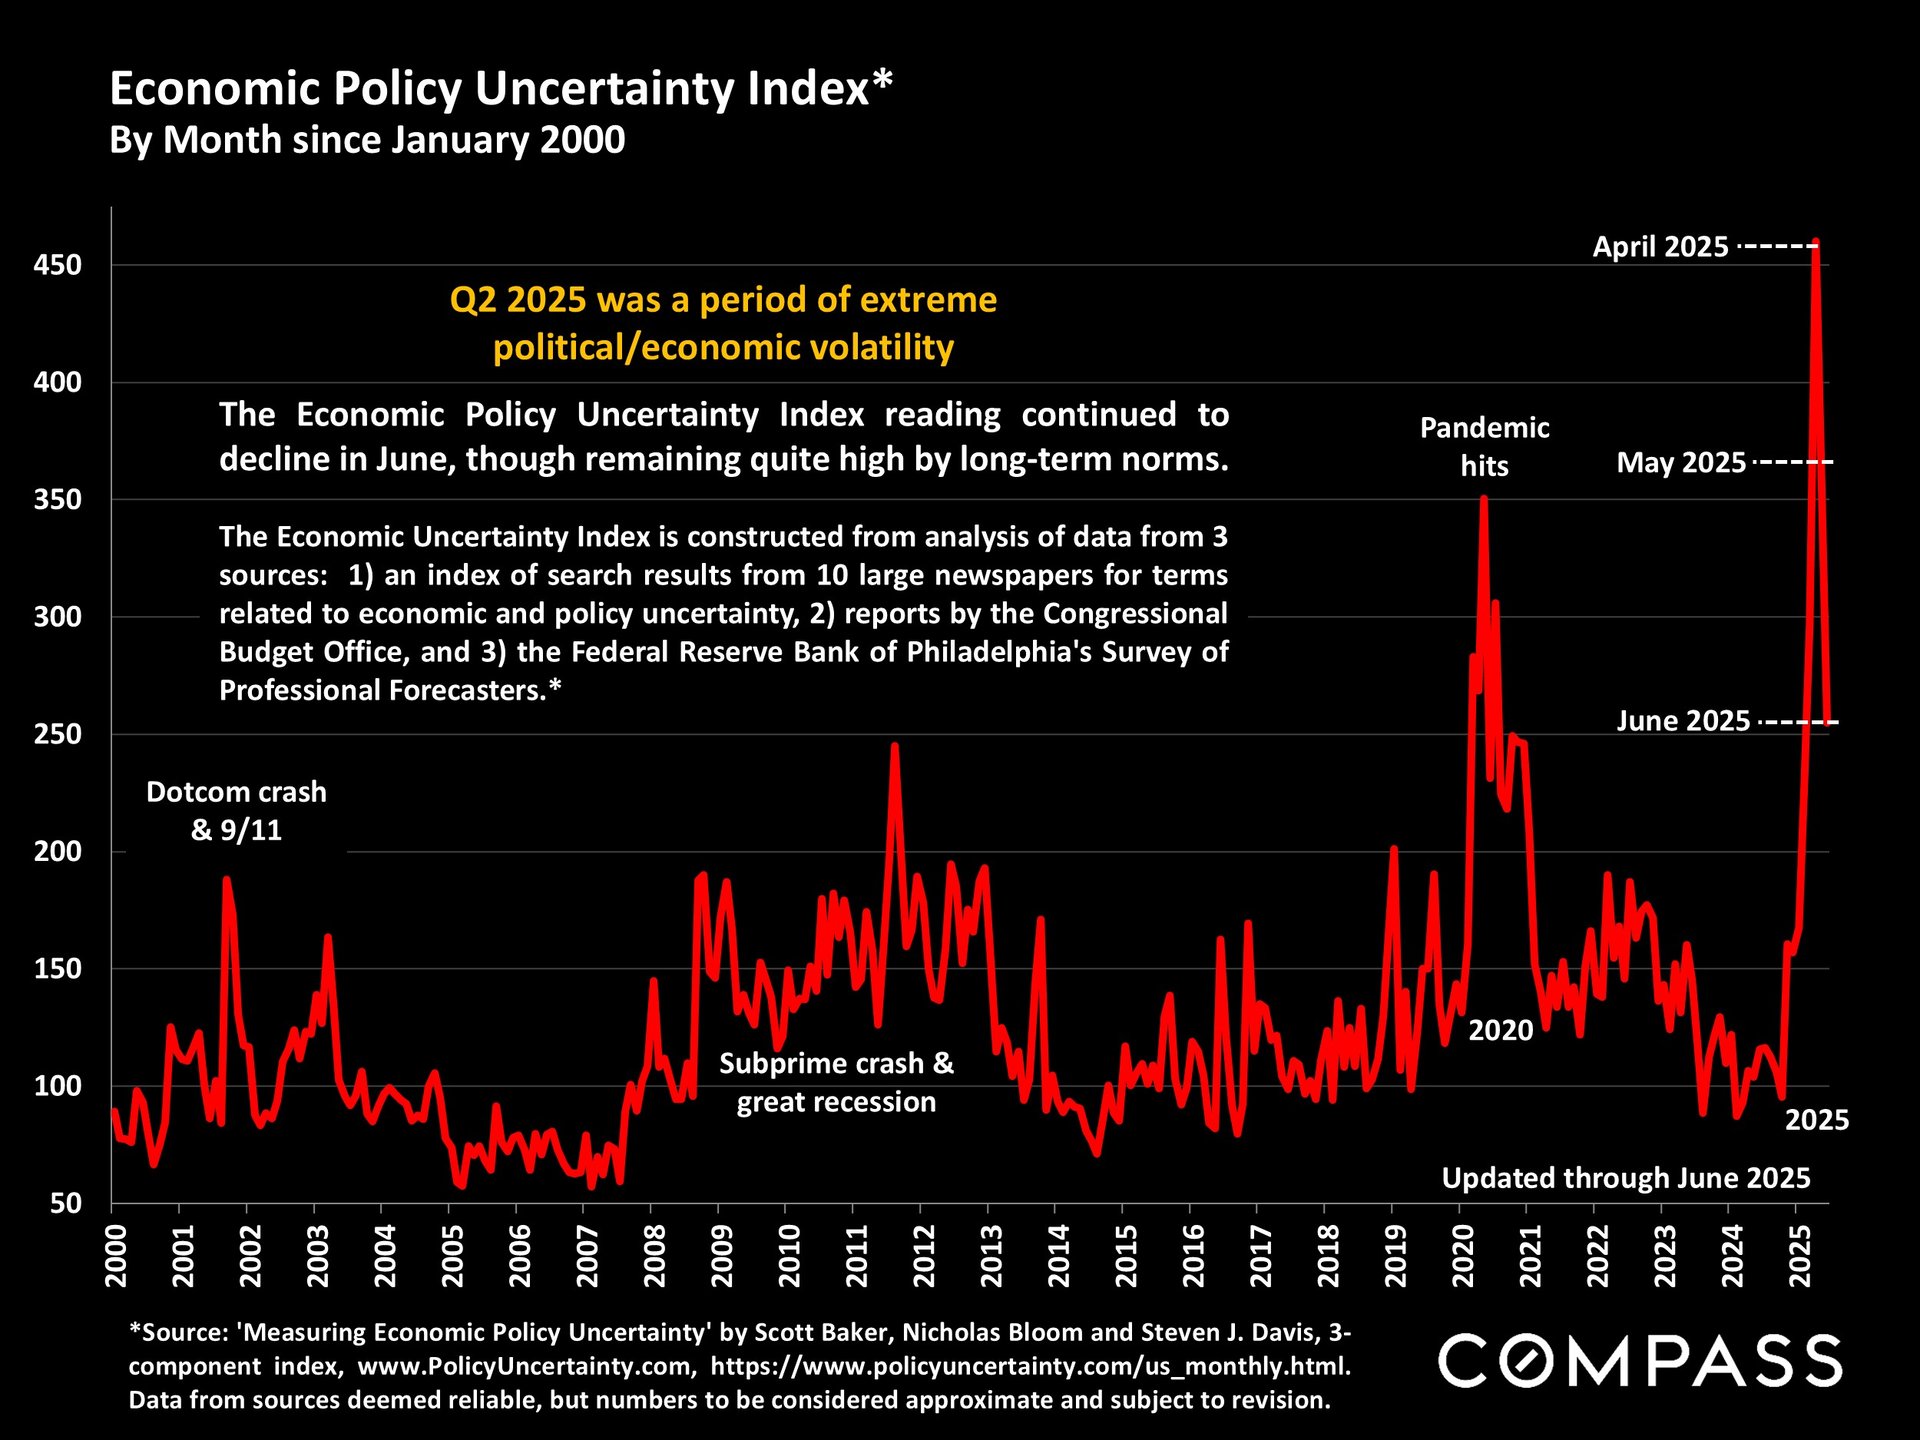
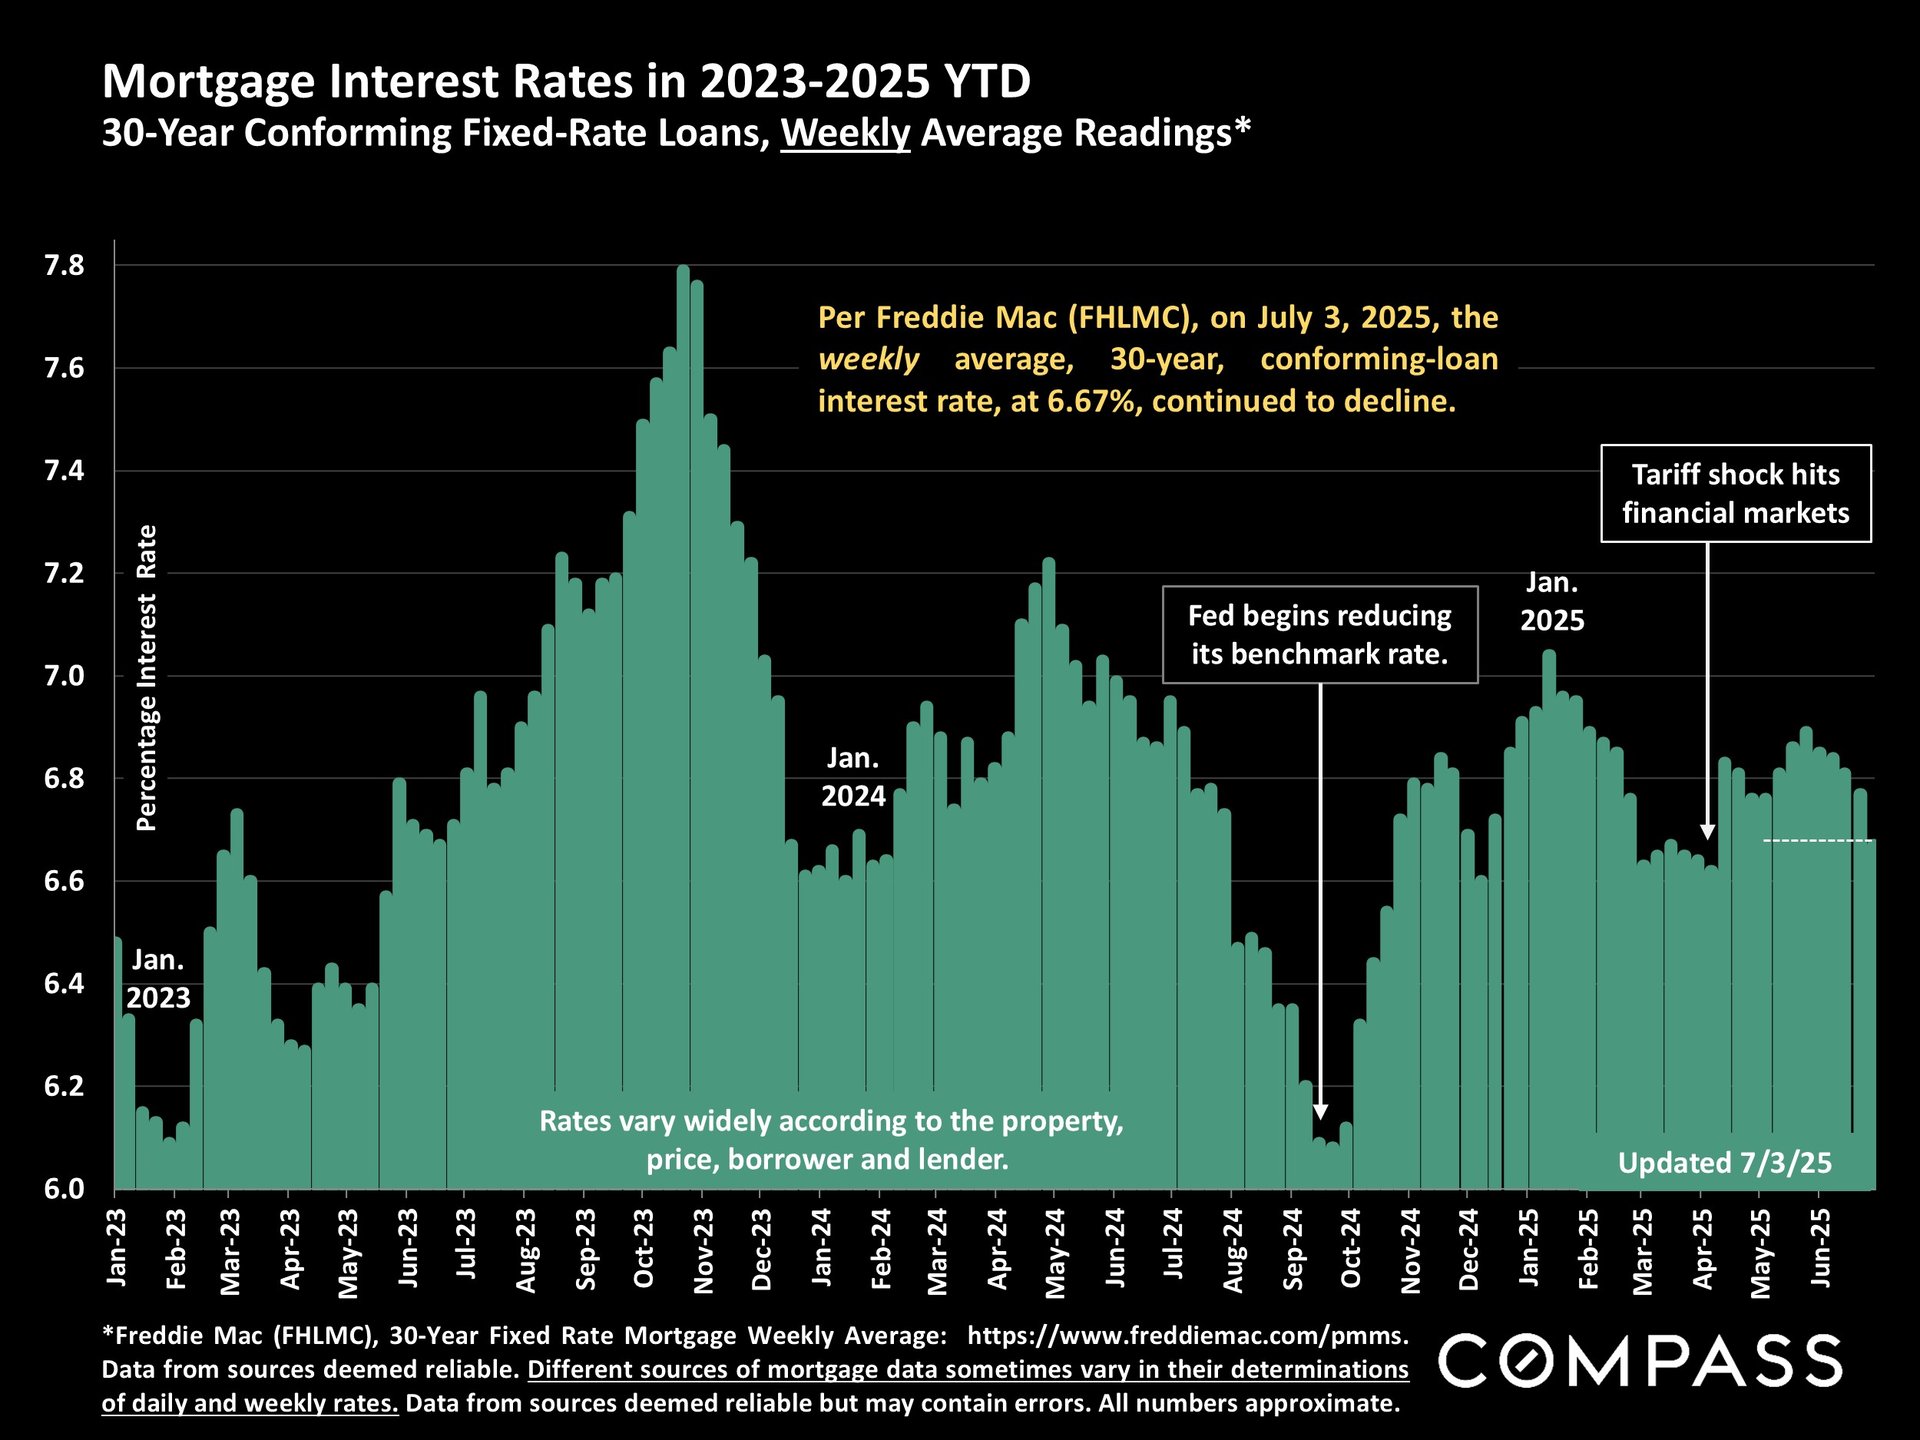
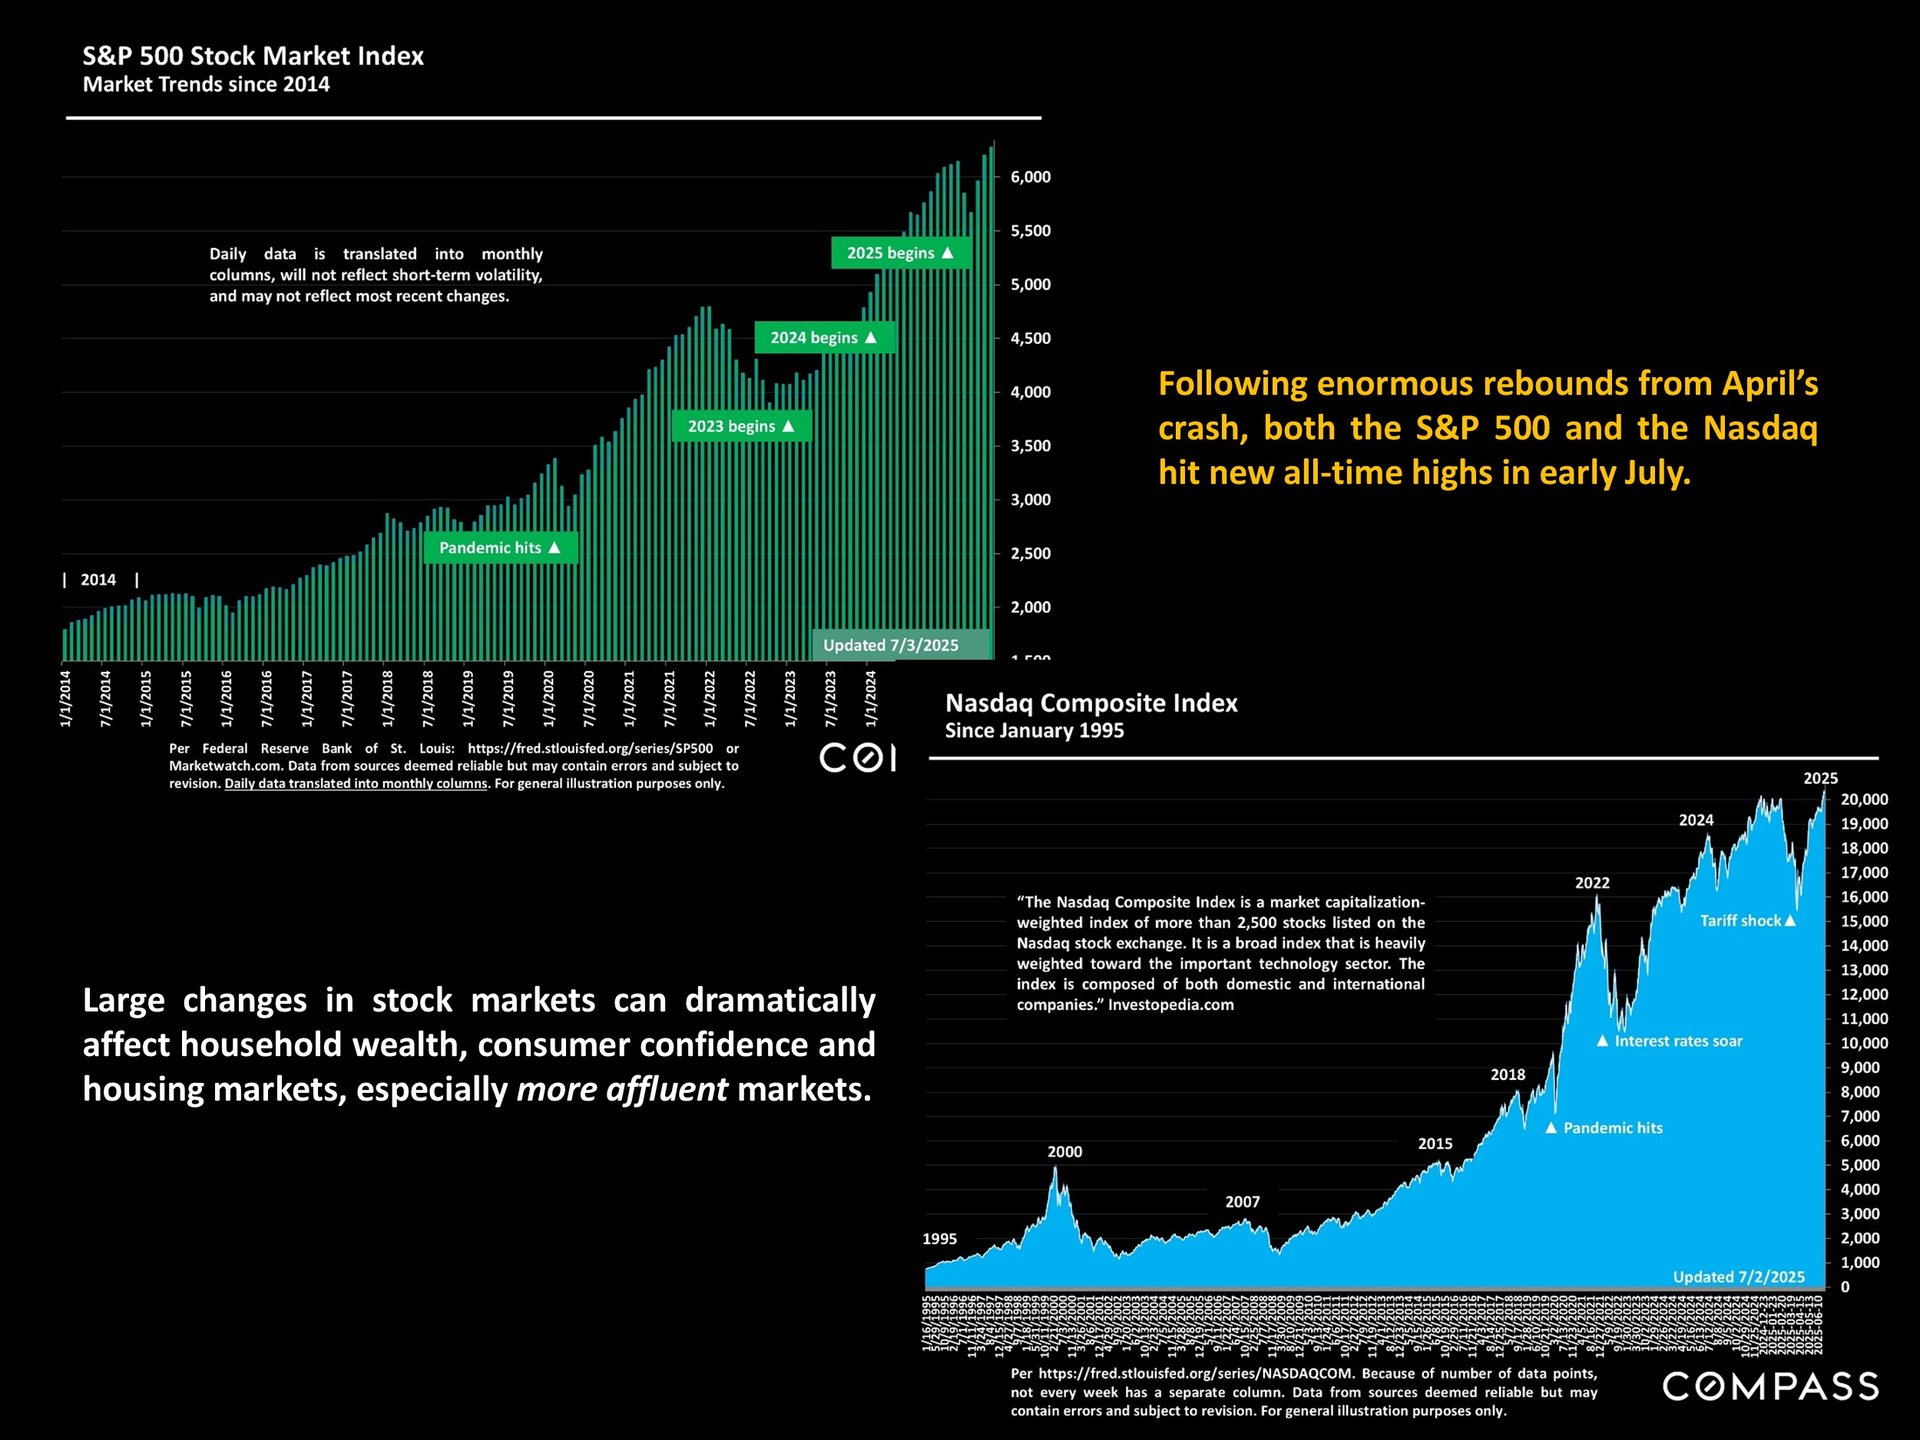
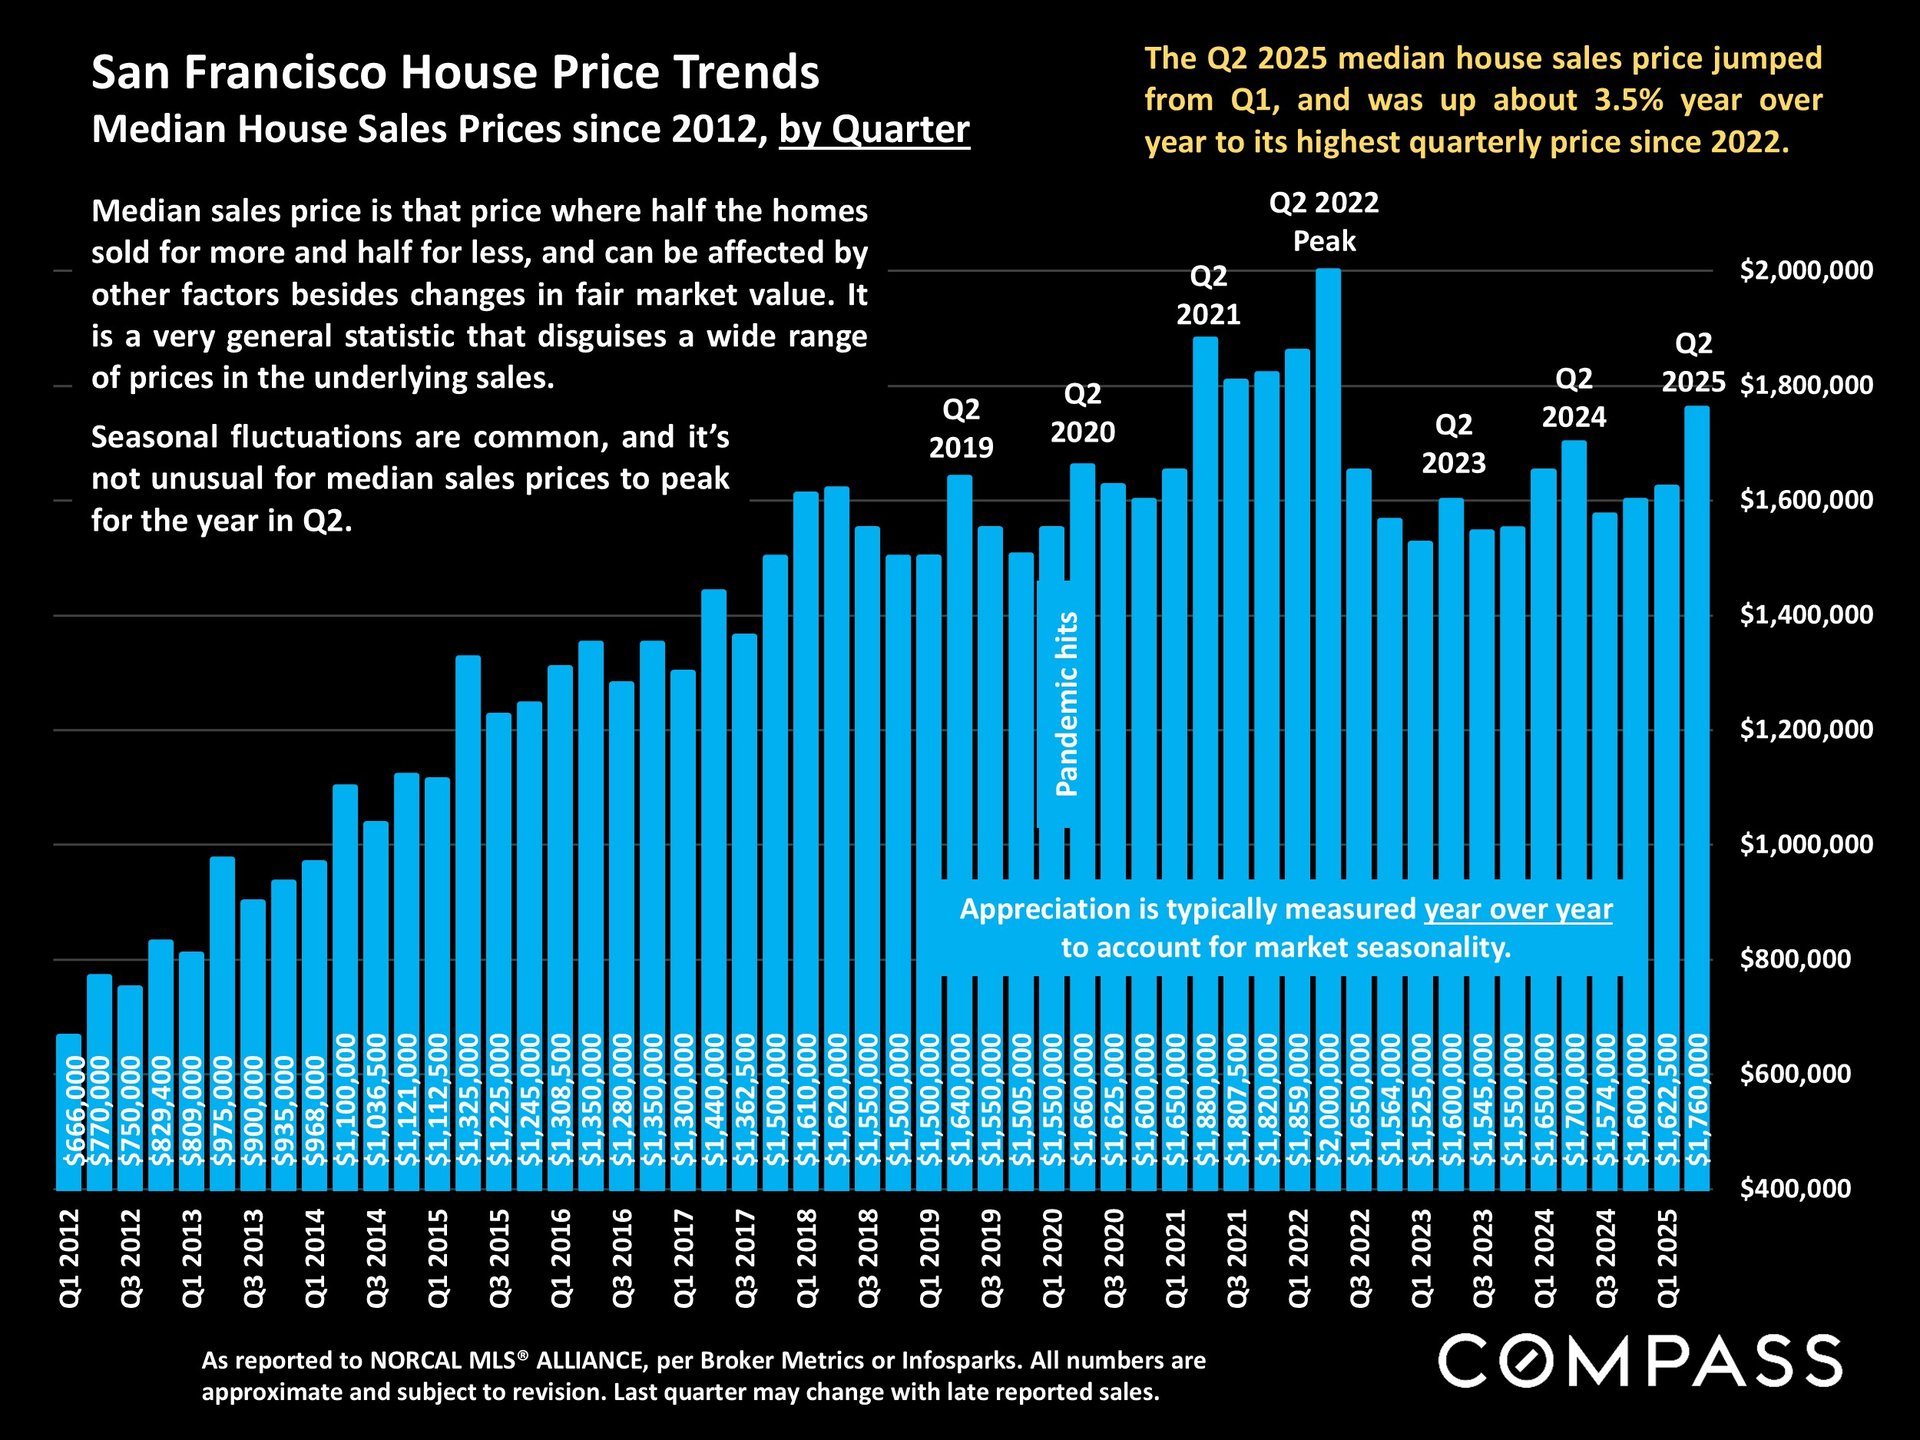
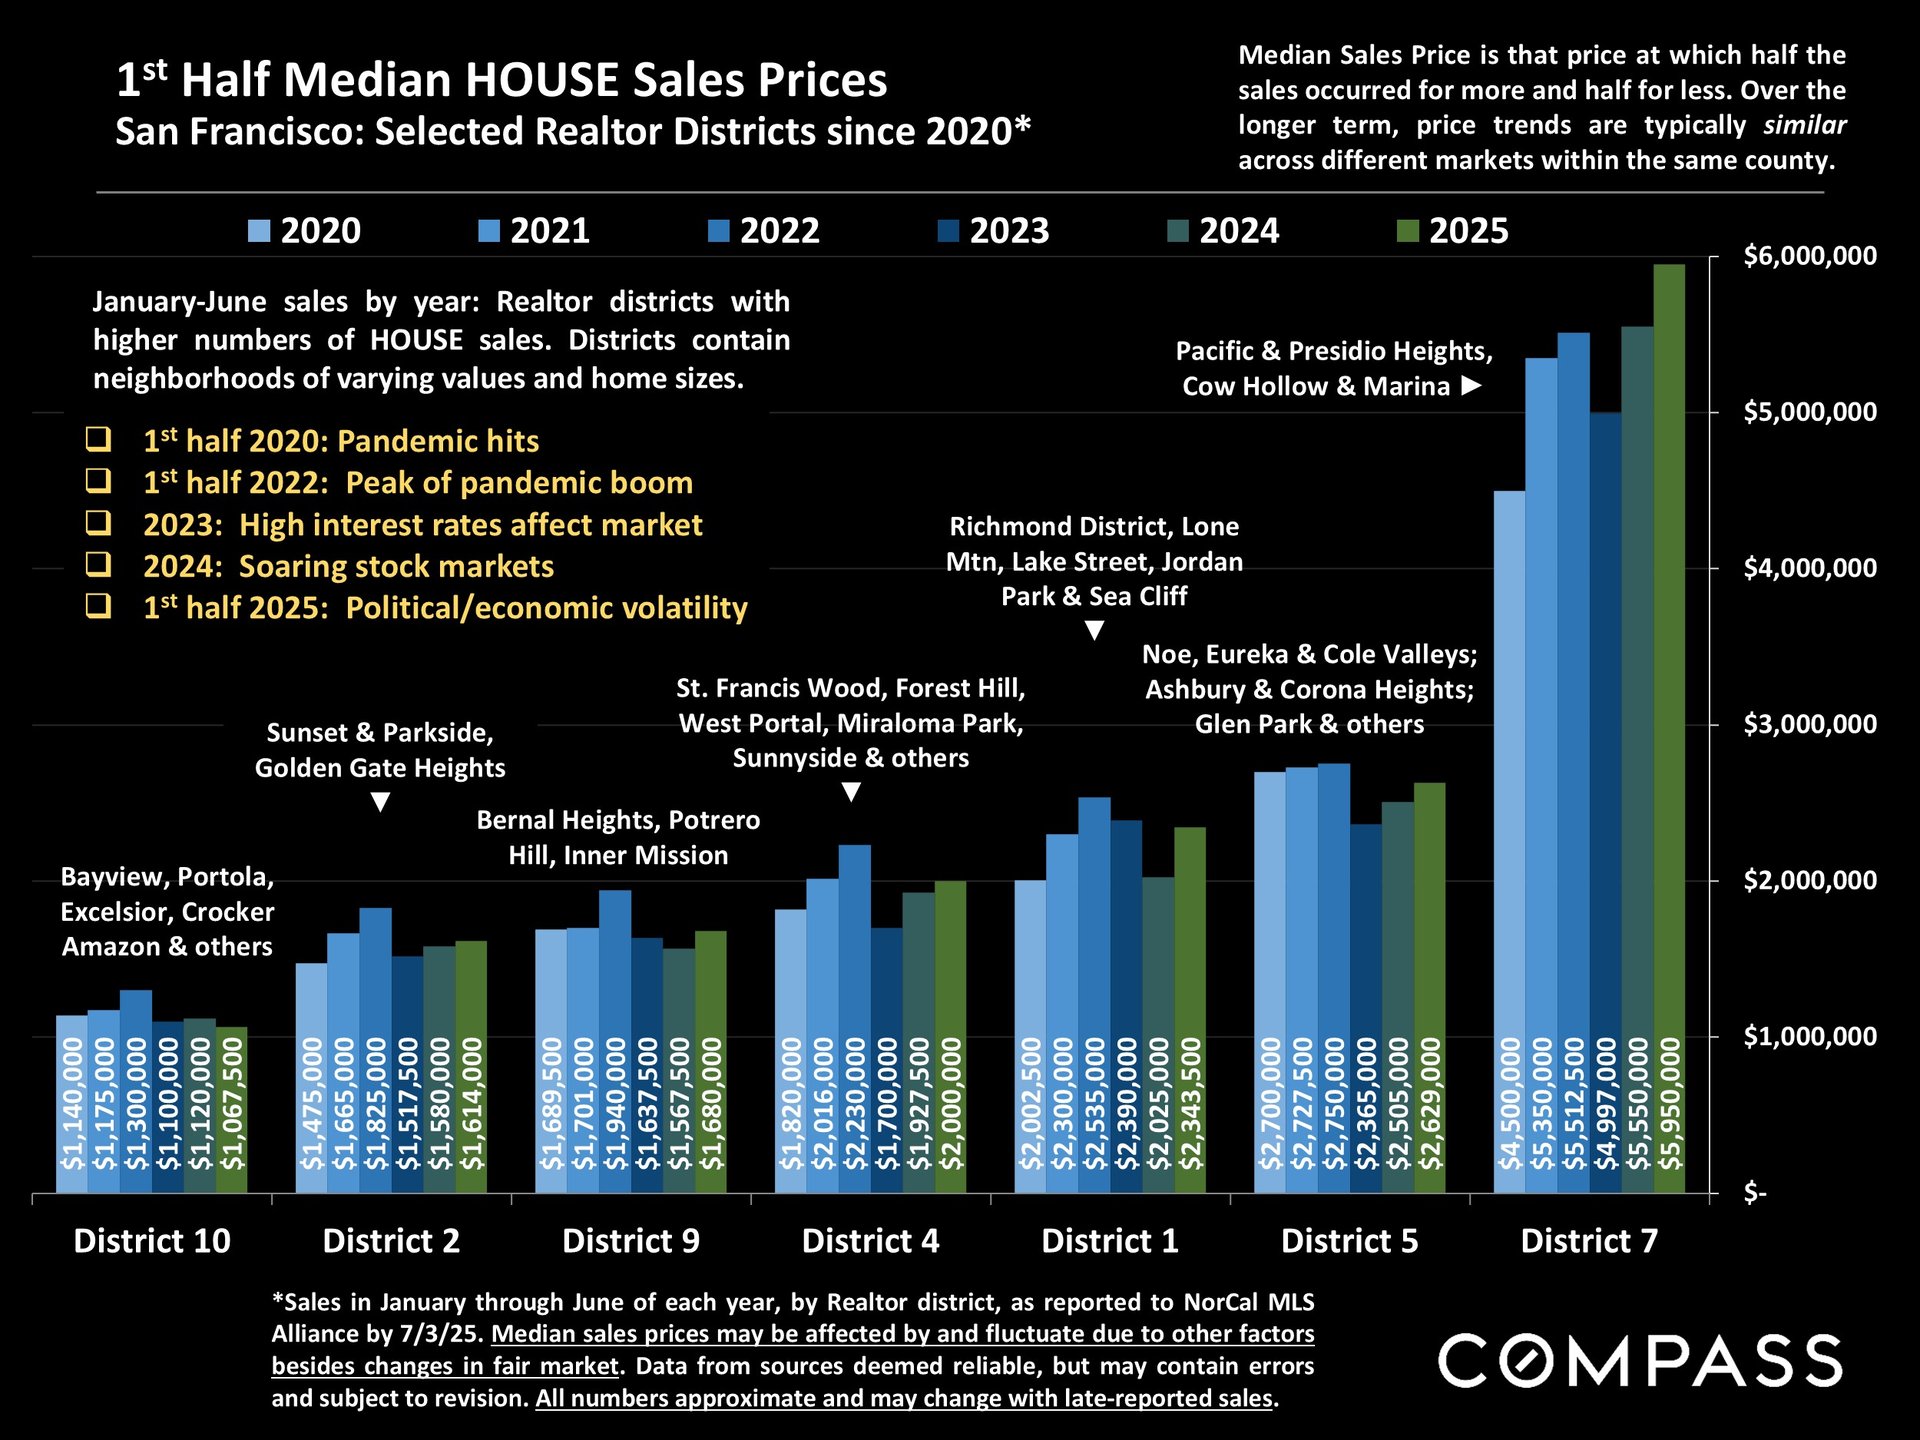
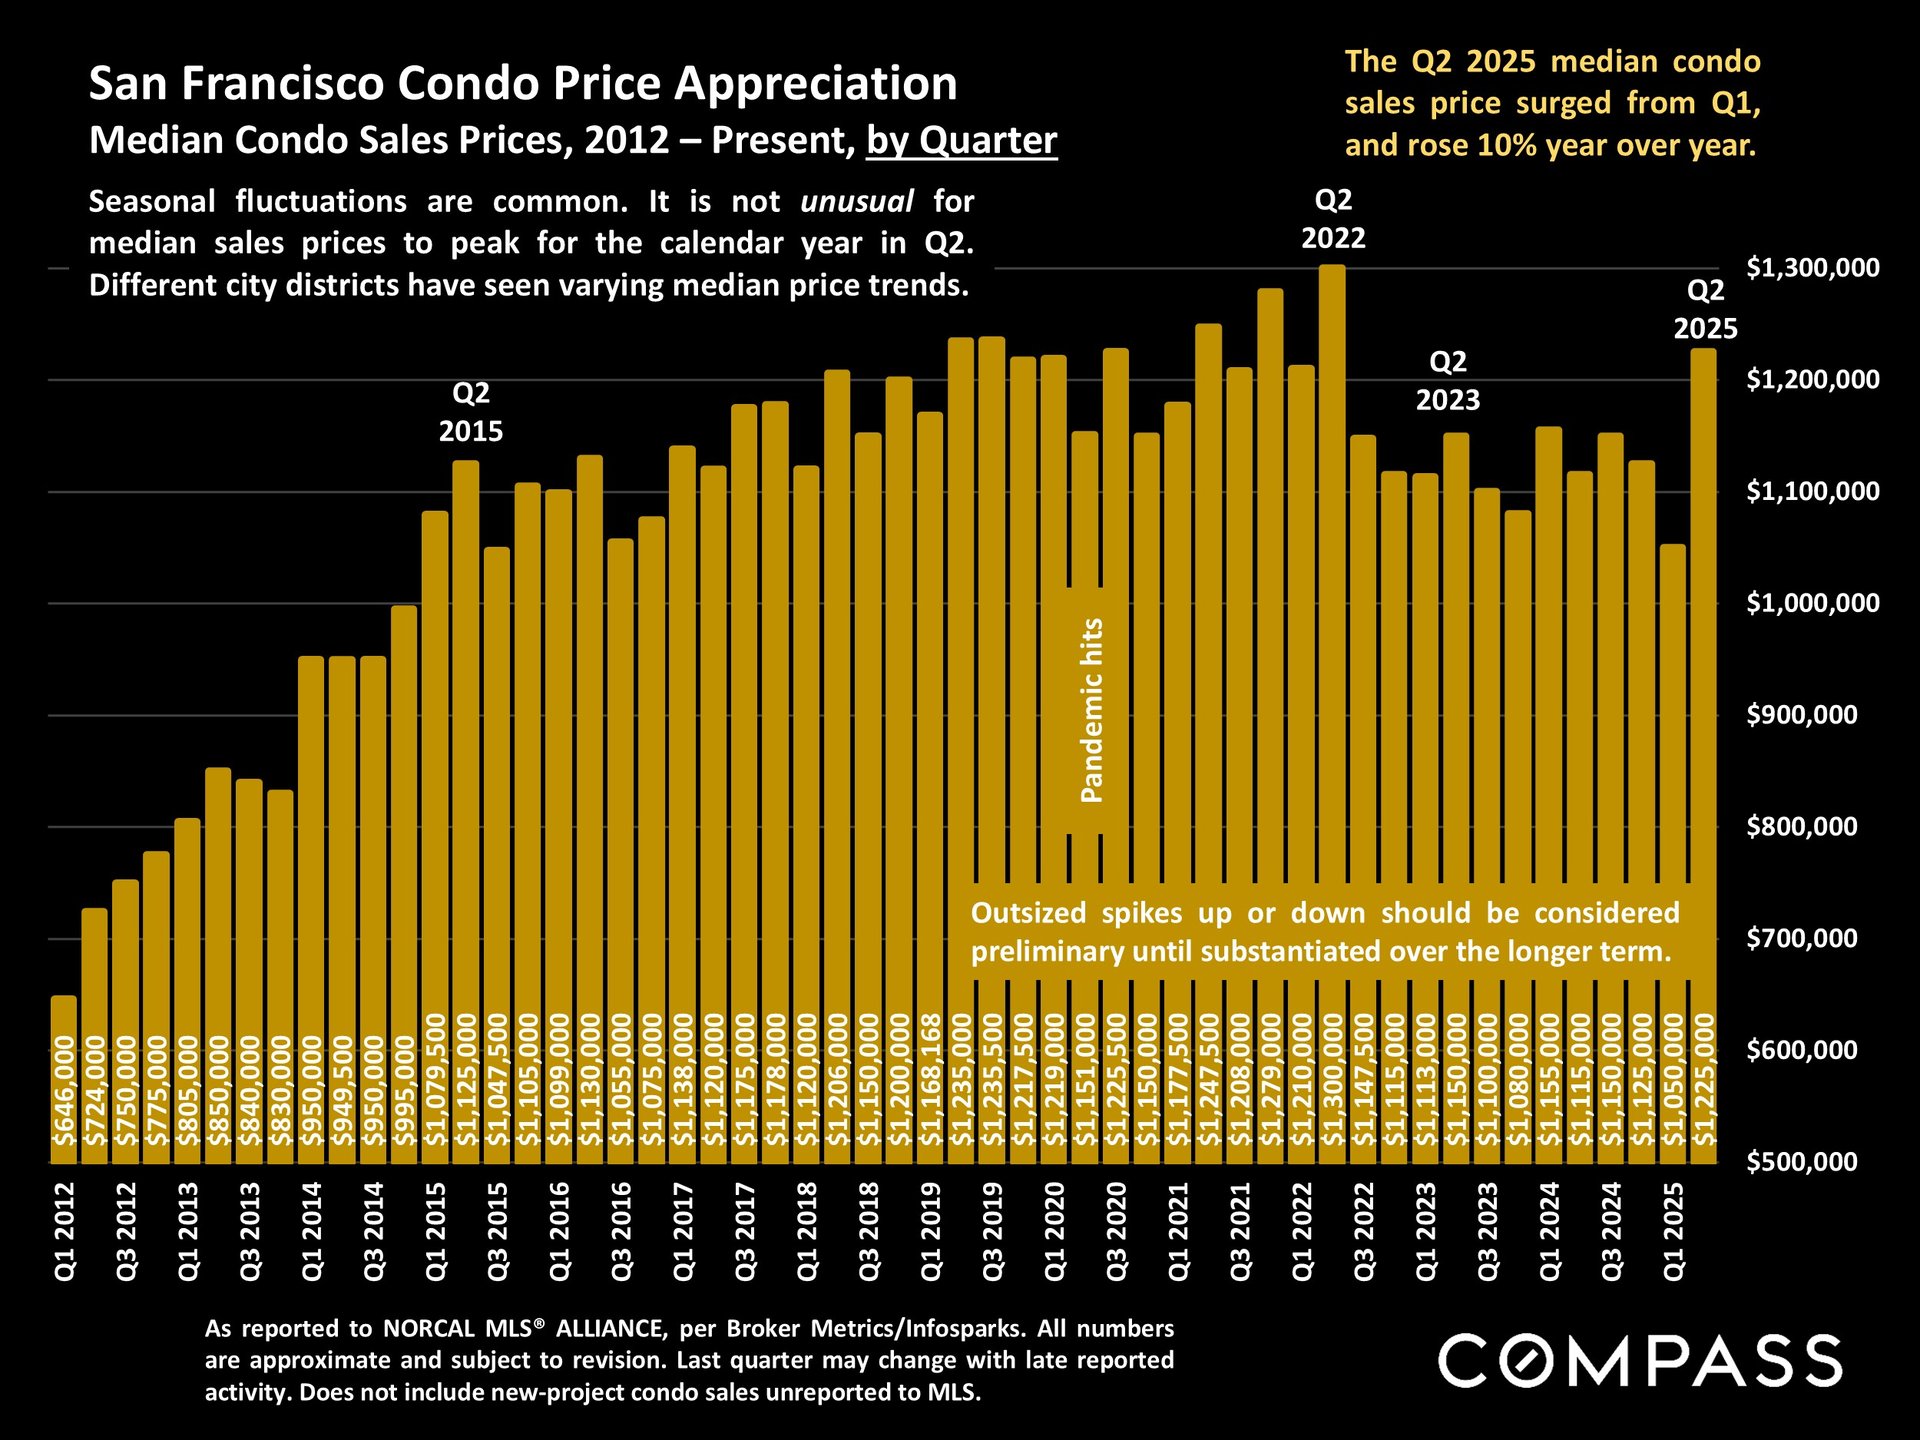
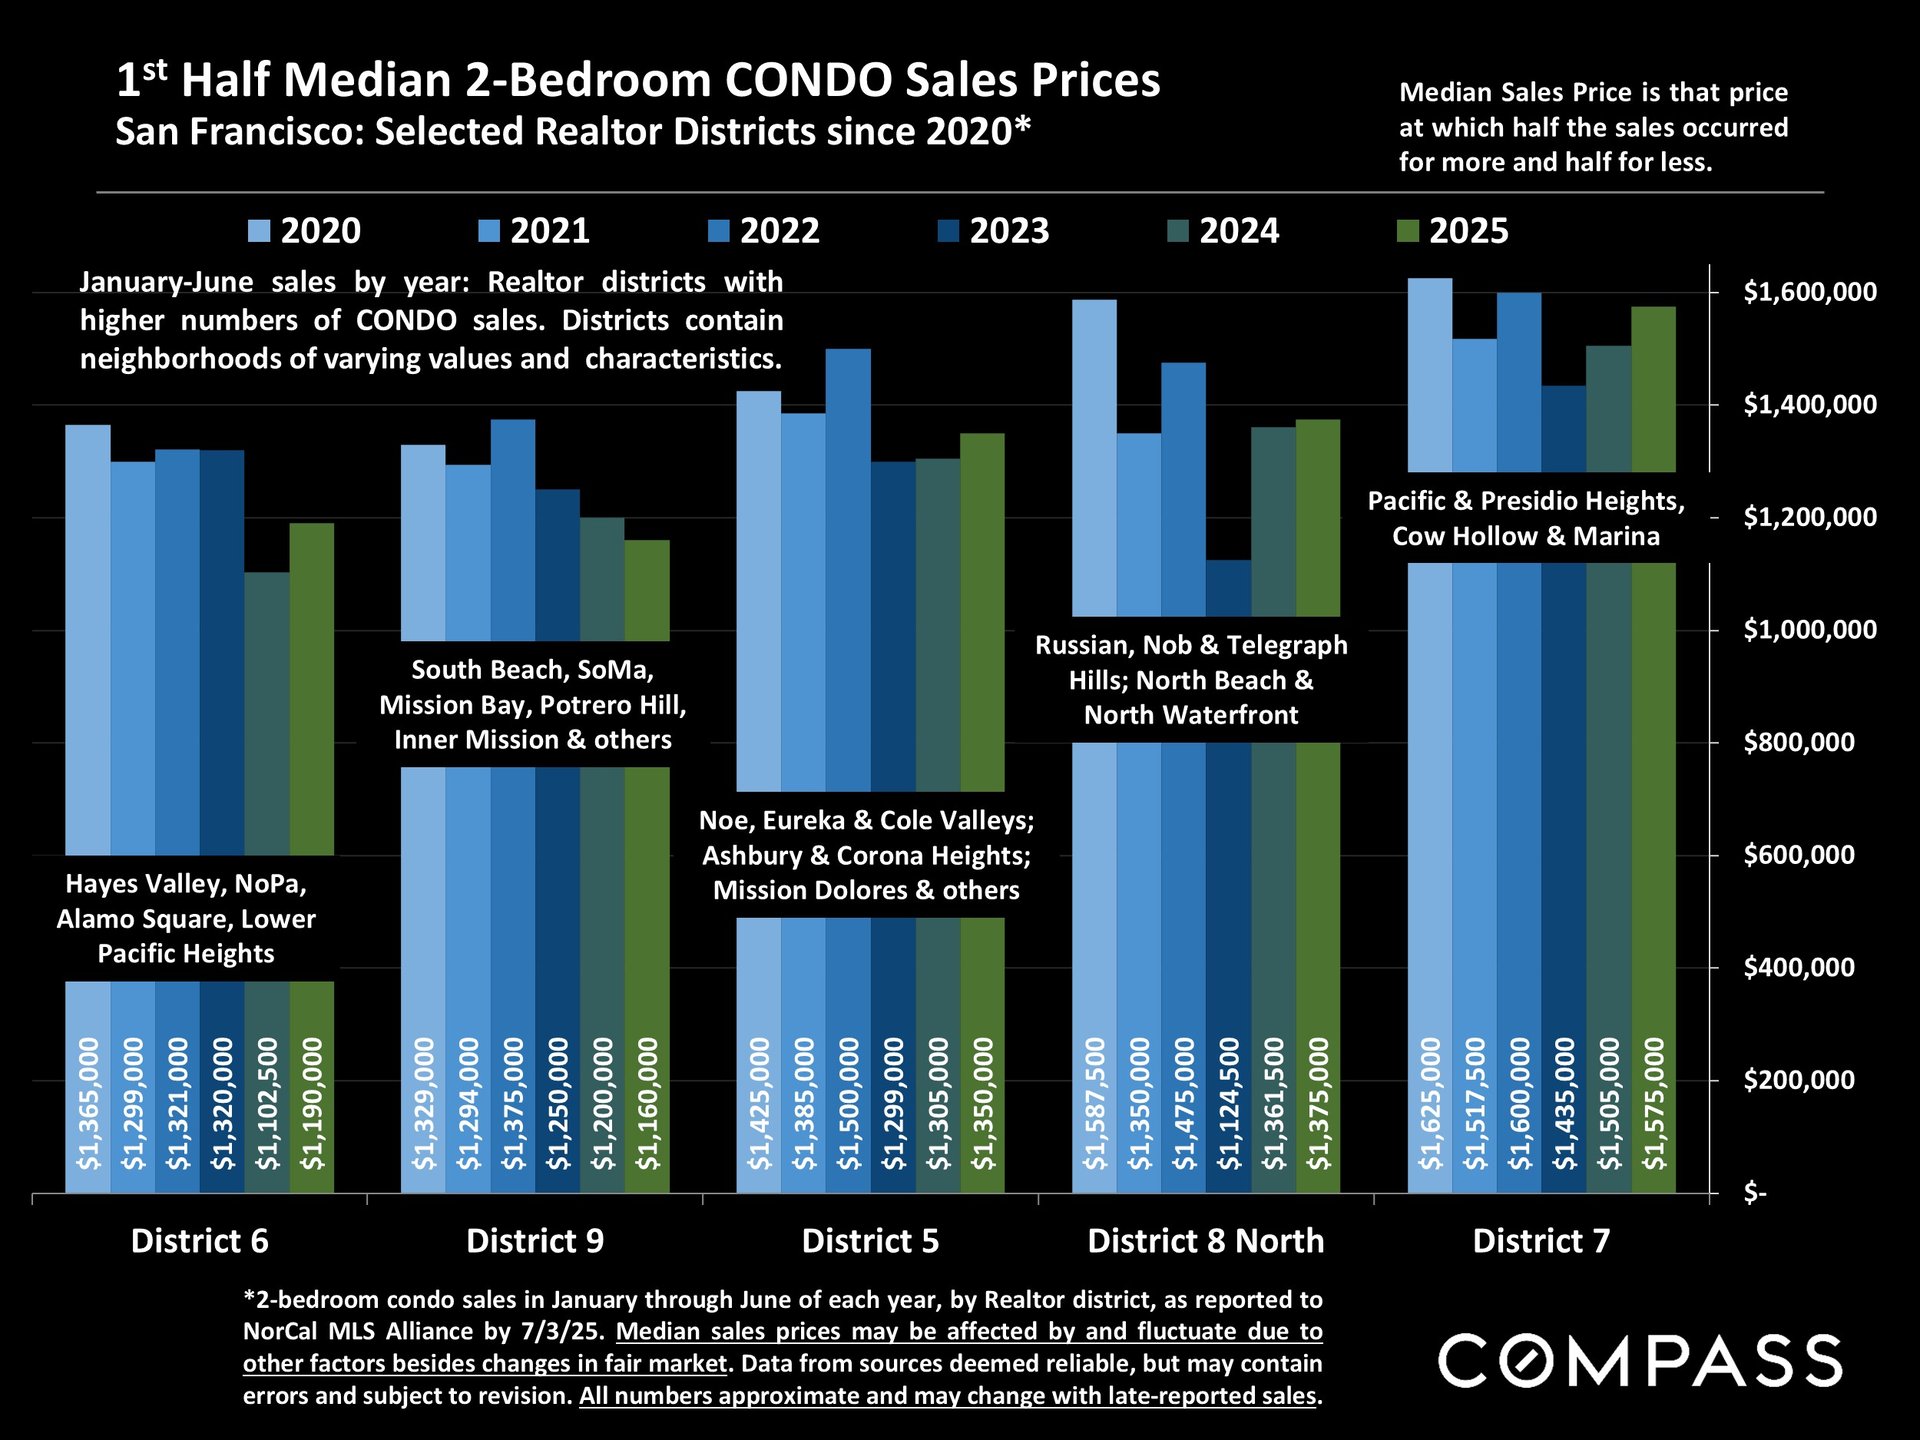
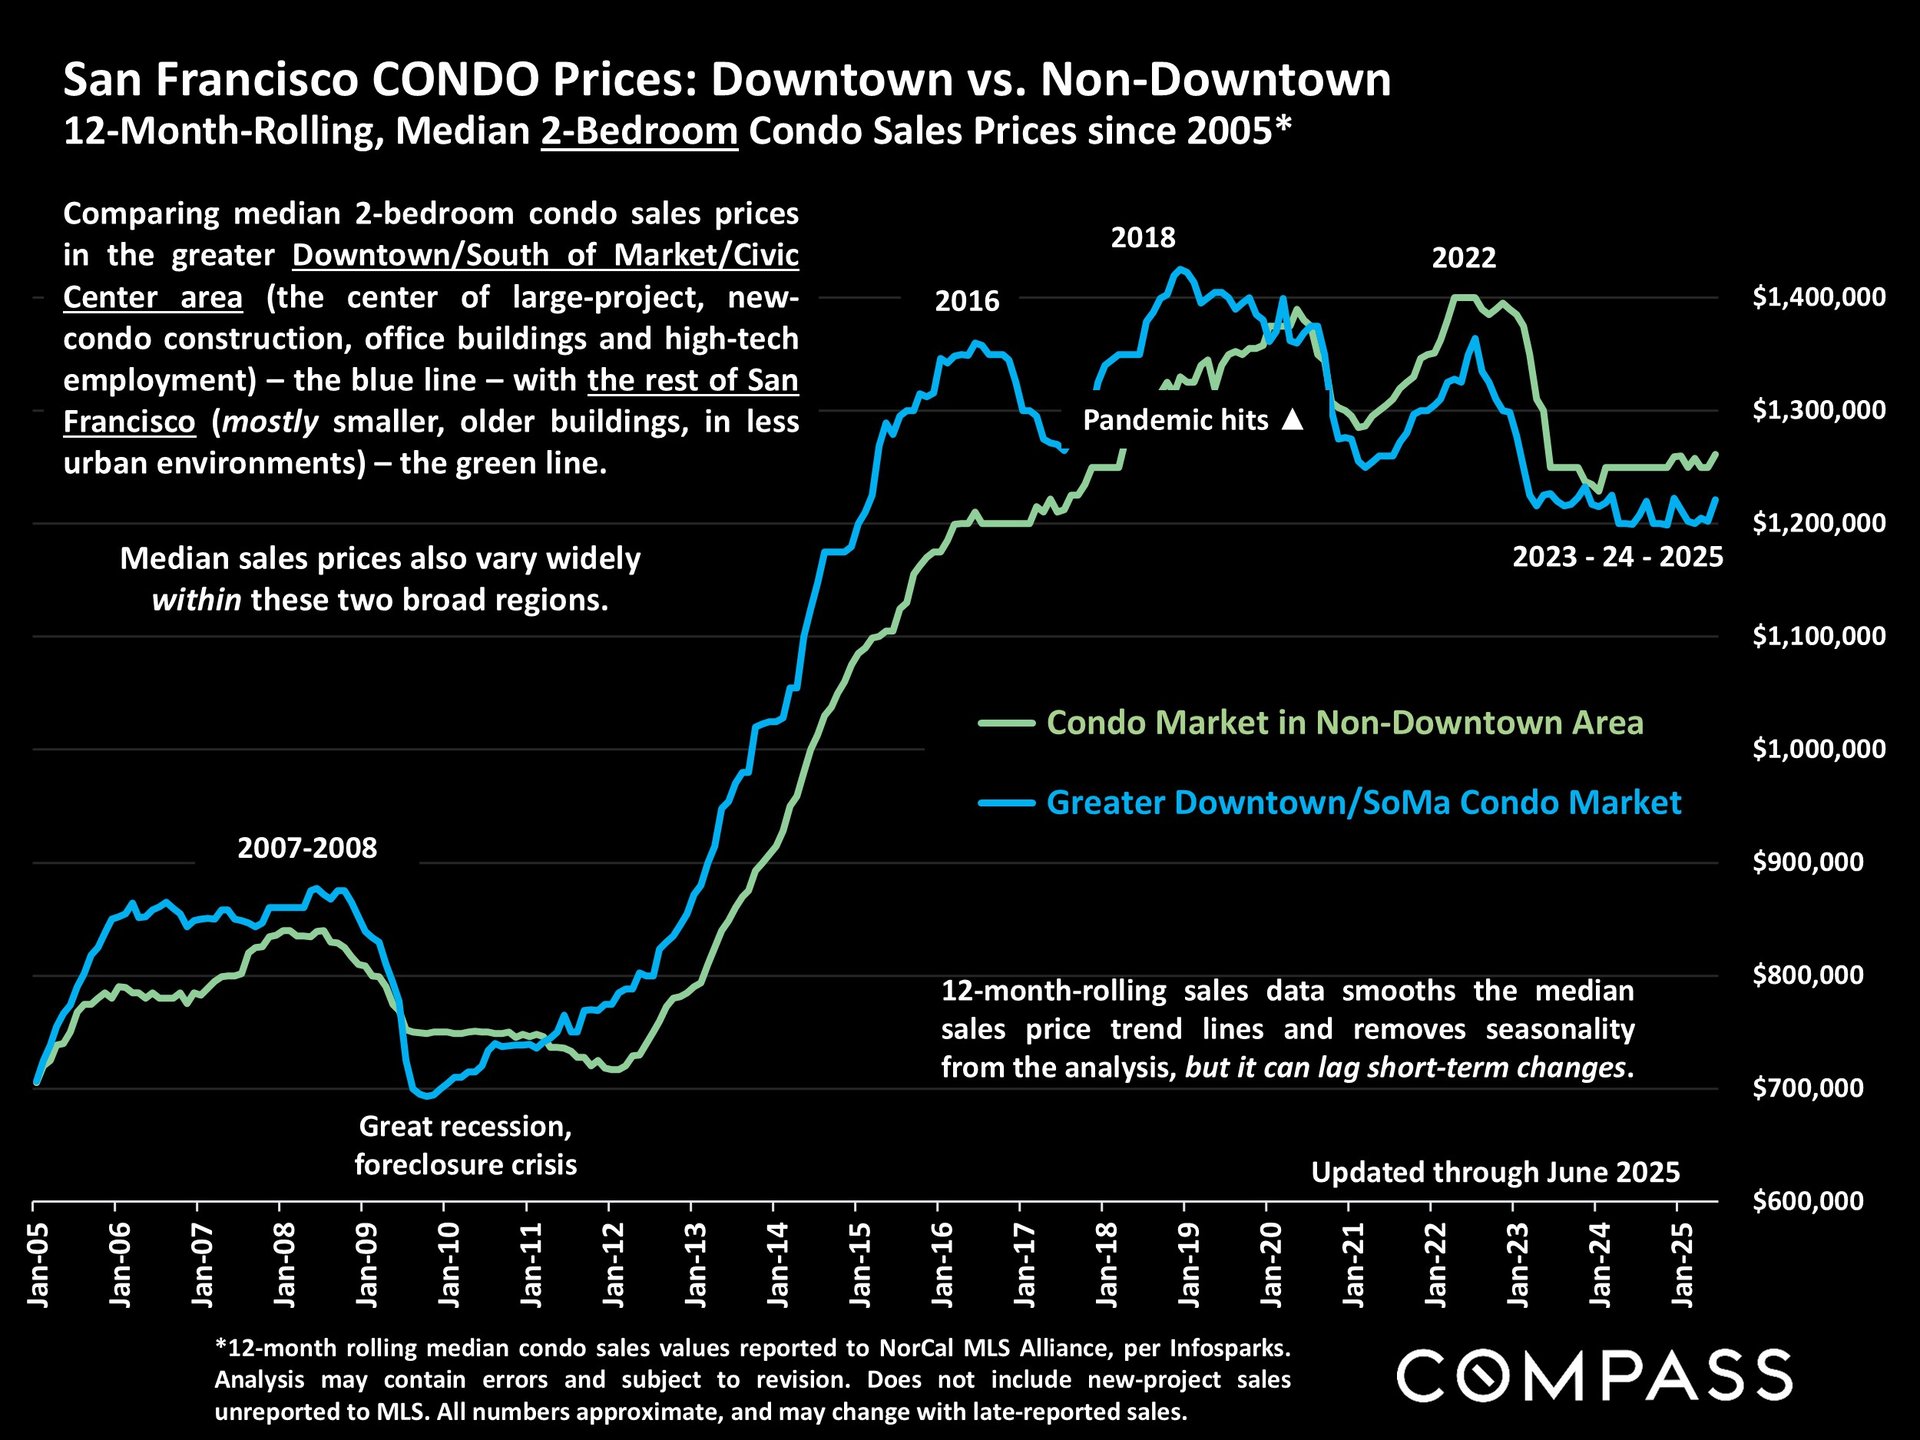
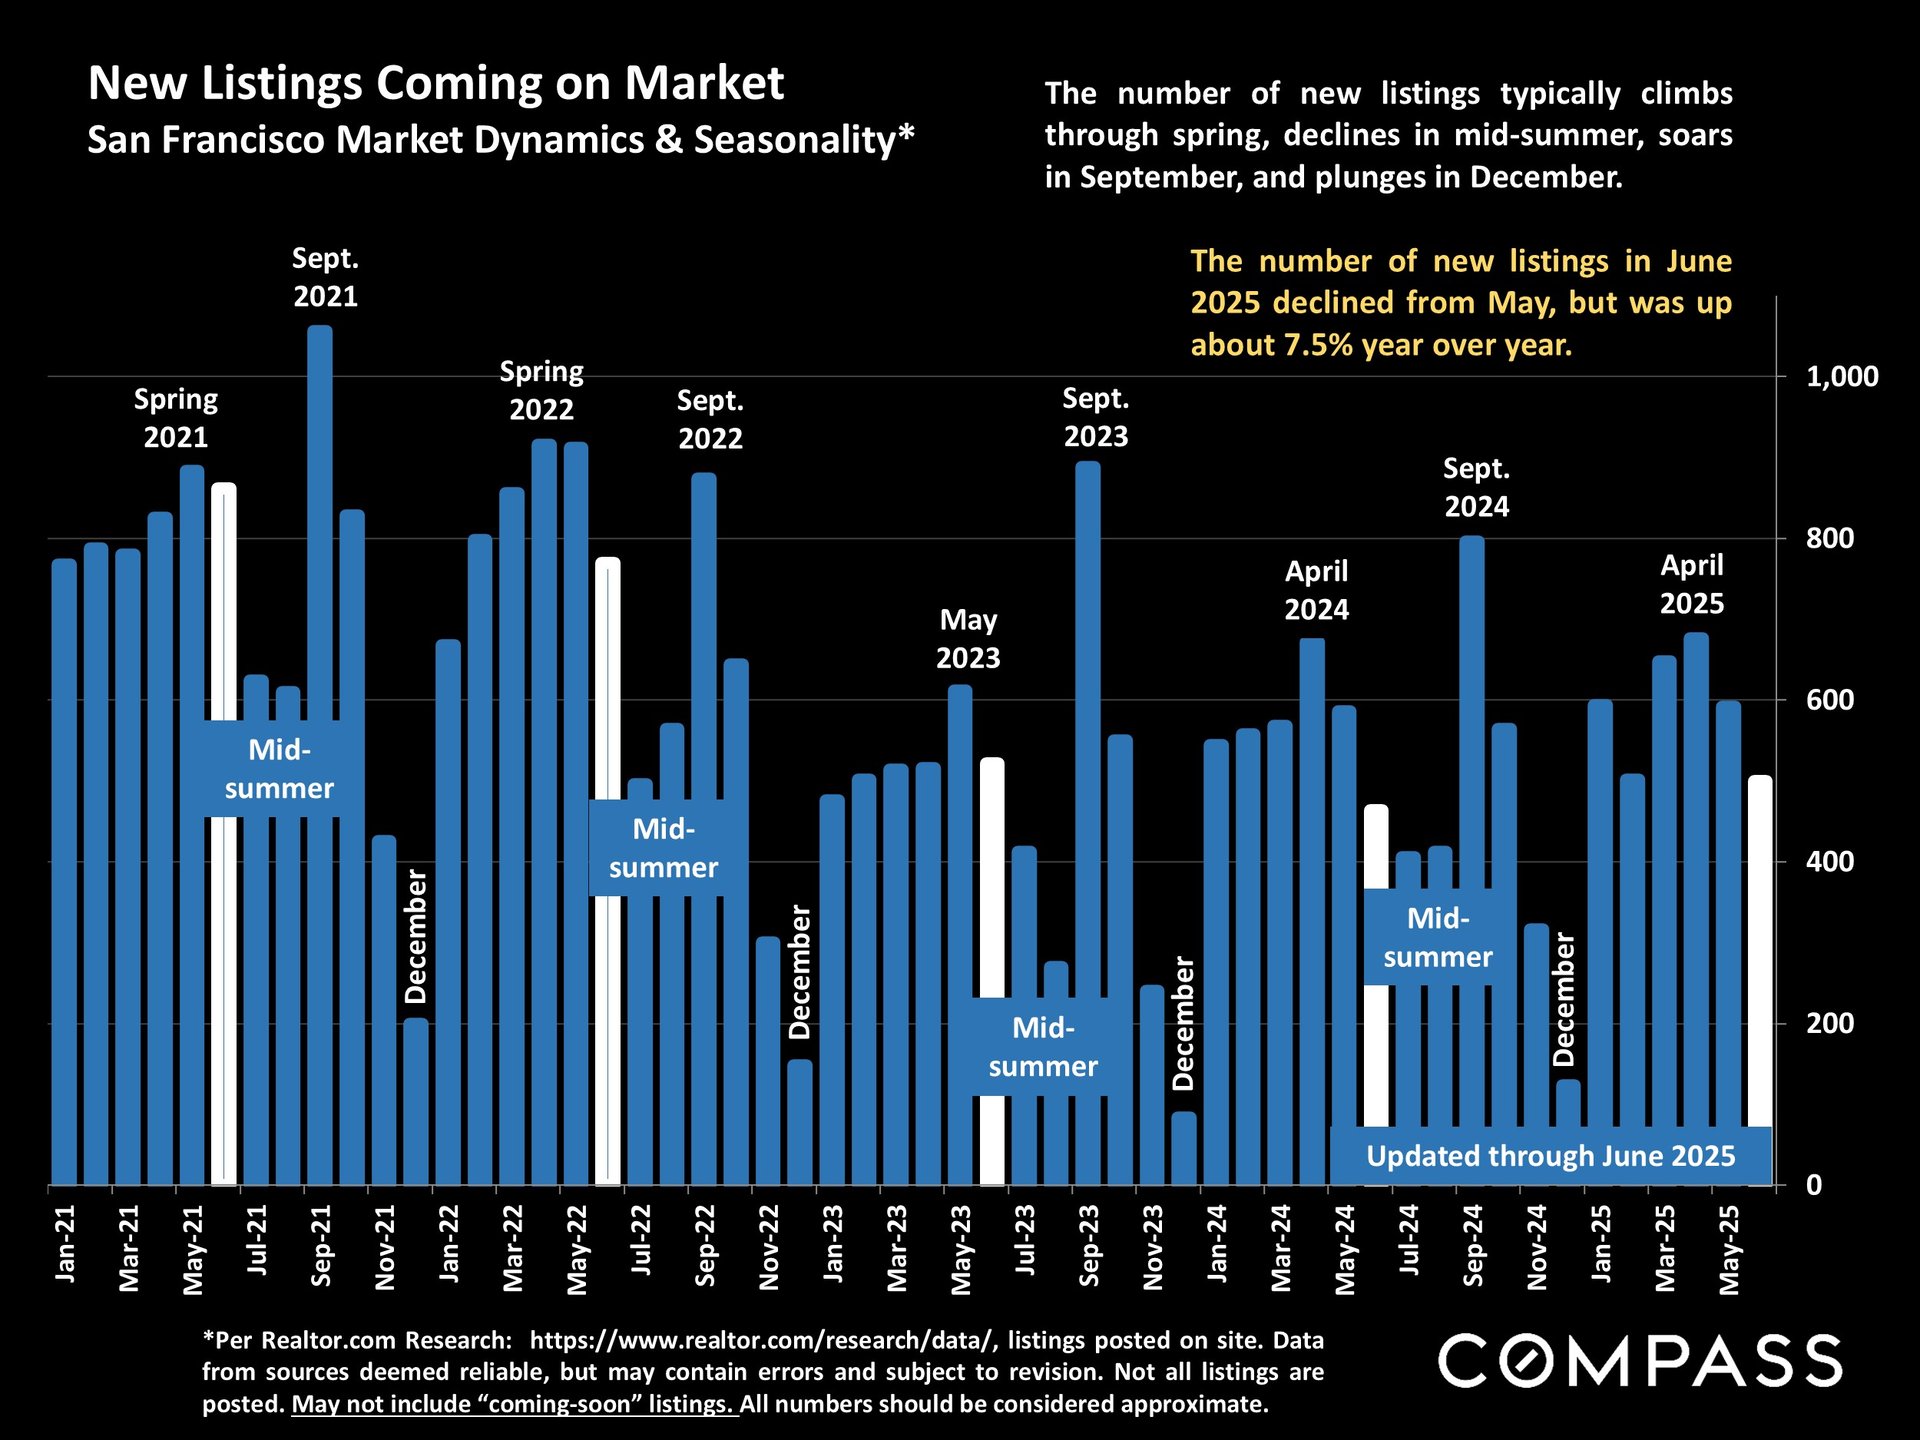
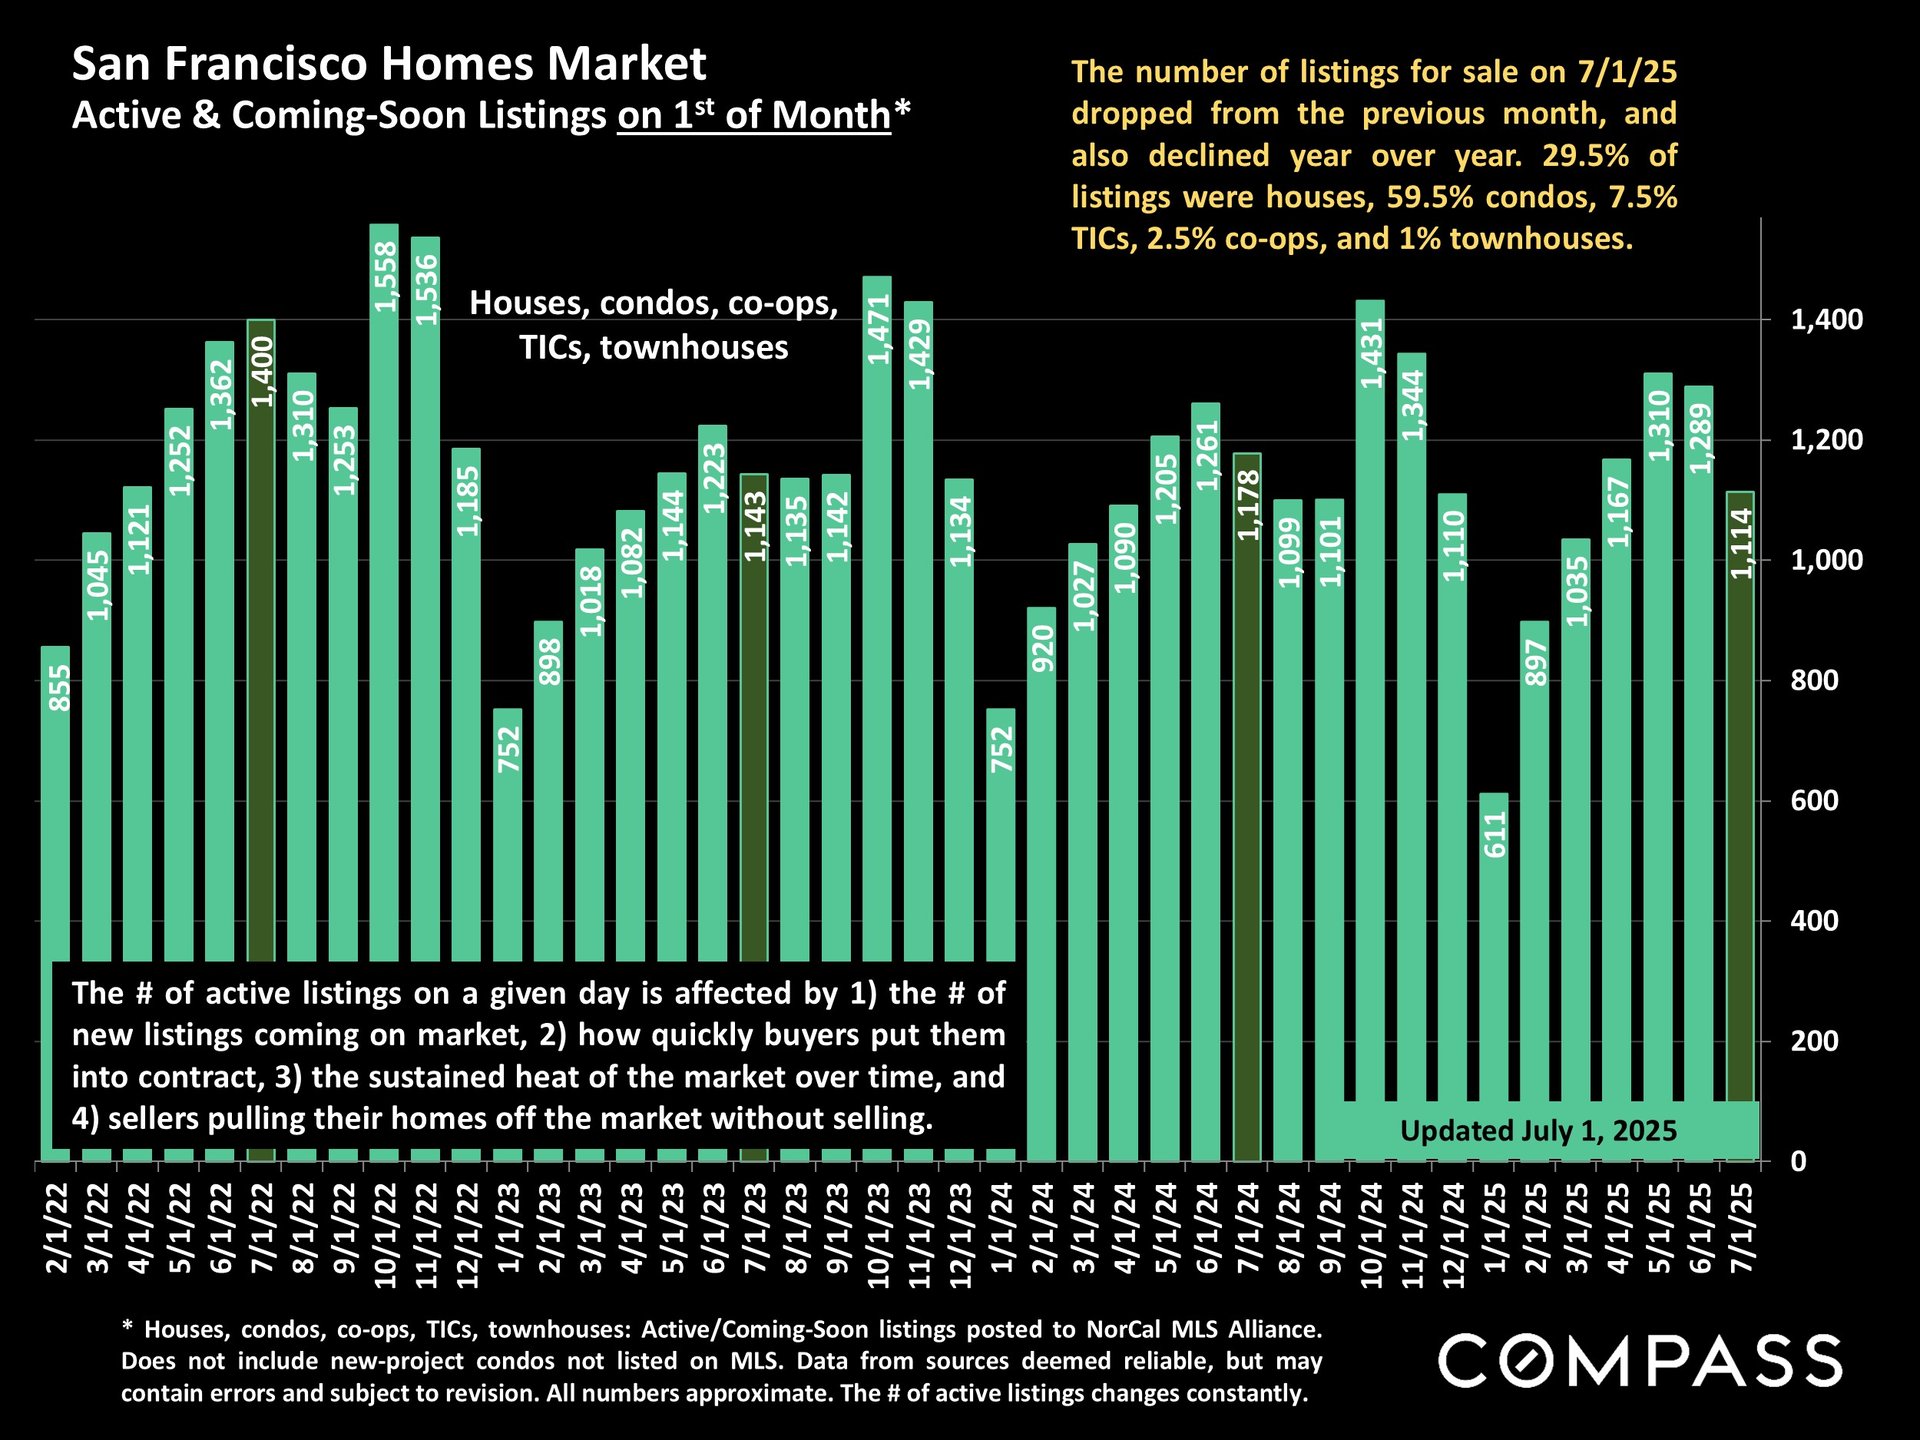
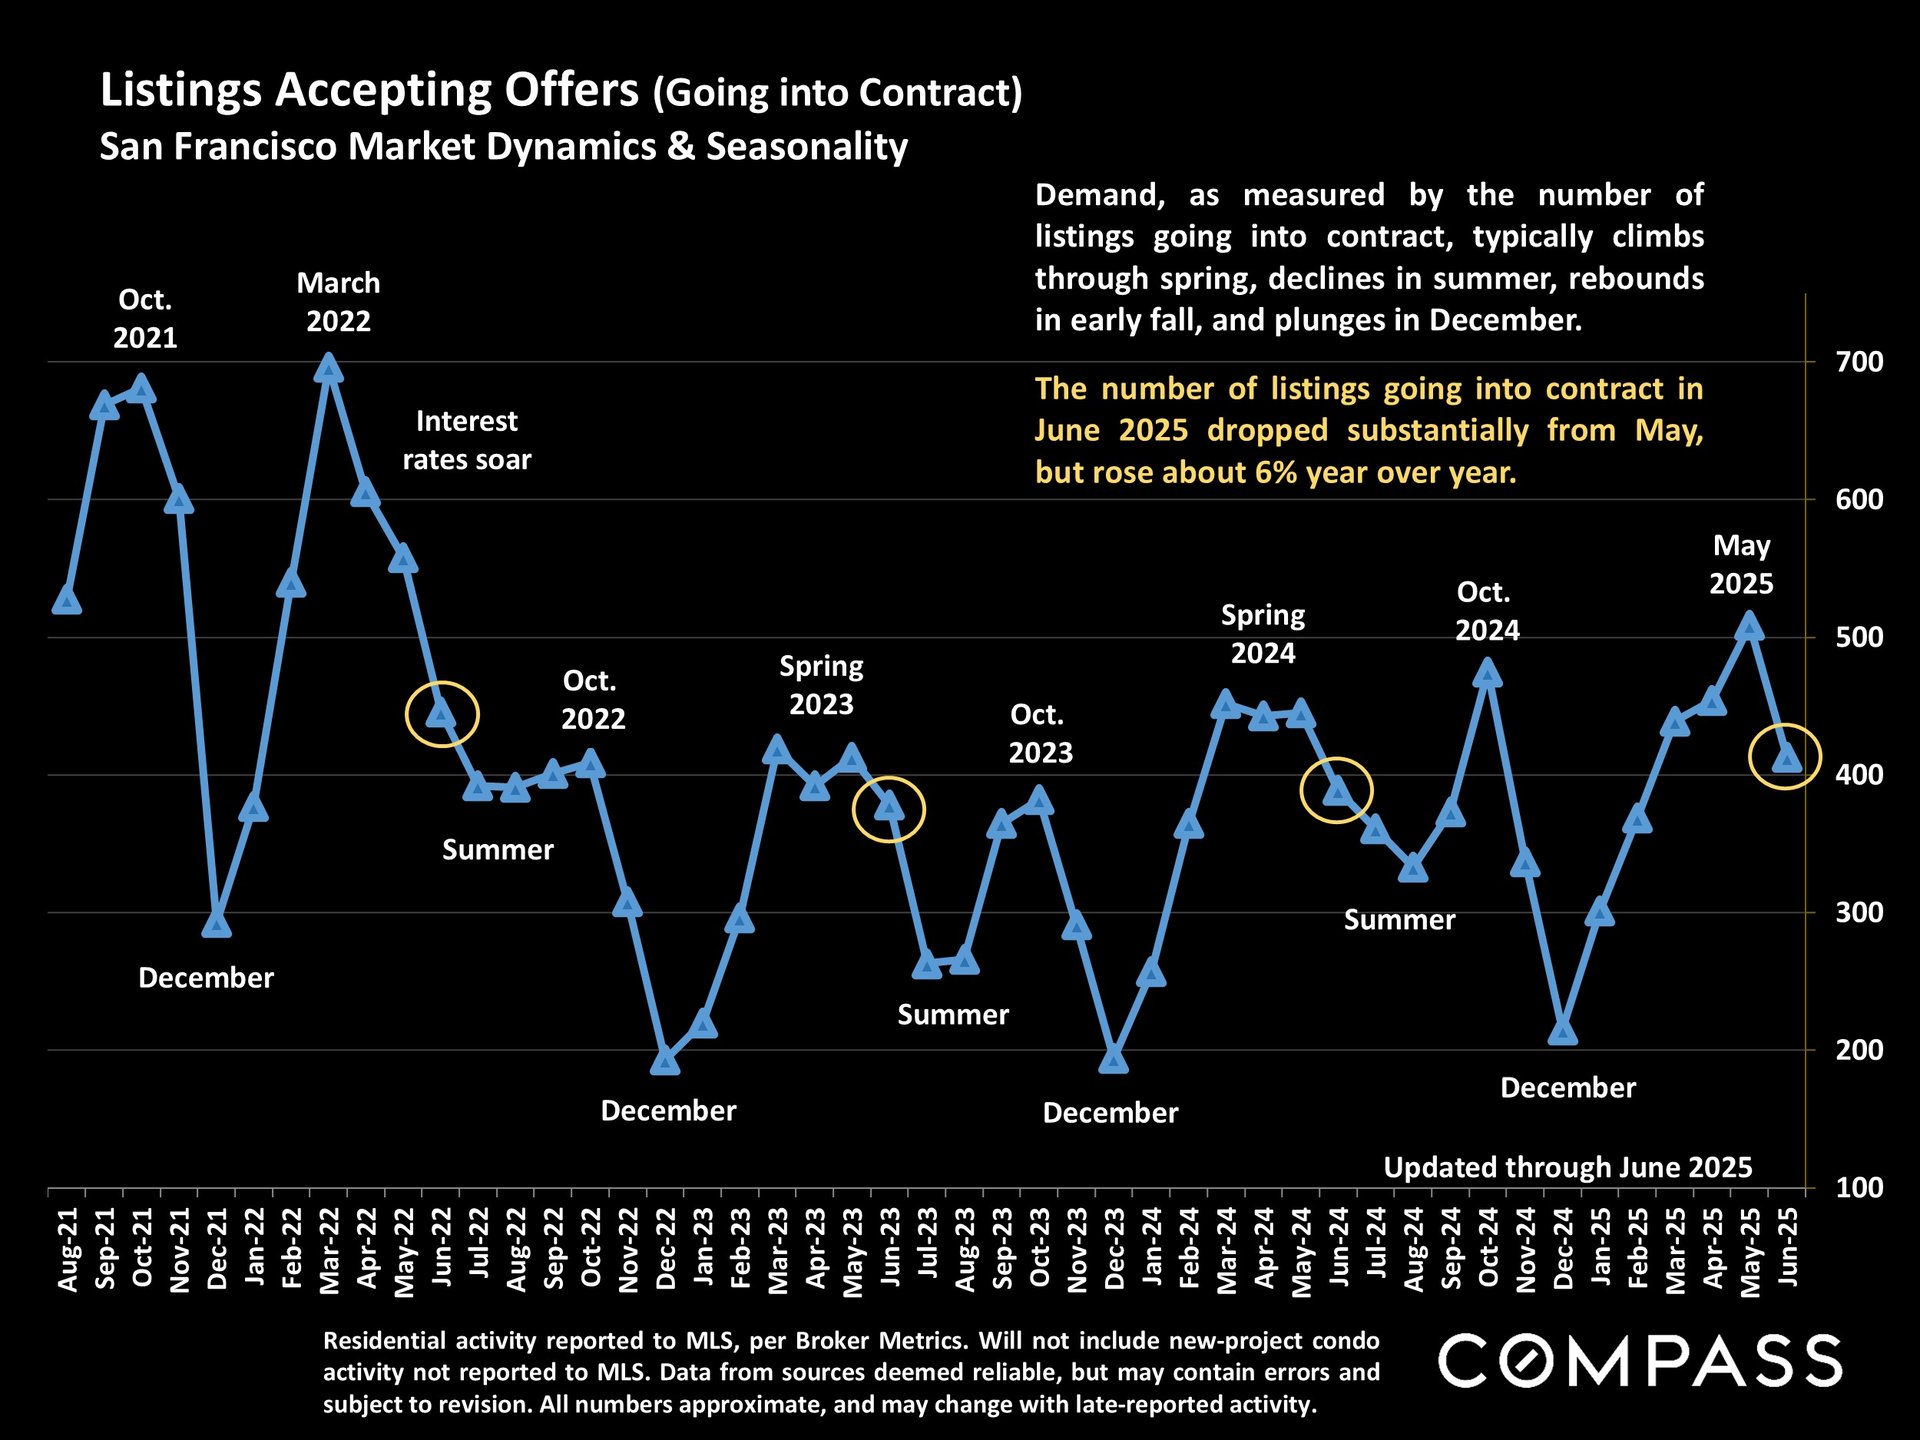
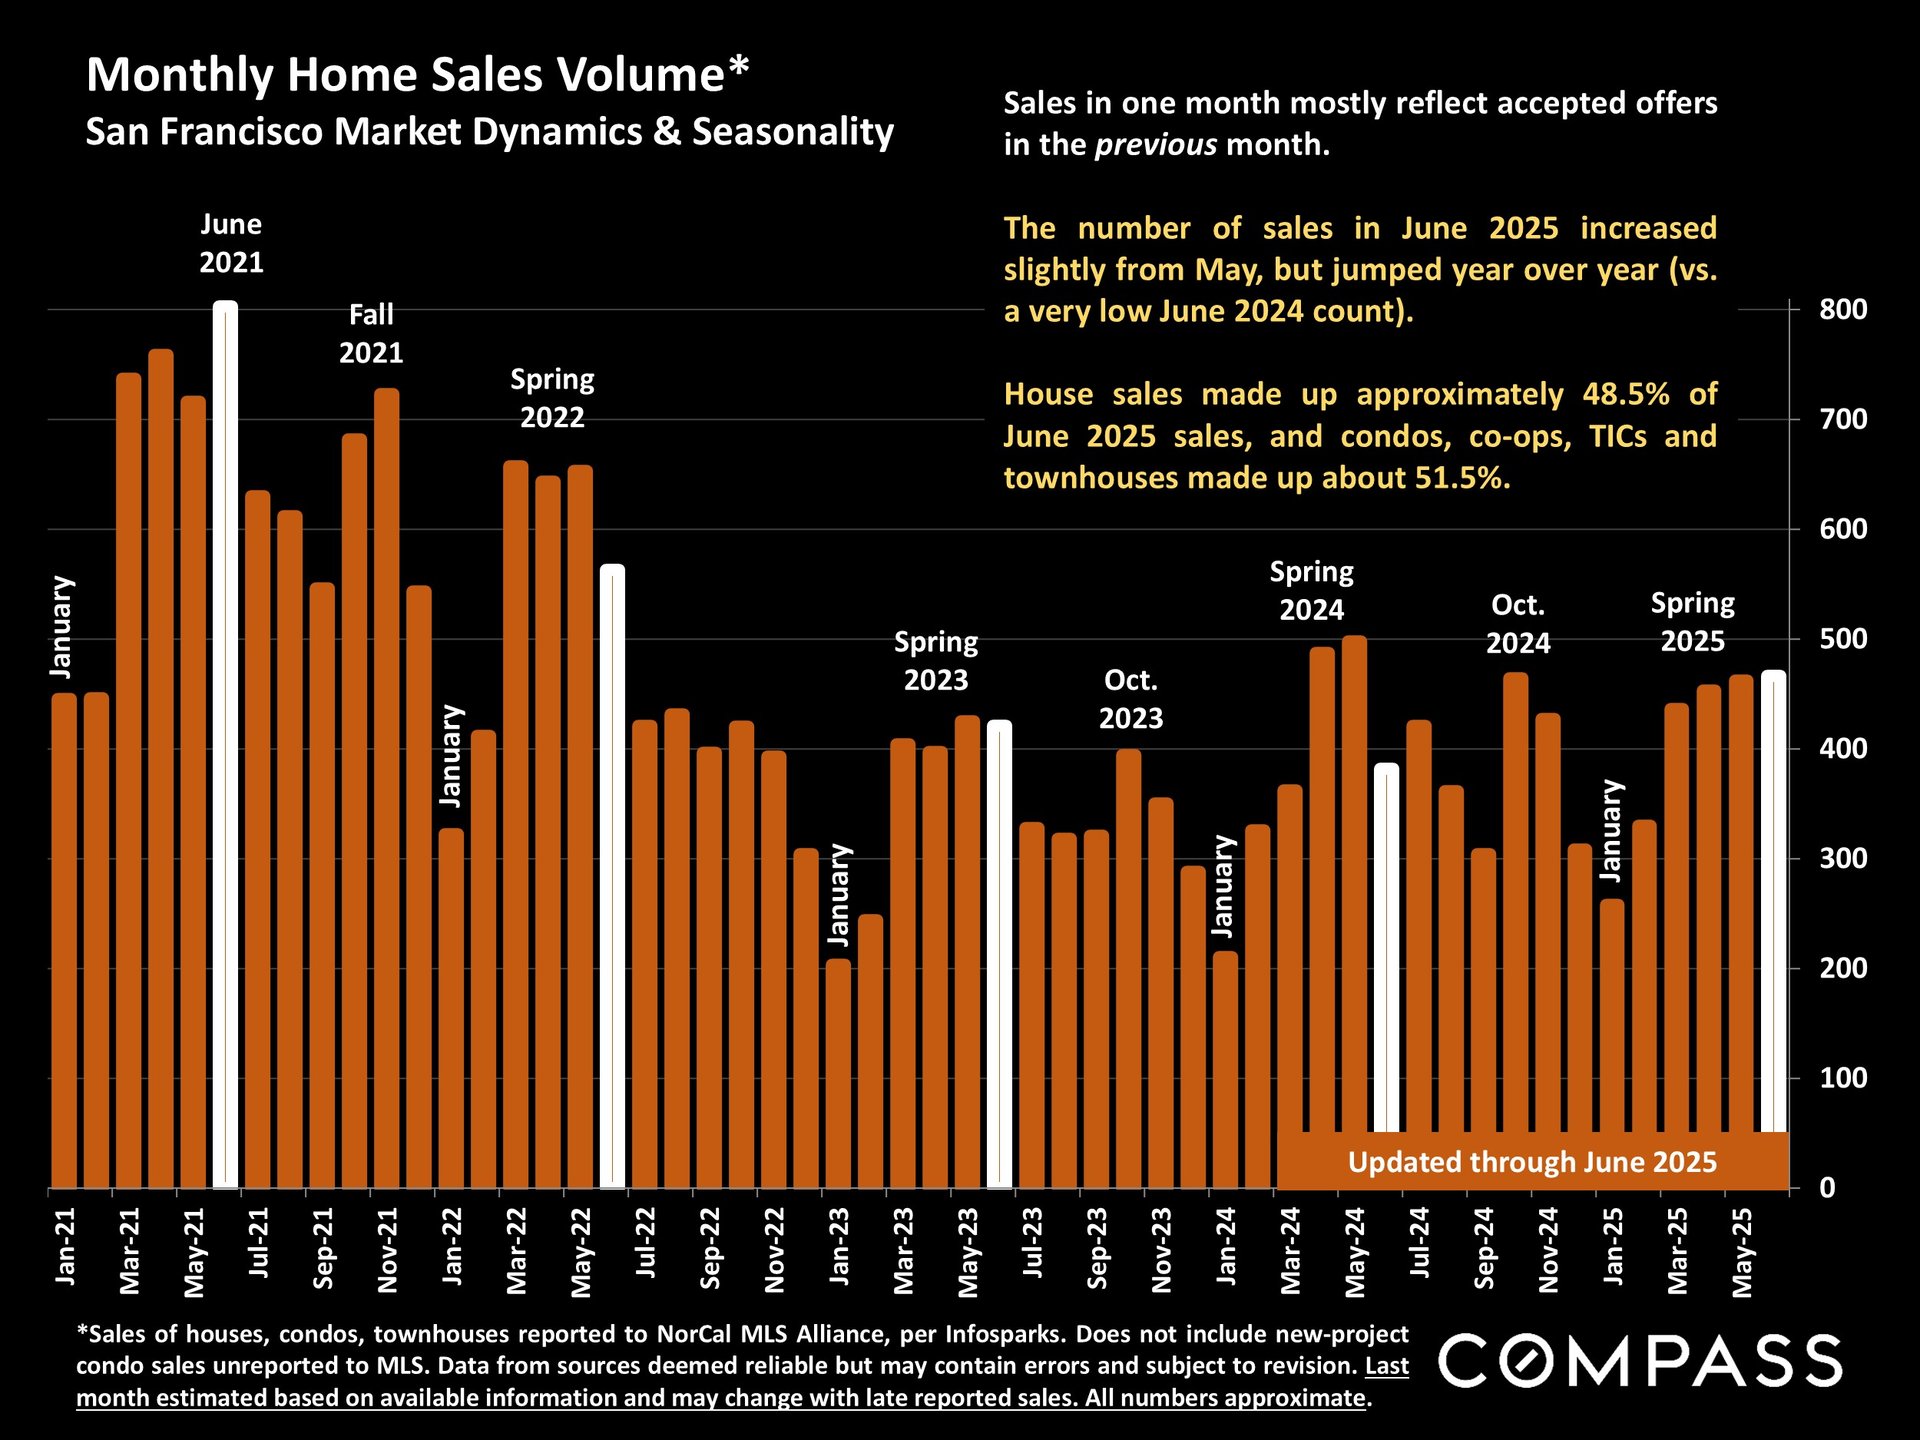
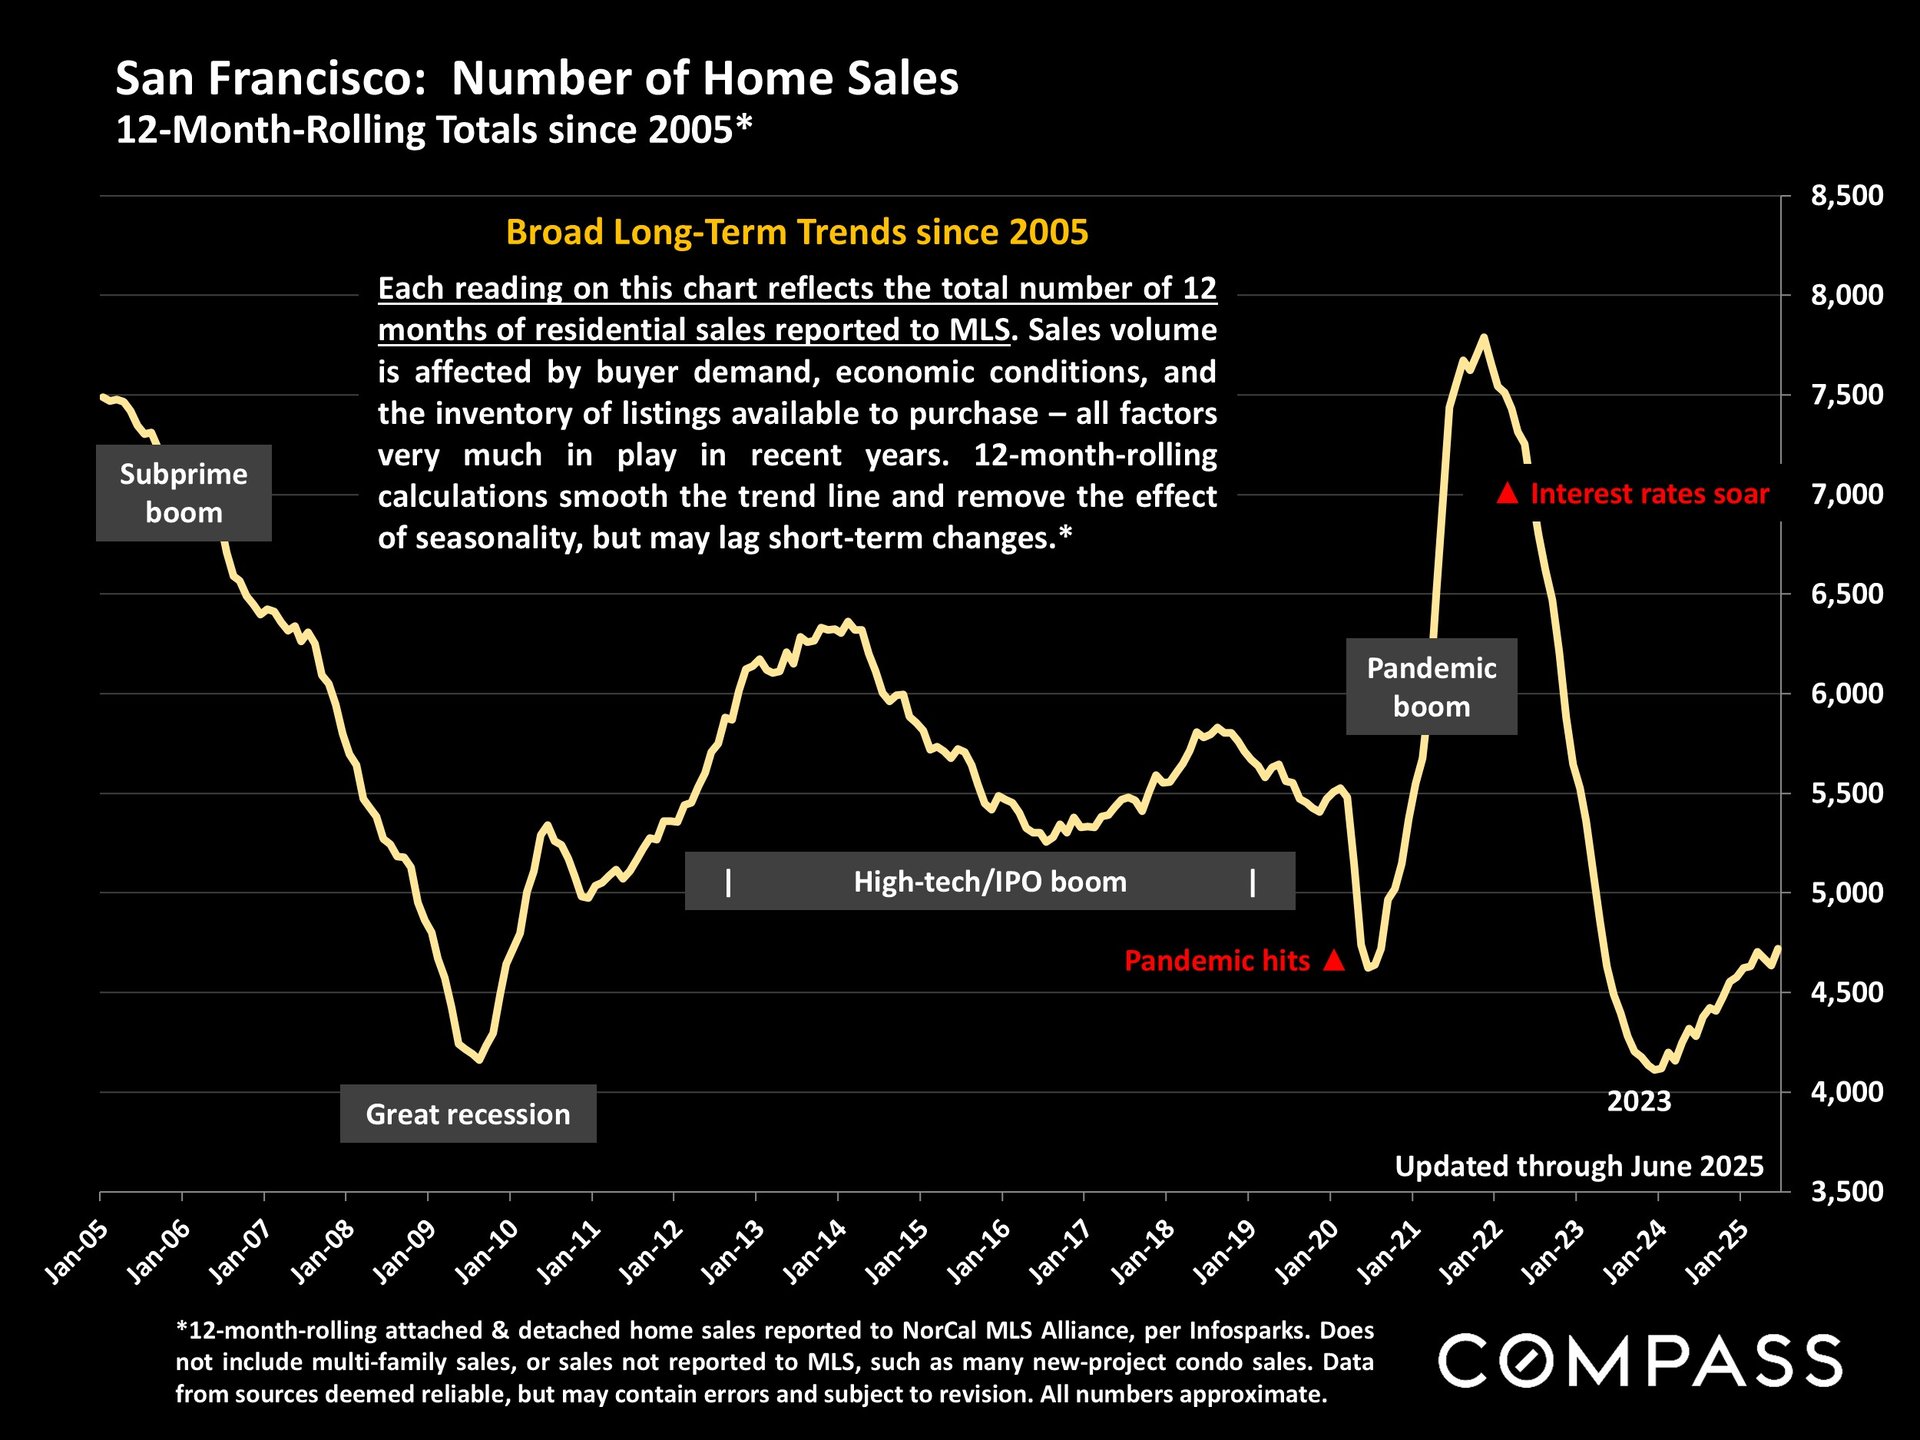
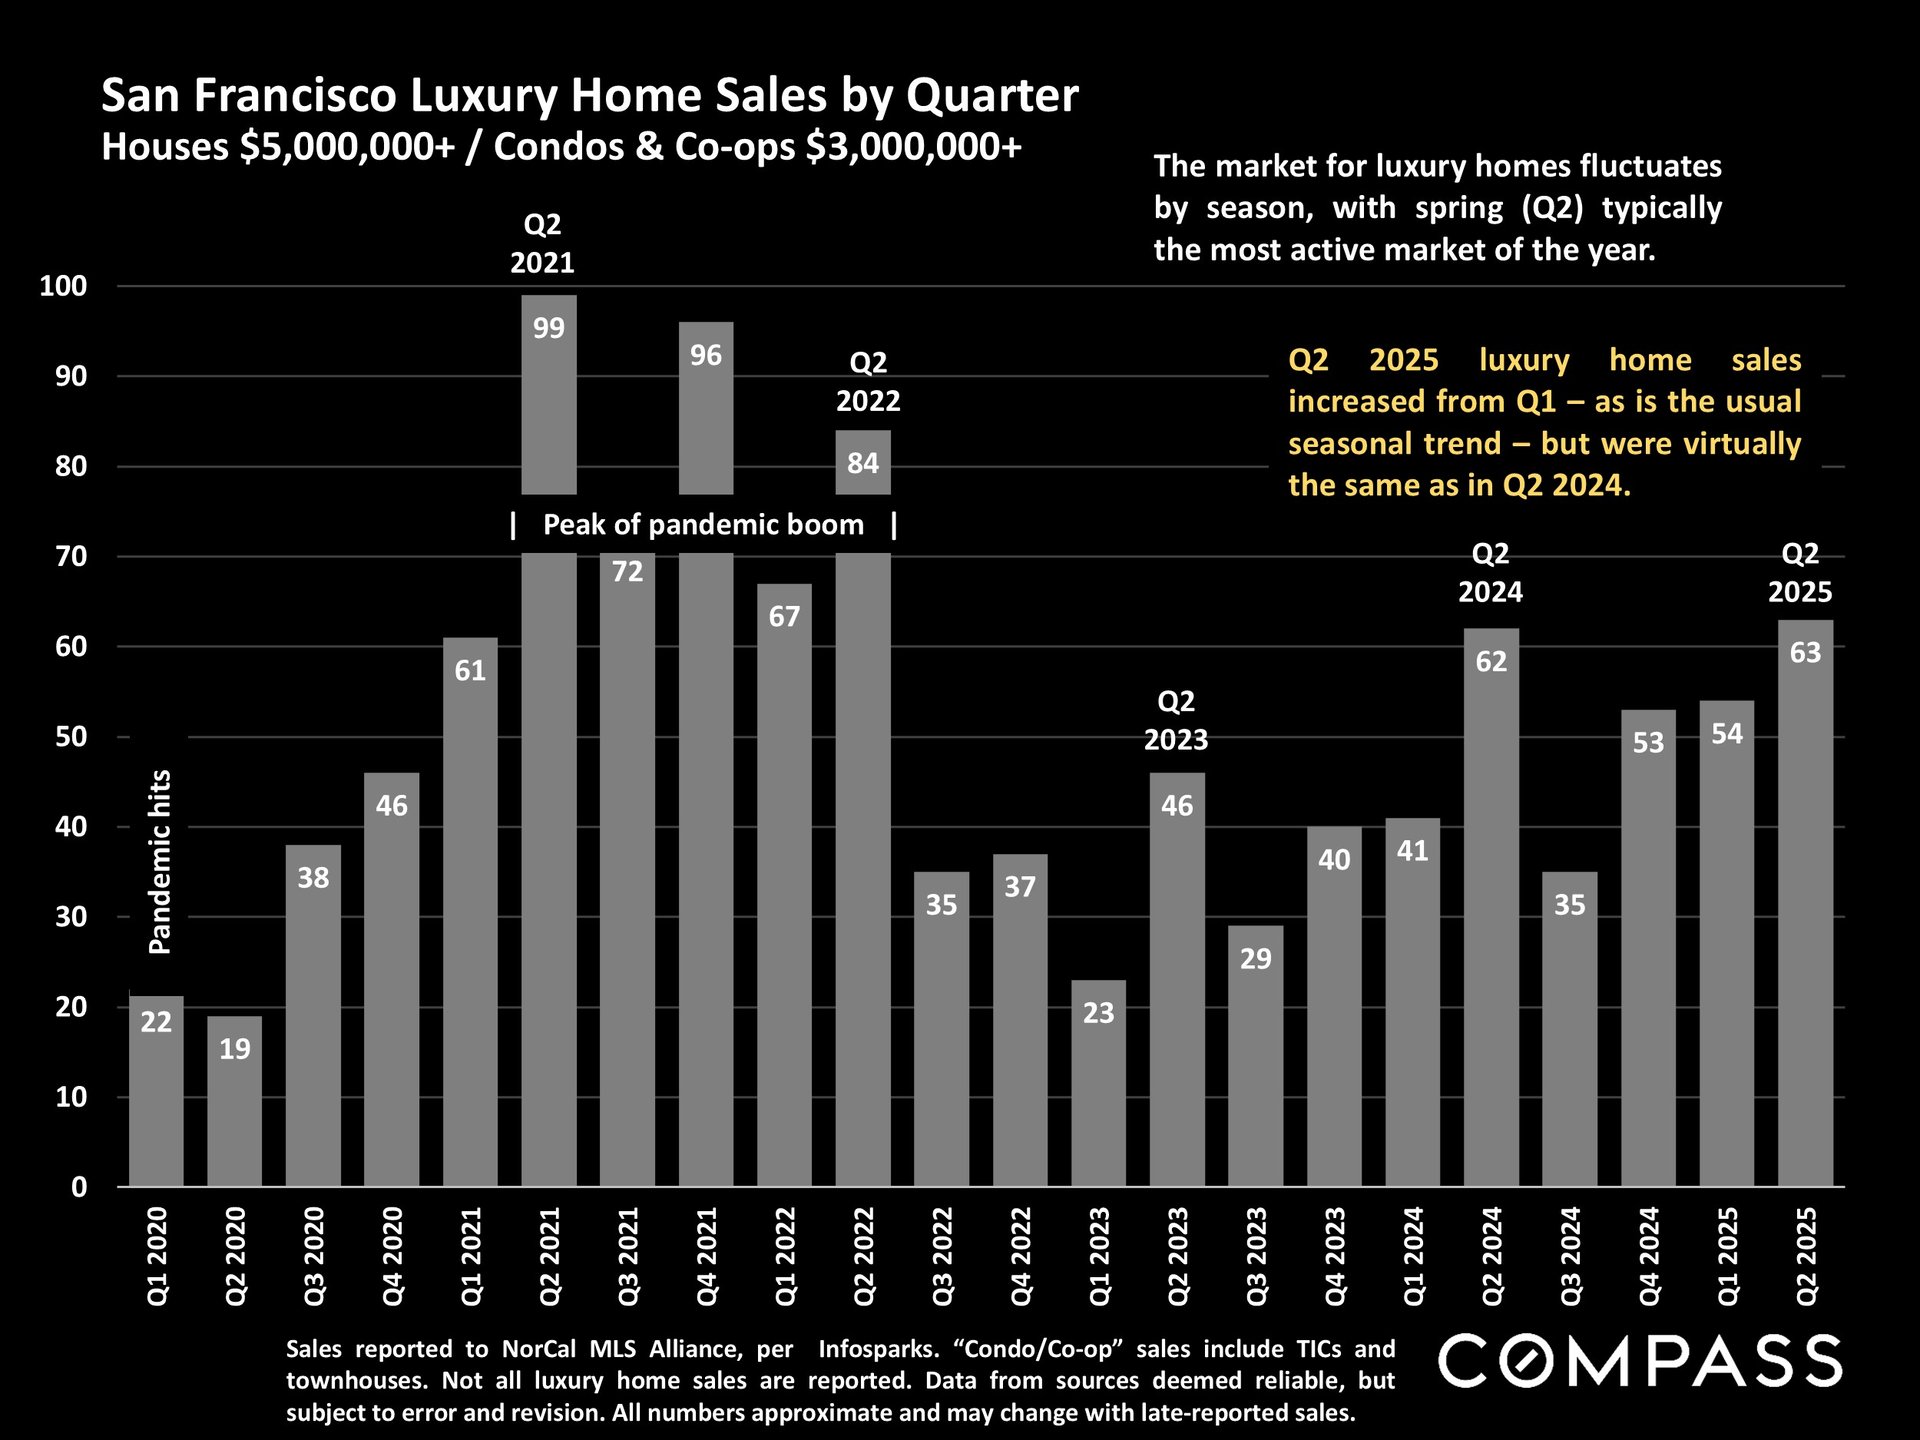
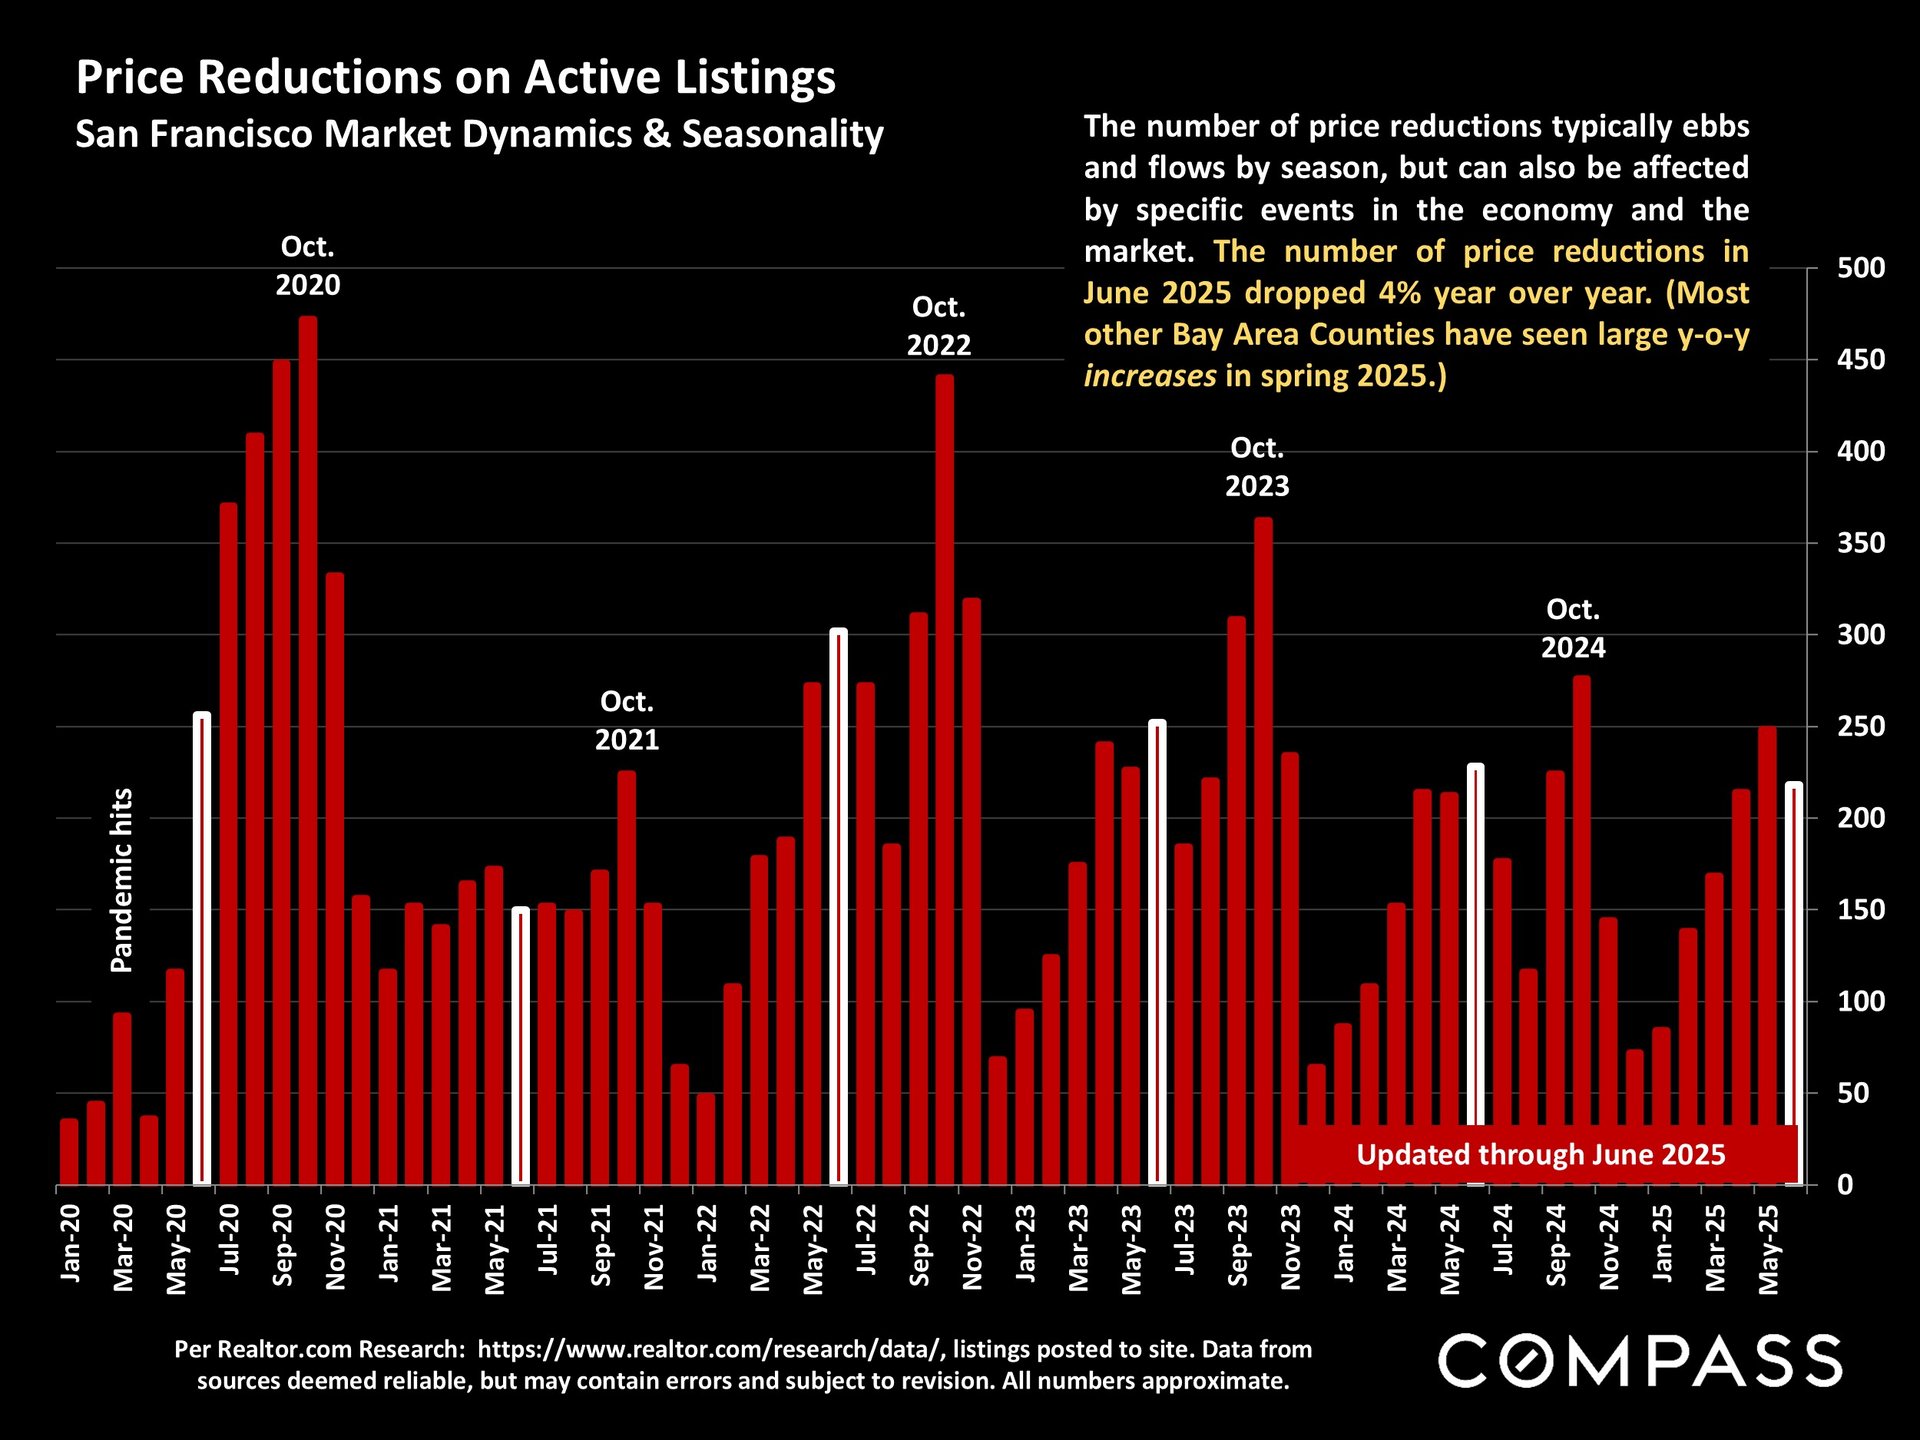
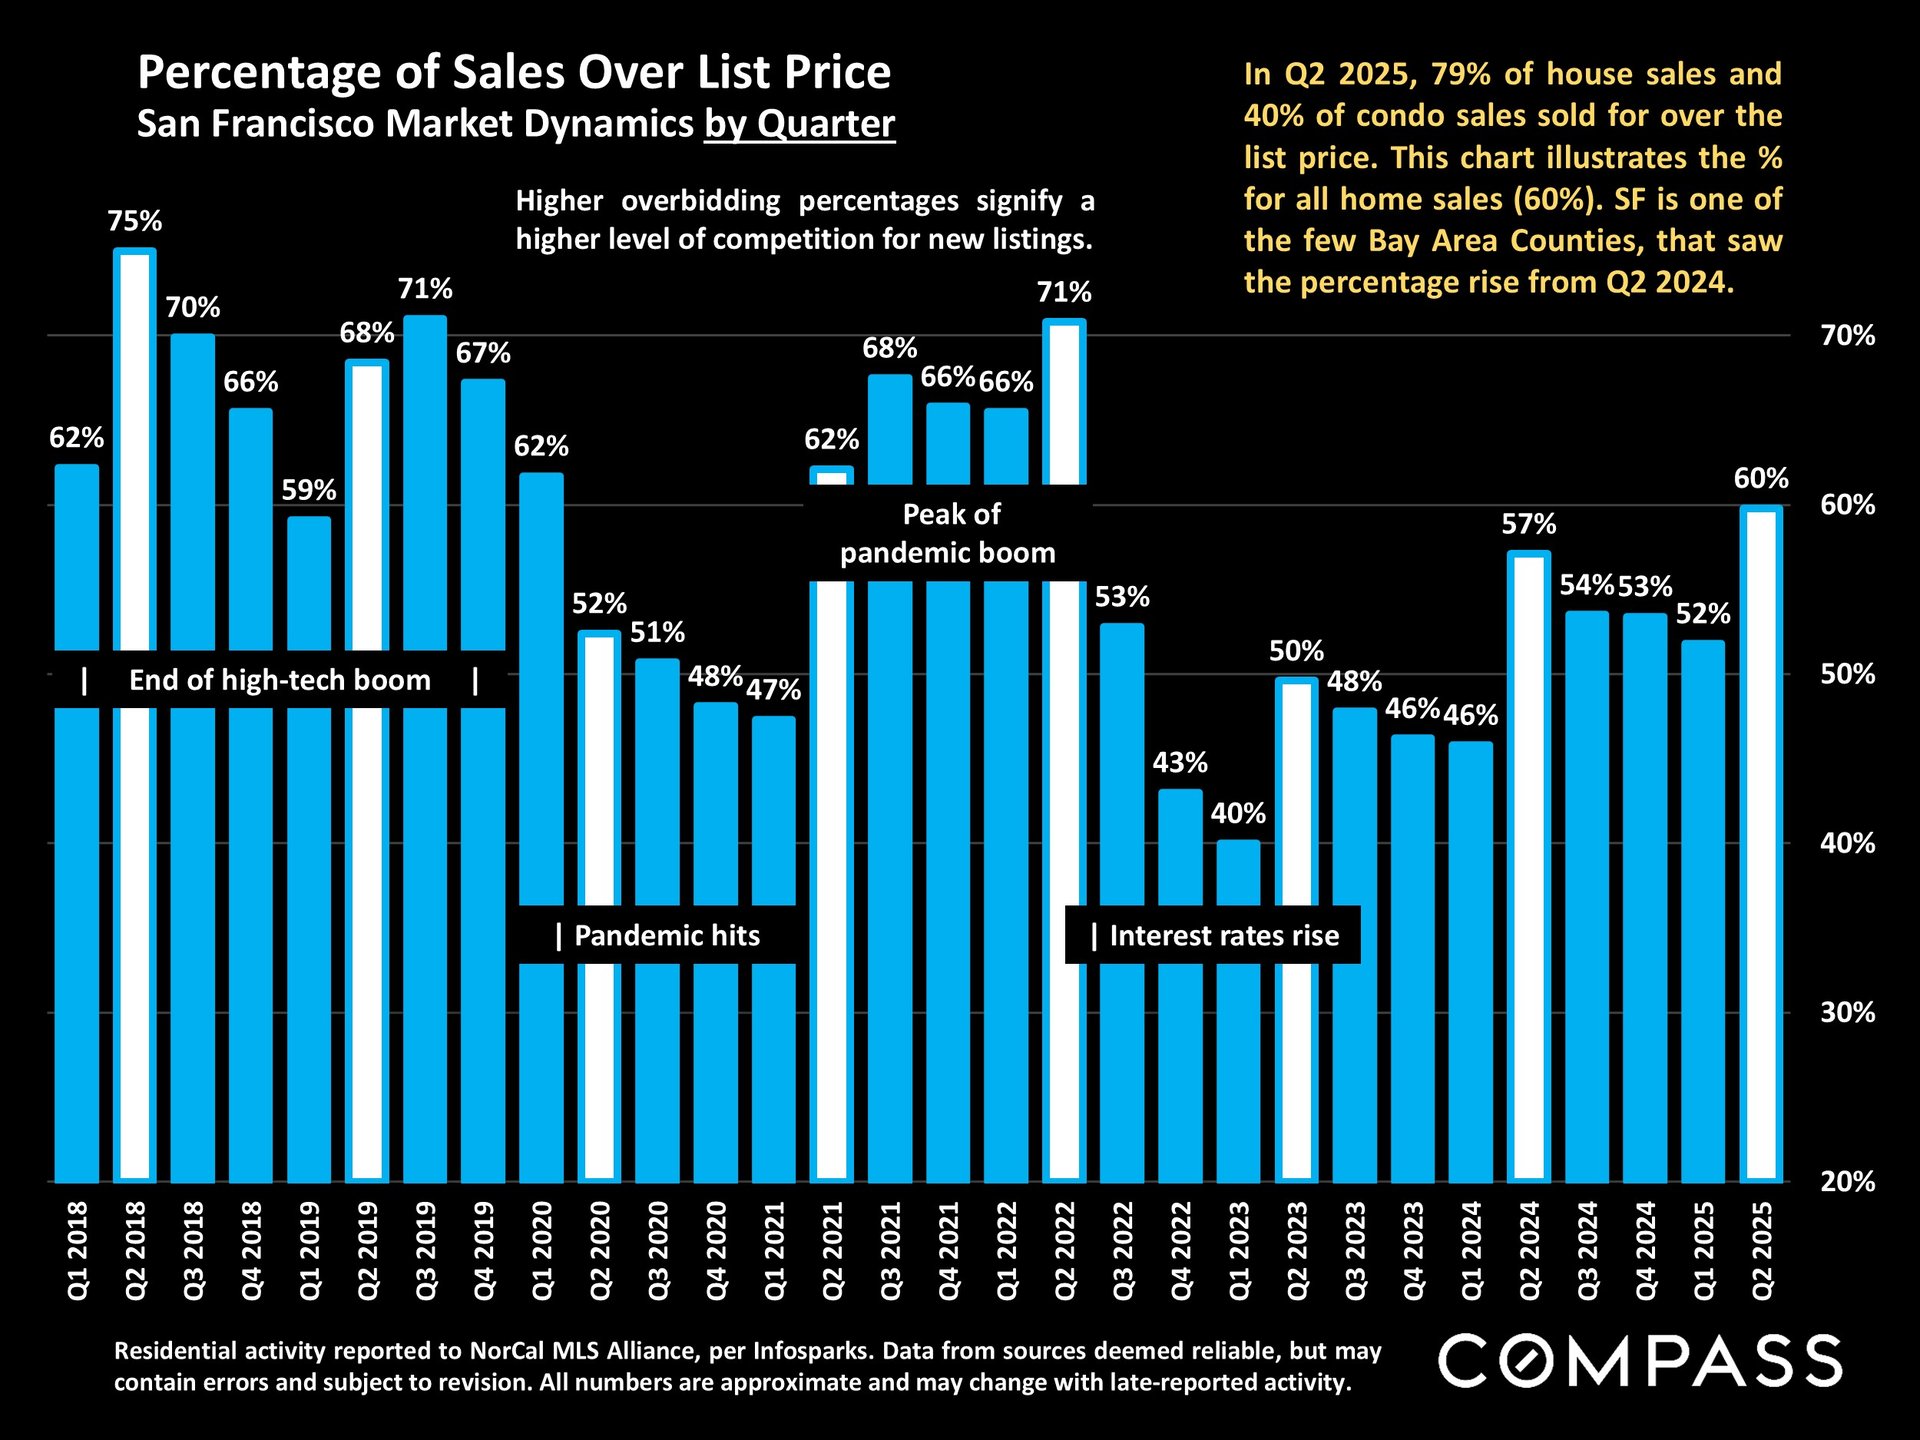
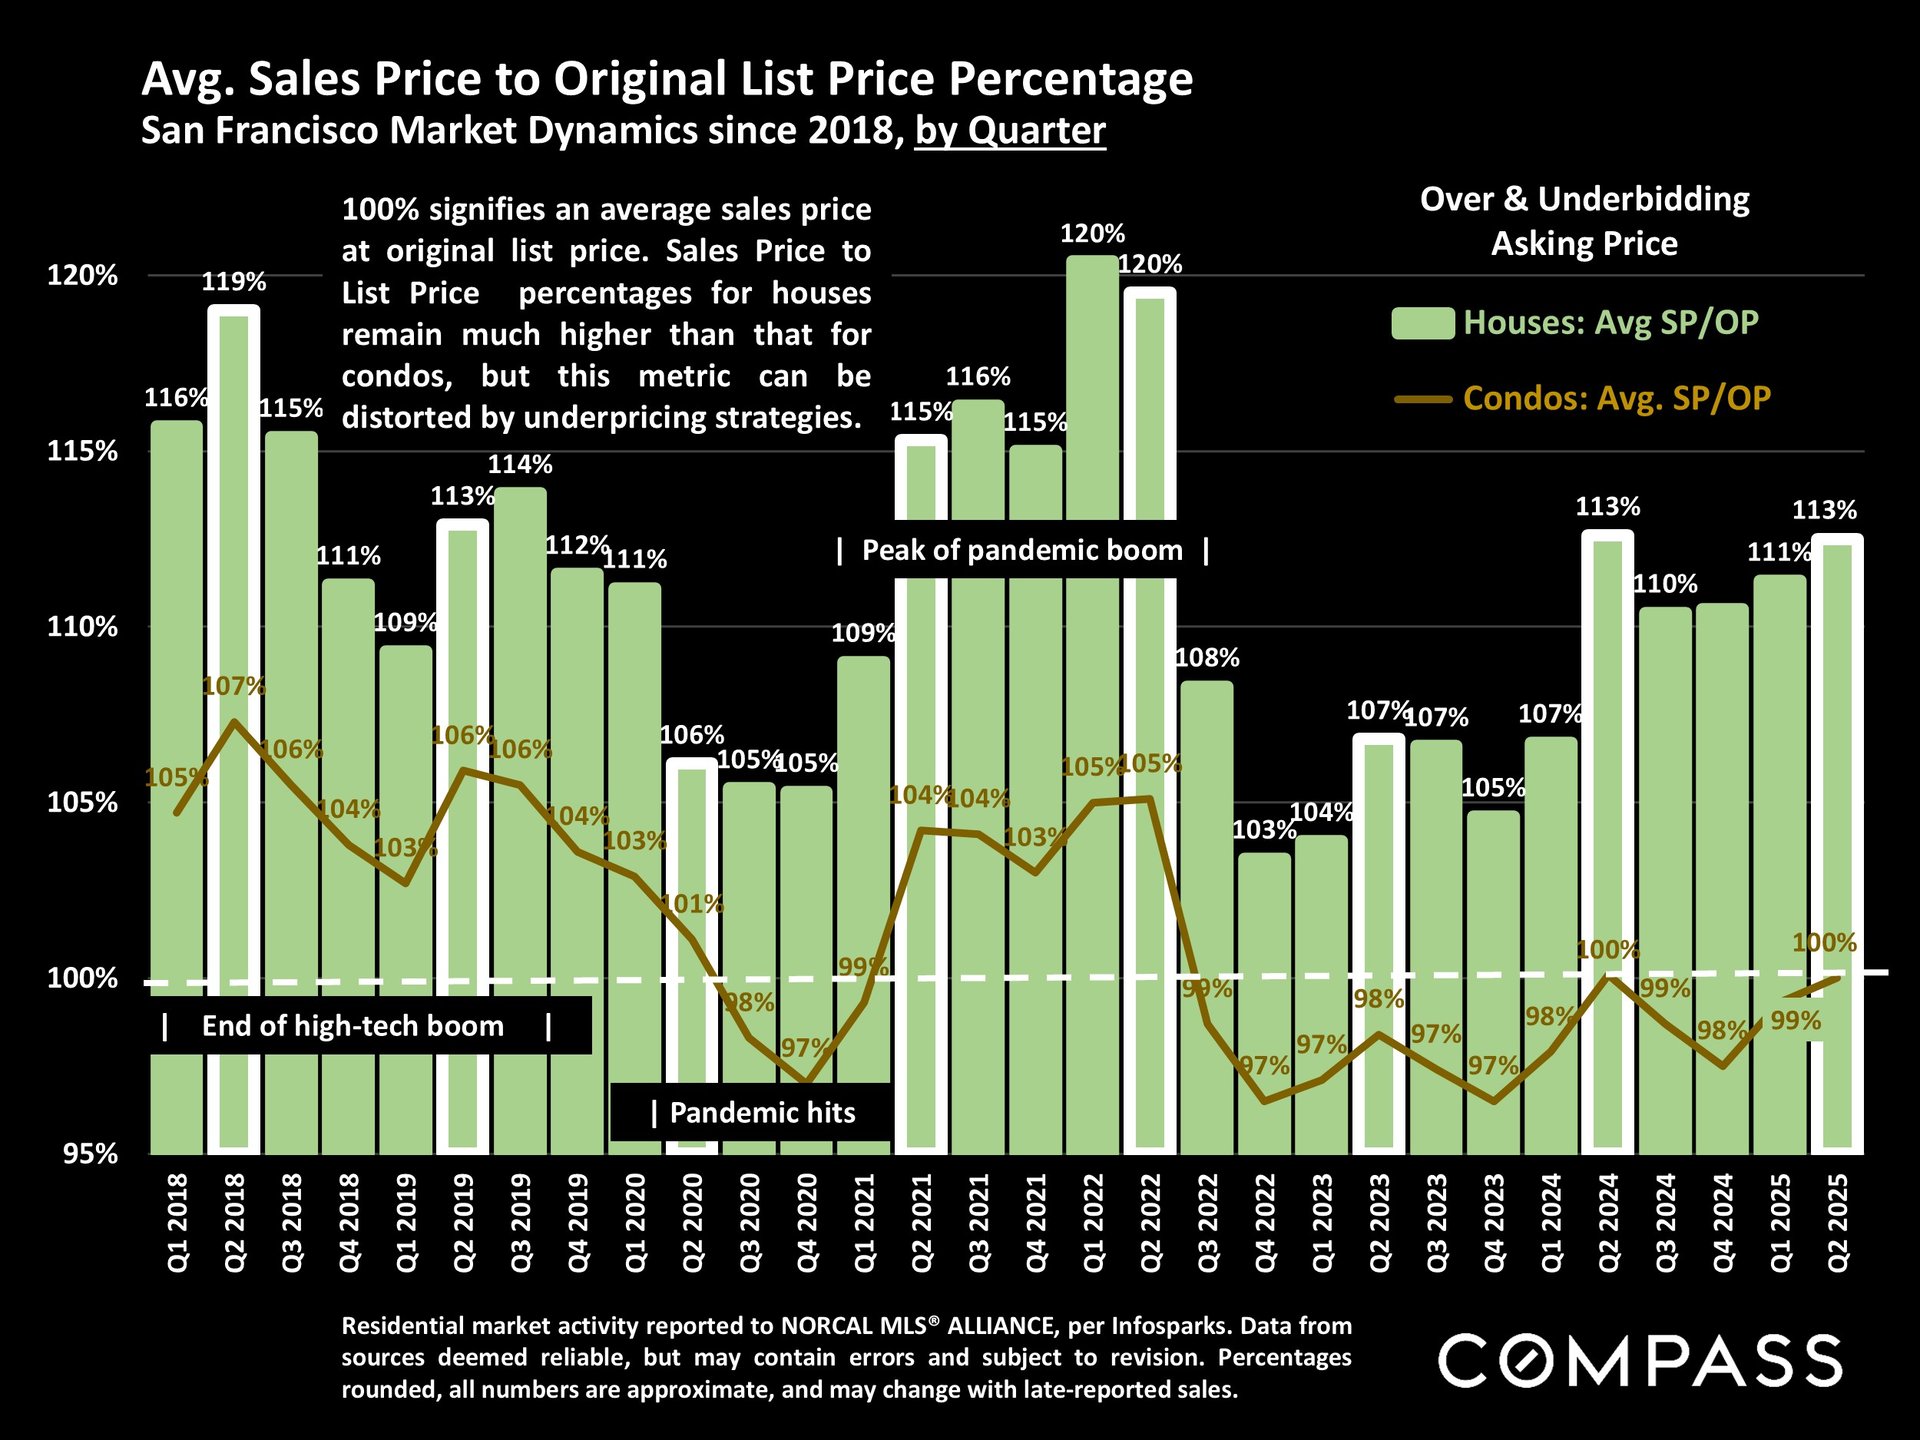
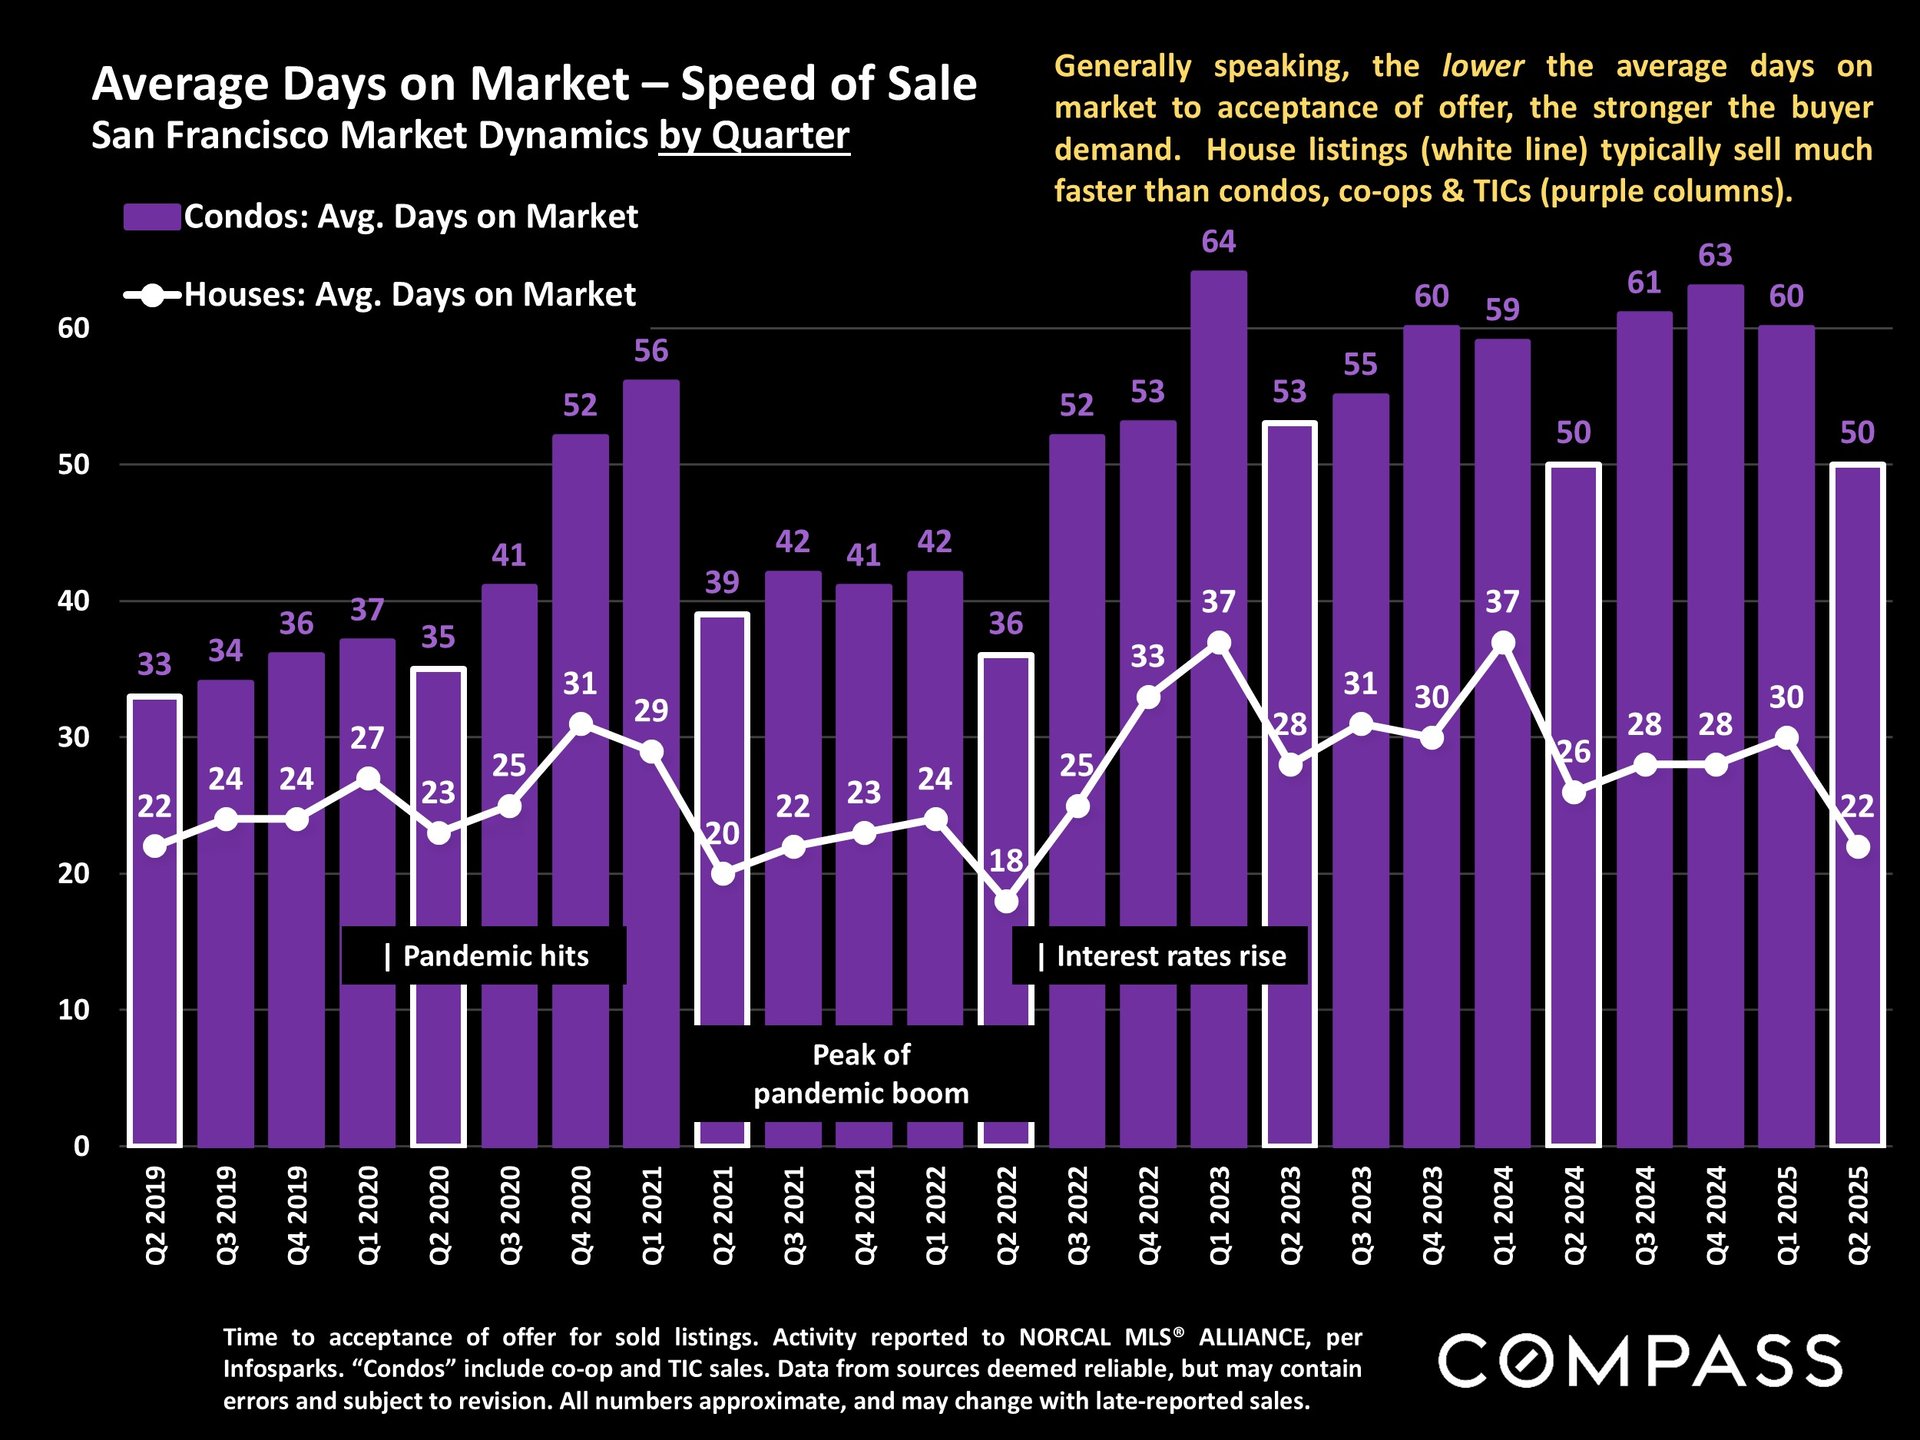
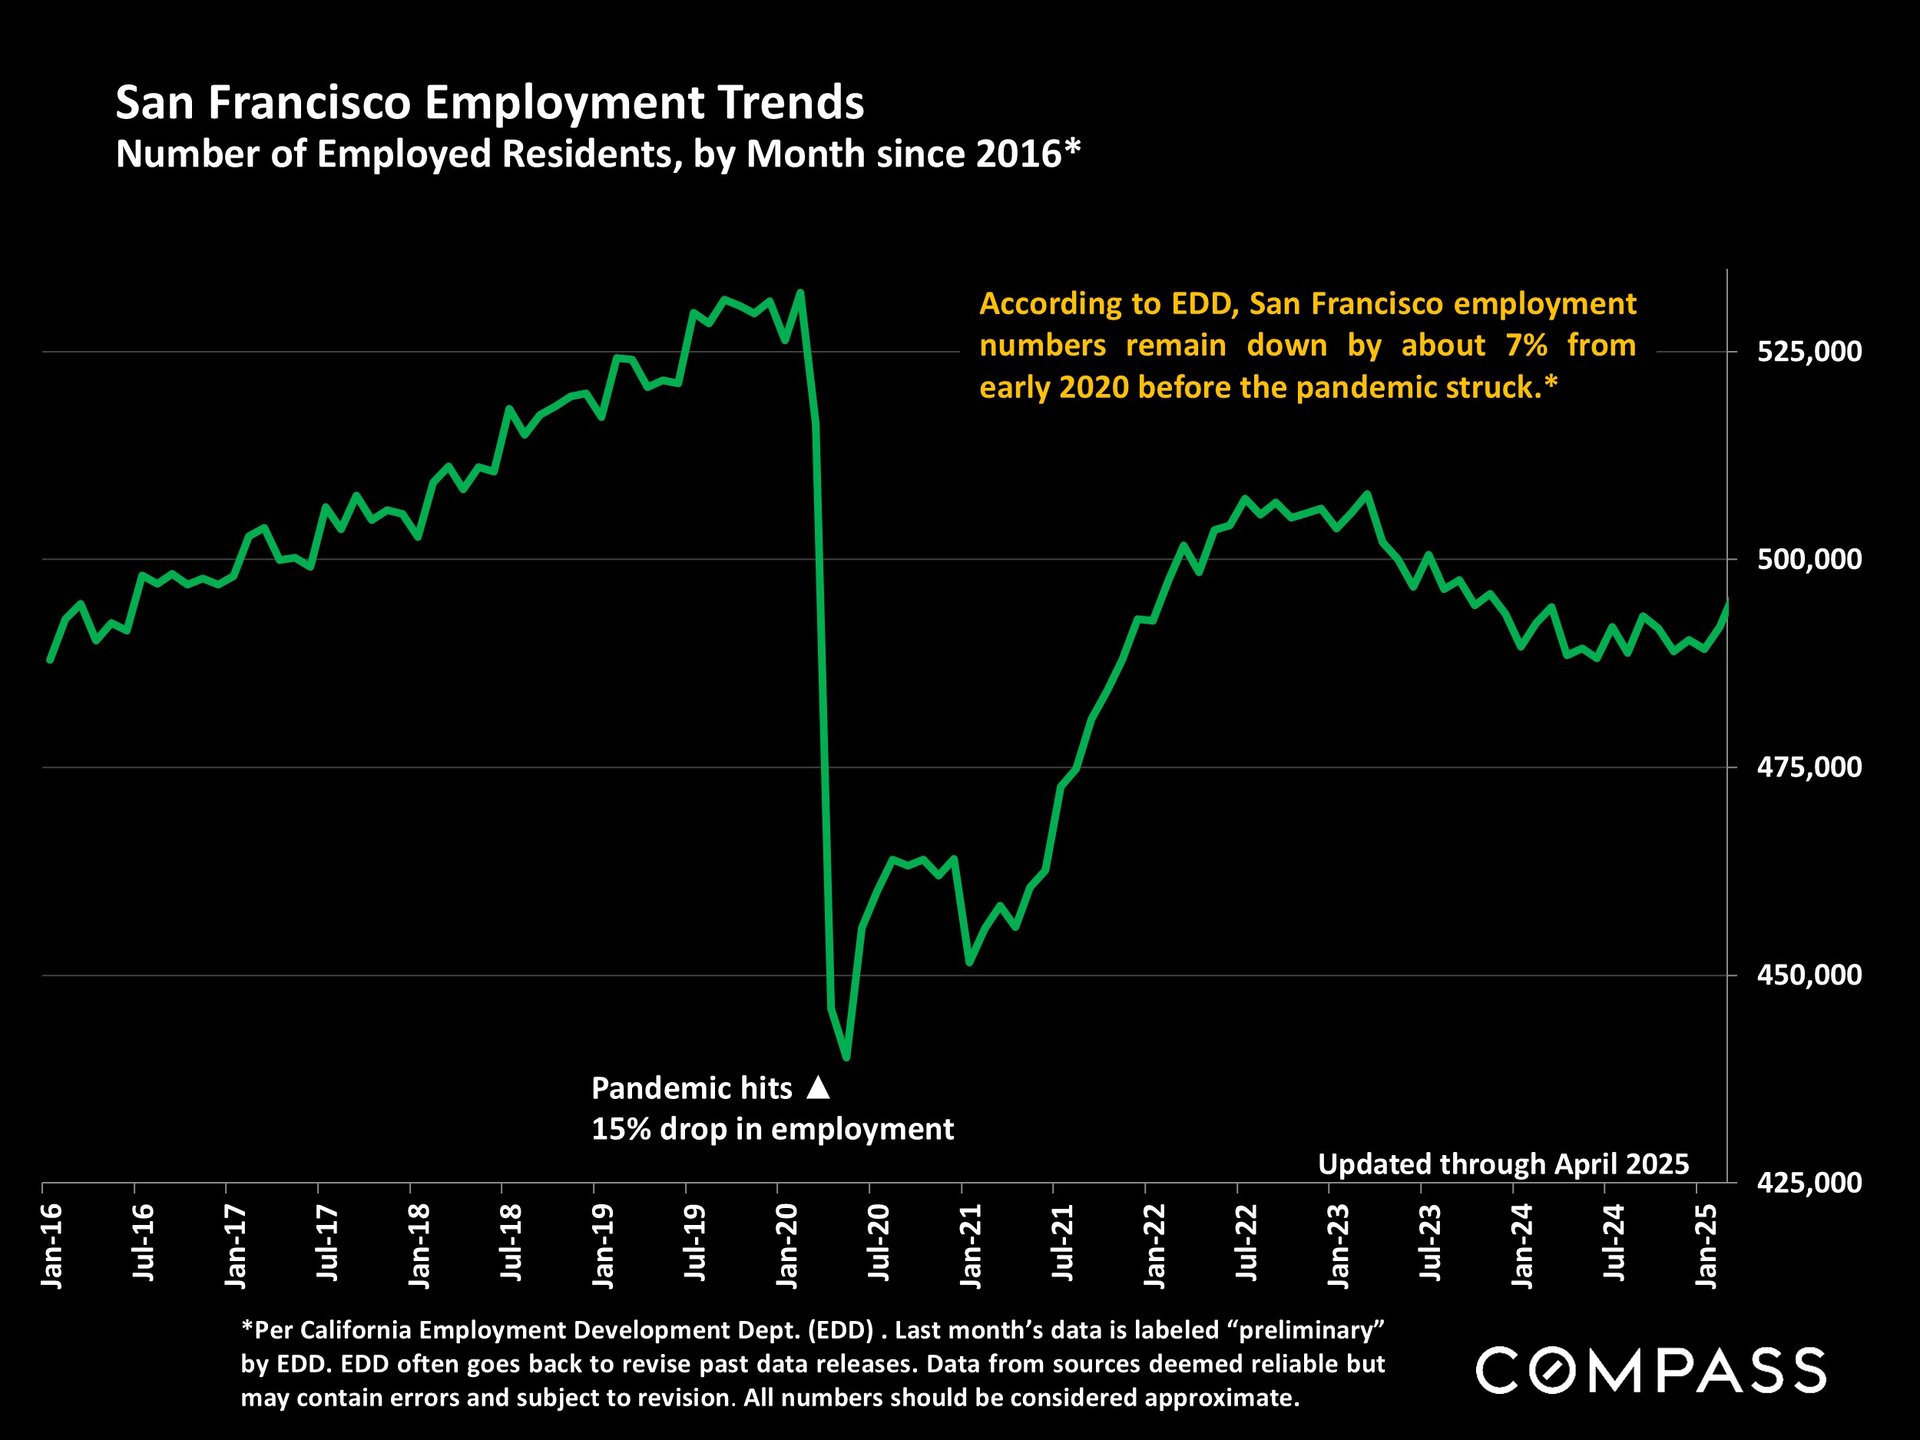
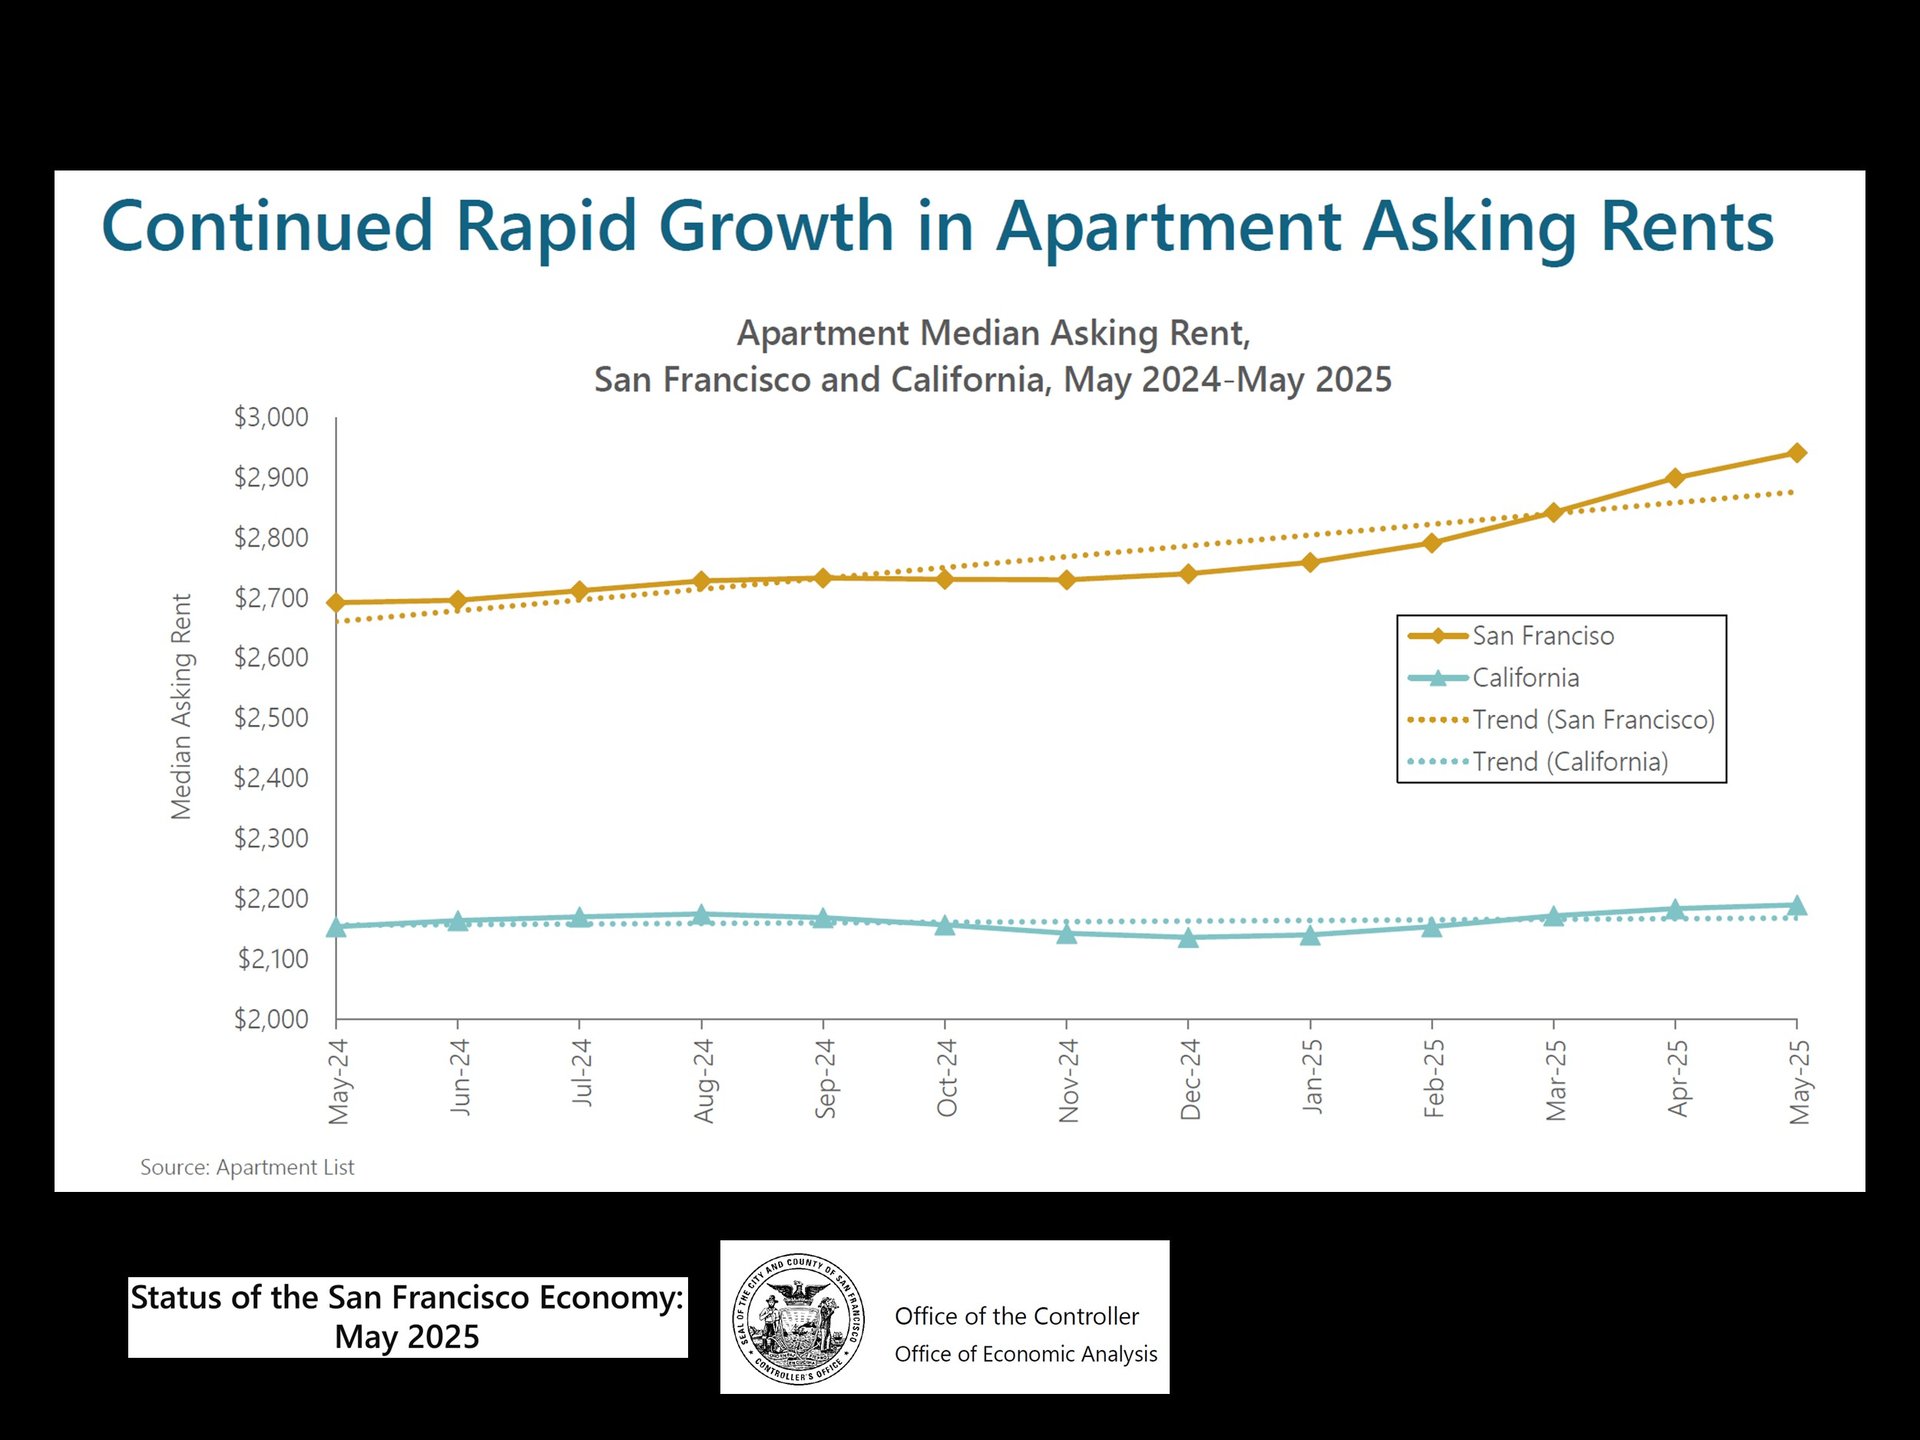
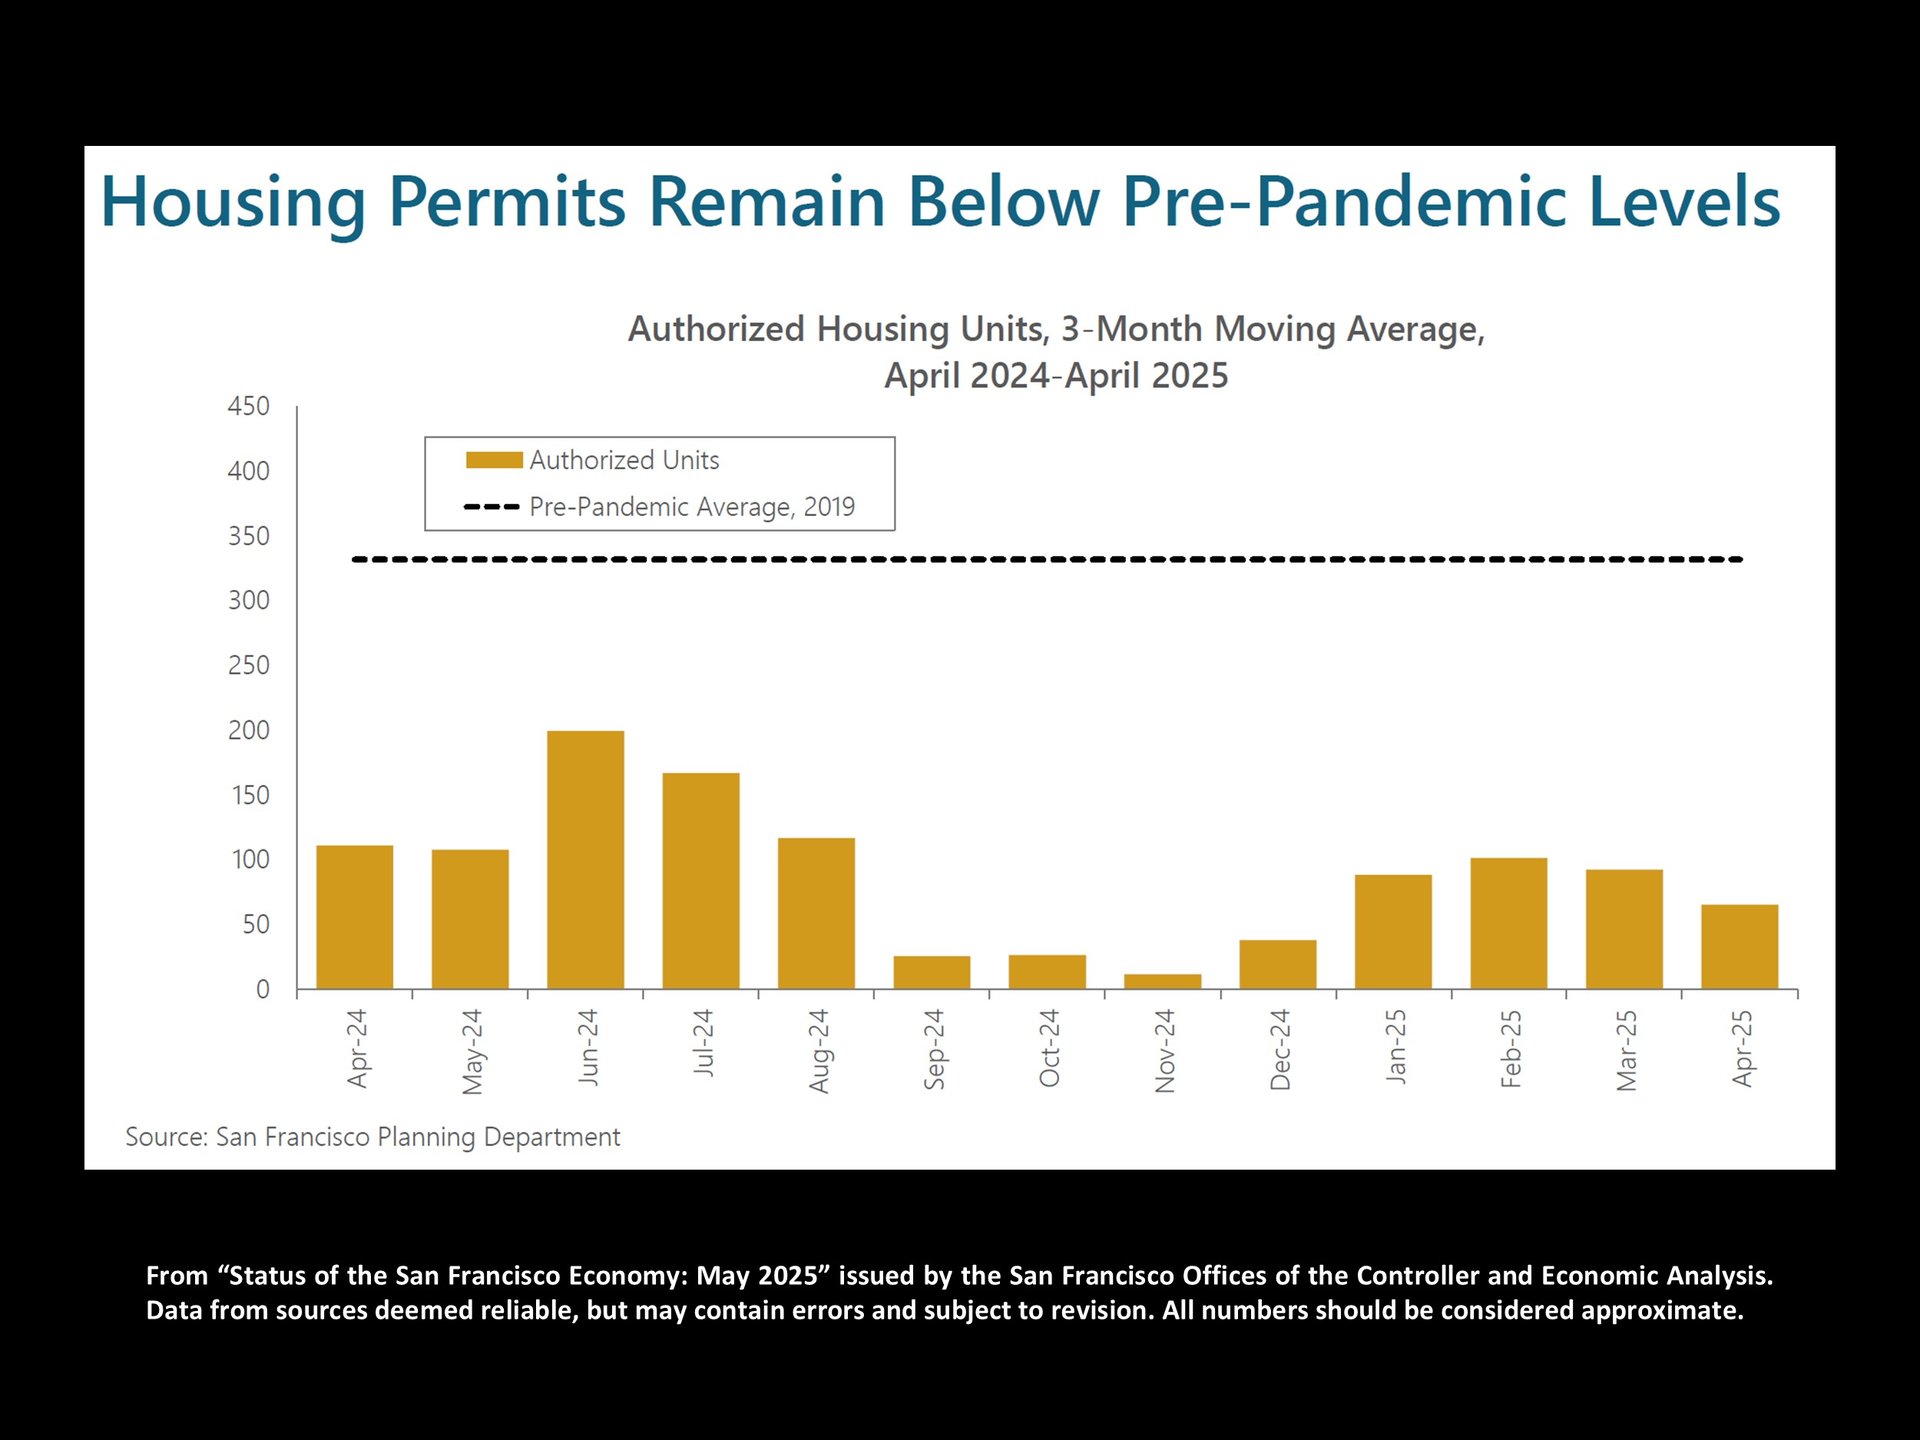
San Francisco real estate July 2025 report summary on market conditions and strategies for buyers and sellers.Economic policy uncertainty chart from 2000 to June 2025, with a sharp spike in April 2025.Chart of weekly 30-year mortgage rates from 2023 to June 2025, with the July 3, 2025 rate noted as 6.67%.Infographic comparing S&P 500 and Nasdaq trends, highlighting their July 2025 highs and housing-market effects.San Francisco quarterly median house prices chart, with cyan bars, a Q2 2022 peak, and Q2 2025 figures.Bar chart comparing first-half median house sale prices by San Francisco Realtor district from 2020 to 2025.Bar chart of San Francisco condo prices by quarter, 2012–2025, with a Q2 2025 year-over-year increase of 10%.Bar chart comparing first-half two-bedroom condo median sale prices across five San Francisco districts from 2020 to 2025.Chart comparing San Francisco two-bedroom condo prices downtown and elsewhere from 2005 through June 2025.San Francisco monthly new-listings chart, January 2021–June 2025, highlighting seasonal peaks and mid-summer declines.San Francisco monthly active and coming-soon listing chart, with green bars through July 2025.Chart of San Francisco listings going into contract, August 2021–June 2025, with seasonal trends and June 2025 figures.Chart of monthly San Francisco home sales from January 2021 to June 2025, with June 2025 market notes.Chart of San Francisco home sales from 2005 to June 2025, with labeled market booms and downturns.Bar chart of San Francisco luxury home sales by quarter, showing 63 sales in Q2 2025, nearly unchanged from Q2 2024.Bar chart of San Francisco listing price reductions from 2020 to June 2025, with October peaks highlighted.Chart of San Francisco home sales over list price by quarter, from 2018 to Q2 2025.San Francisco quarterly house and condo sale-to-list price chart, Q1 2018–Q2 2025, with pandemic-era peaks marked.Chart comparing San Francisco house and condo average days on market by quarter, from 2019 to 2025.Chart of San Francisco employment from 2016 to 2025, showing the pandemic drop and a recovery to below pre-pandemic levels.Chart shows San Francisco apartment rents climbing to about $2,940 by May 2025, while California rents stay near $2,180.Chart shows San Francisco authorized housing units below the pre-pandemic average from April 2024 to April 2025.Real estate report notes on statistics and valuation, followed by image licensing and Compass legal disclaimers.

Work With Us

We will help you understand the complex aspects of the transaction and share our expertise so that you can make the best decisions possible. We are experienced, market savvy, and energetic. With both of us working for our clients, you get twice the amount of attention and insight.