
The SF Team, Eva + James, Compass

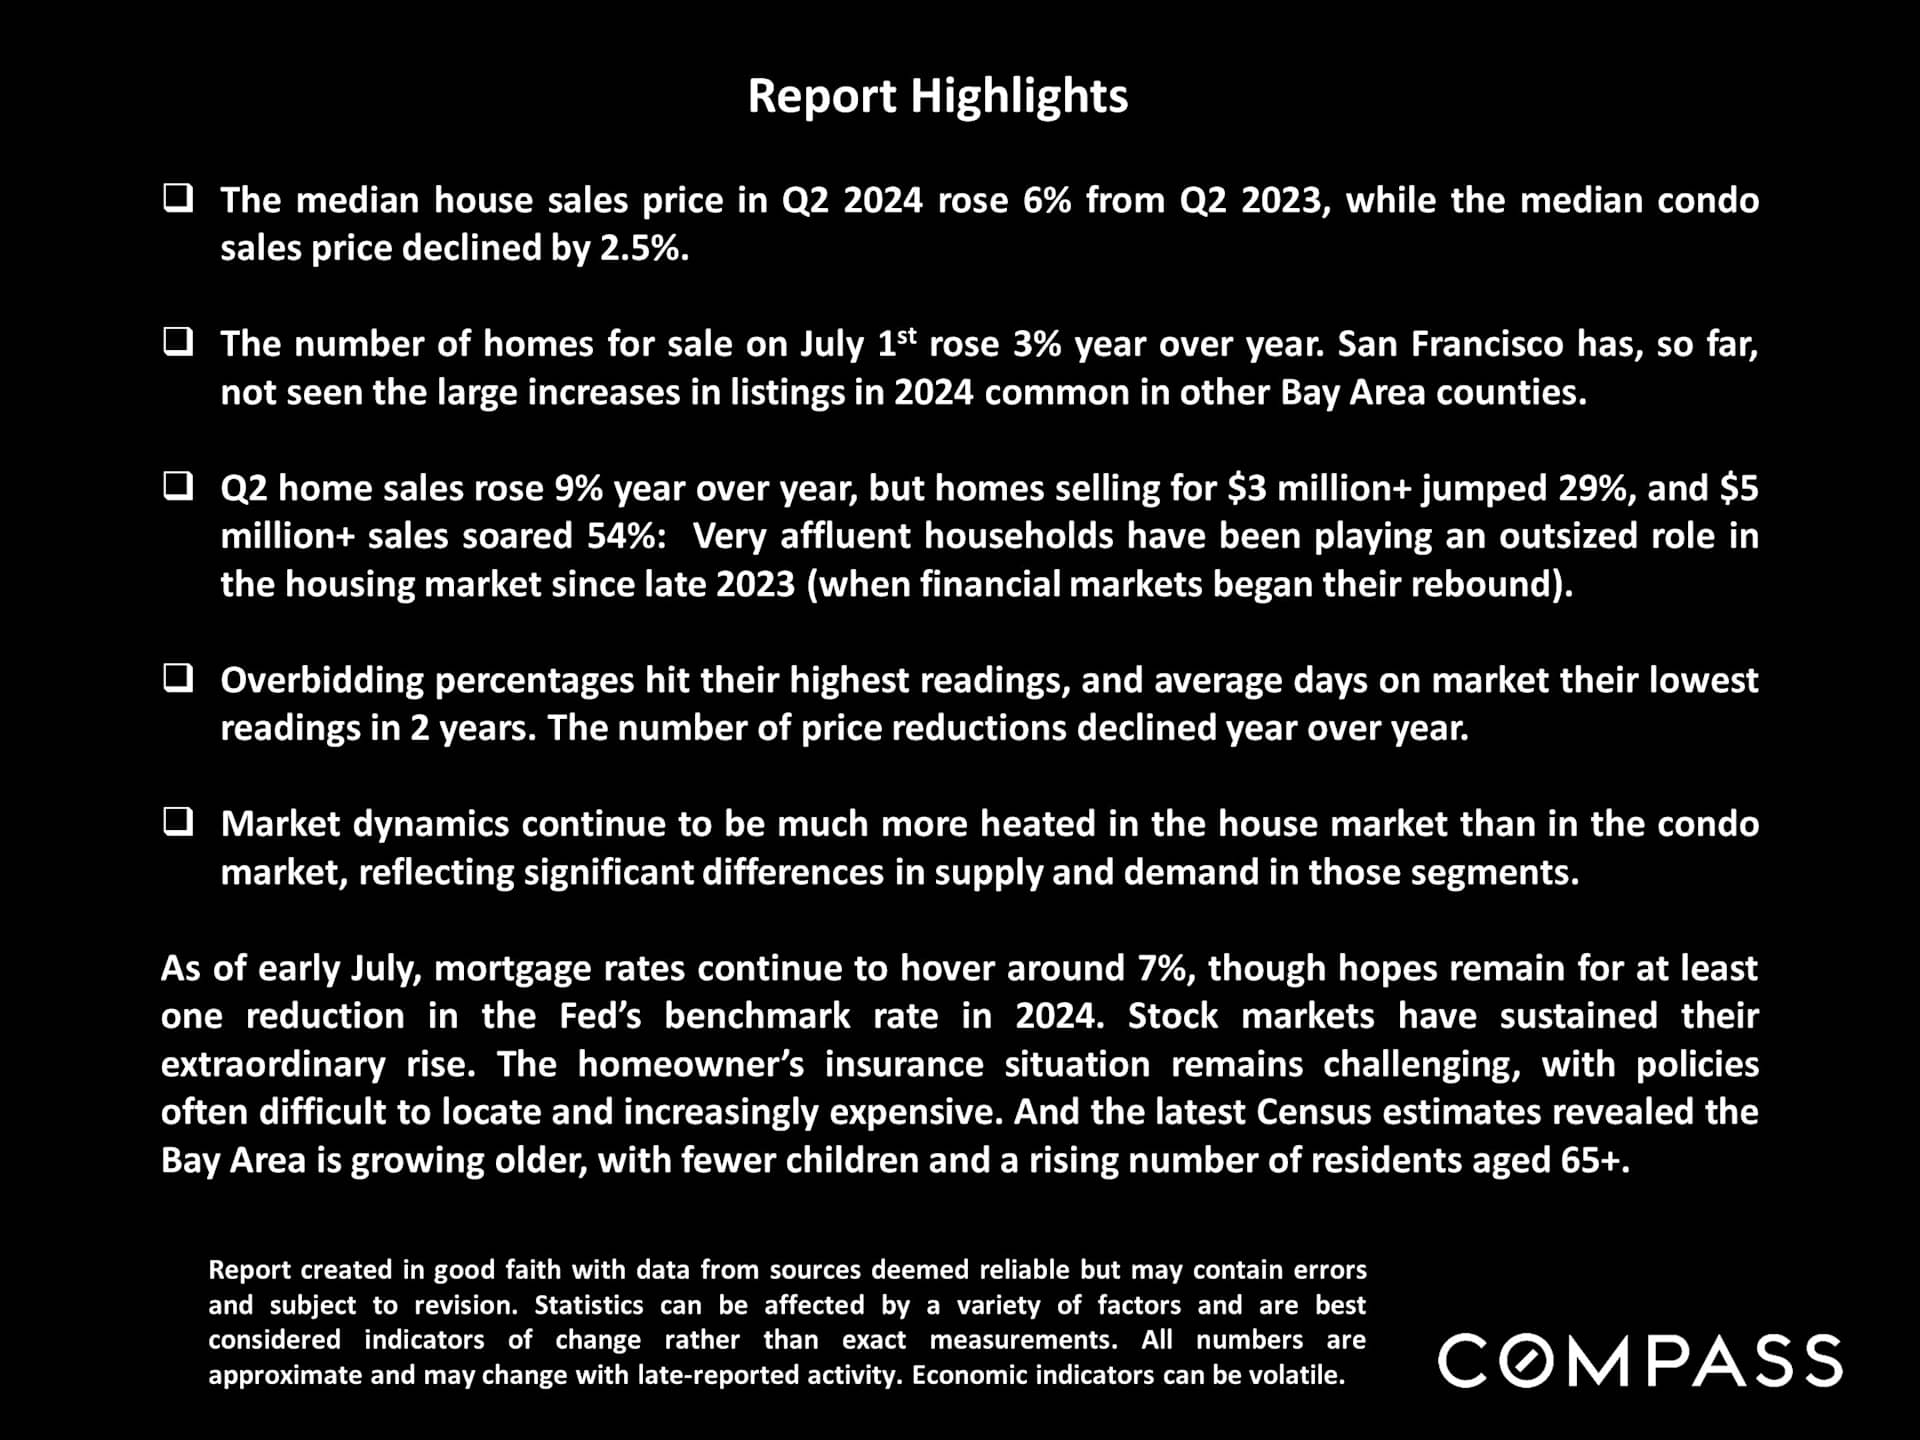
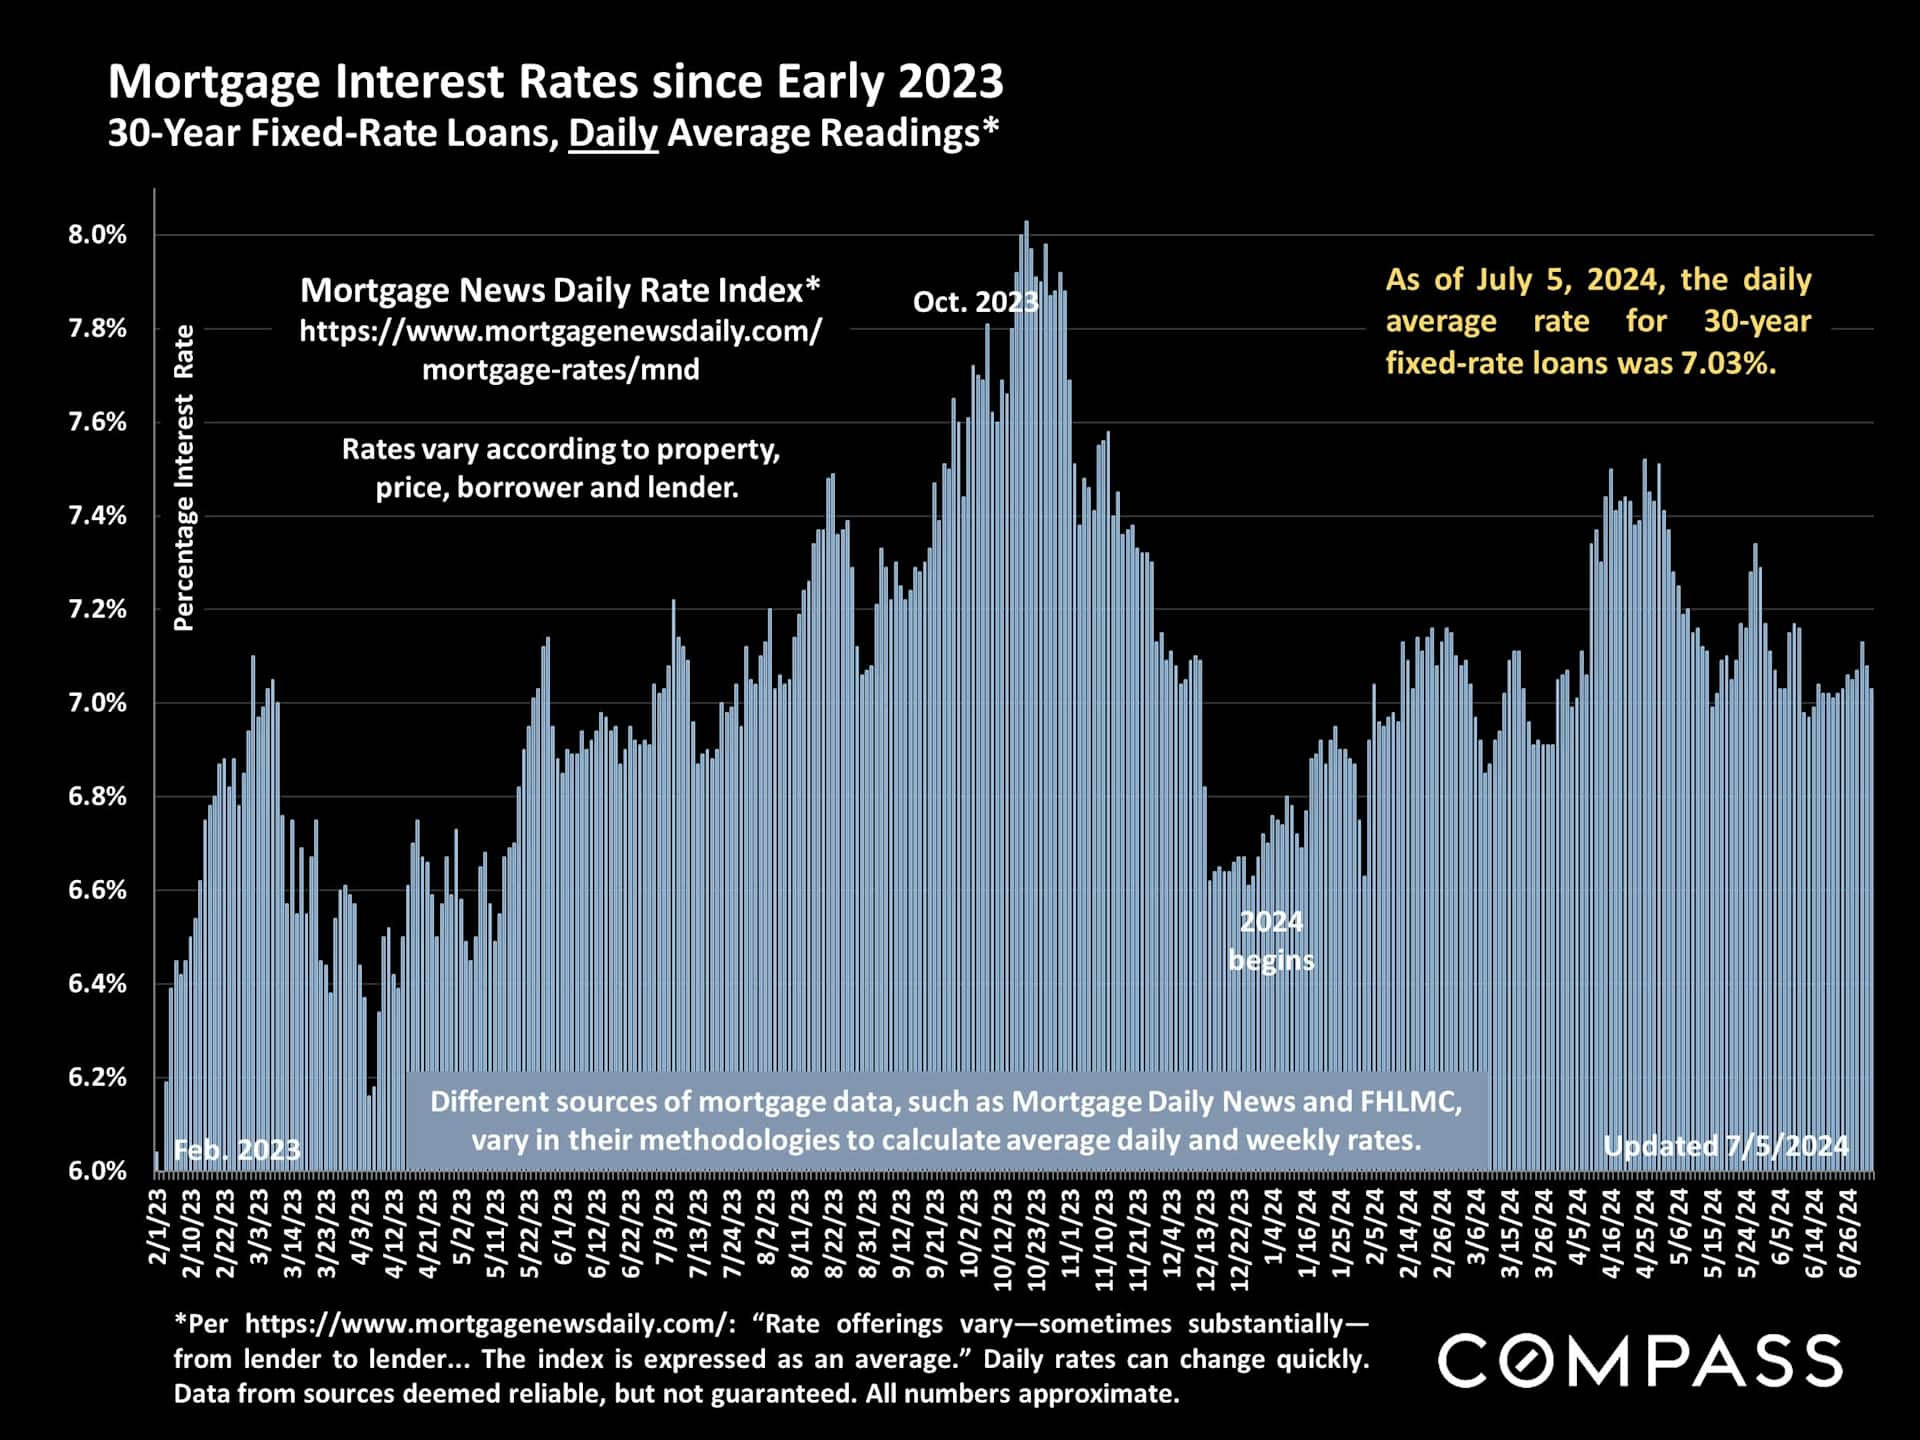
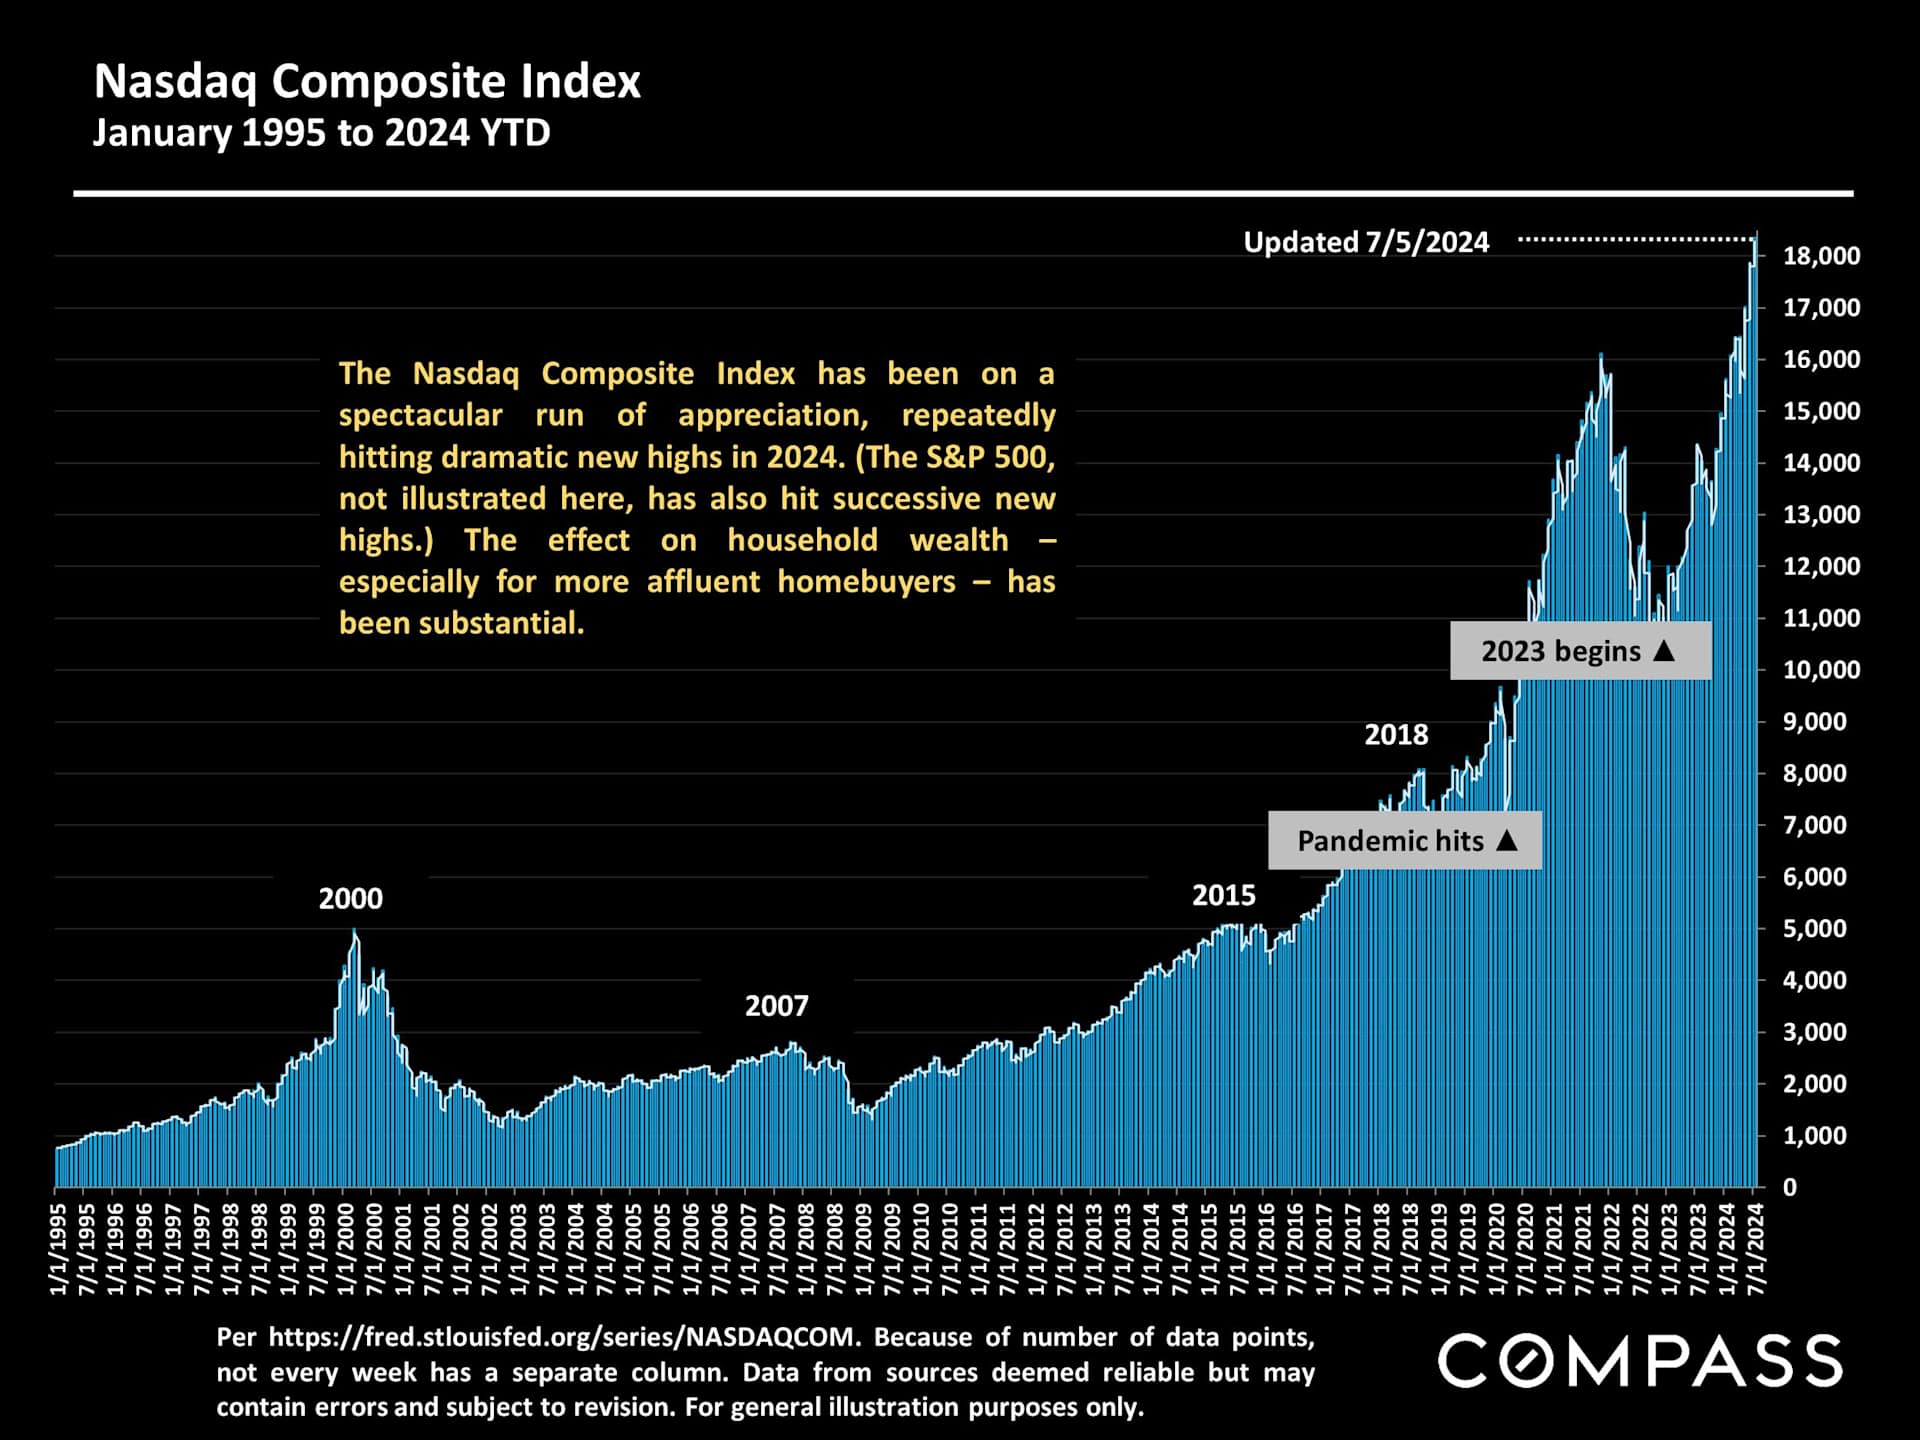
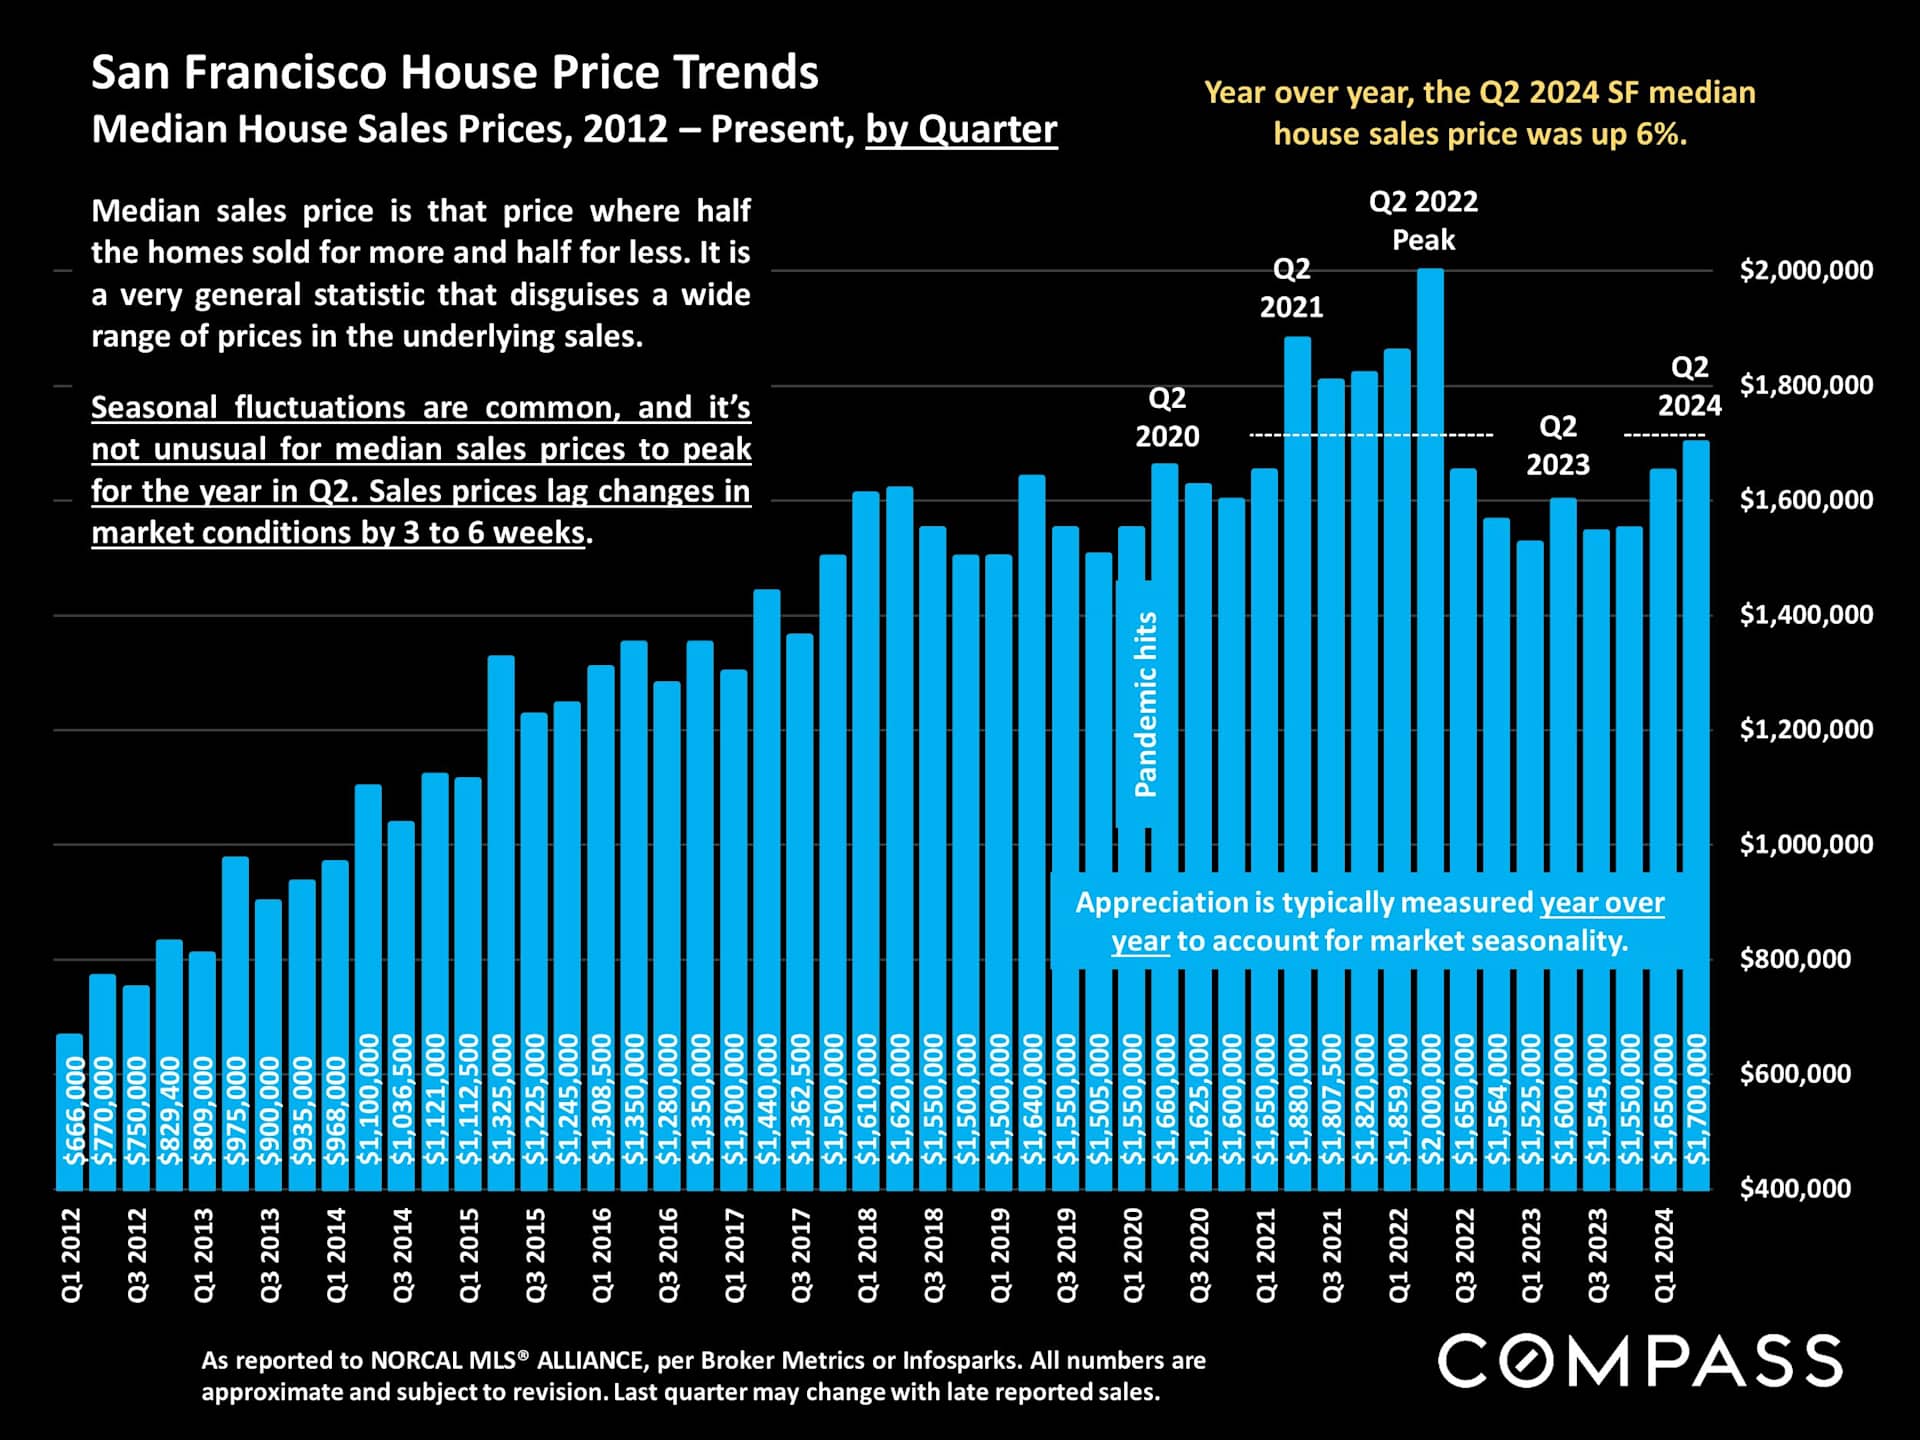
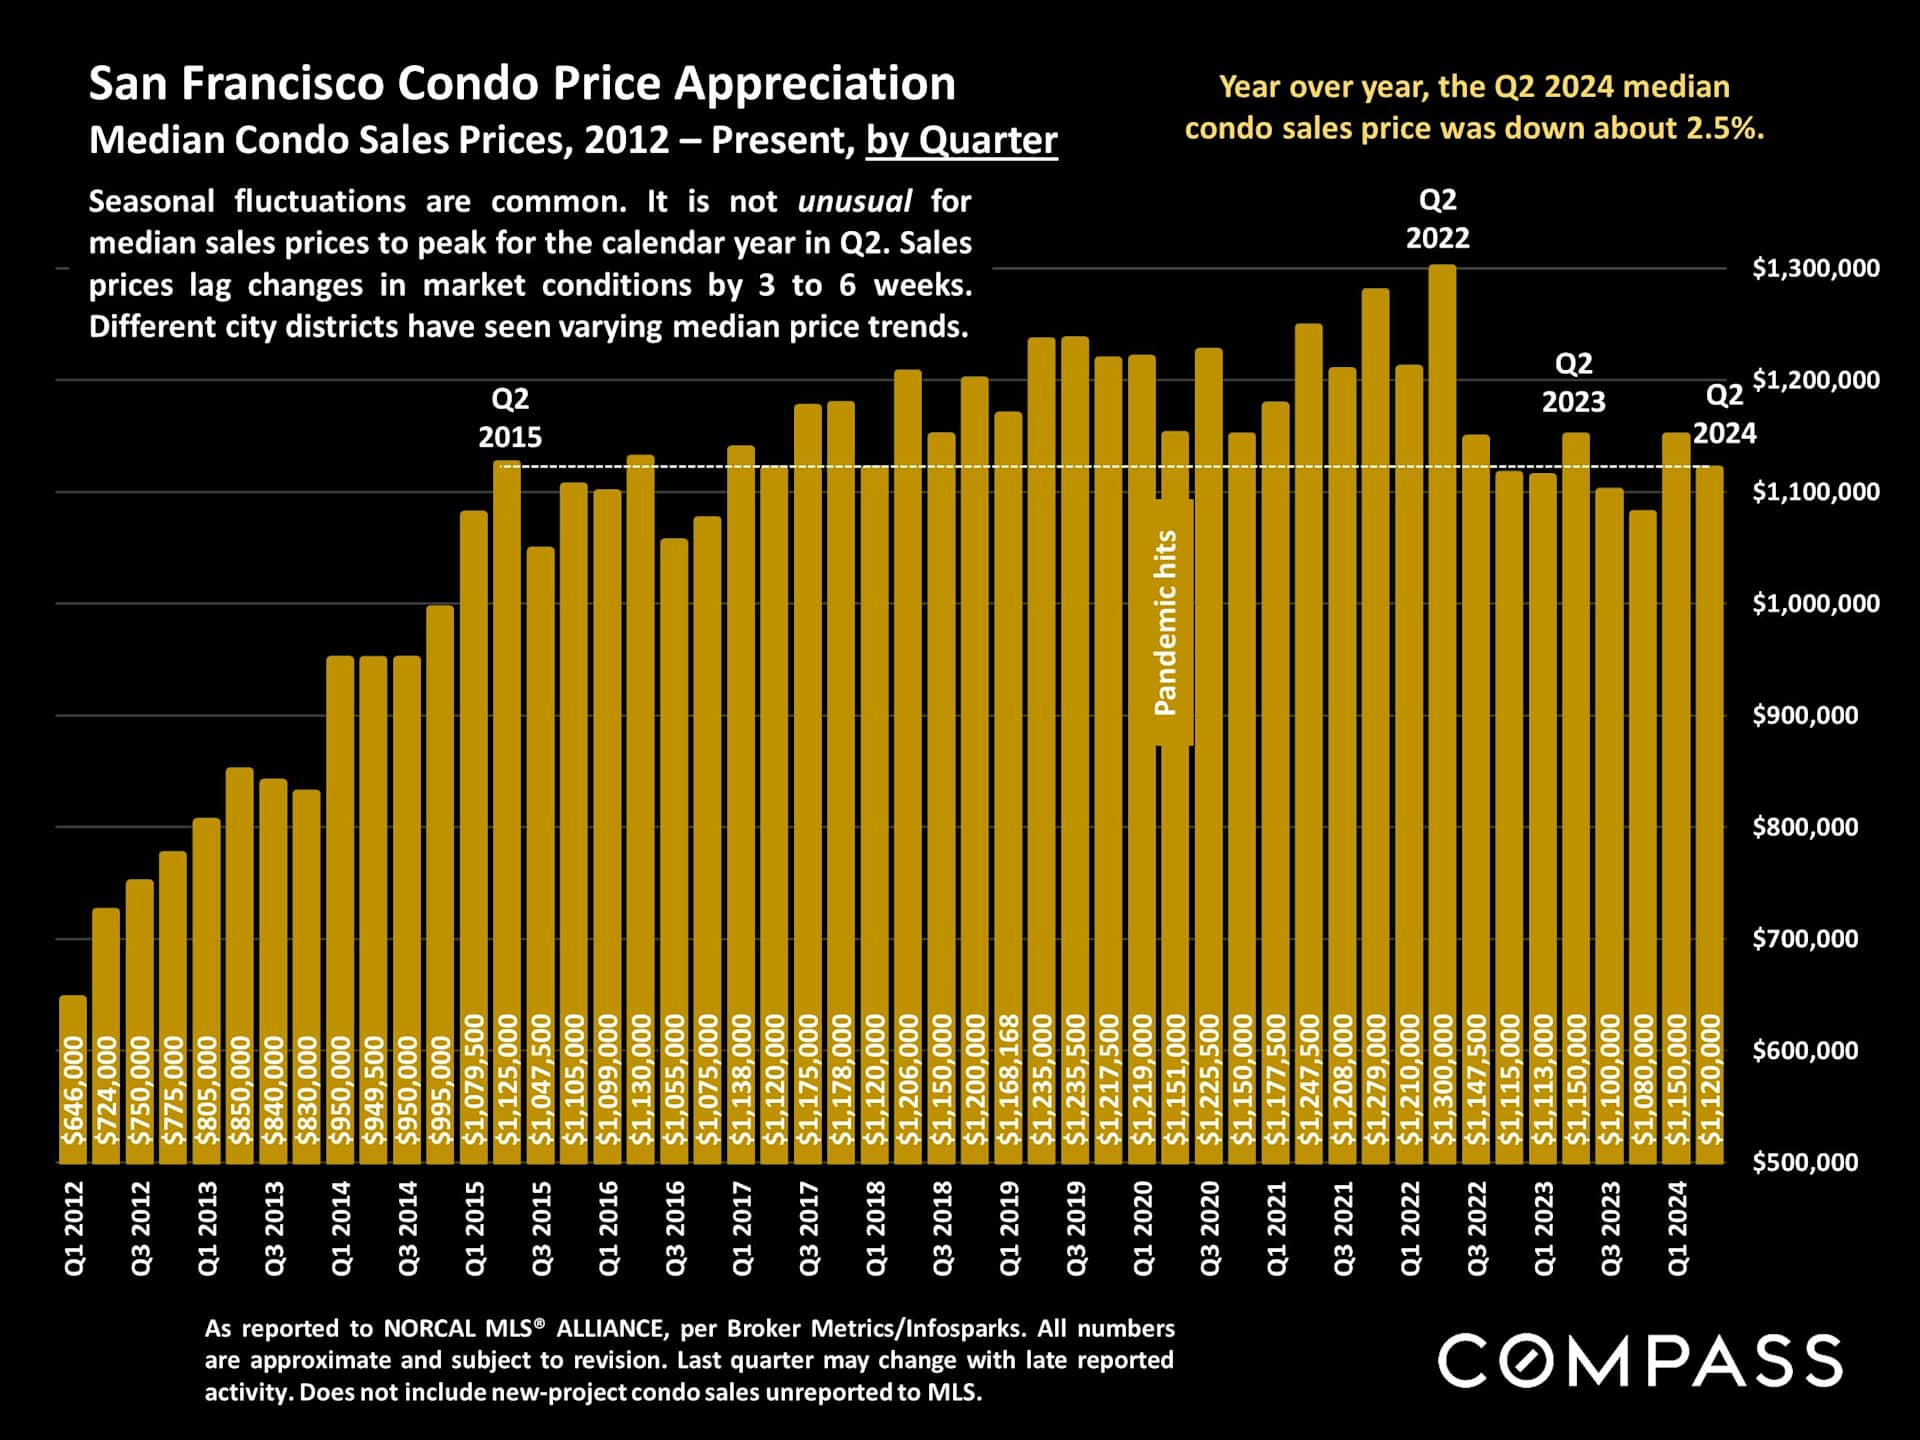
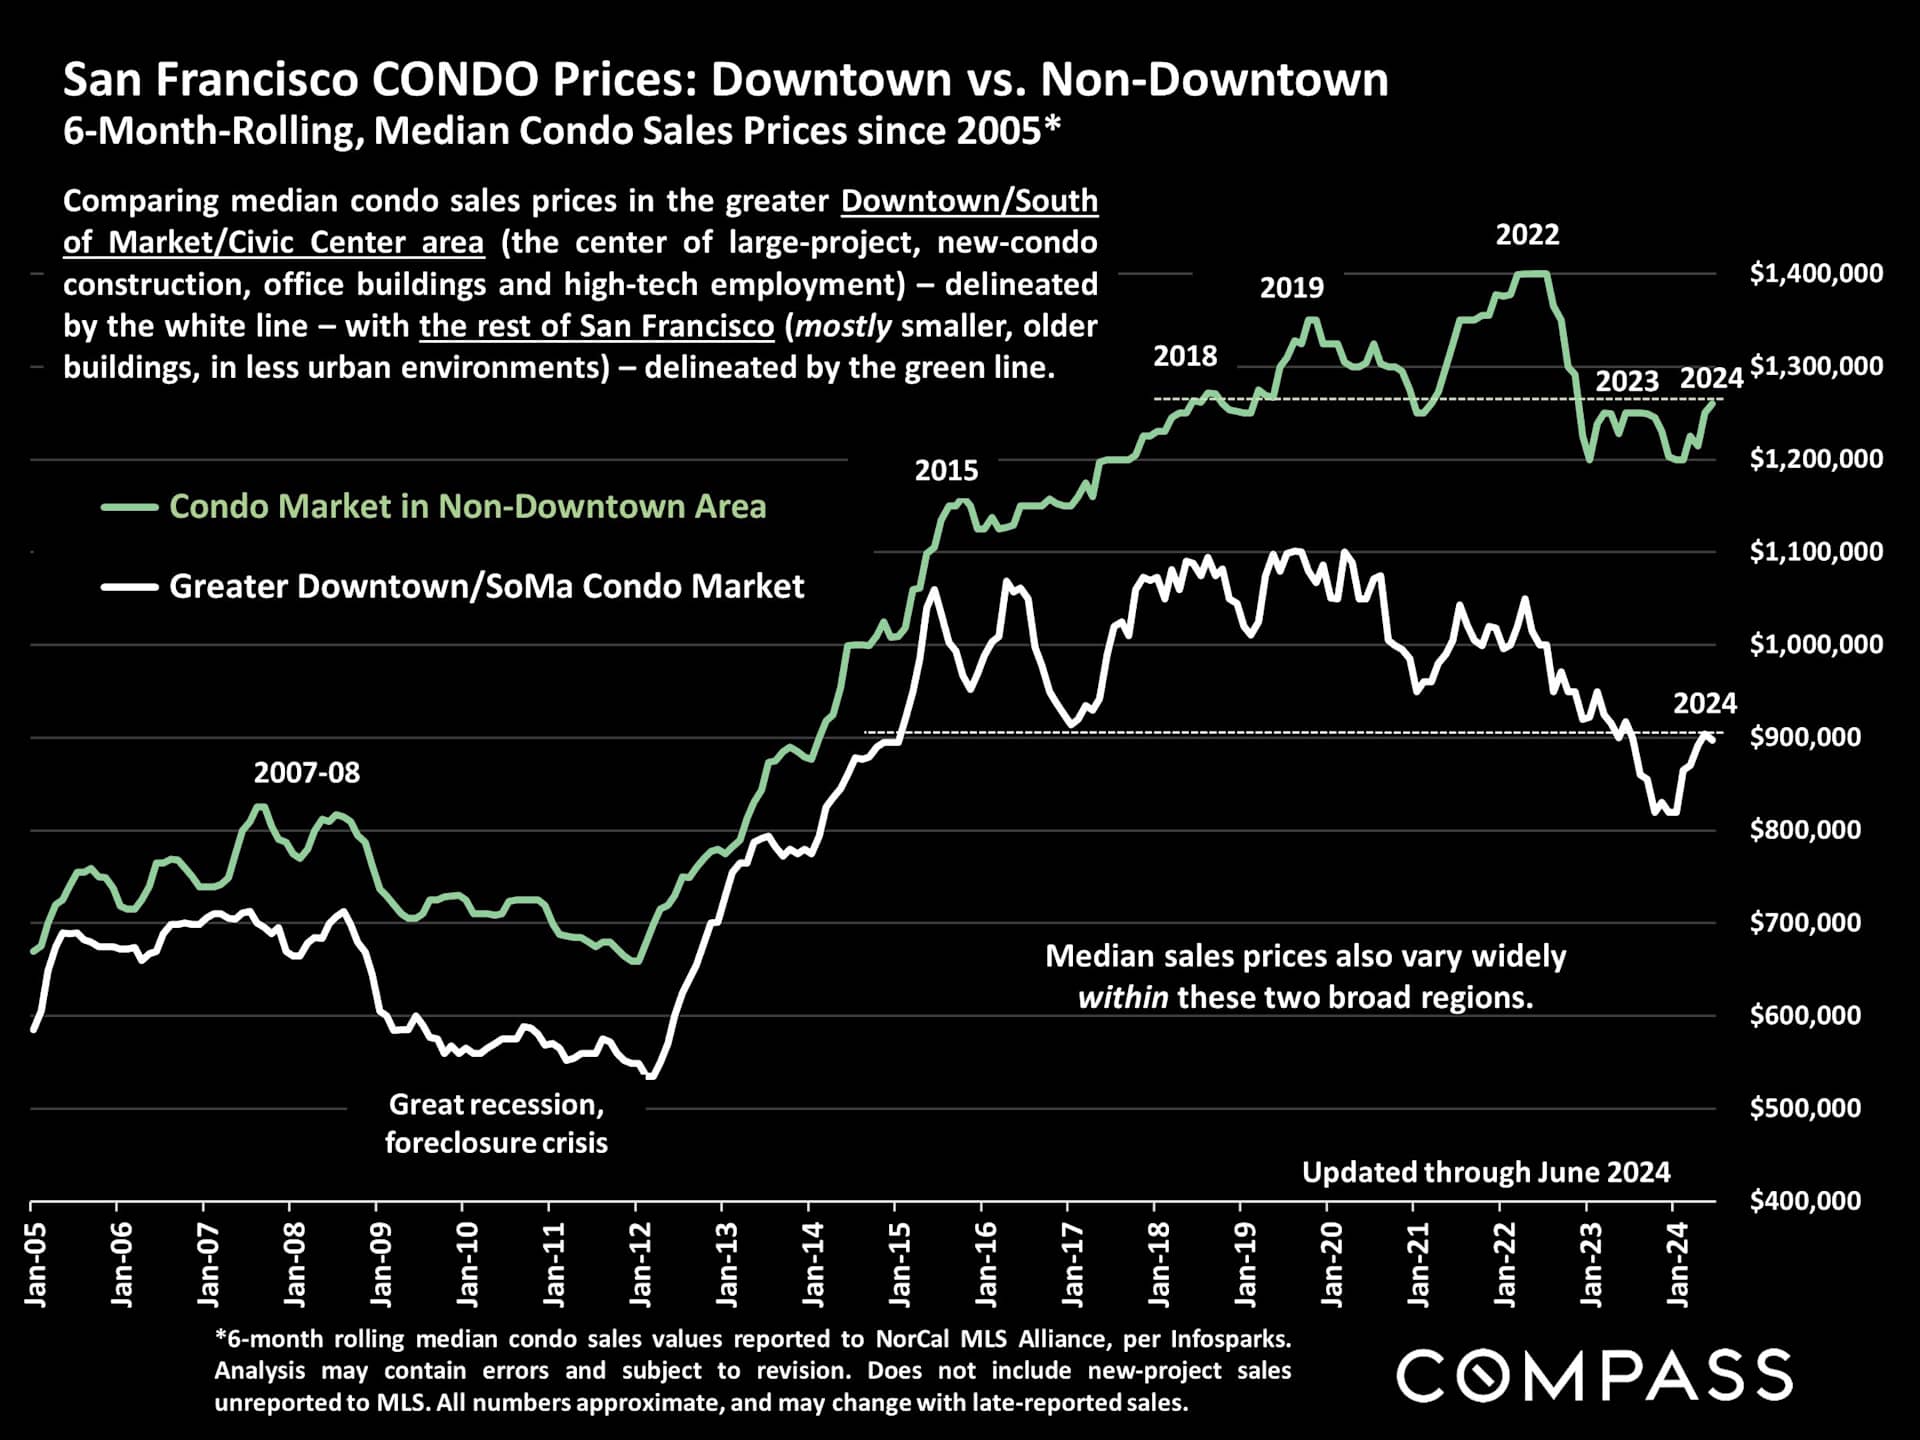
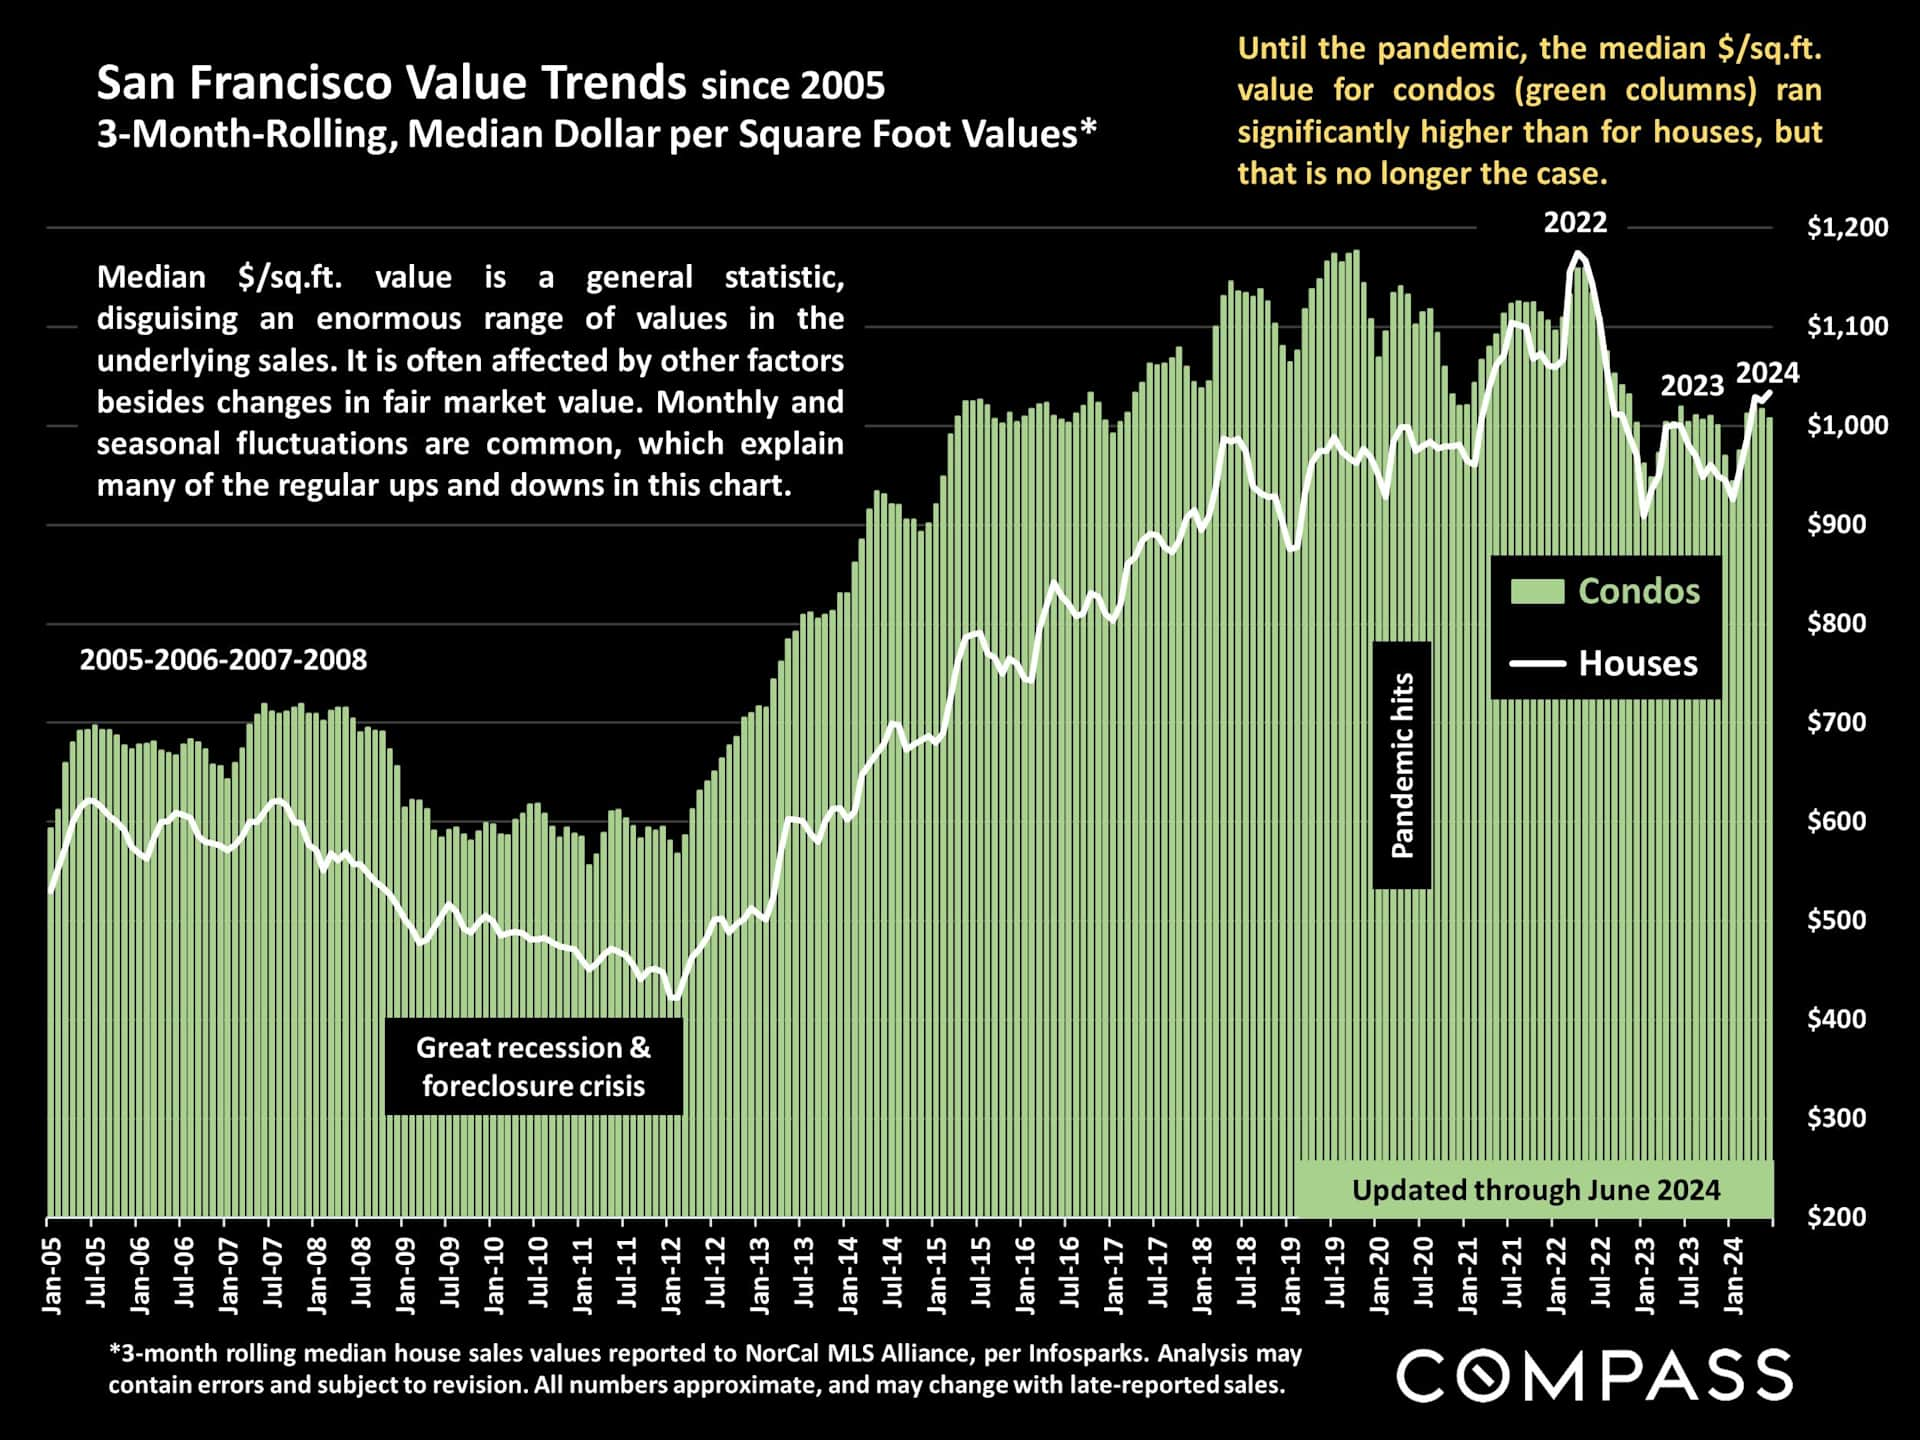
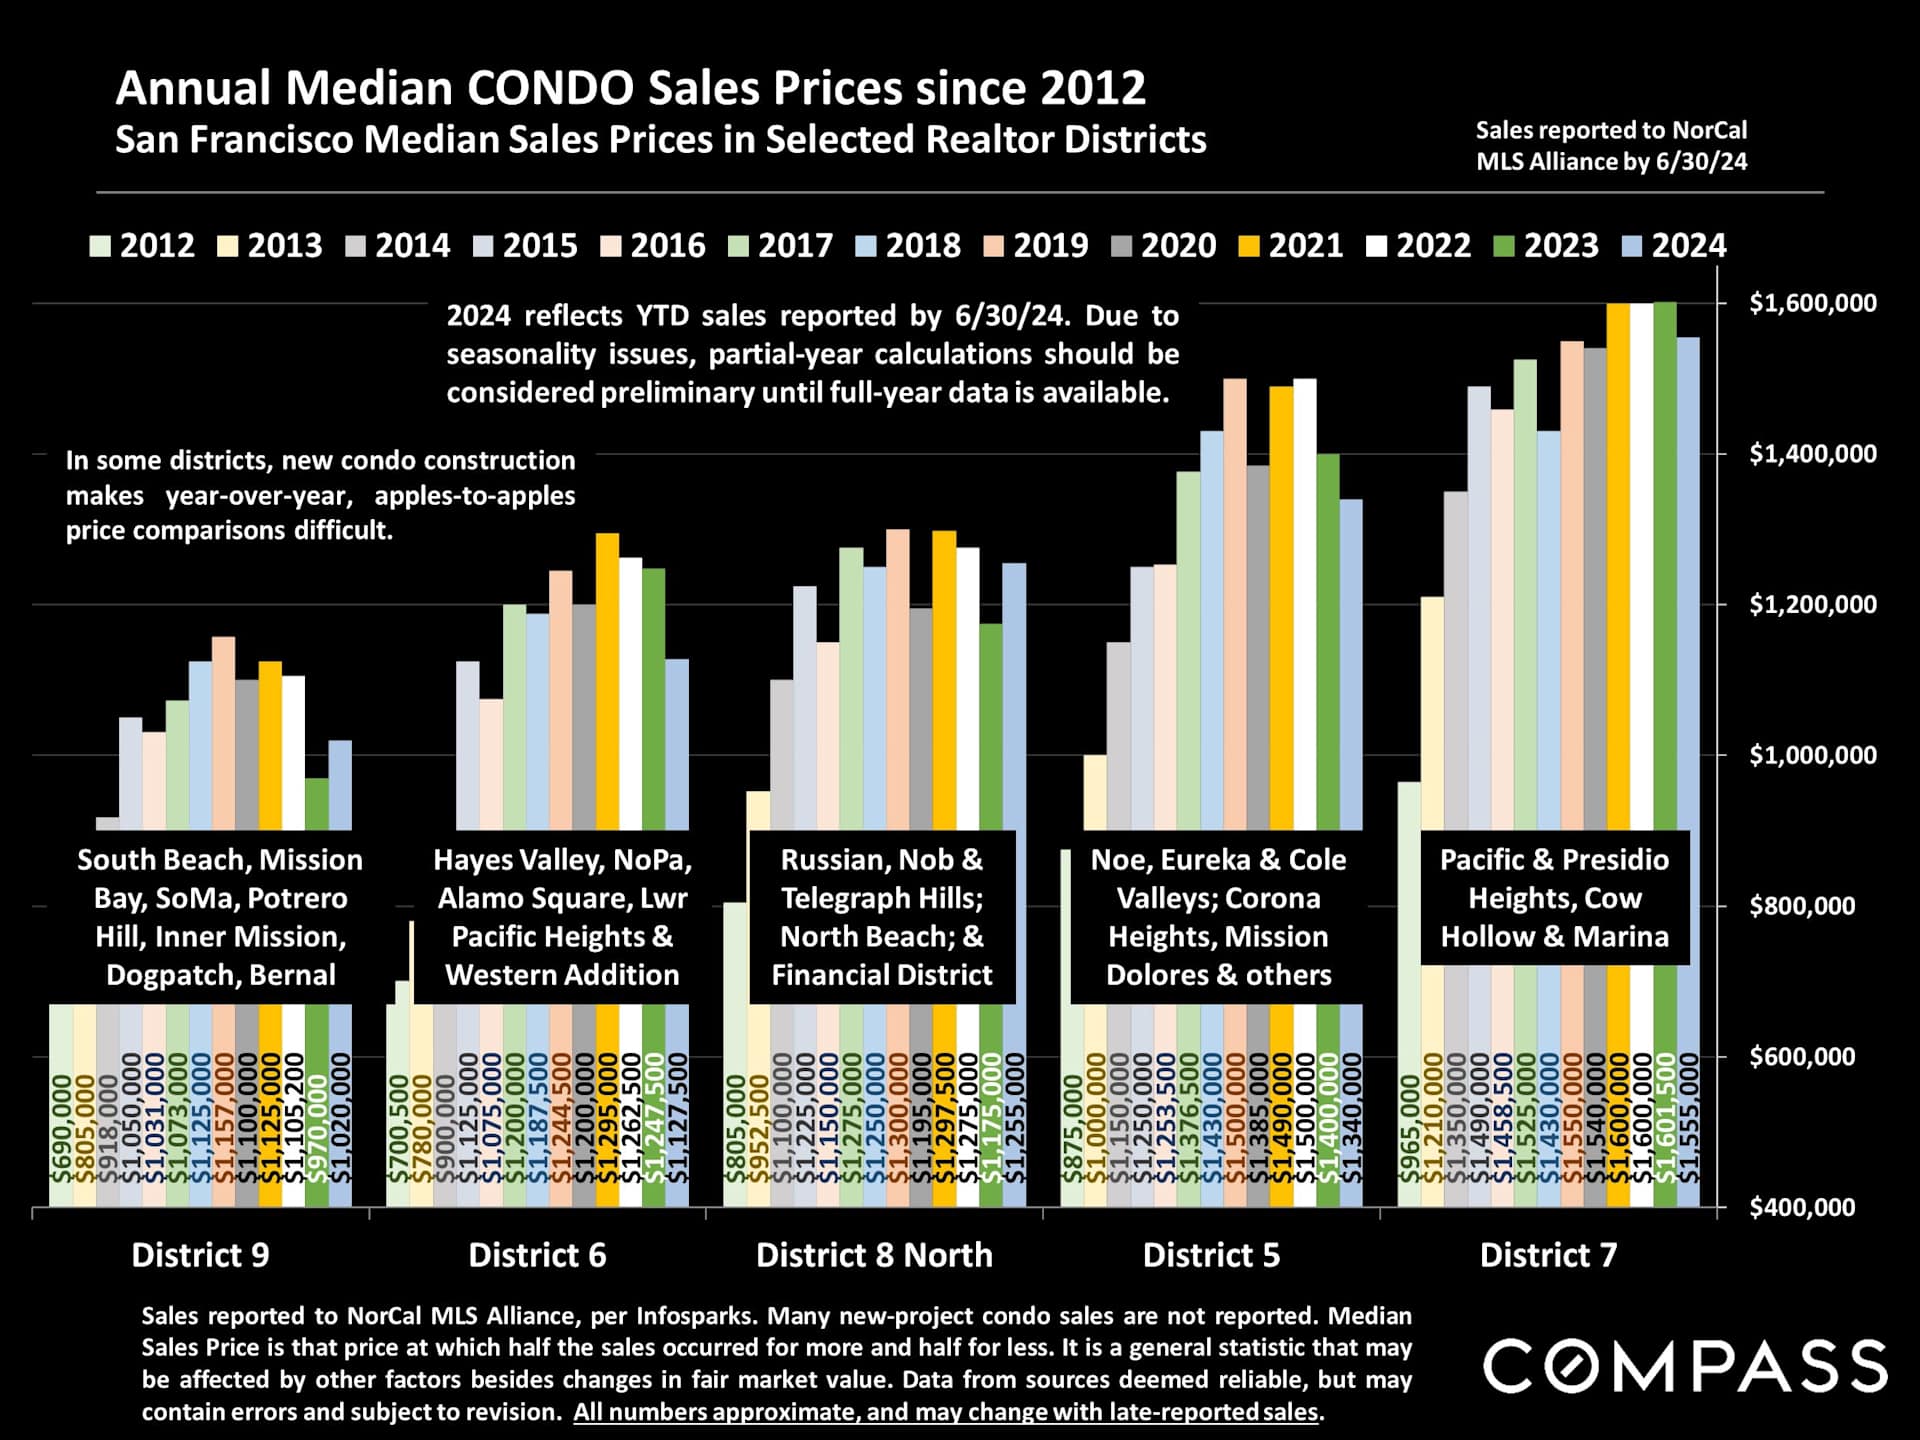
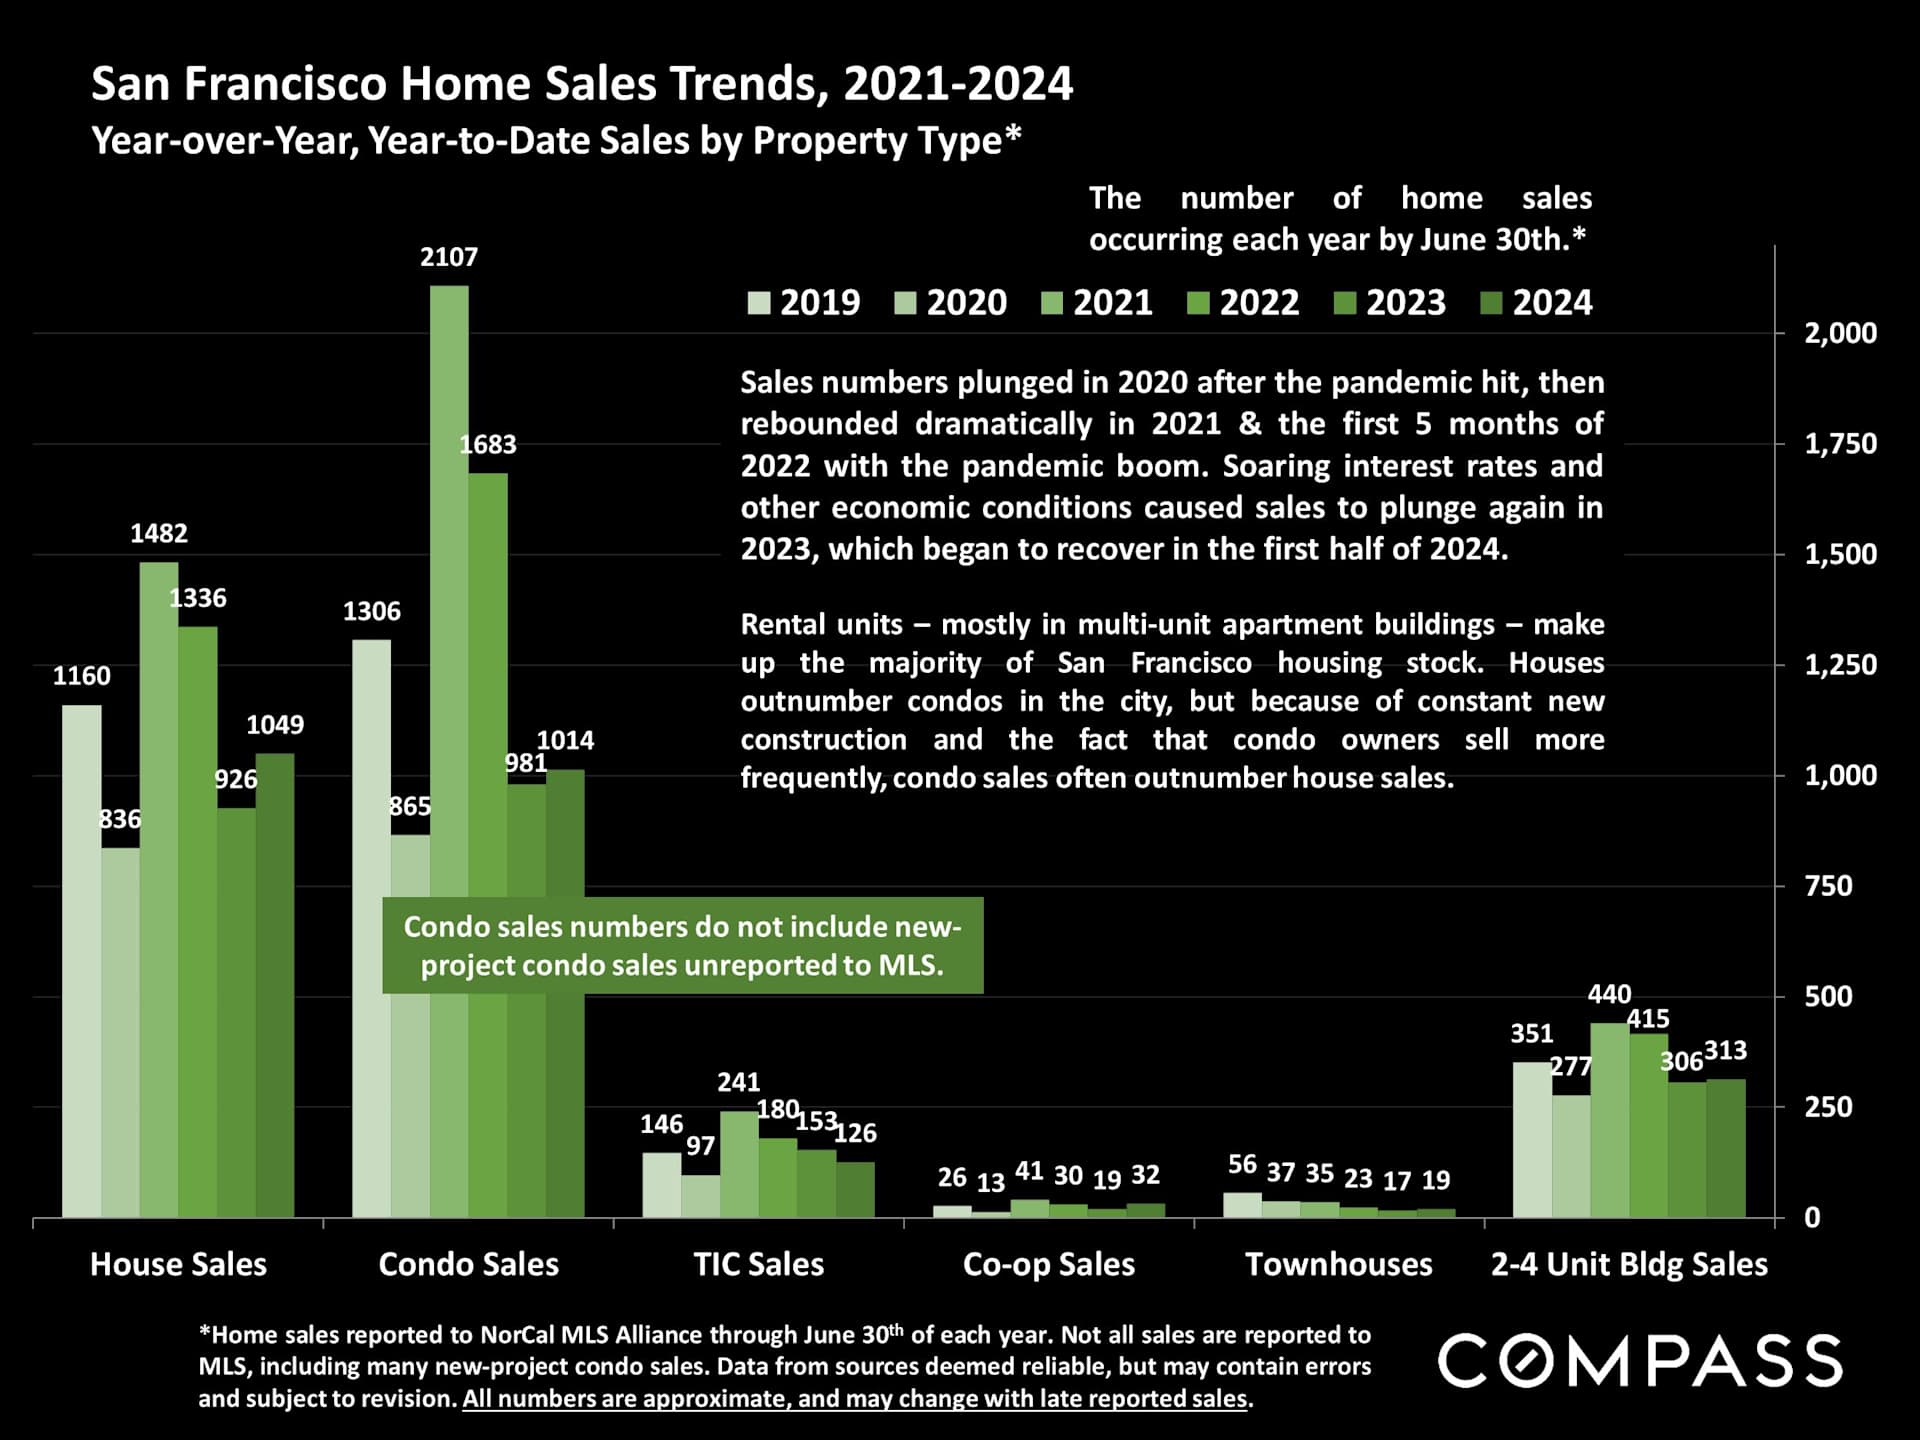
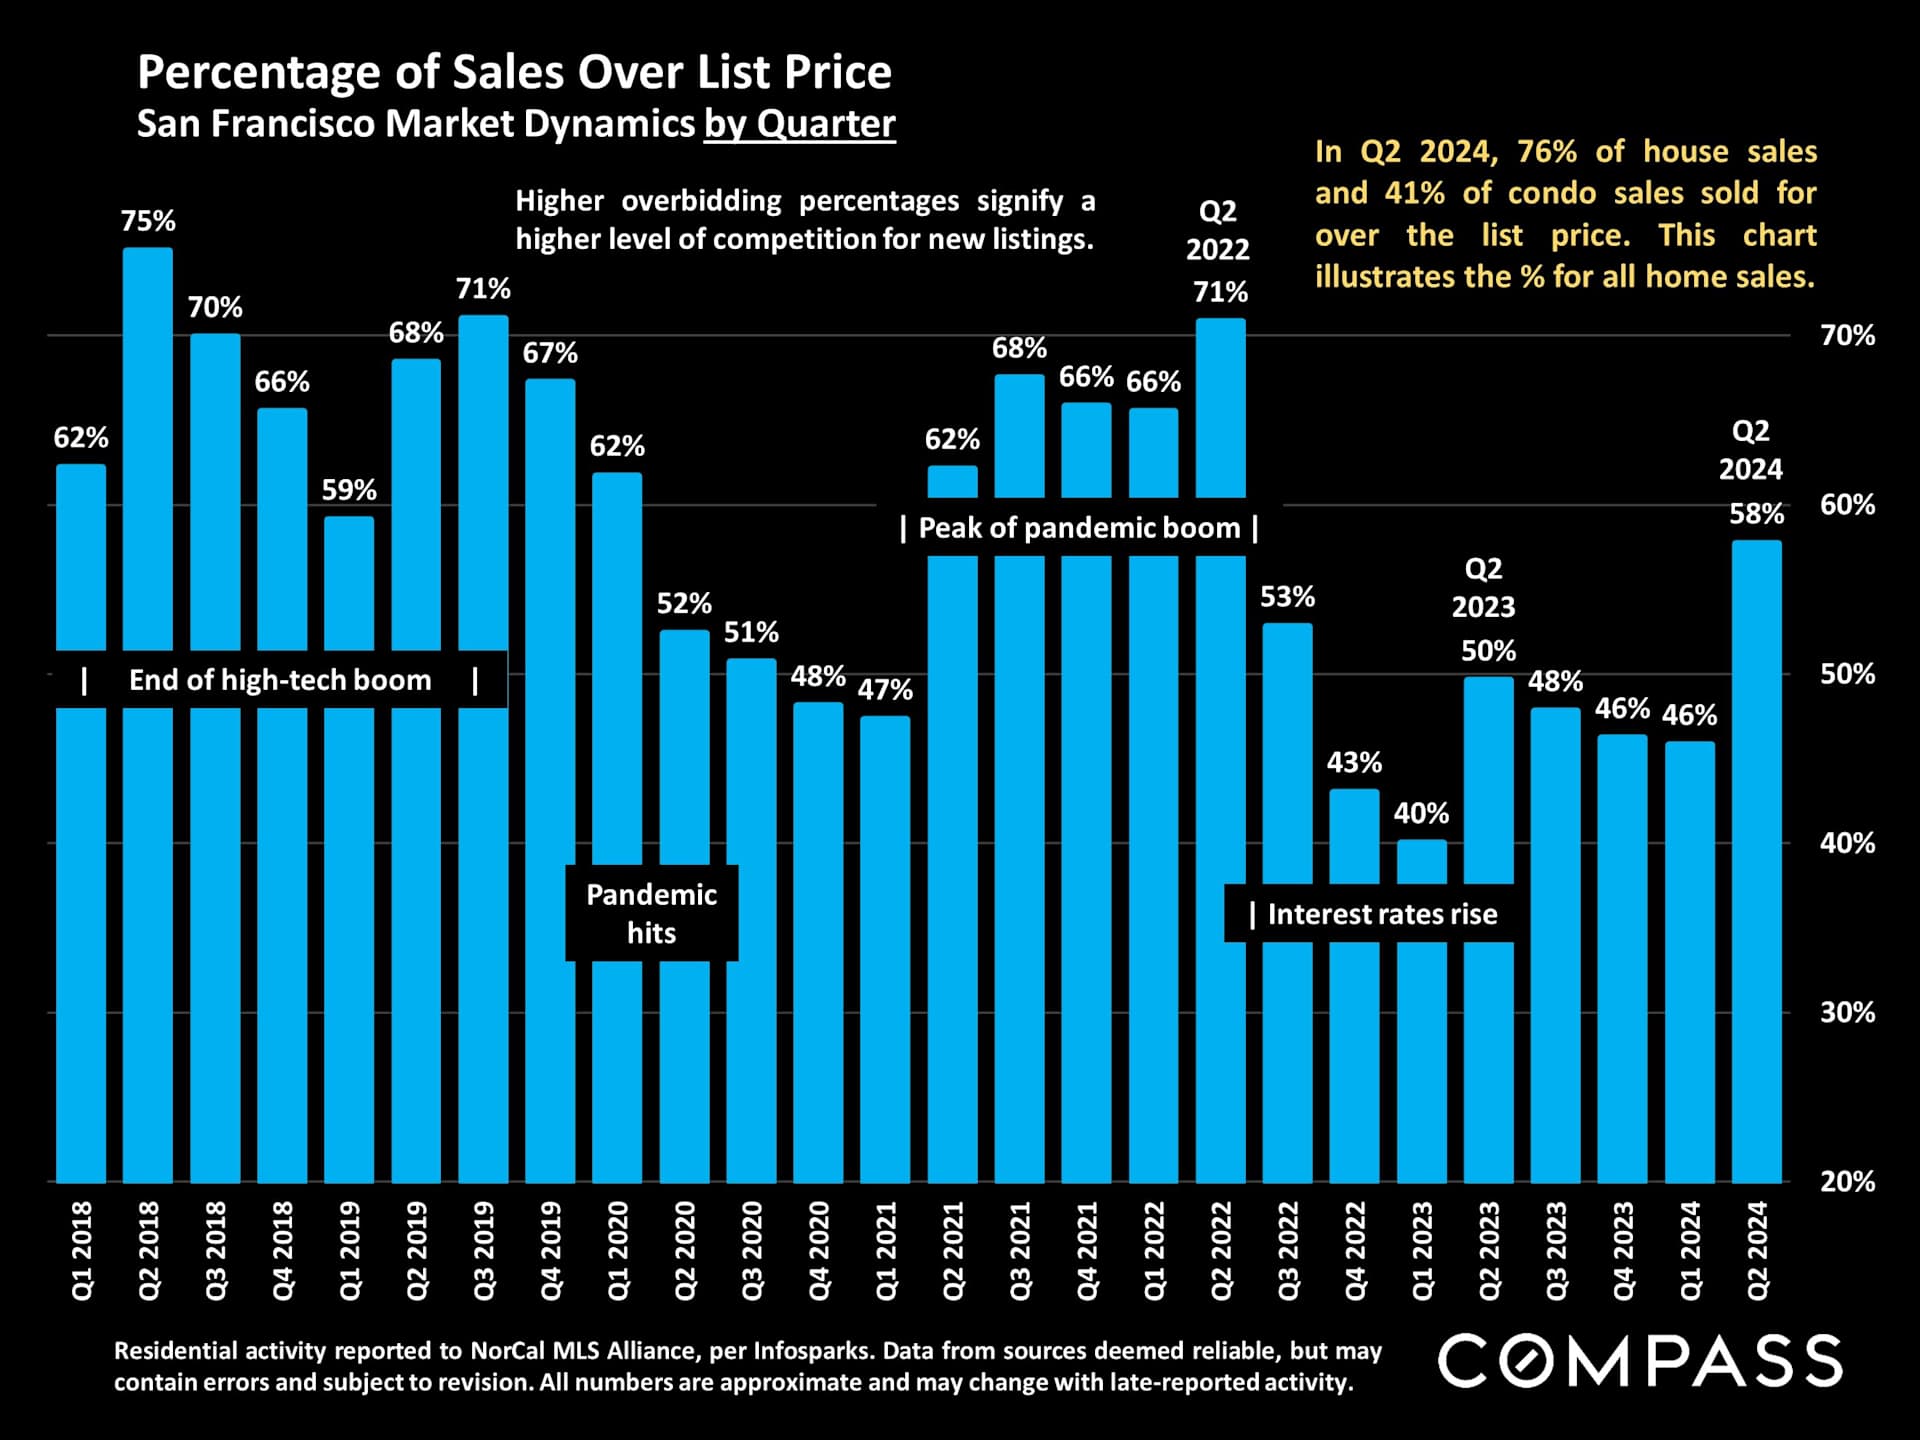
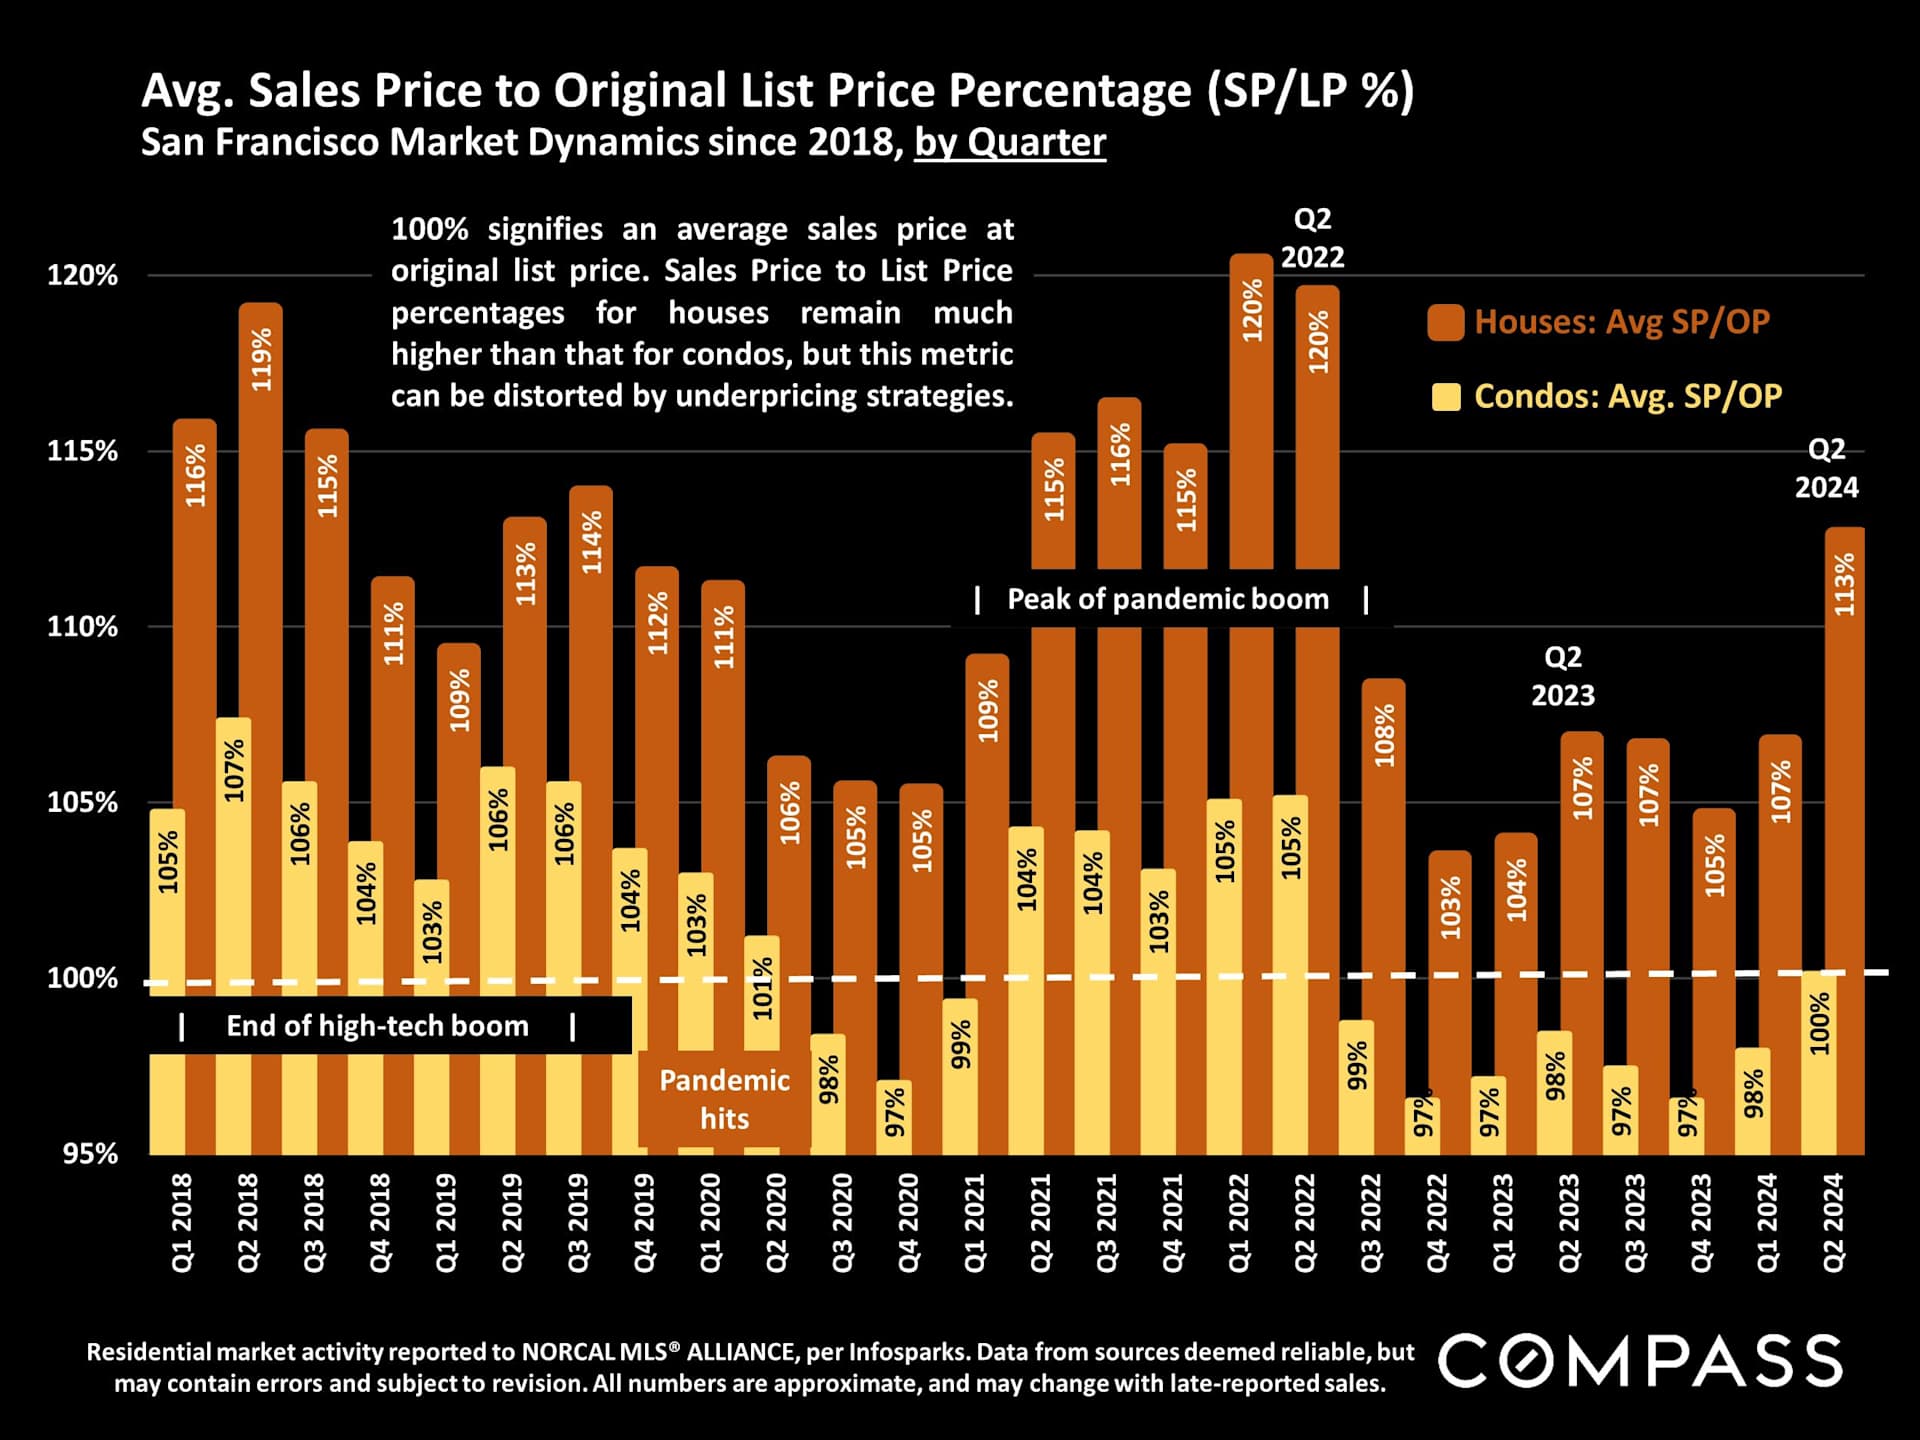
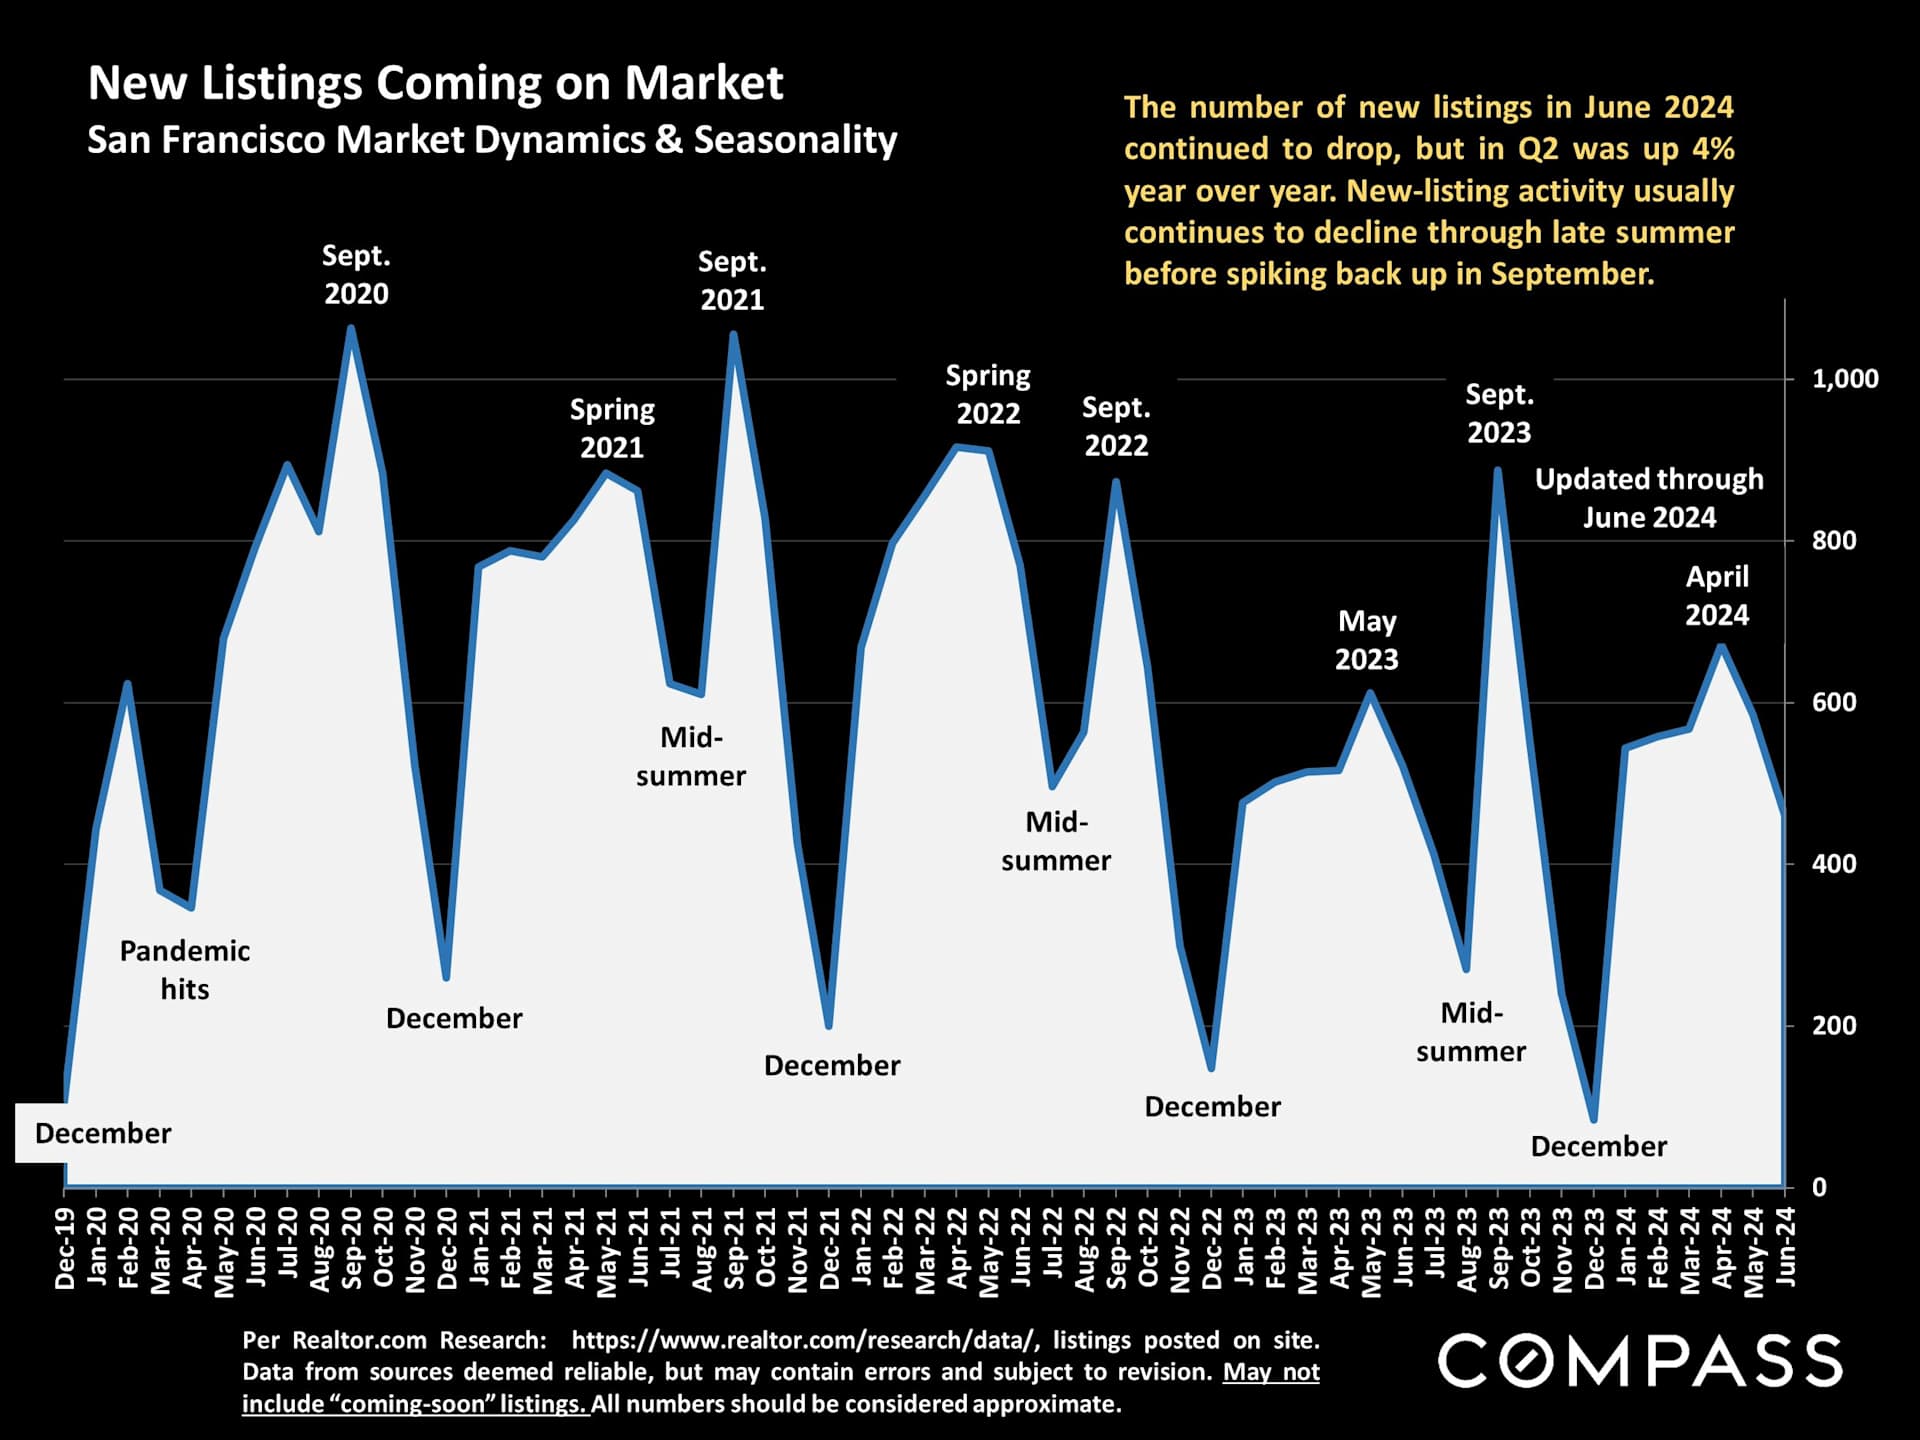
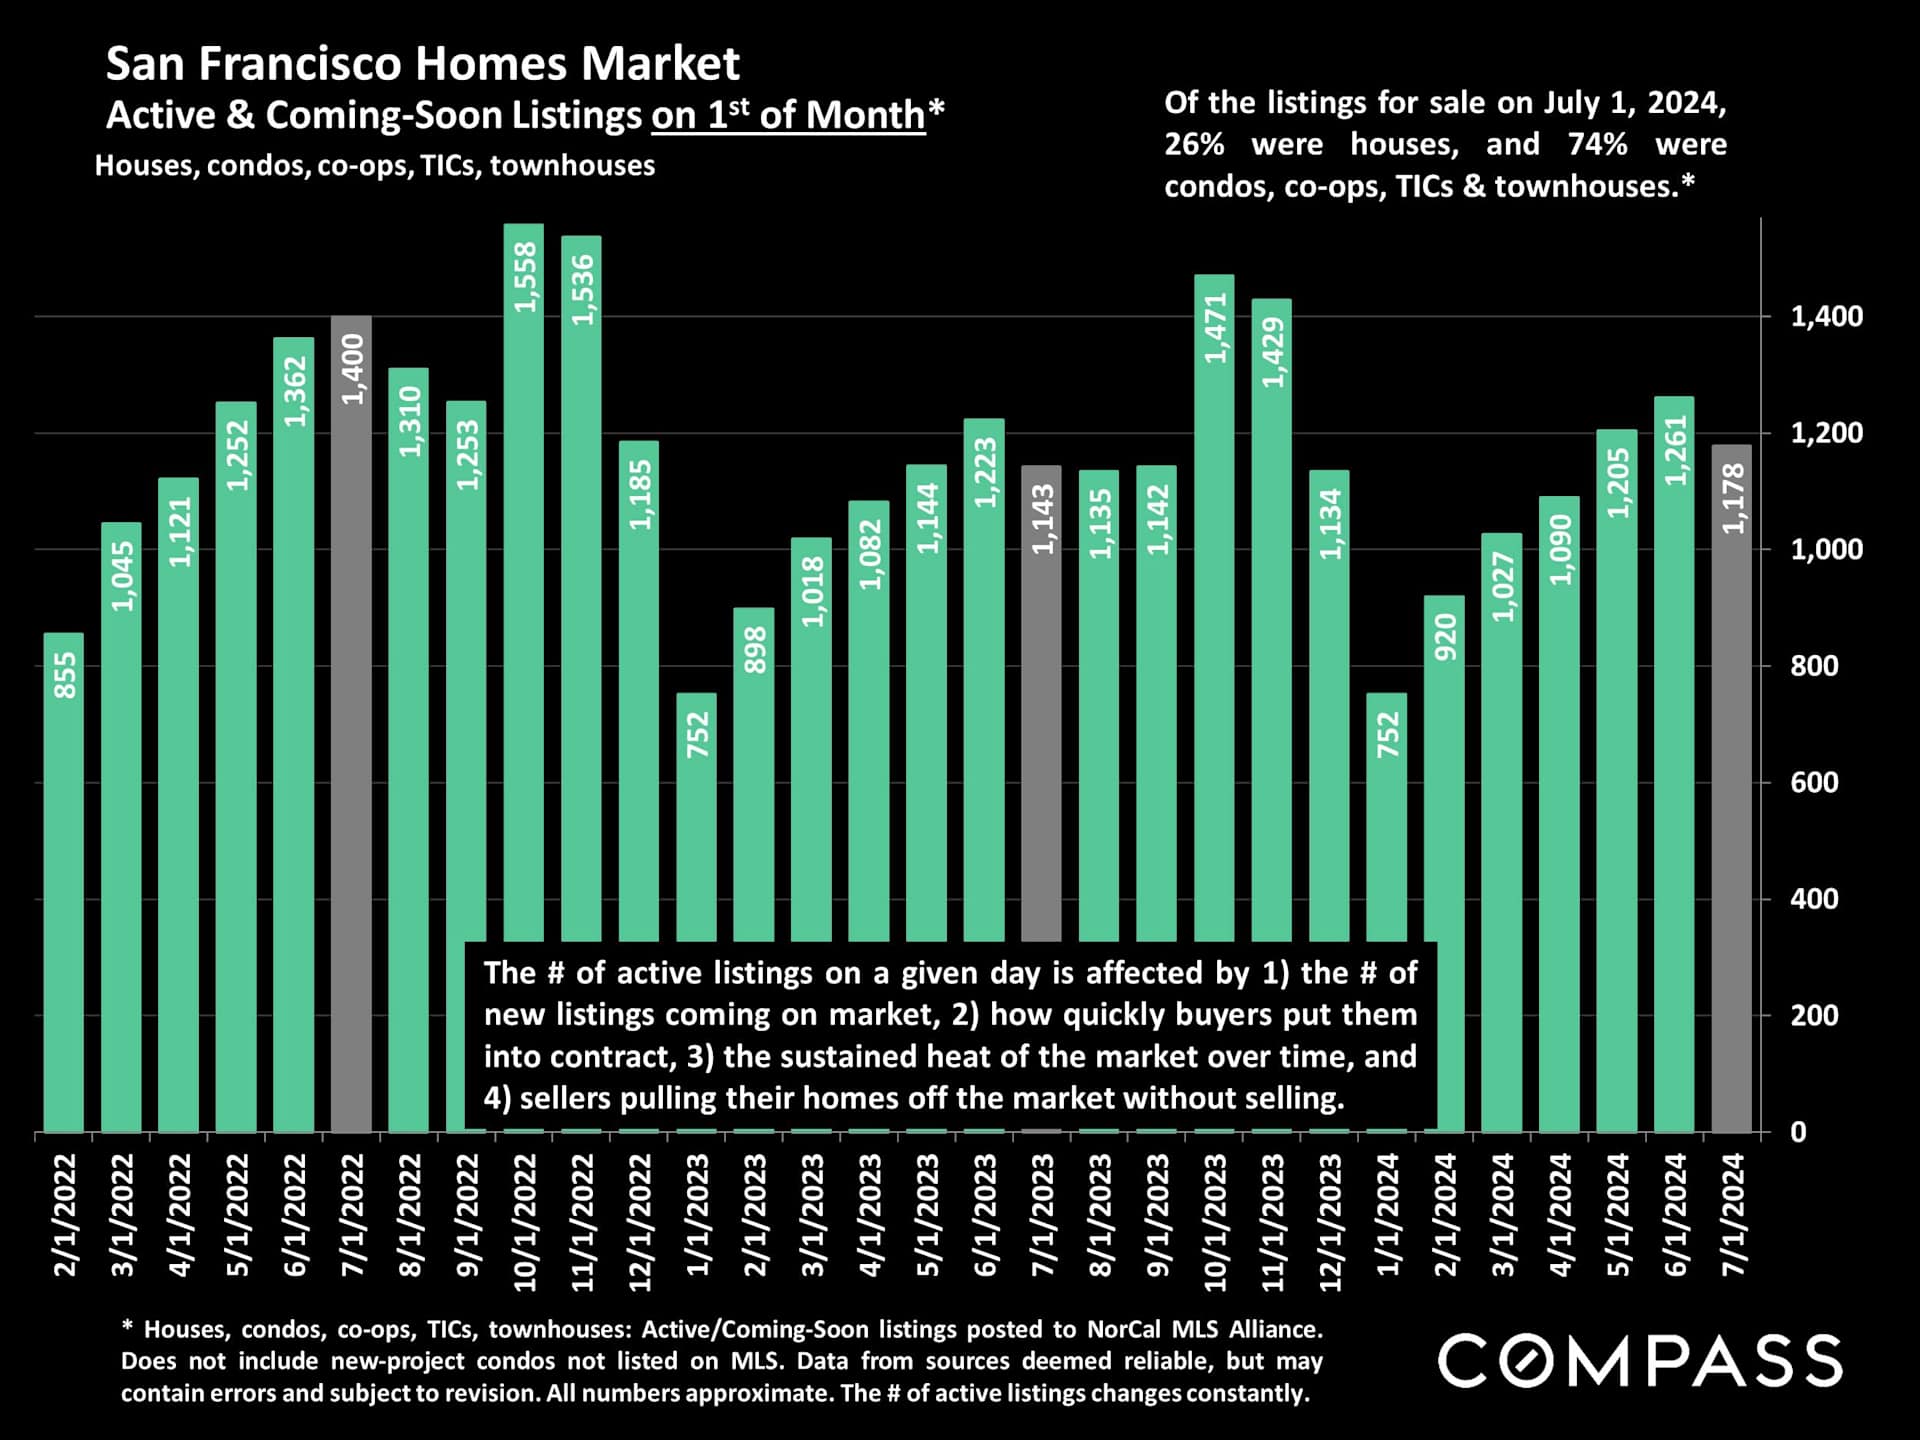
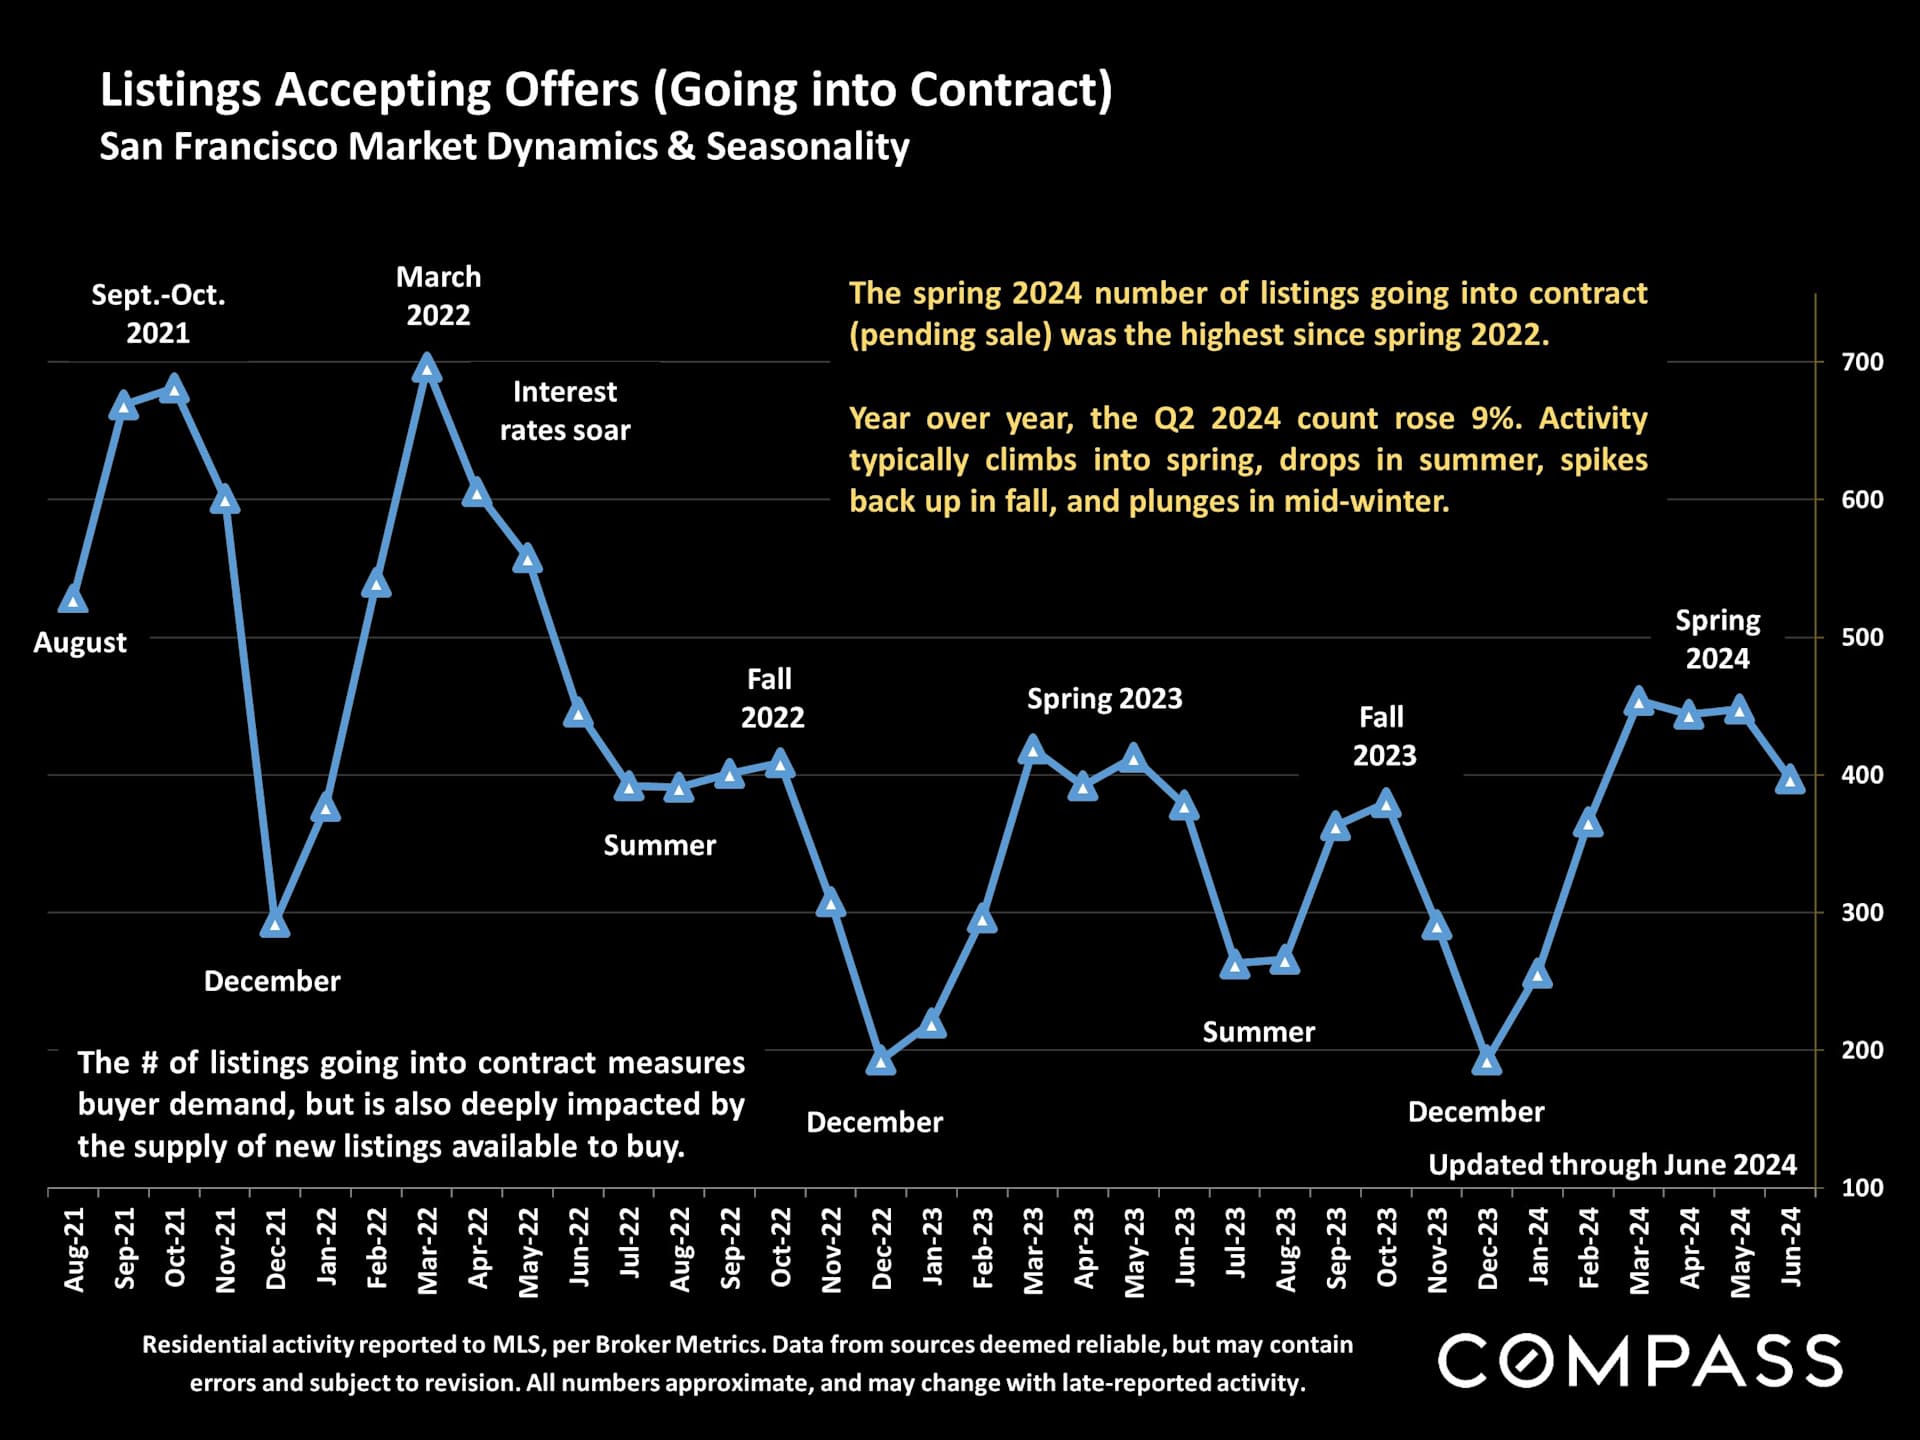
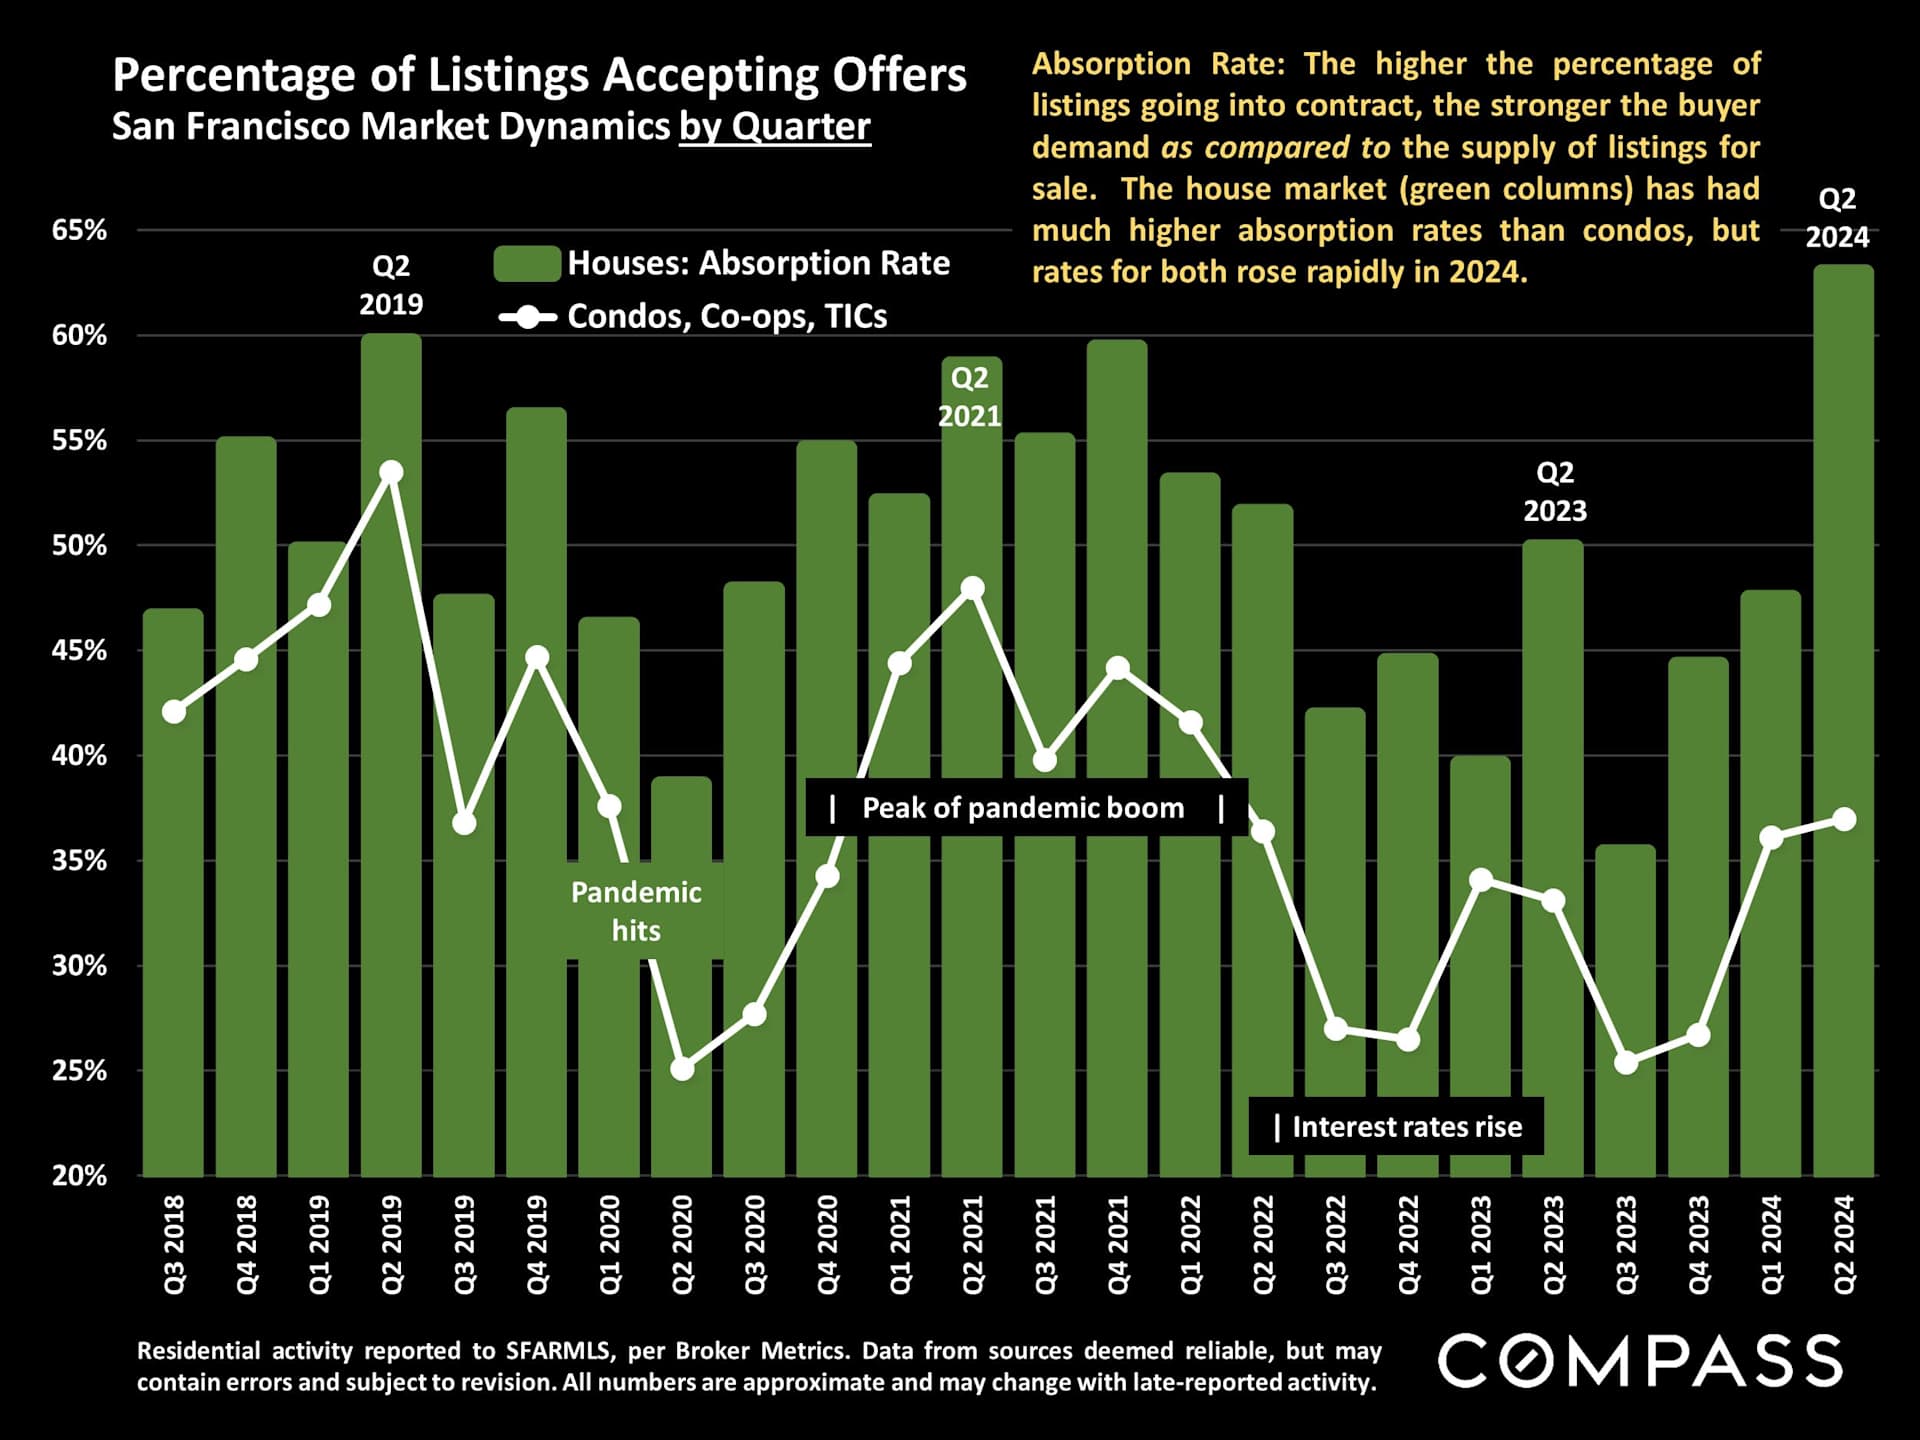
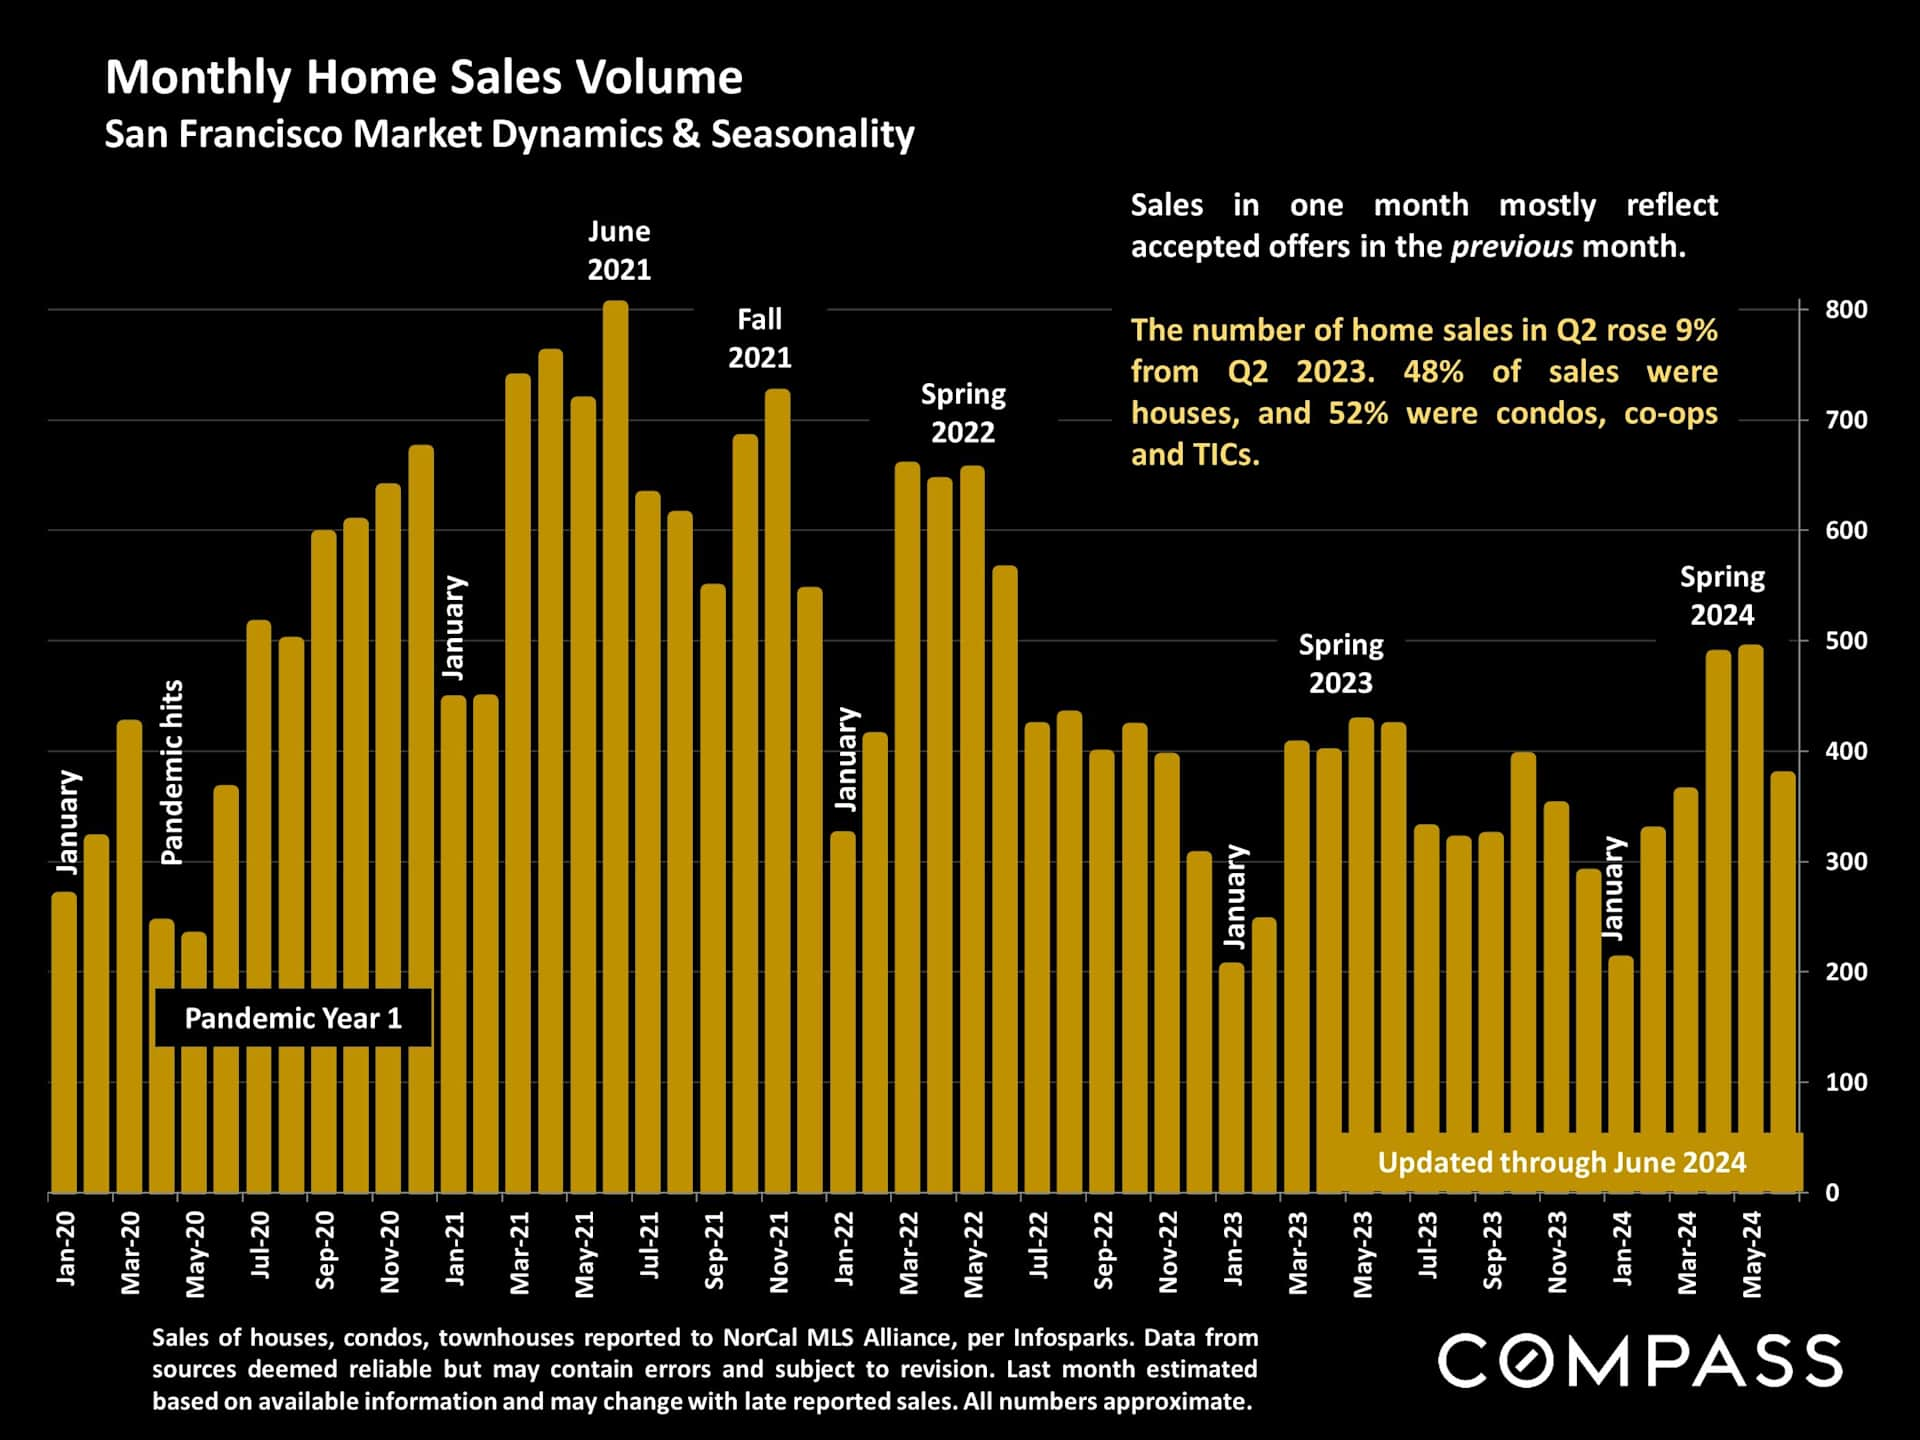
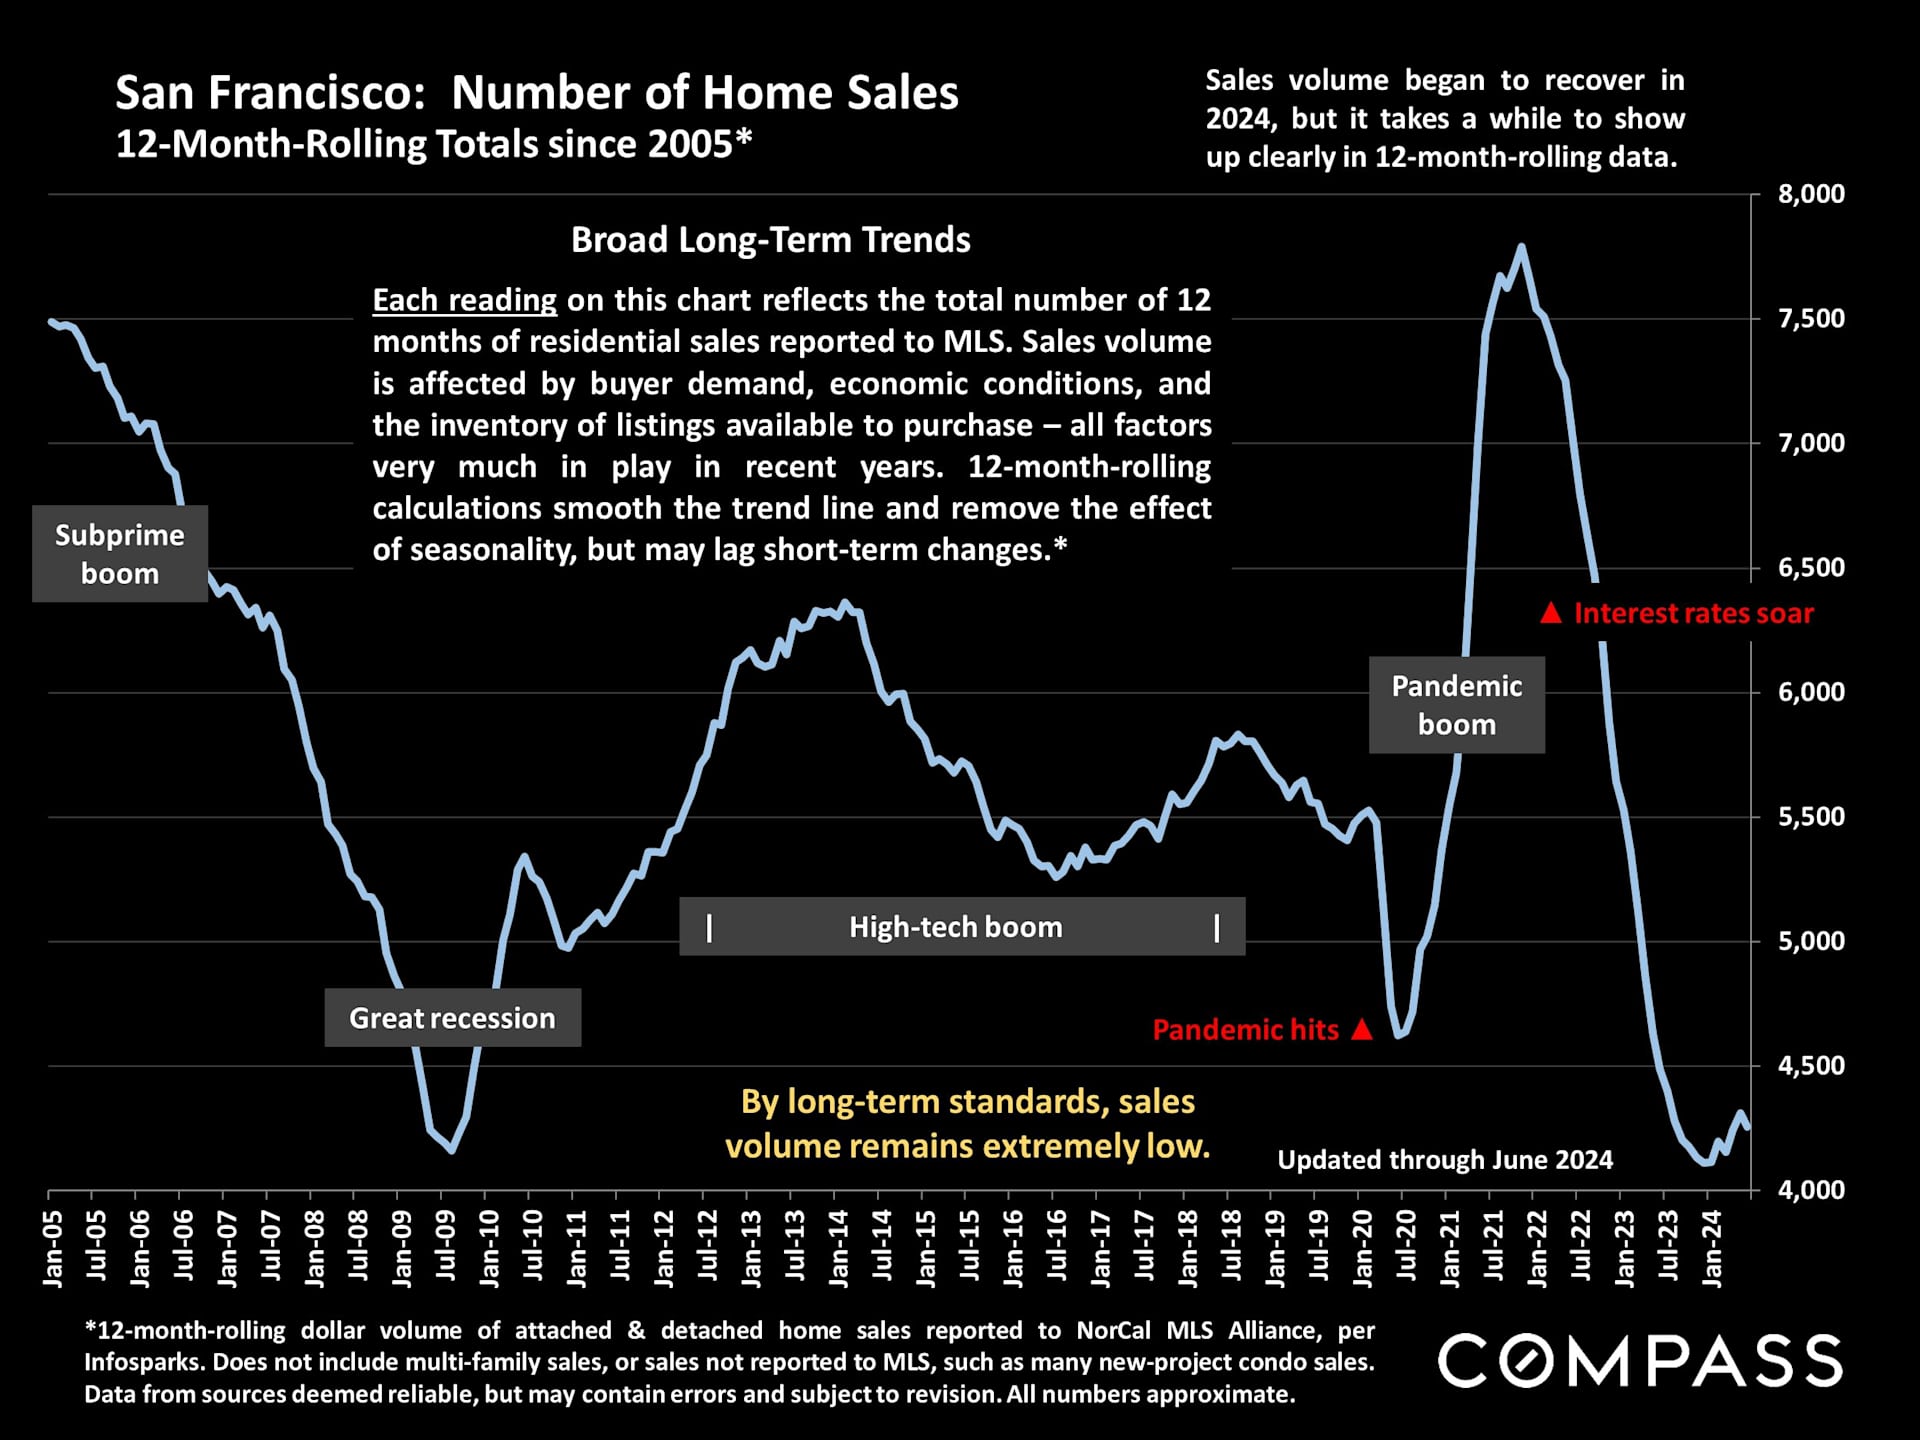
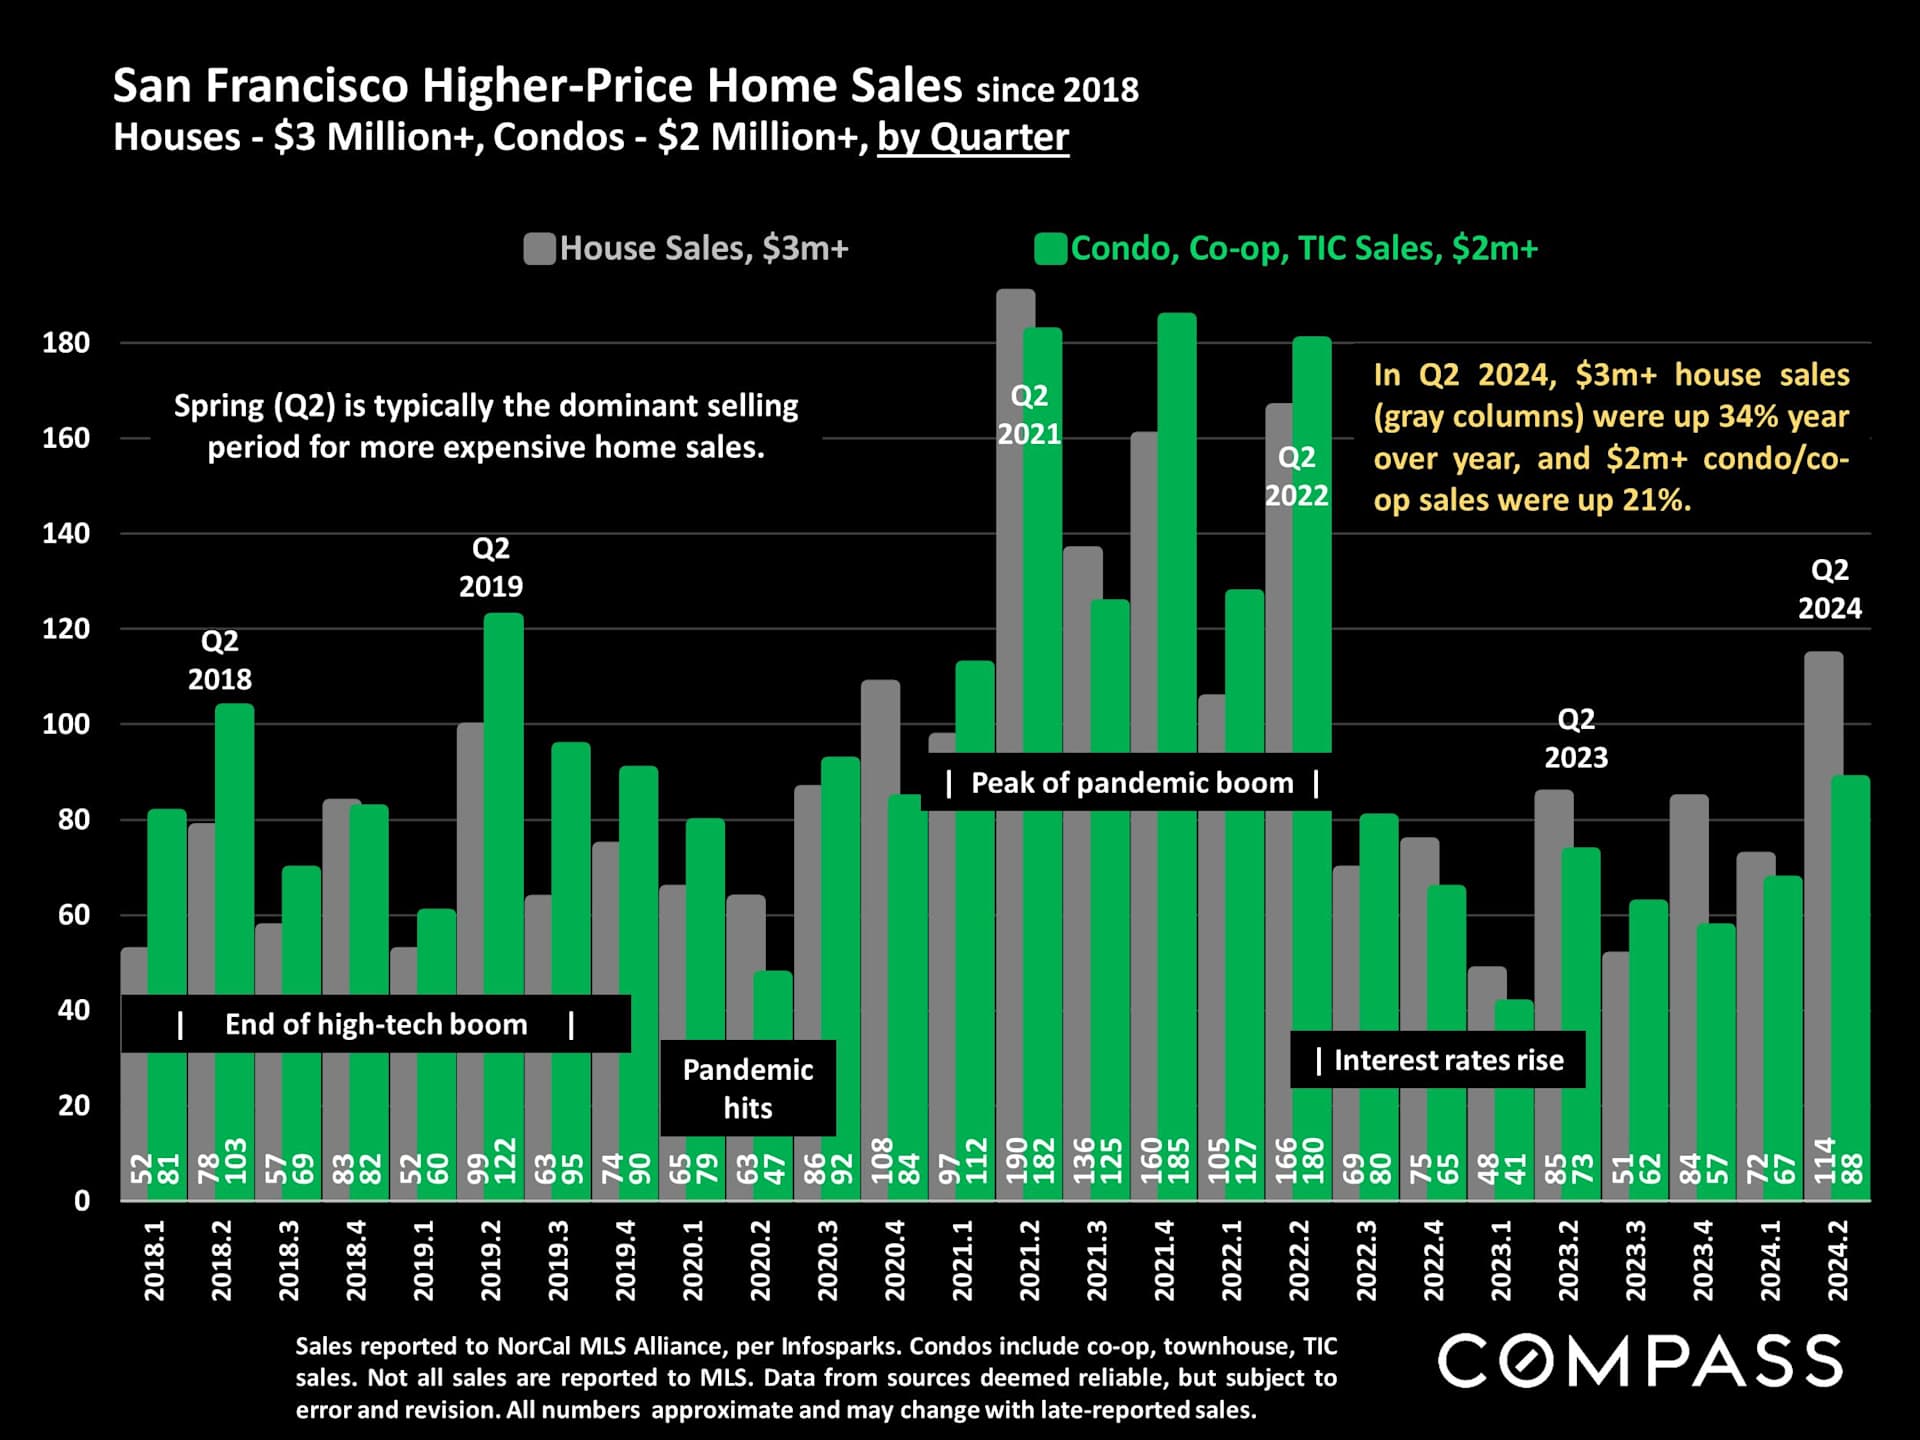
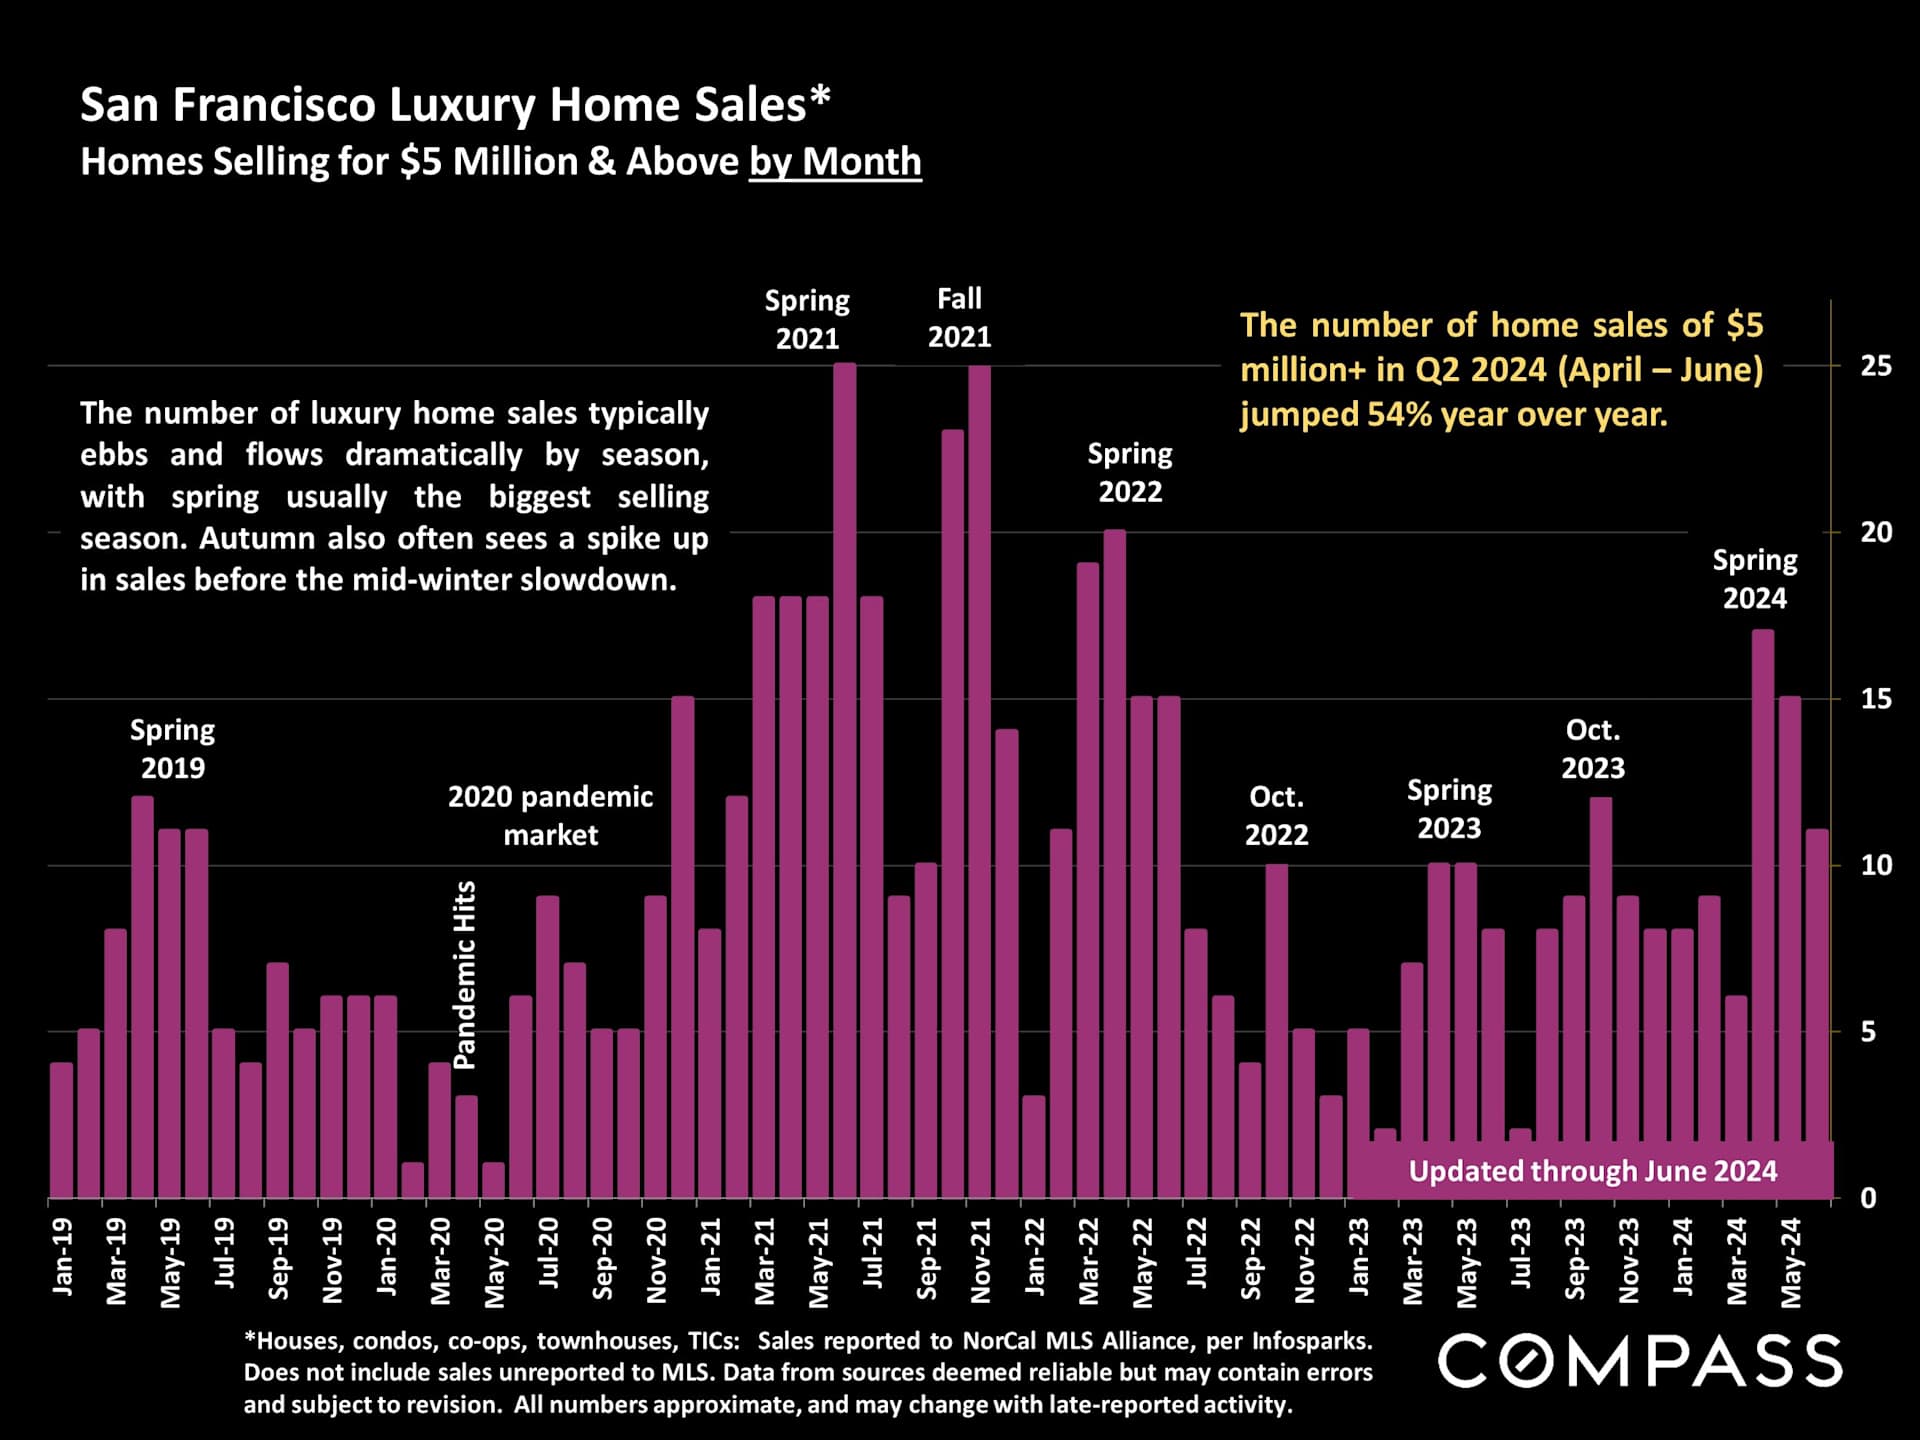
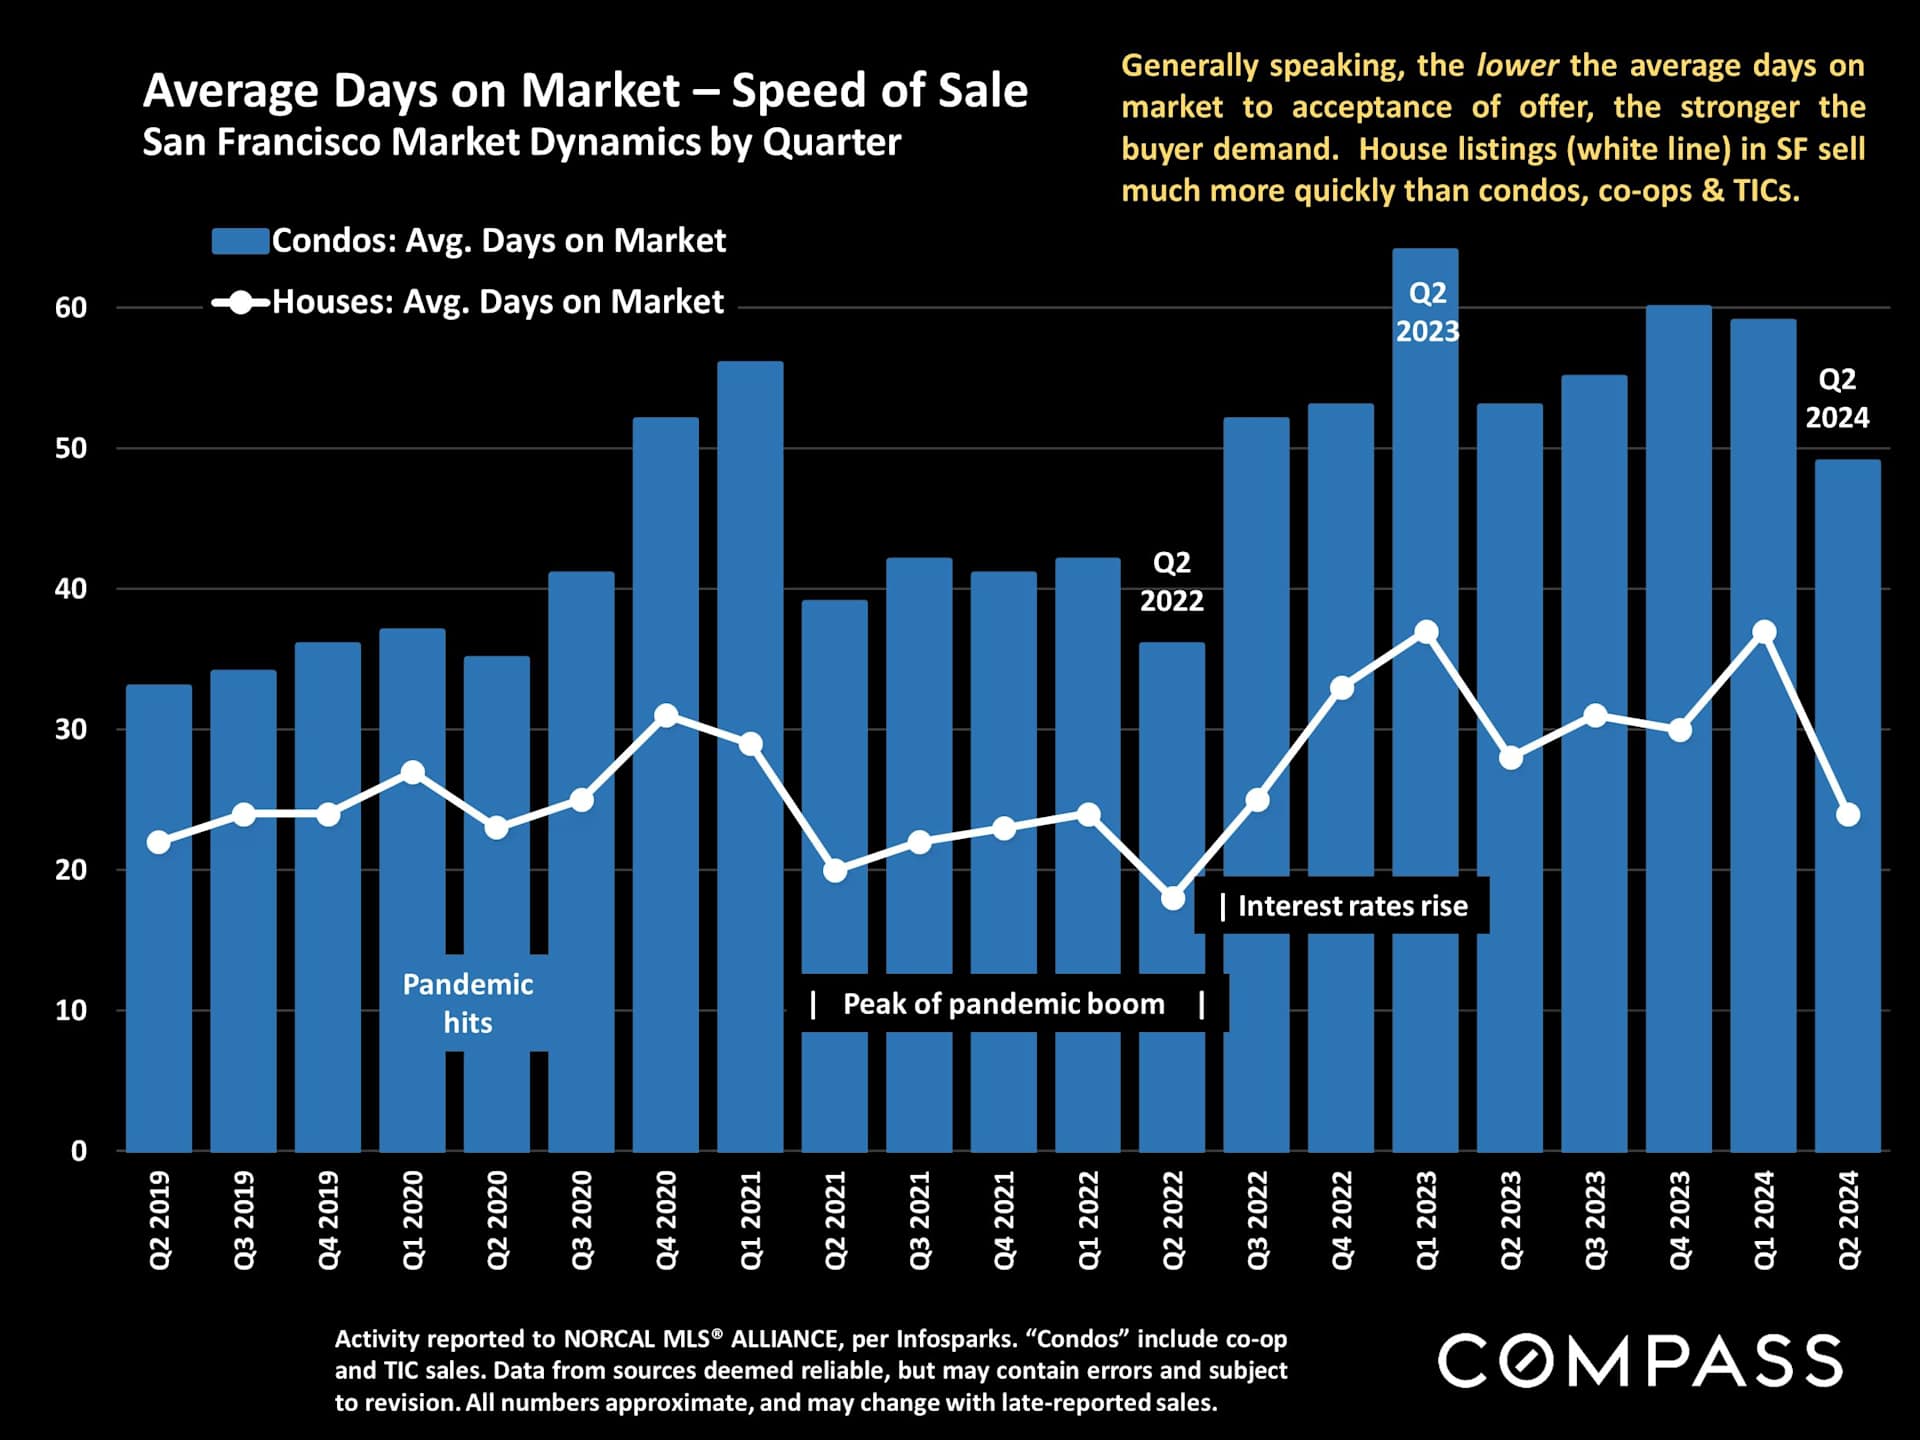
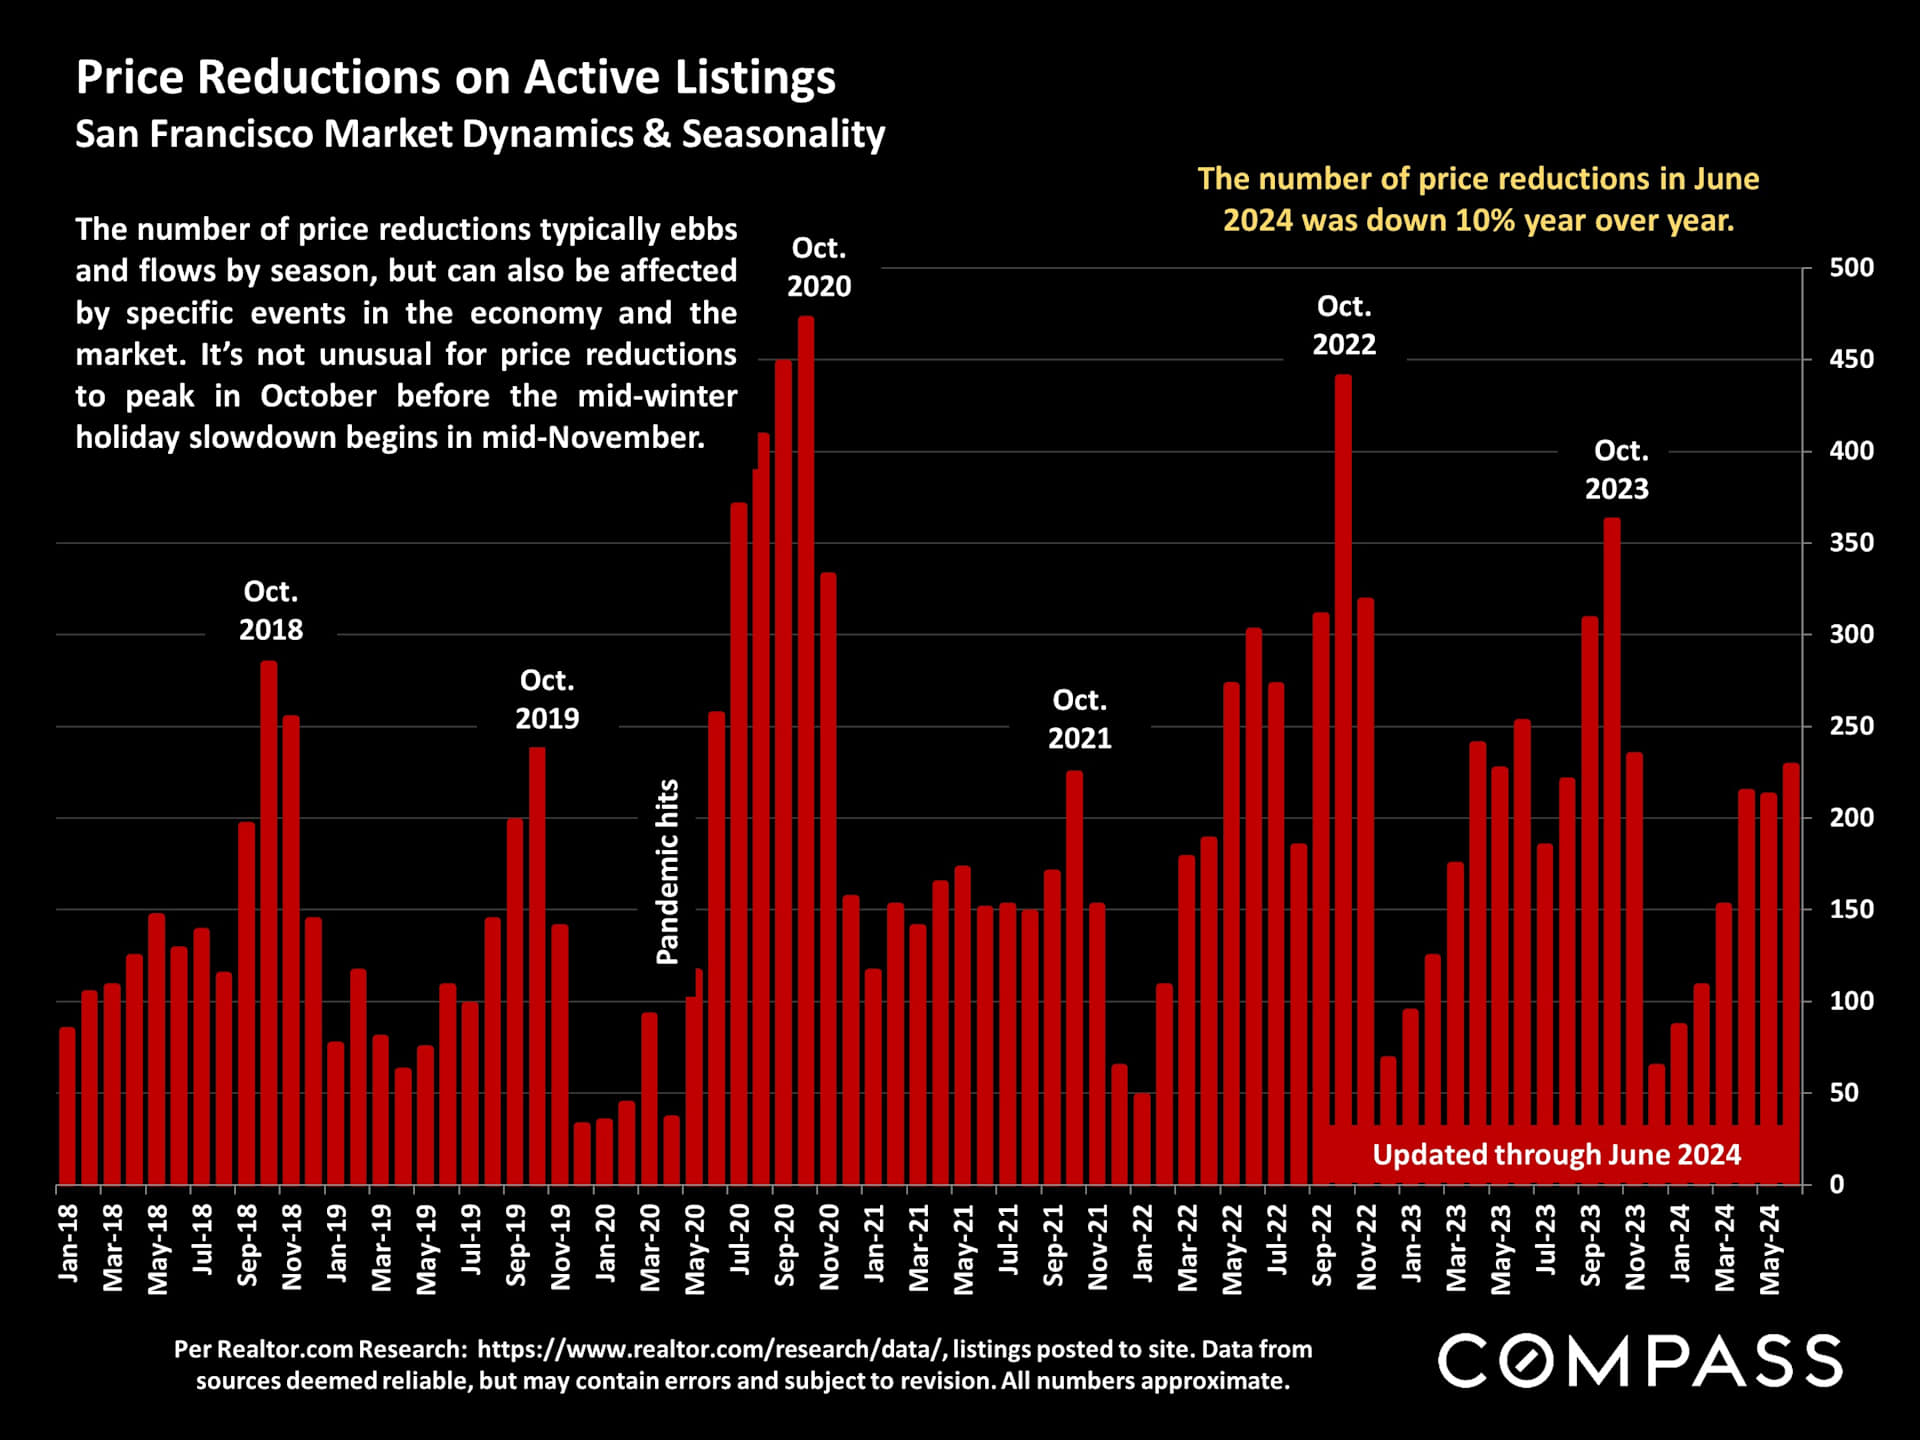
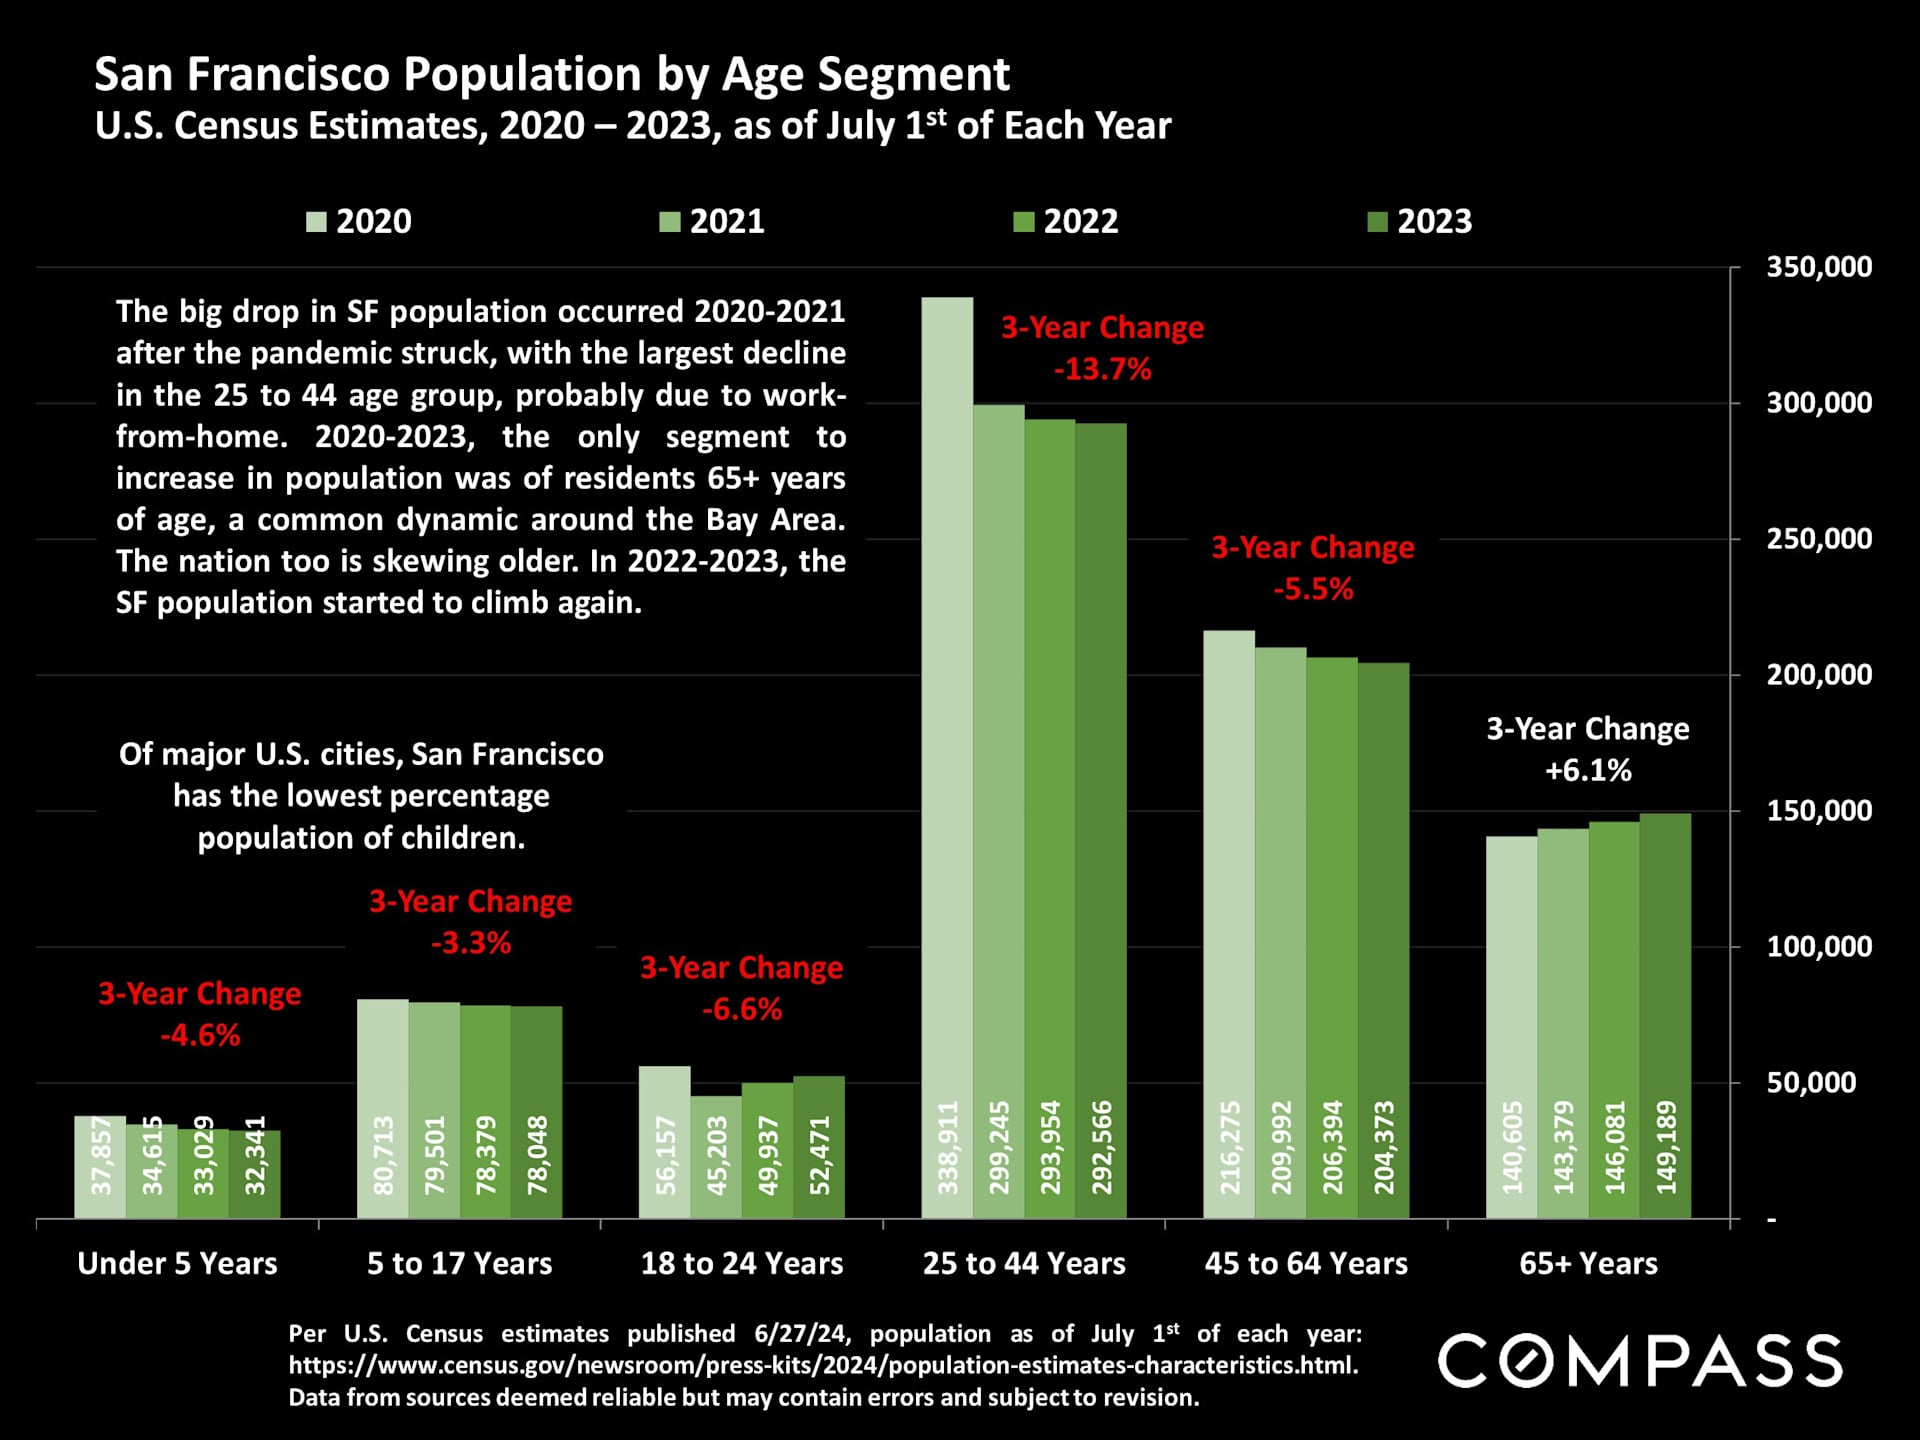
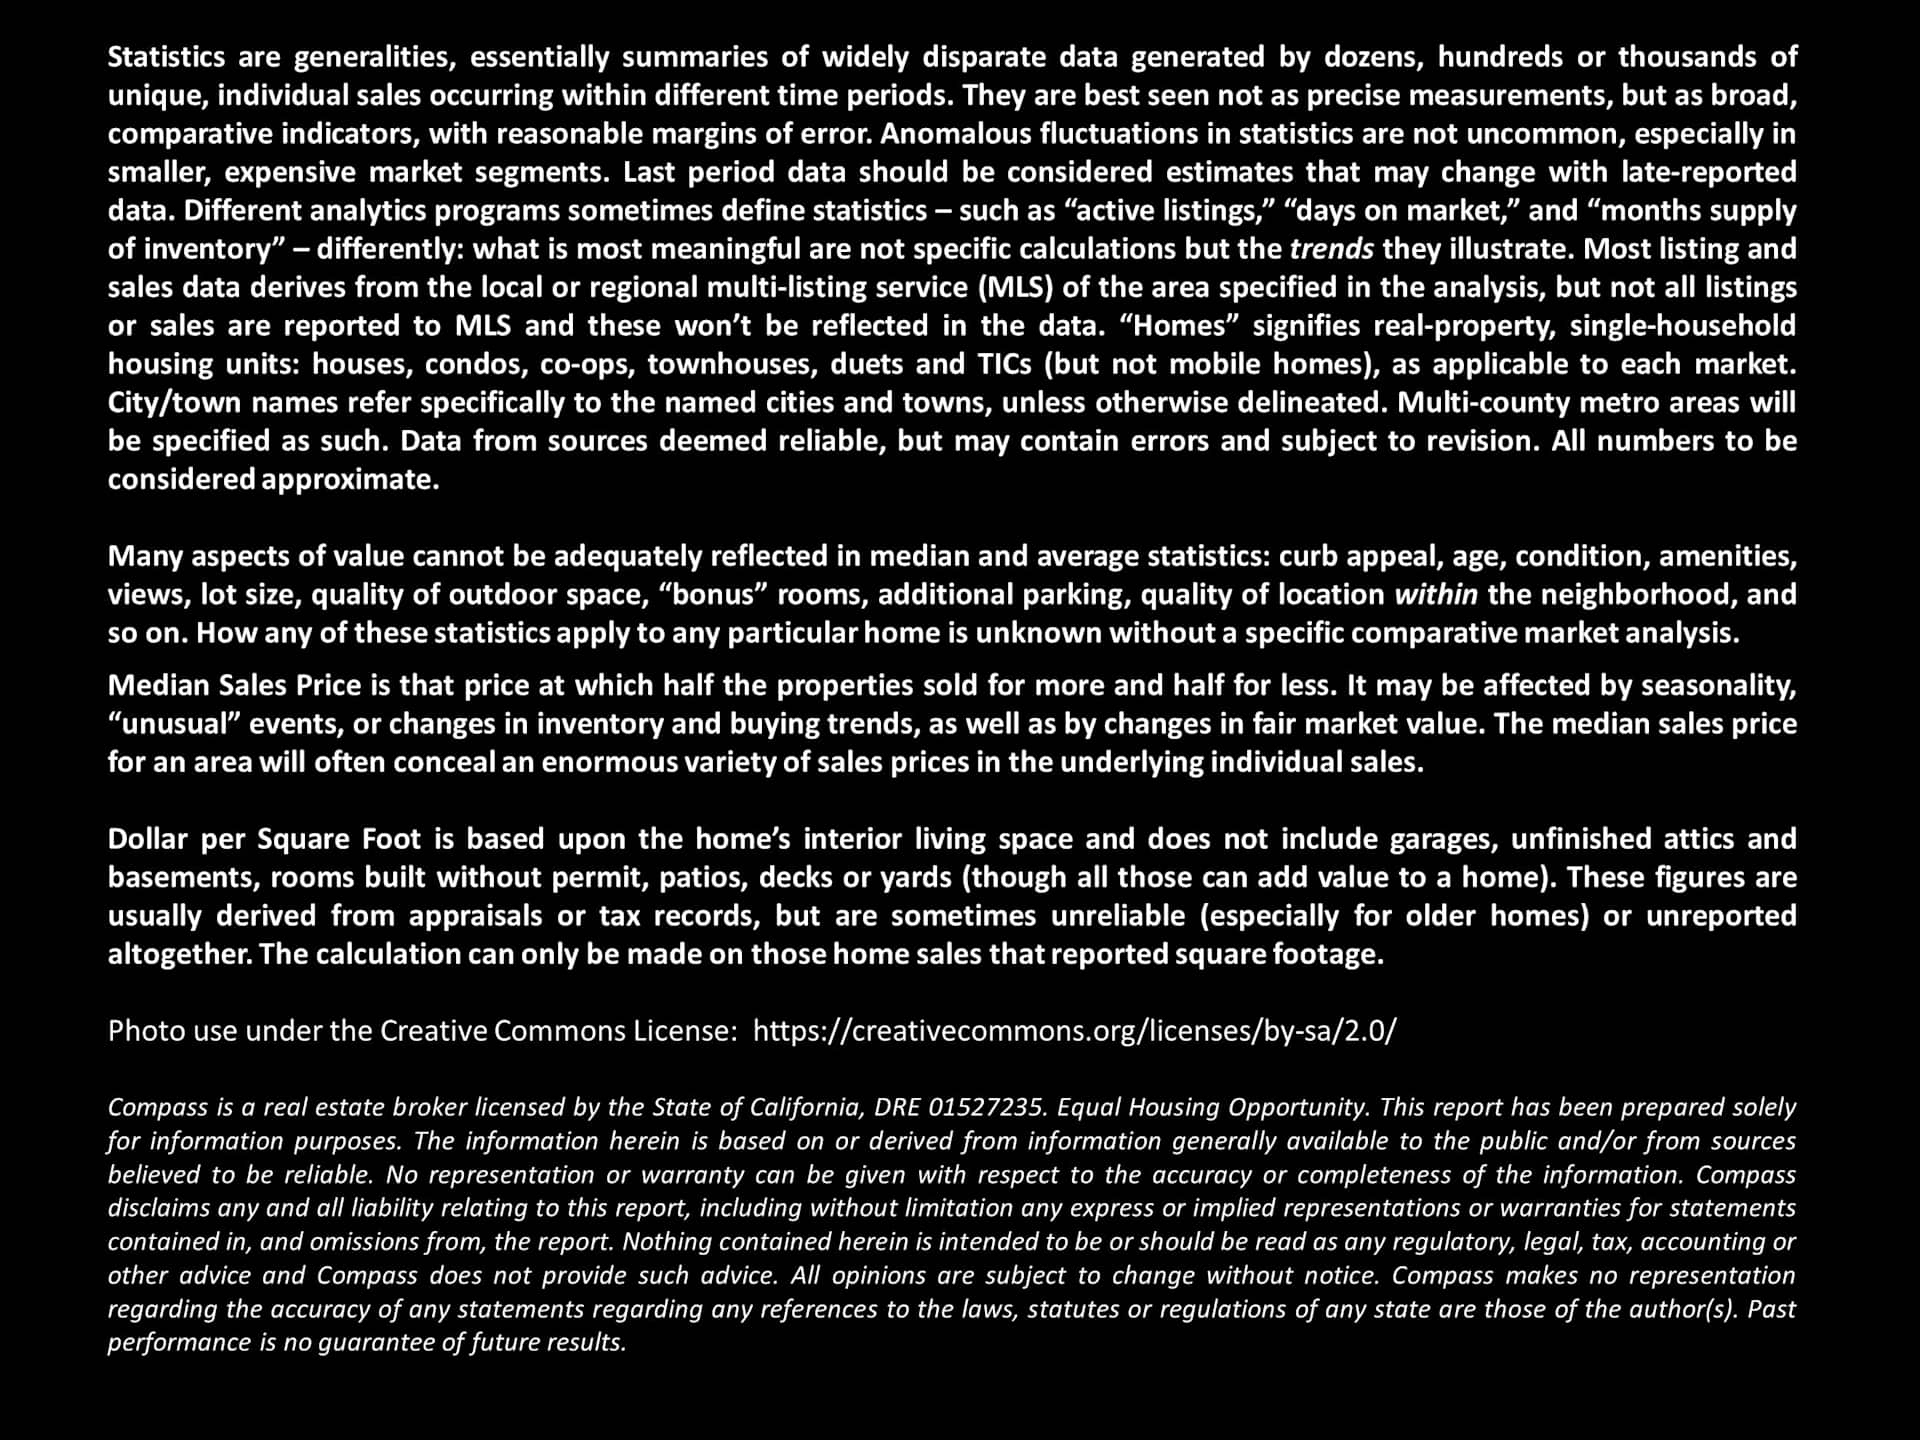
San Francisco real estate report highlights Q2 2024 home sales, listings, market conditions, and mortgage rates.Chart of mortgage rates since early 2023, peaking above 8% in October 2023 and reaching 7.03% in July 2024.Chart of the Nasdaq Composite Index from 1995 to 2024, with milestones marking the pandemic and 2023.Chart of San Francisco quarterly median house prices, 2012–2024, peaking at $2 million in Q2 2022.Chart of San Francisco condo median prices by quarter, 2012–2024, with Q2 2024 down about 2.5% year over year.Chart comparing San Francisco downtown and non-downtown median condo prices from 2005 through June 2024.San Francisco home values per square foot, 2005–2024, with condo columns and a house-price line.Bar chart comparing annual median home sale prices from 2012–2024 in San Francisco Districts 10, 3, 2, and 9.Bar chart comparing annual median San Francisco home sale prices across four Realtor districts, 2012–2024.Bar chart comparing San Francisco condo median sale prices by district from 2012 to 2024.Chart comparing San Francisco year-to-date home sales by property type from 2019 to 2024.Chart of San Francisco home sales over list price by quarter, 2018–2024, with a 58% reading for Q2 2024.Chart of San Francisco house and condo sale-to-list price percentages by quarter, 2018–2024.Chart of San Francisco new listings from December 2019 to June 2024, showing seasonal September peaks and winter lows.Bar chart of San Francisco active and coming-soon home listings, February 2022 to July 2024.San Francisco listings-under-contract chart, showing seasonal fluctuations and a spring 2024 high.Chart of San Francisco listing absorption rates by quarter, with house rates in green and condo rates in a white line.Bar chart of monthly San Francisco home sales from January 2020 through June 2024.San Francisco rolling home-sale totals, with labeled booms, downturns, and a sharp pandemic-era spike.Chart comparing quarterly San Francisco sales of higher-priced houses and condos from 2018 through Q2 2024.Monthly chart of San Francisco luxury home sales of $5 million or more, January 2019–June 2024.Chart comparing San Francisco house and condo average days on market from 2019 to 2024.Chart of San Francisco active-listing price reductions, with monthly totals from 2018 through June 2024.Chart comparing San Francisco population by age group from 2020 to 2023, with declines in most groups and growth among residents 65 and older.Chart of San Francisco employment from 2000 to May 2024, showing a sharp 2020 decline and incomplete recovery.Real estate market statistics definitions and report disclaimers.

Work With Us

We will help you understand the complex aspects of the transaction and share our expertise so that you can make the best decisions possible. We are experienced, market savvy, and energetic. With both of us working for our clients, you get twice the amount of attention and insight.