
The SF Team, Eva + James, Compass

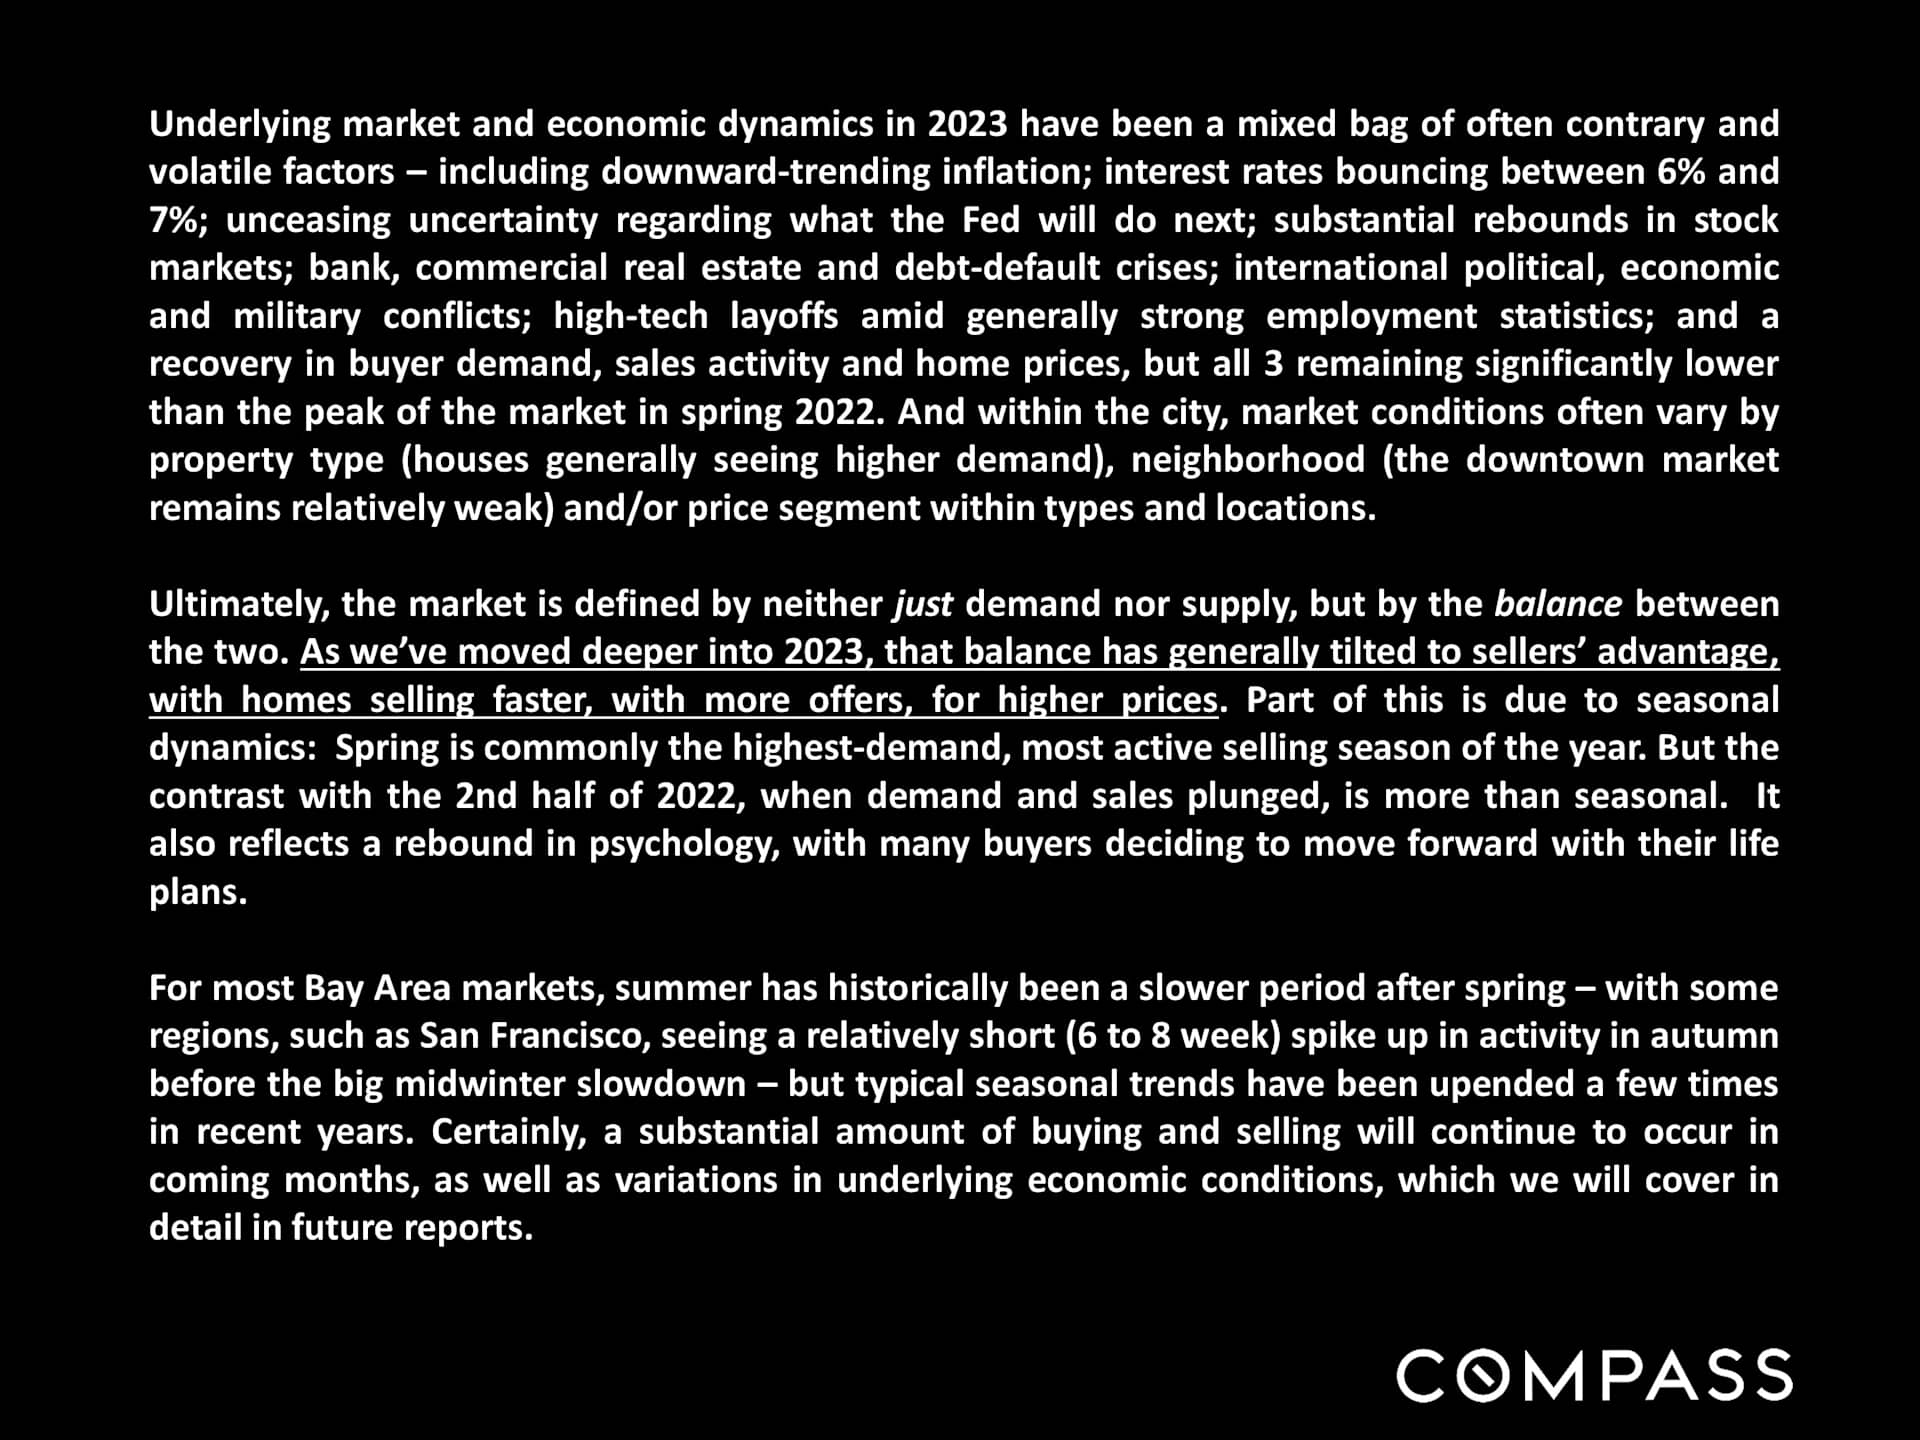
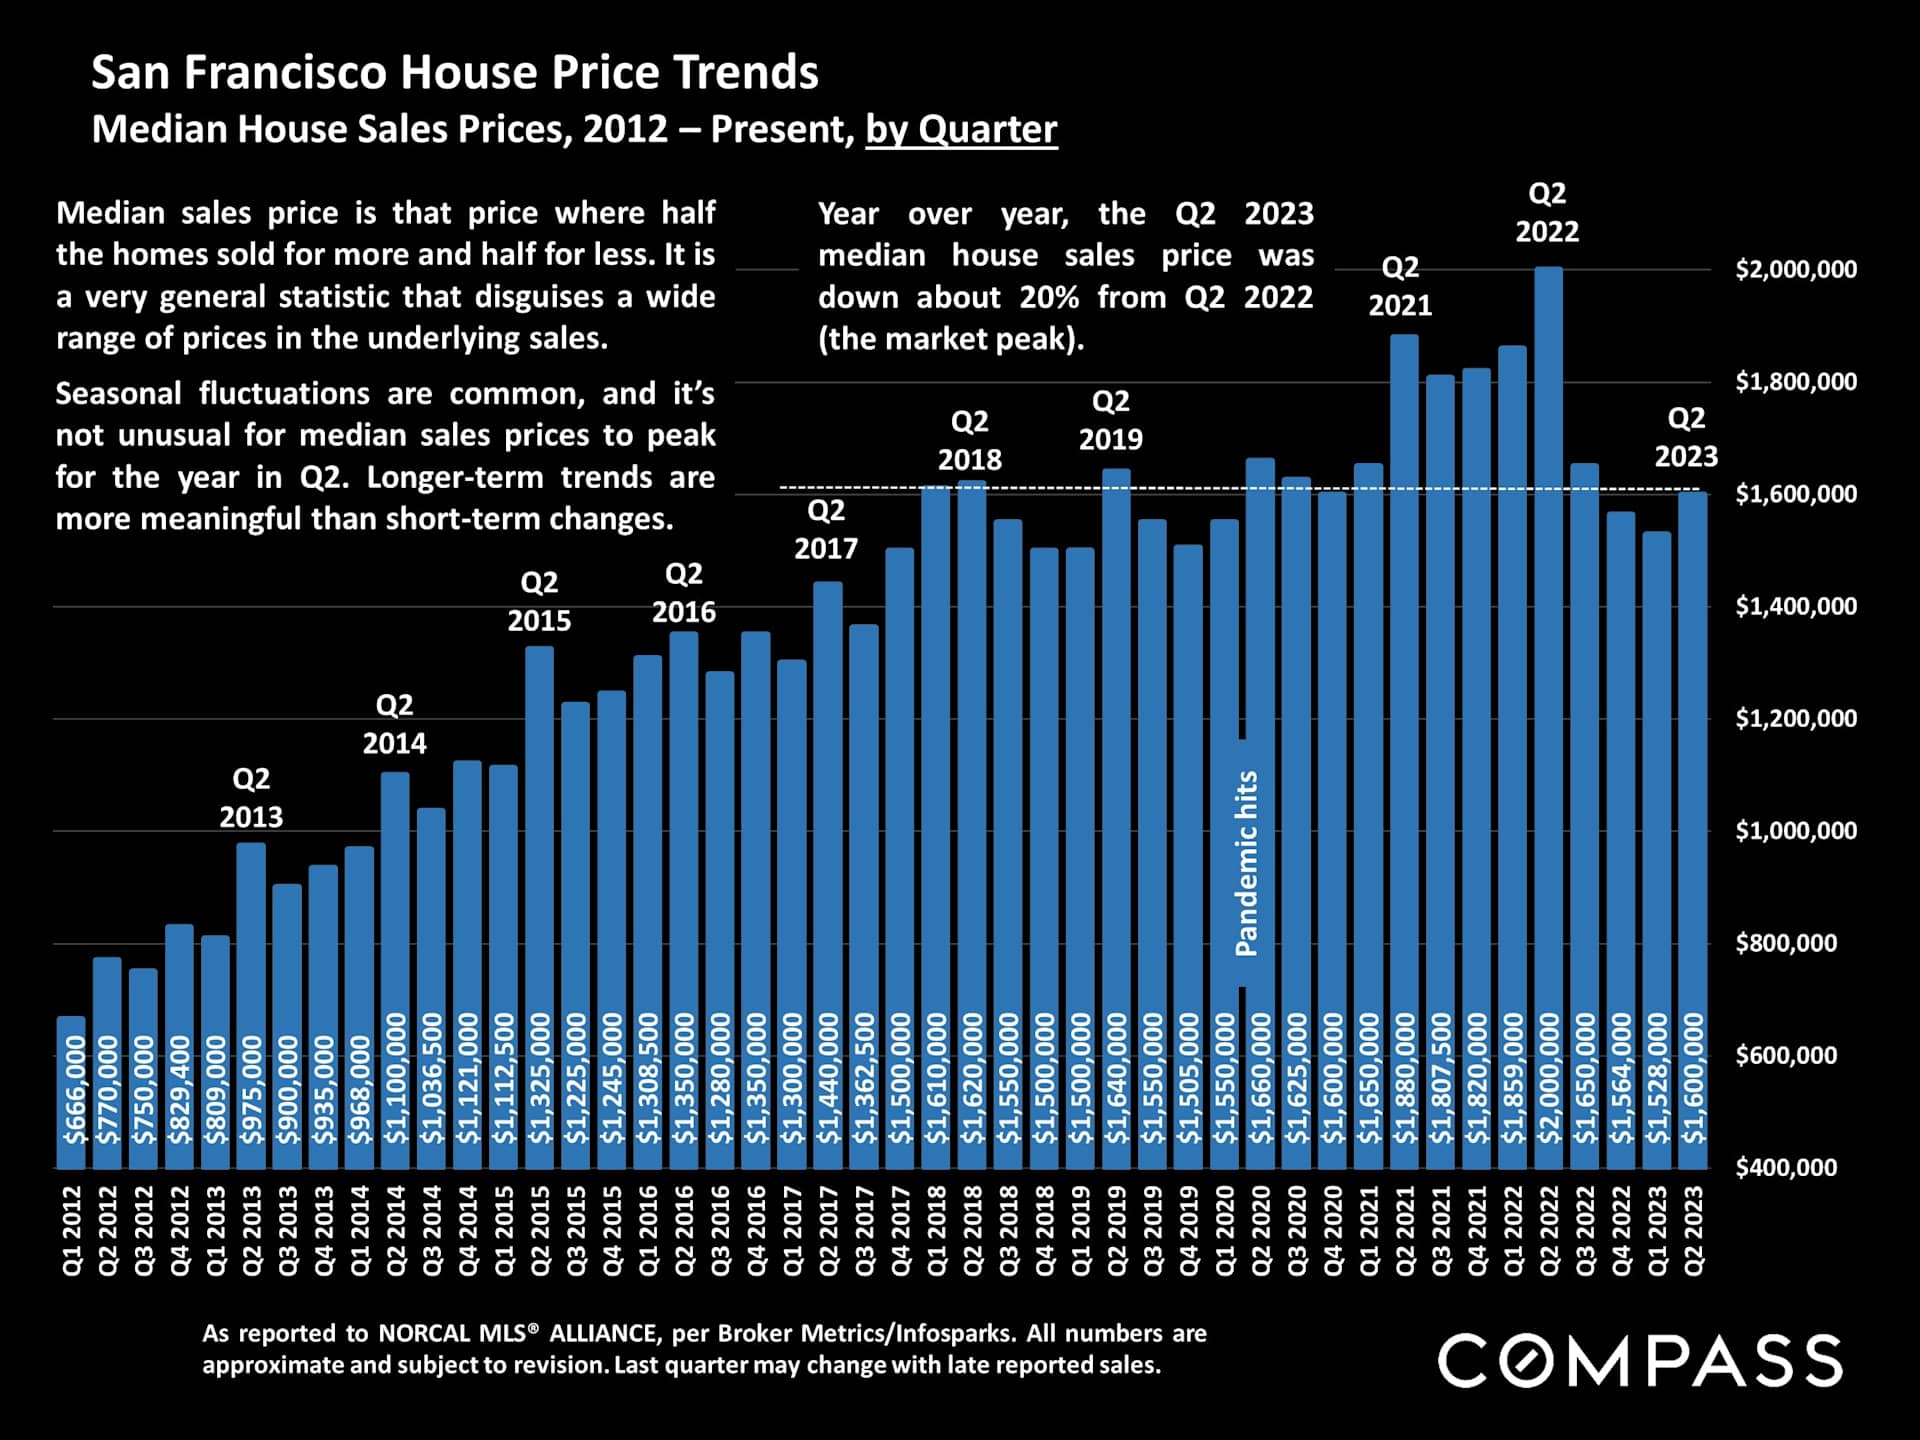
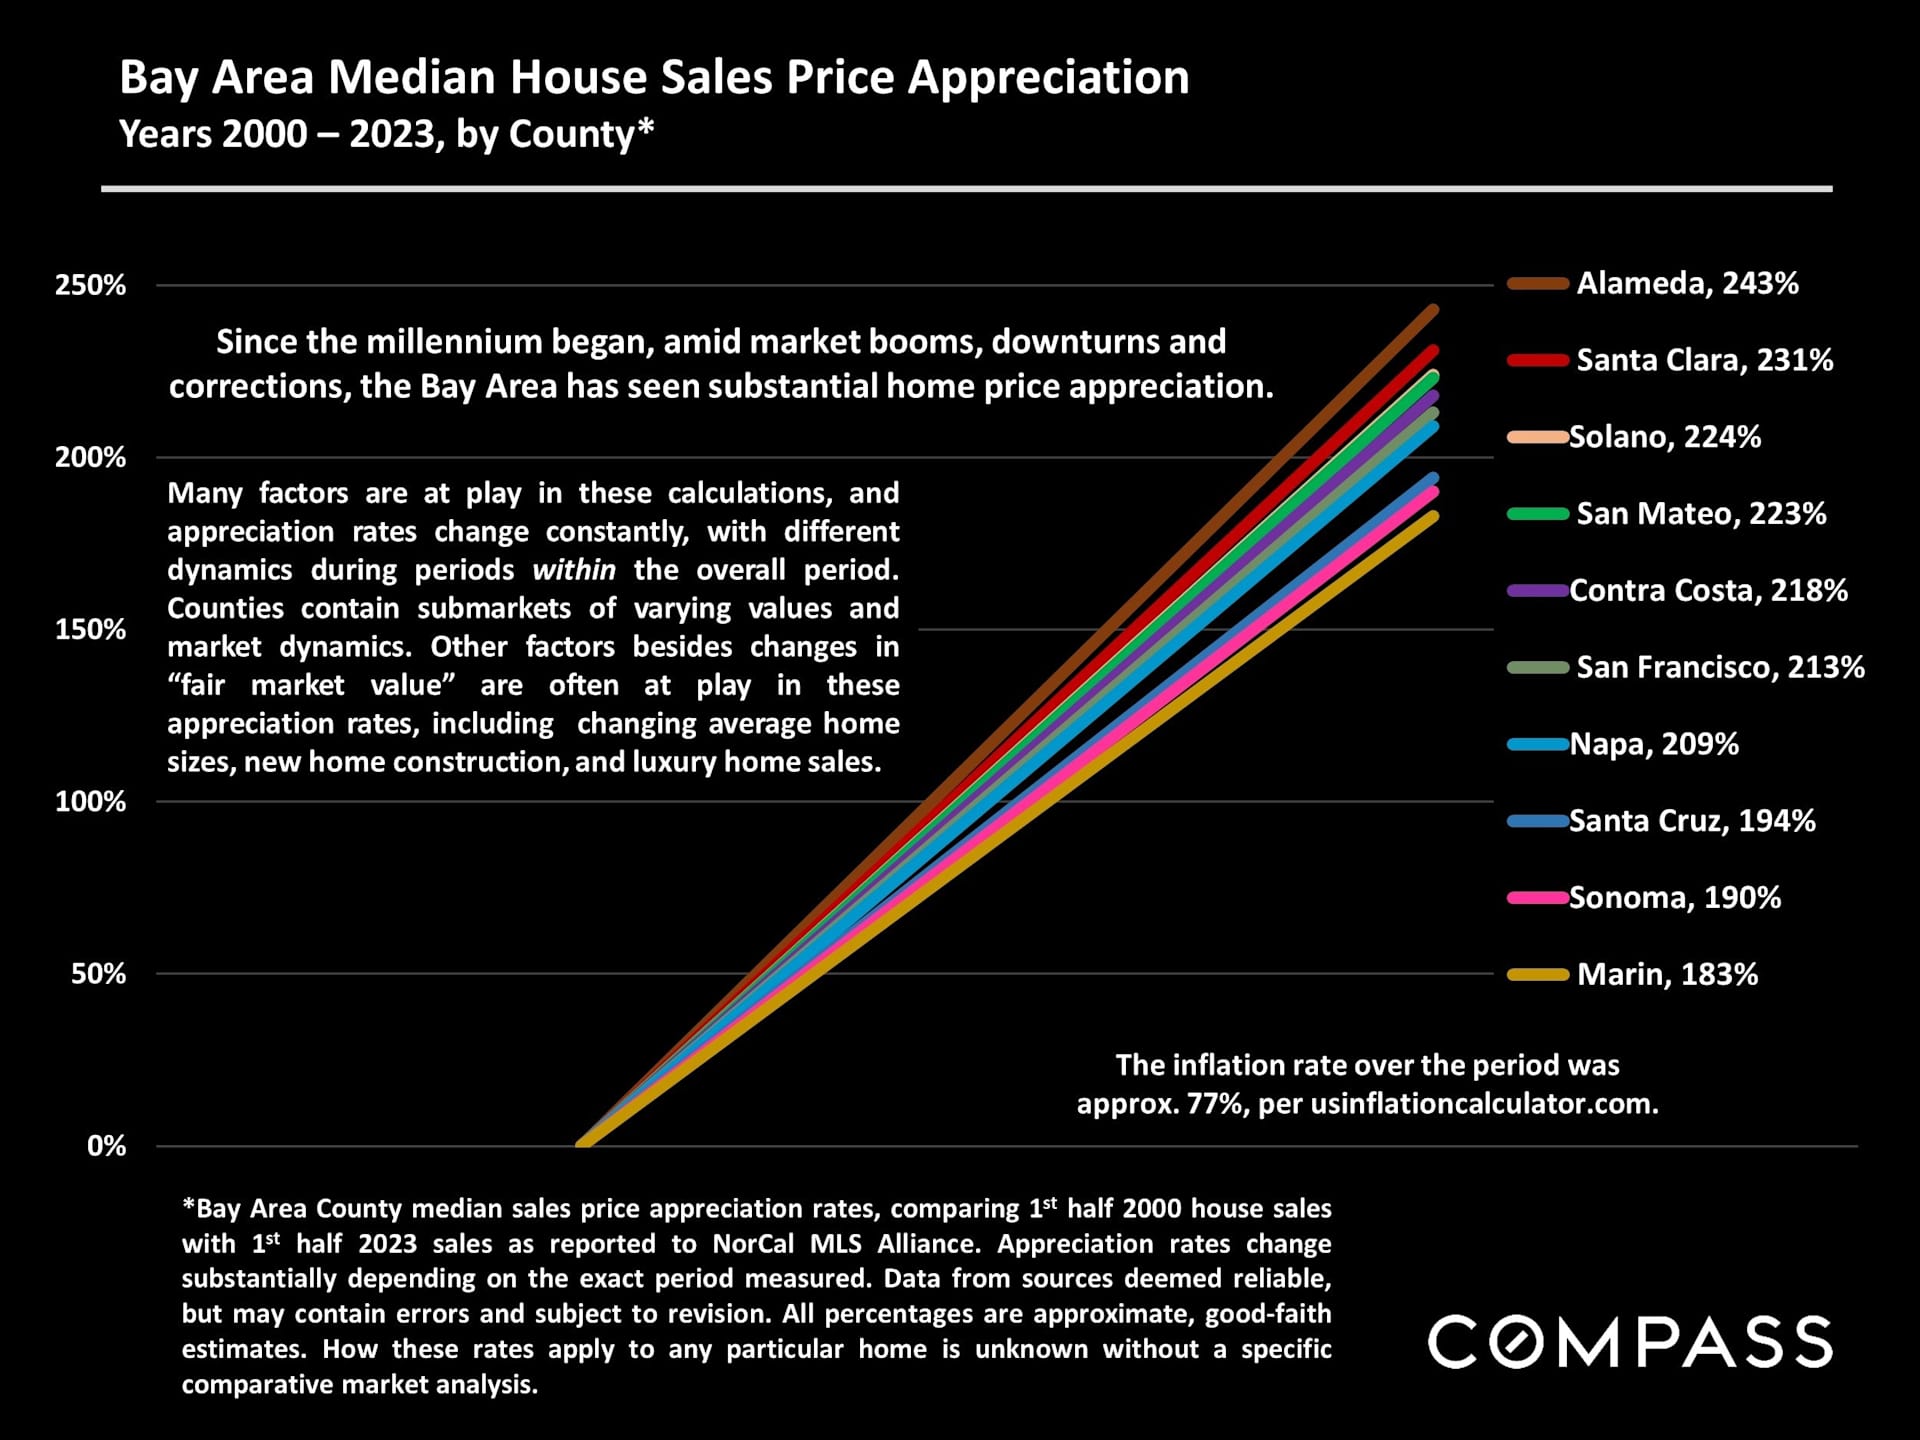
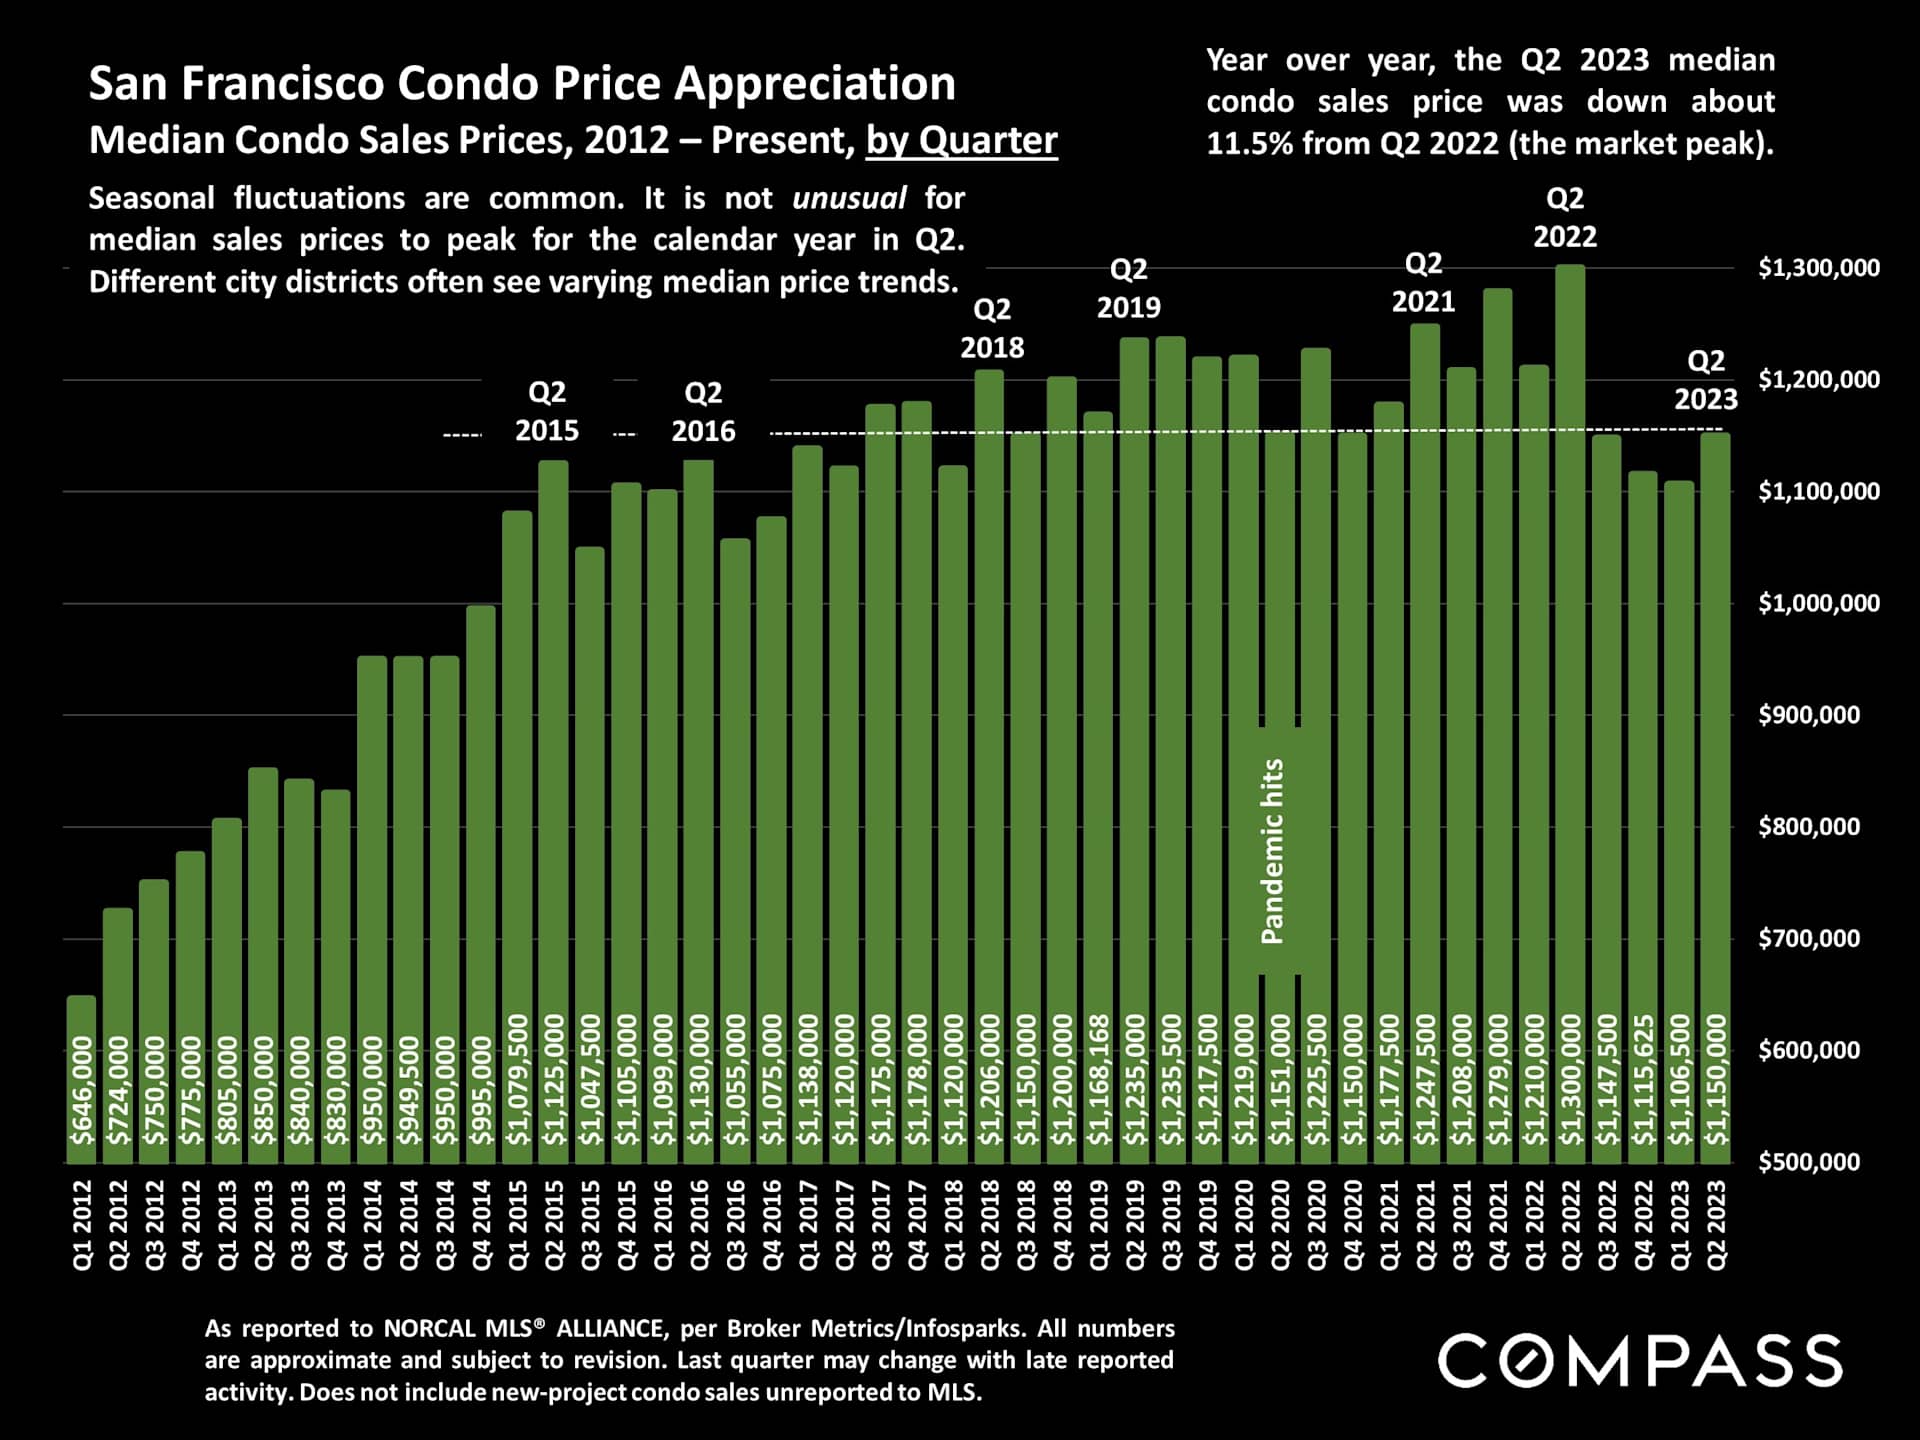
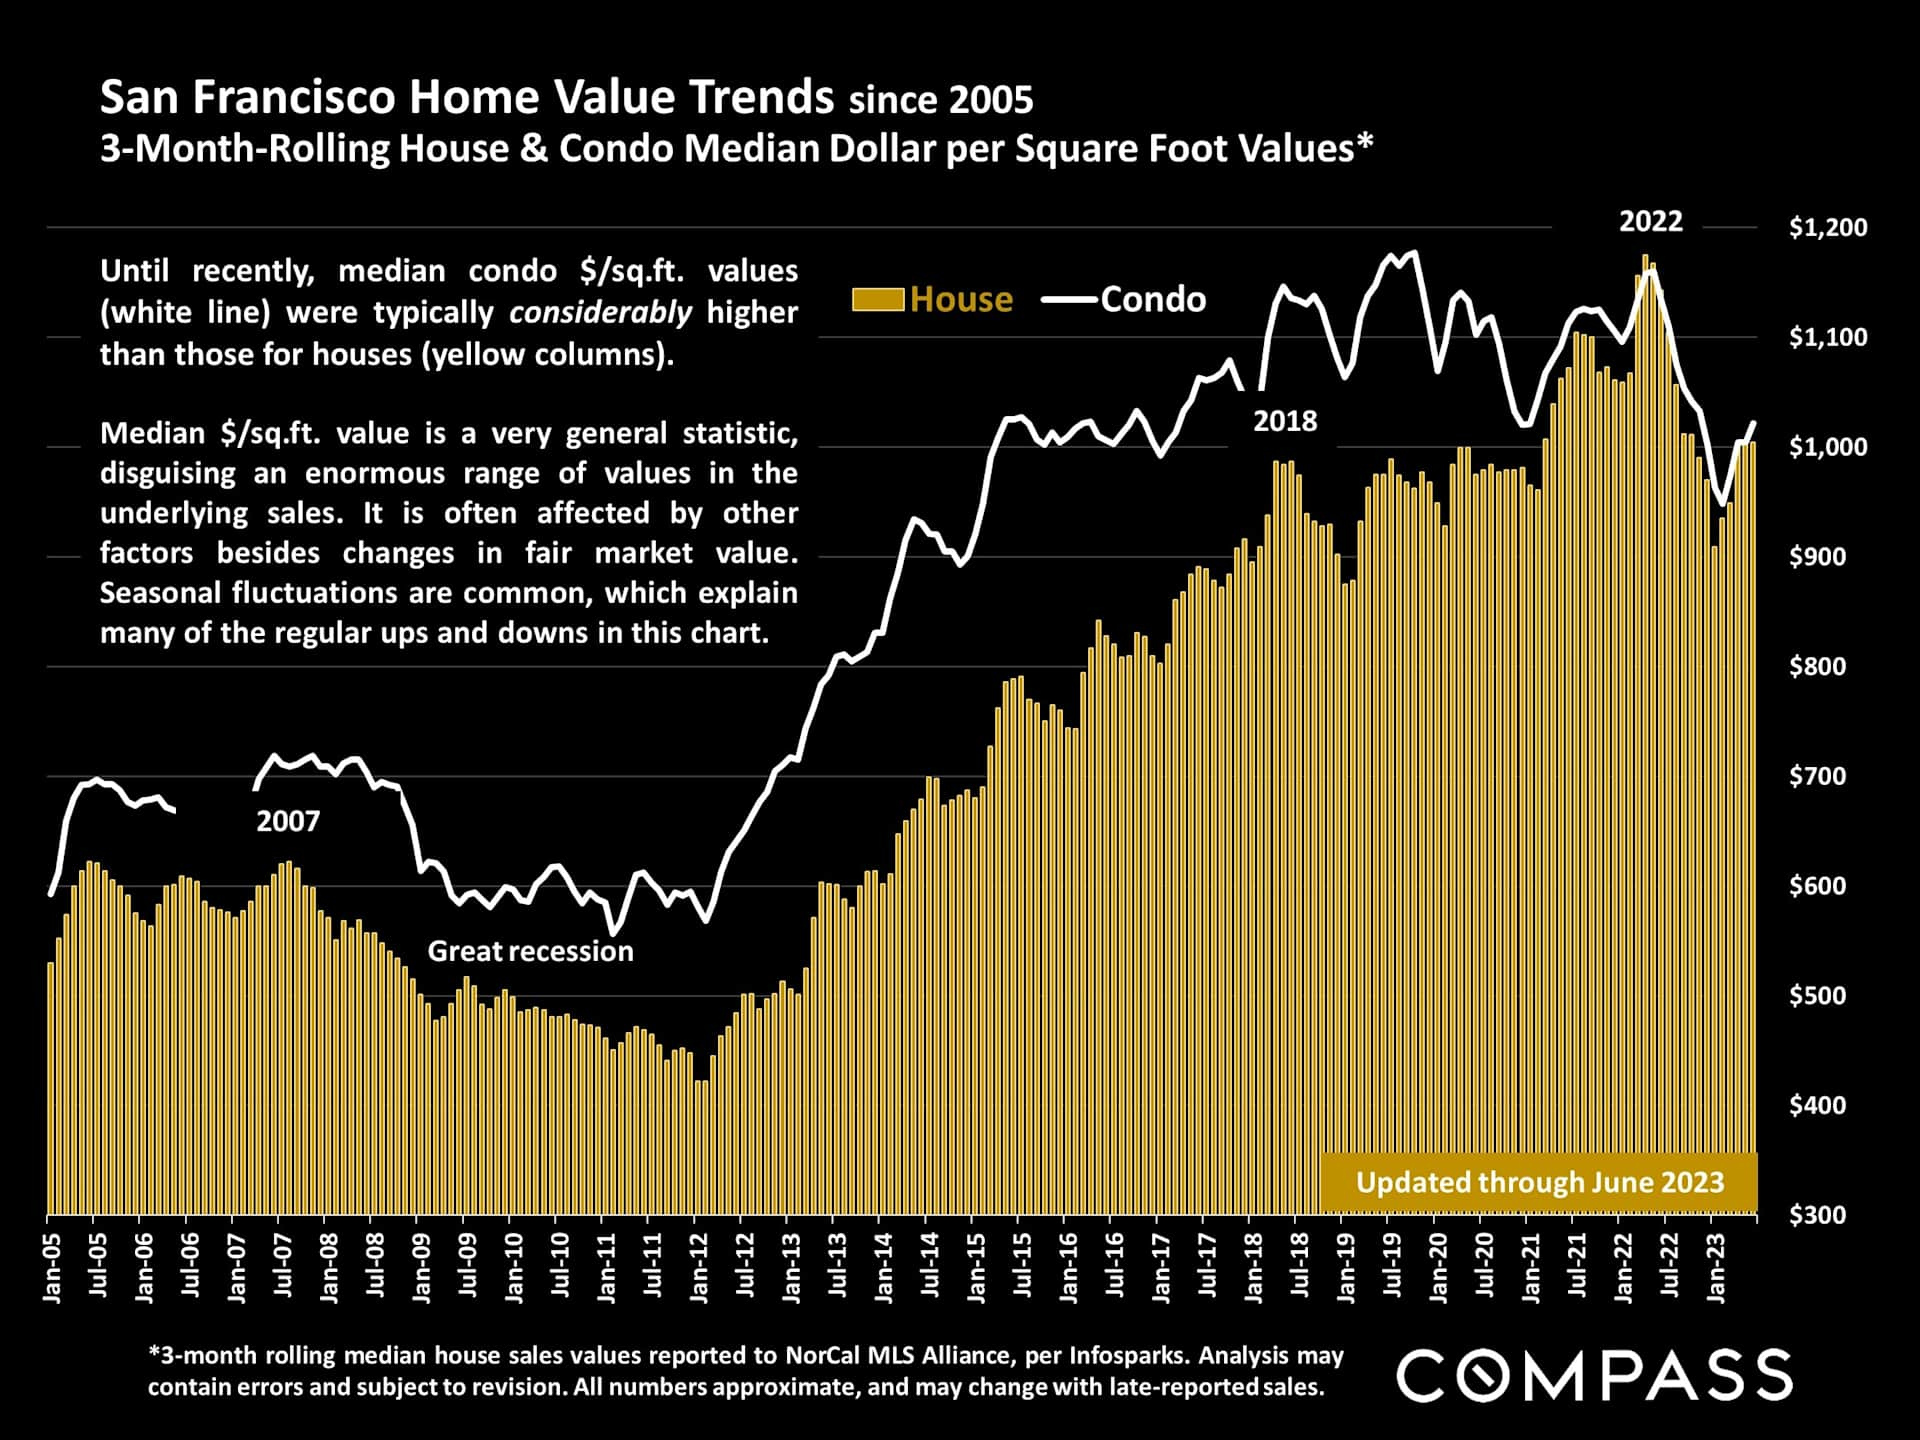
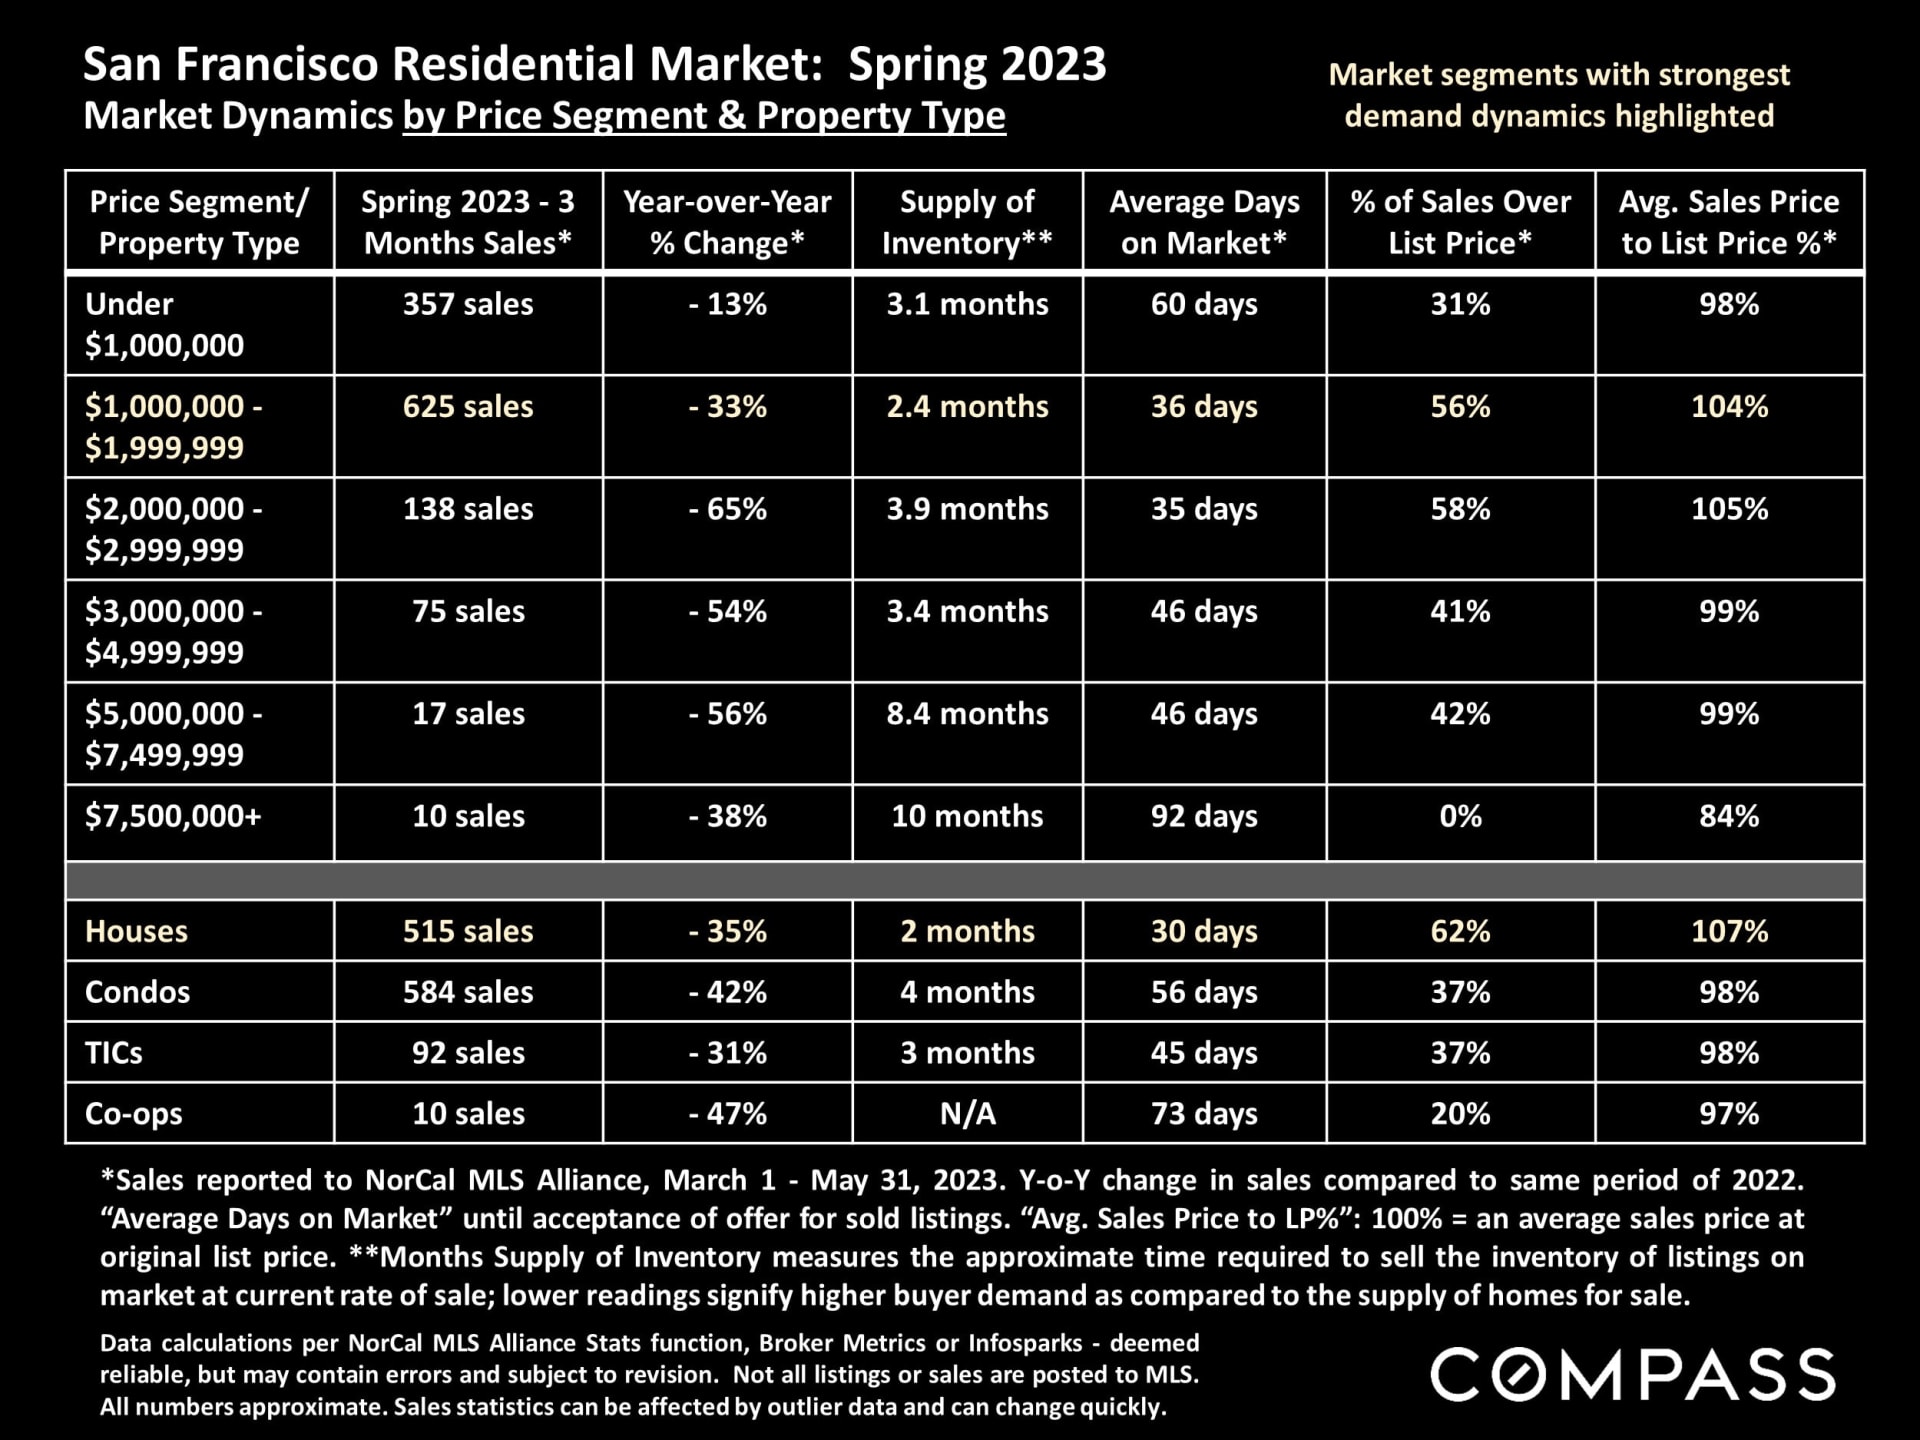
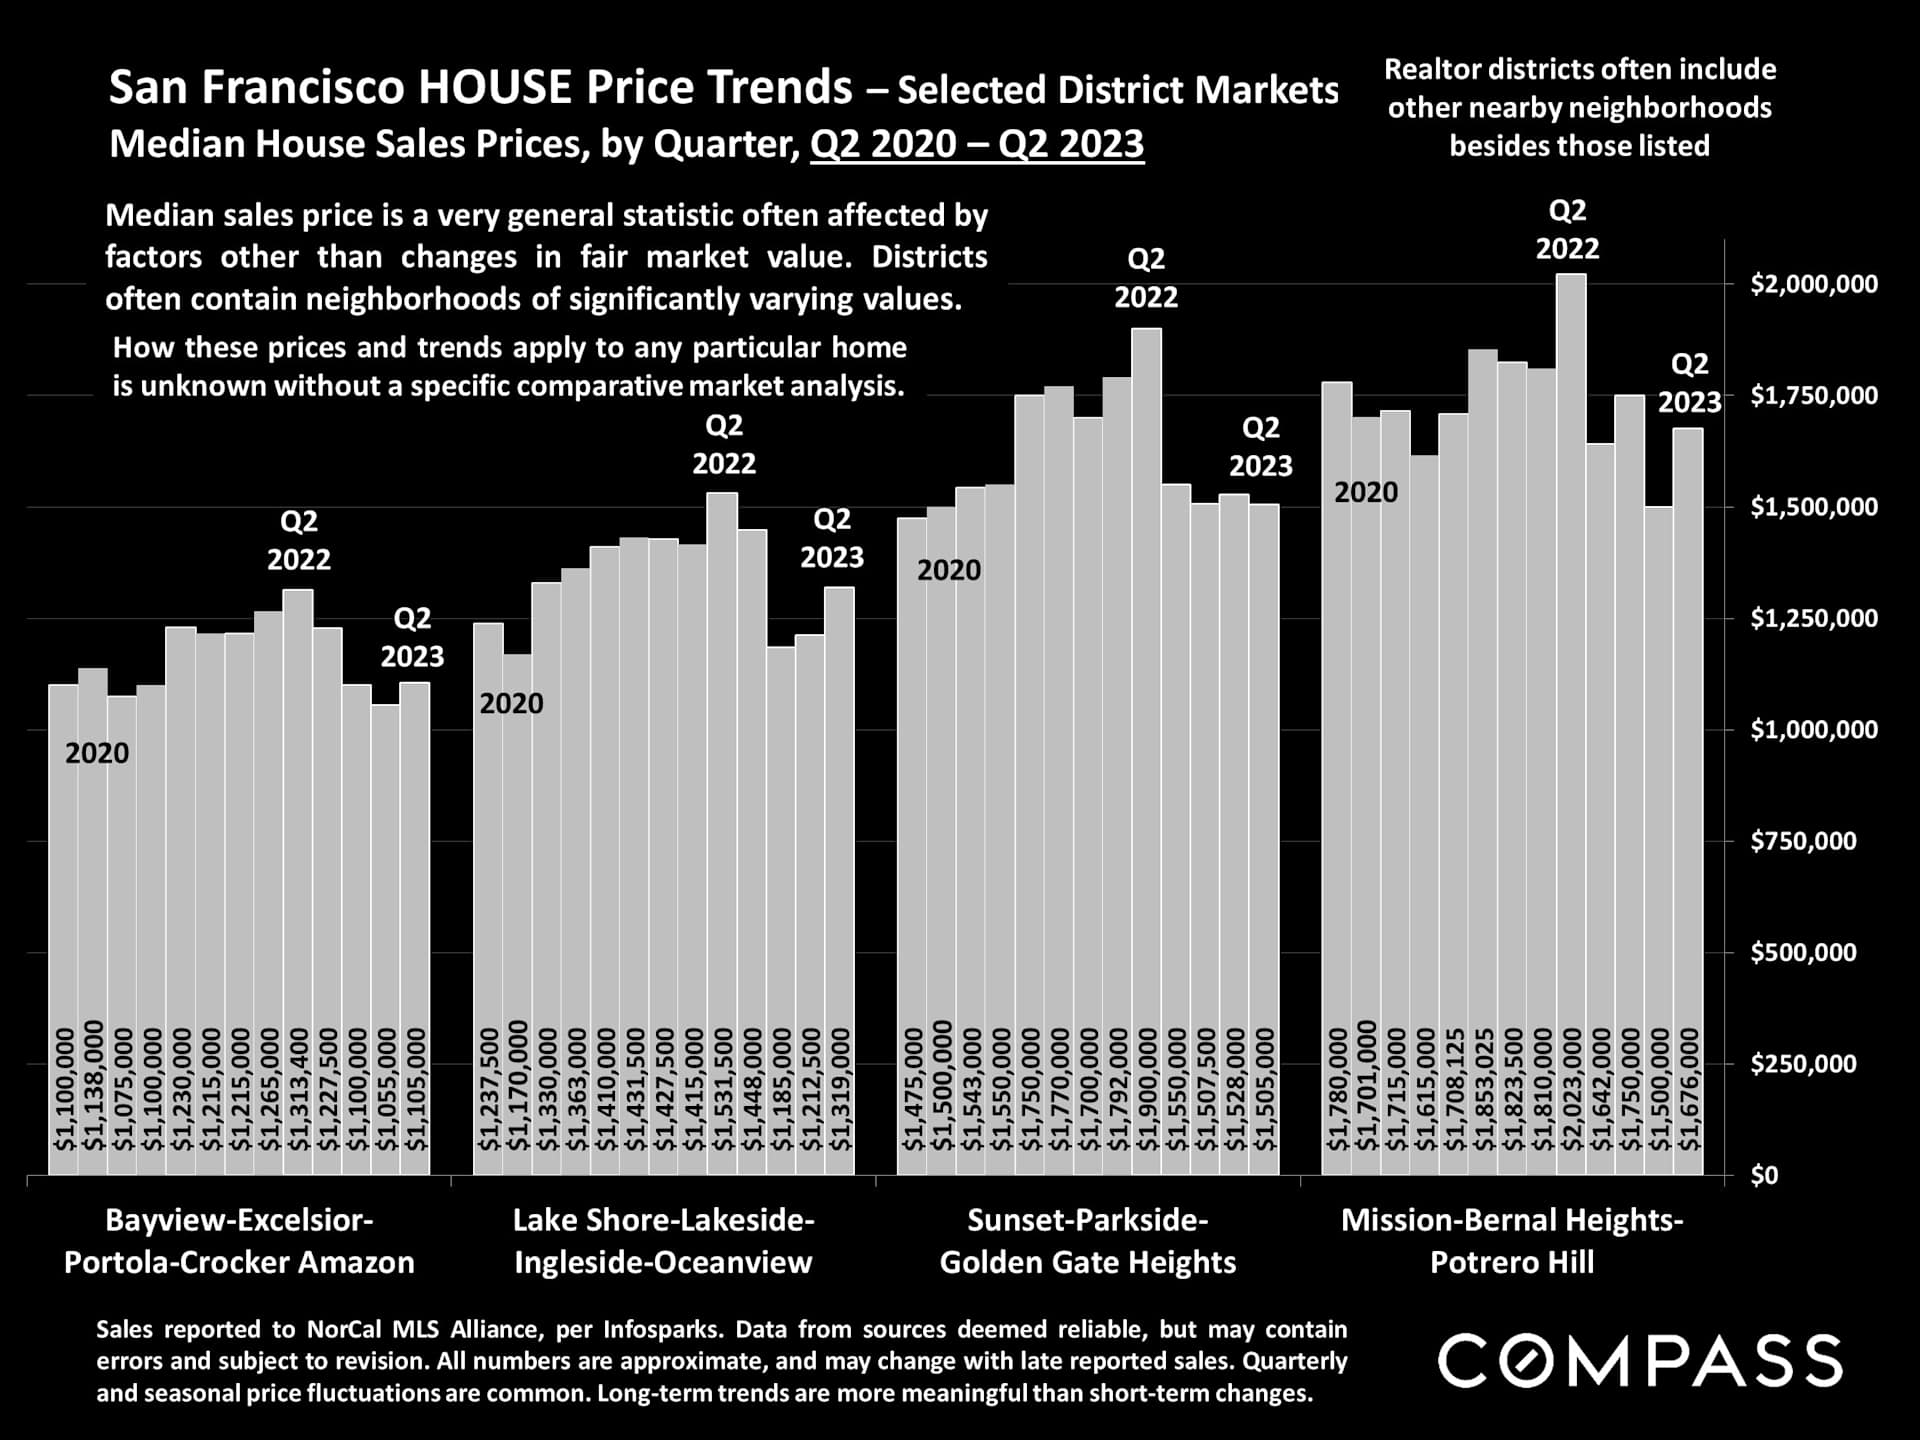
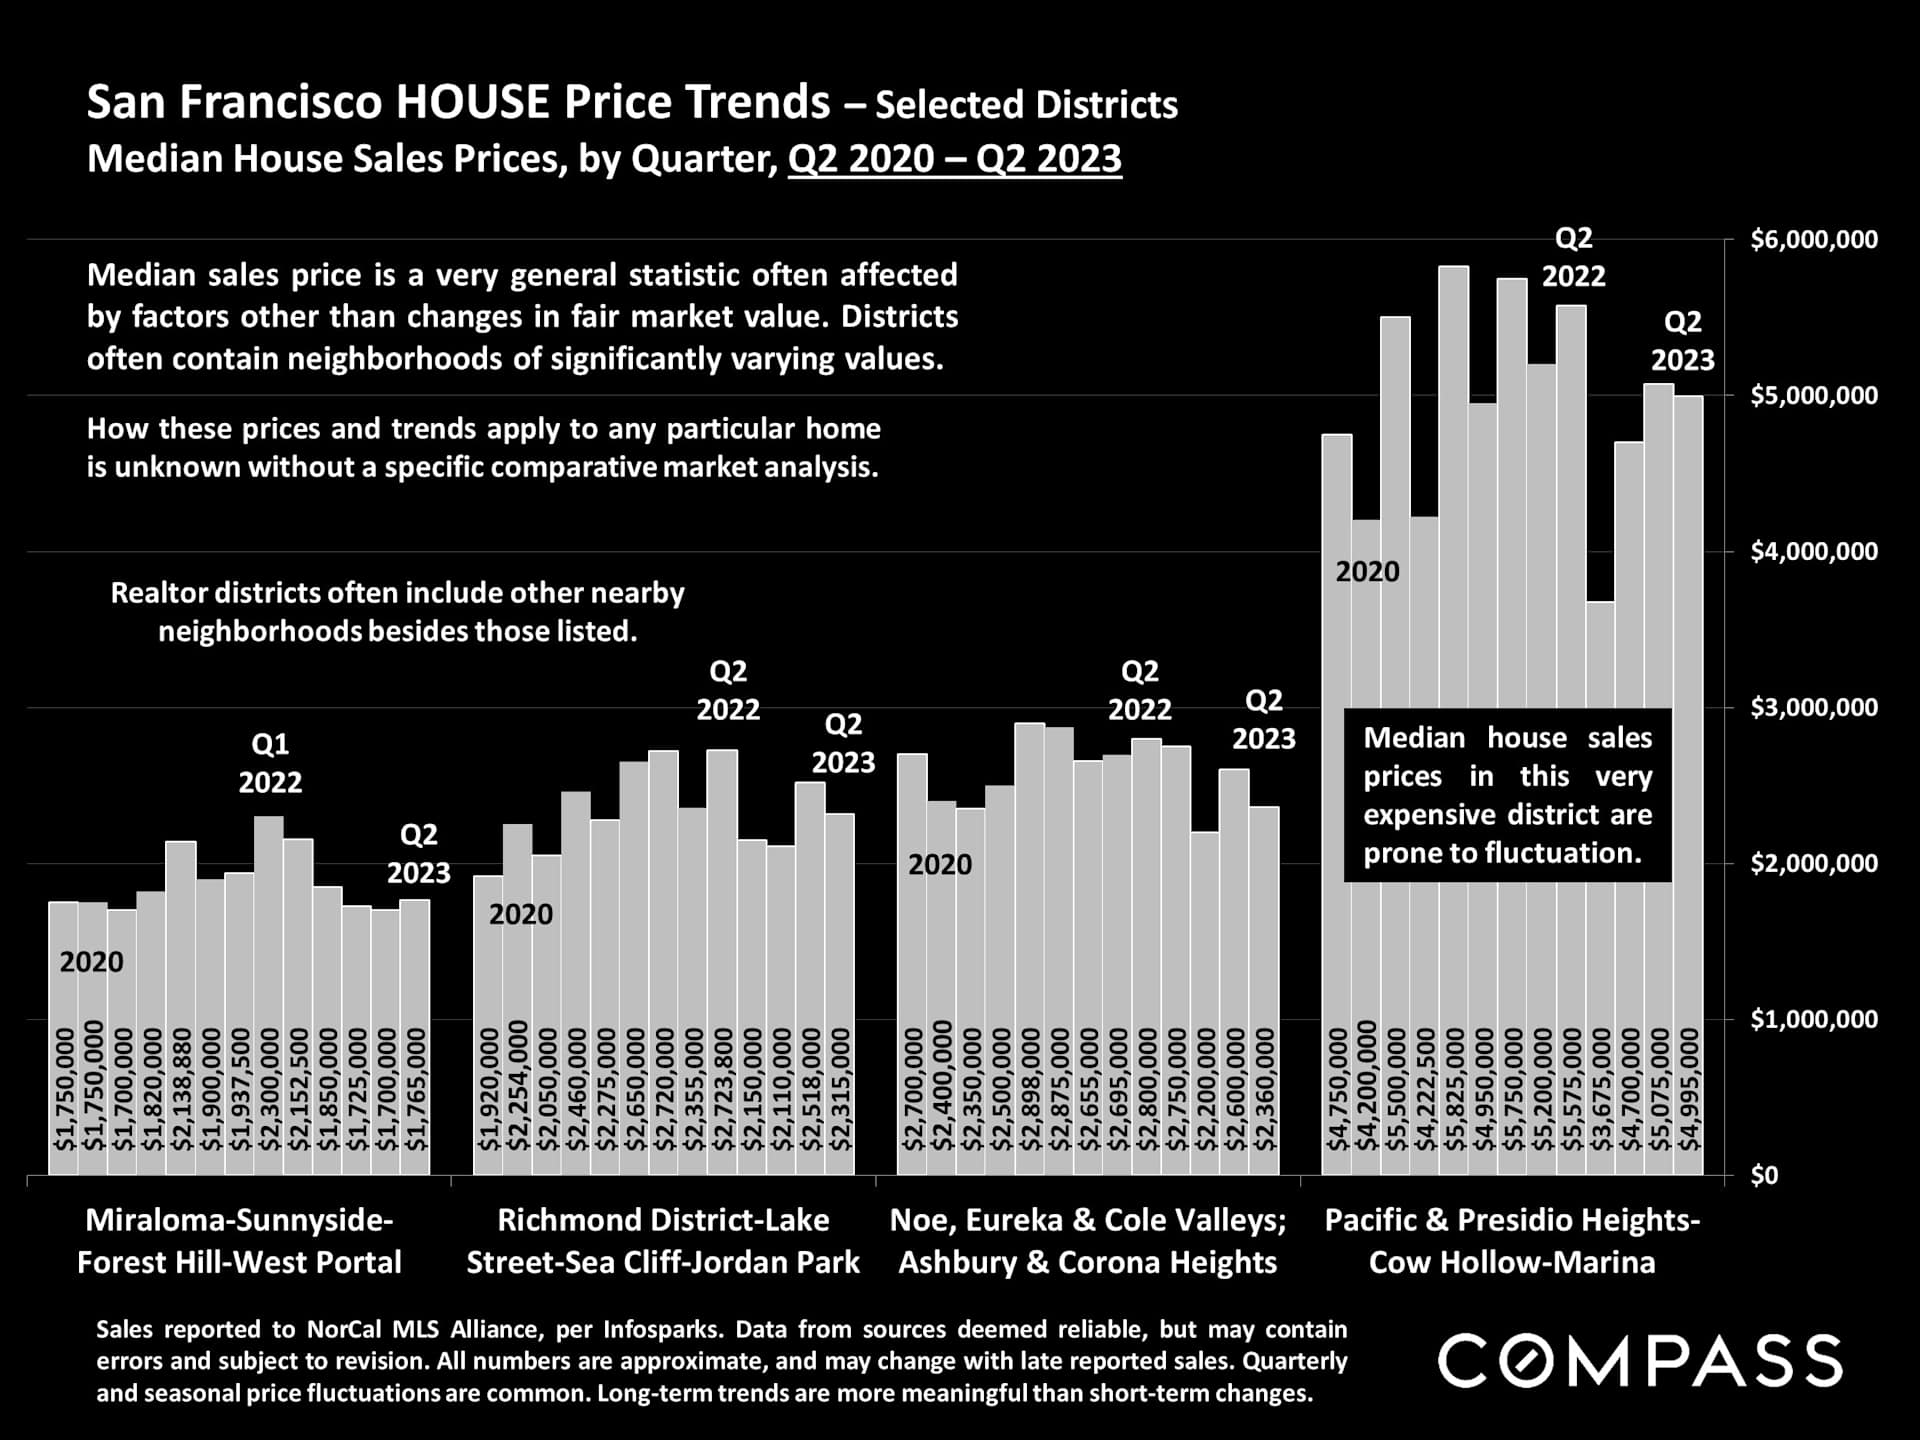
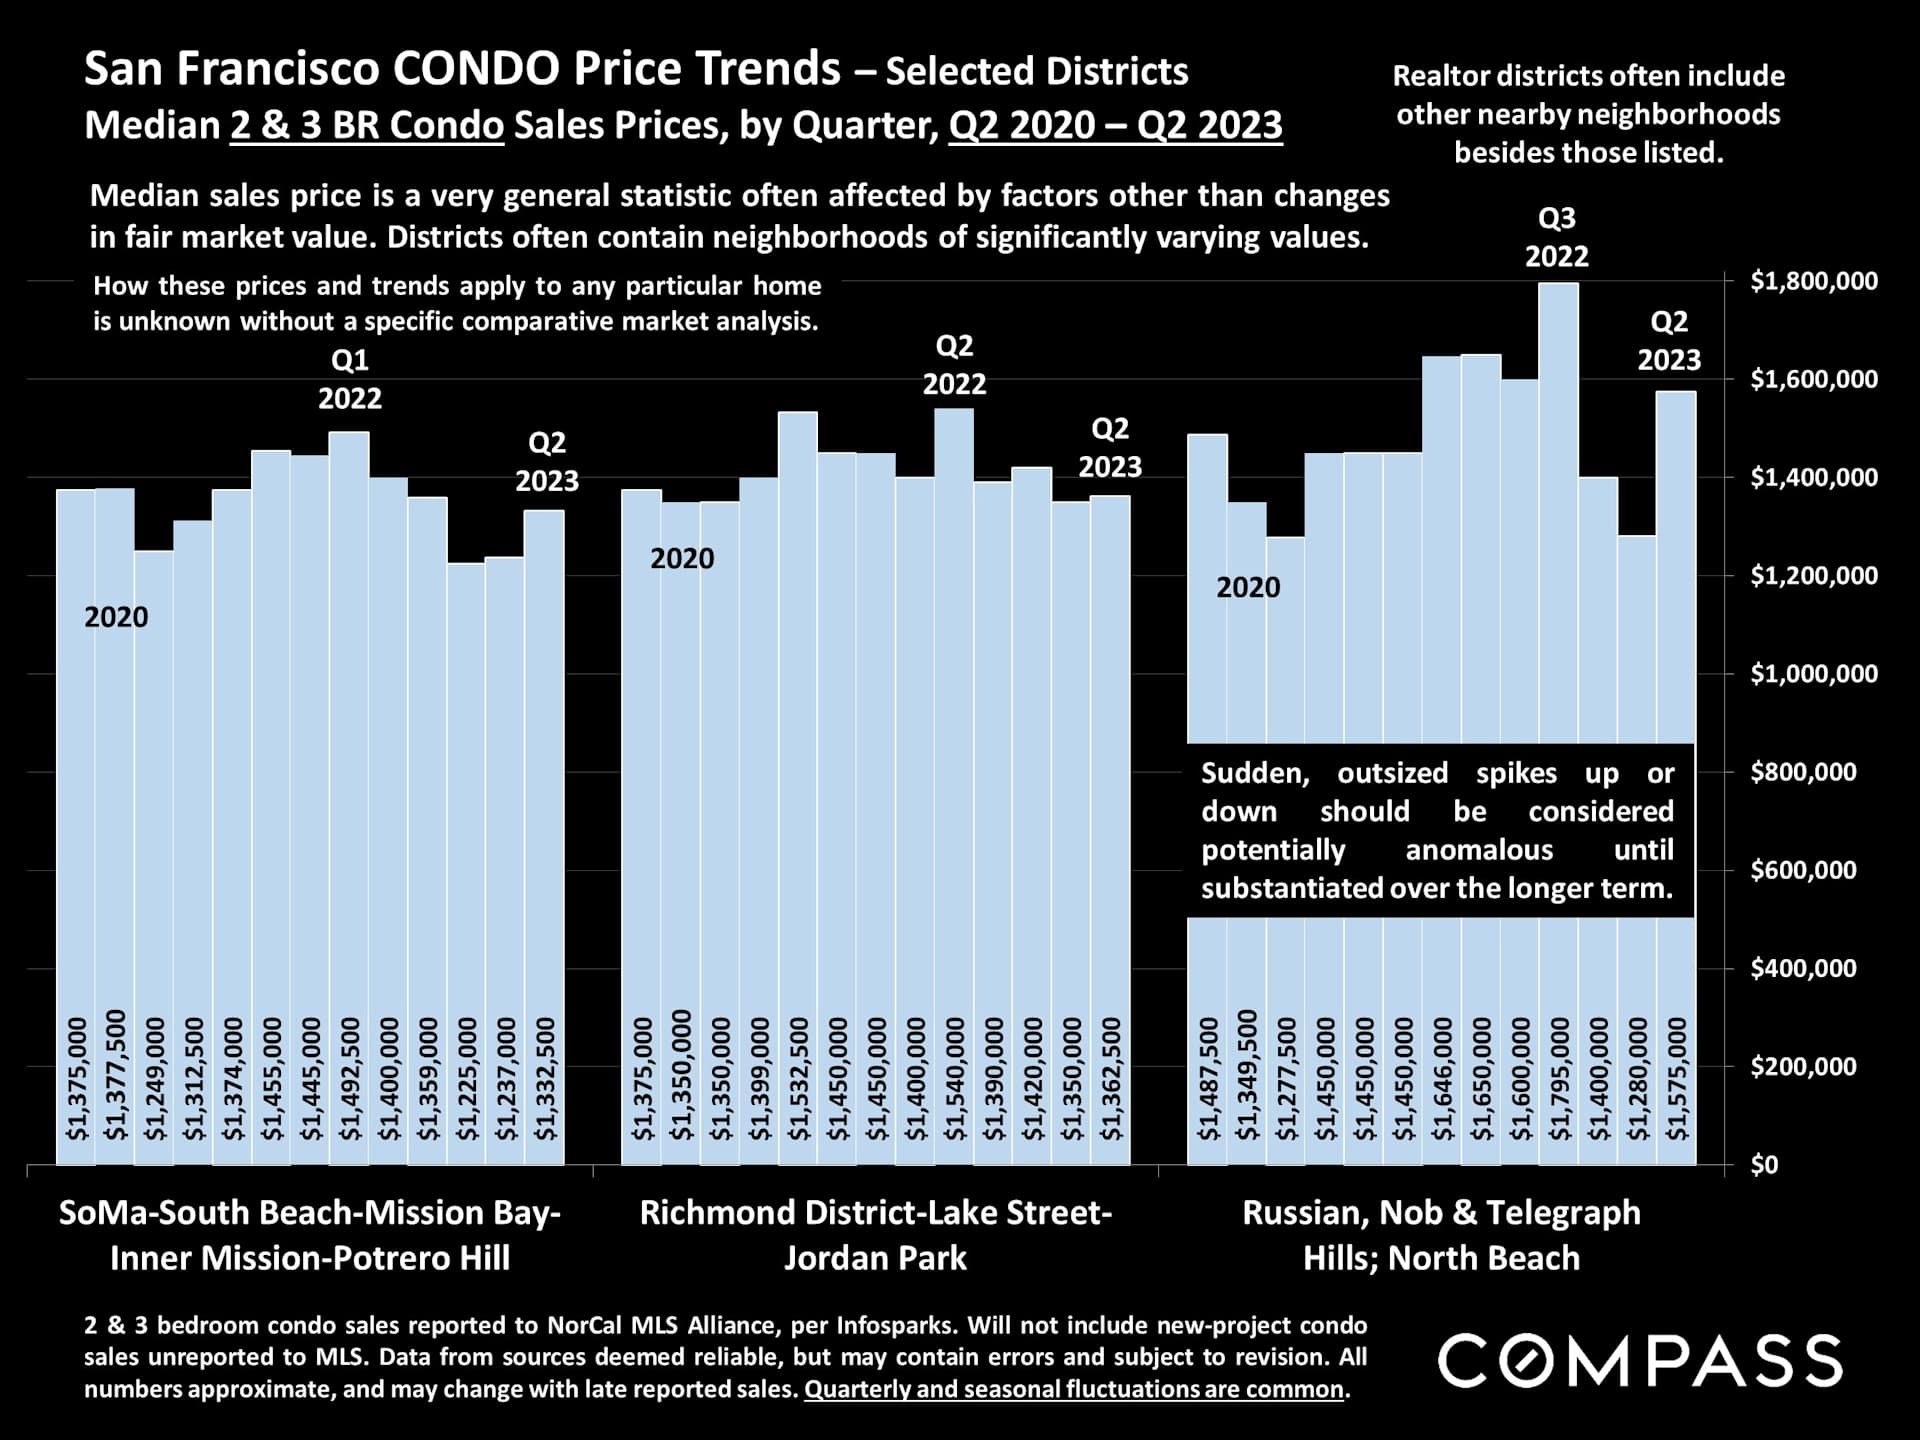
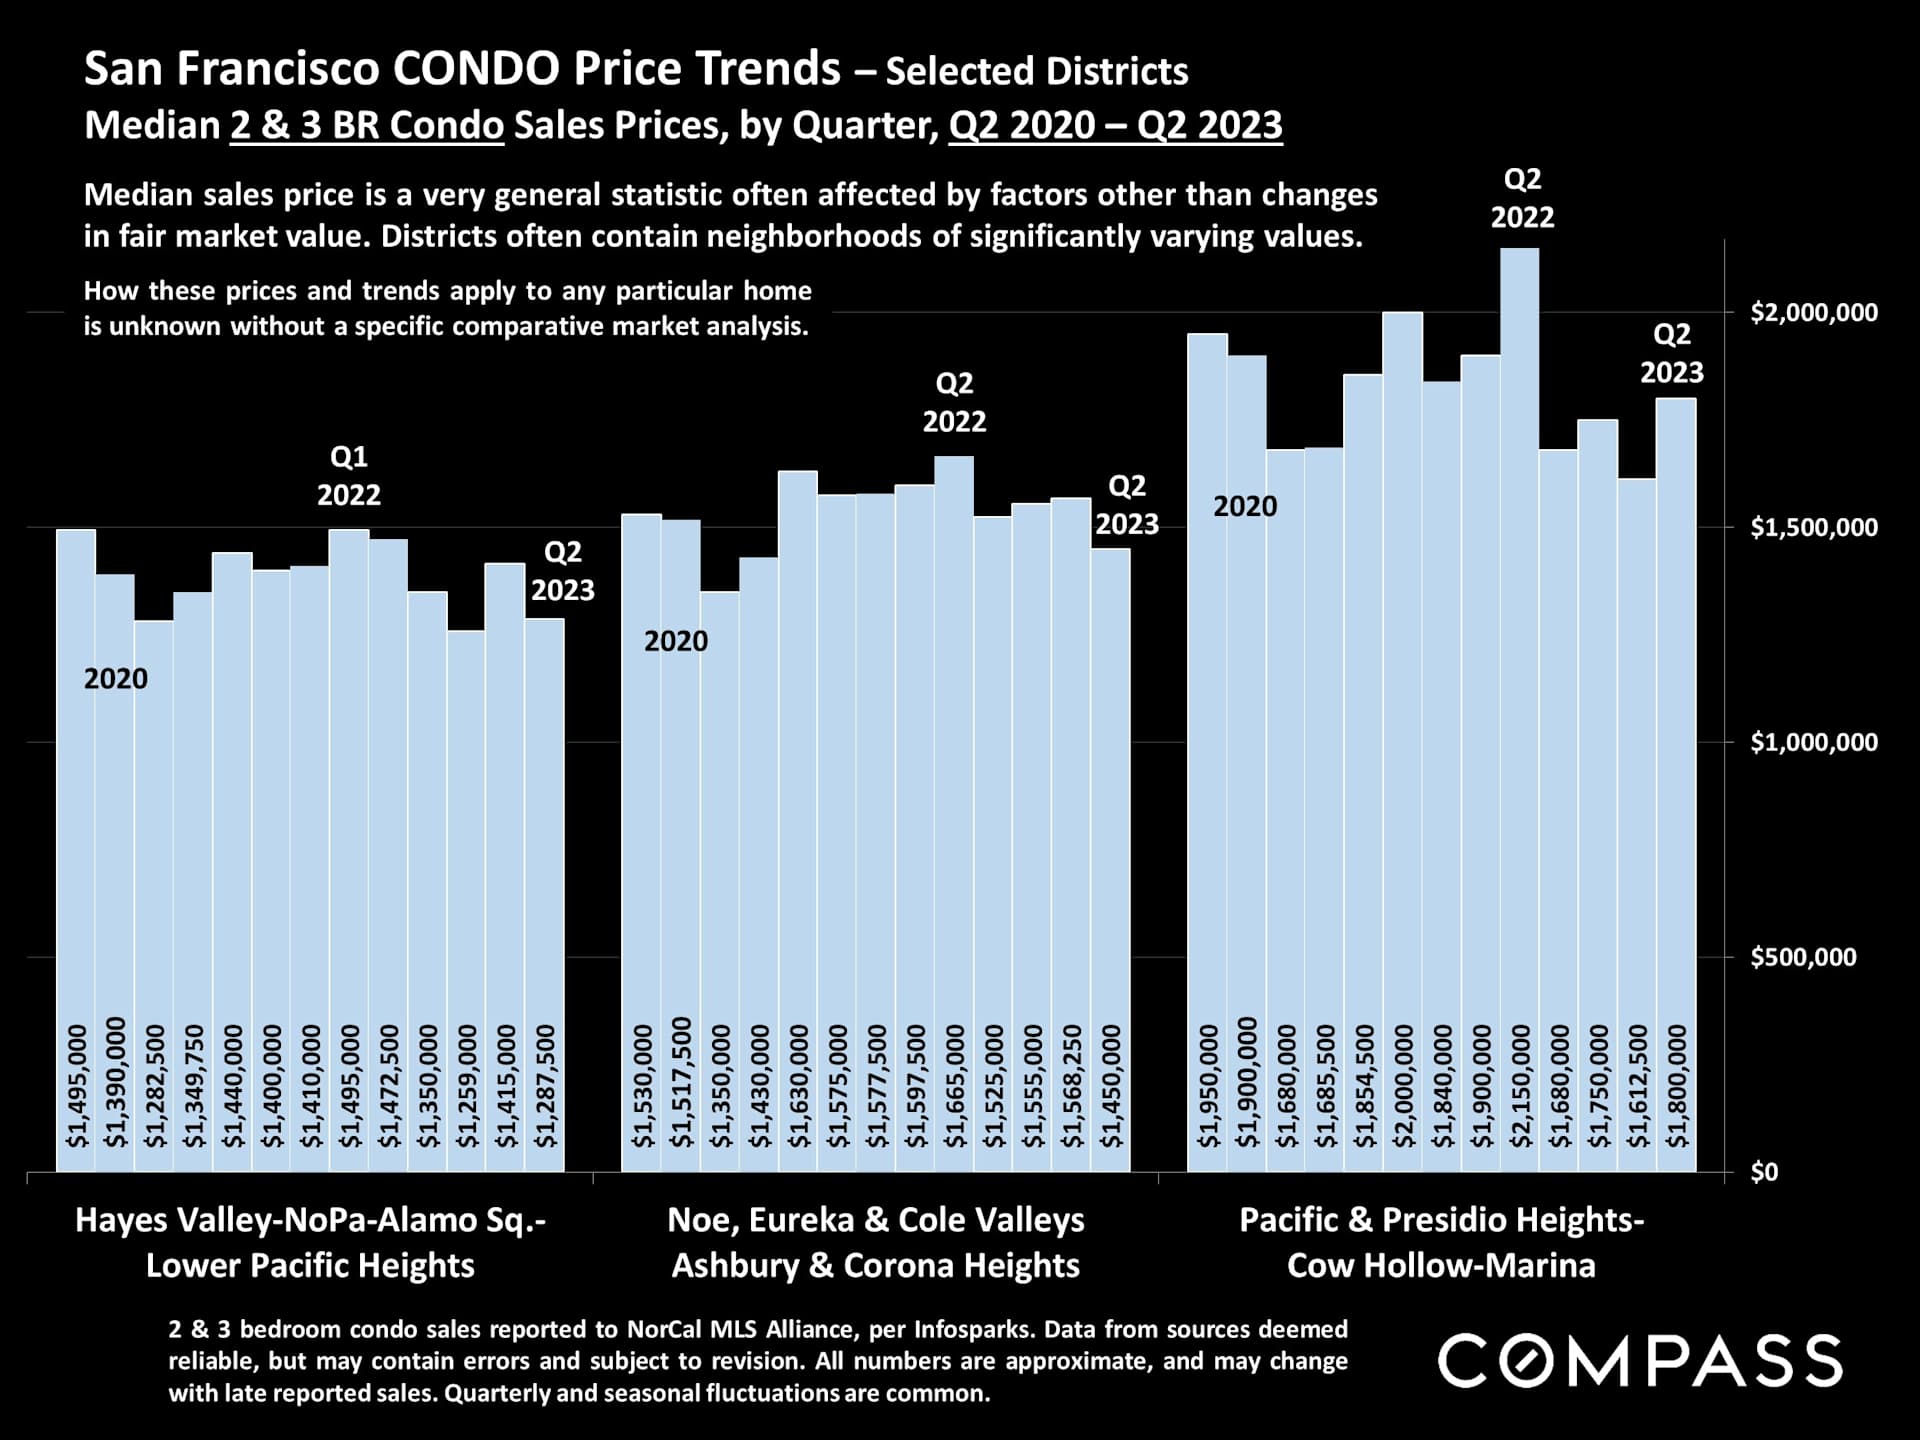
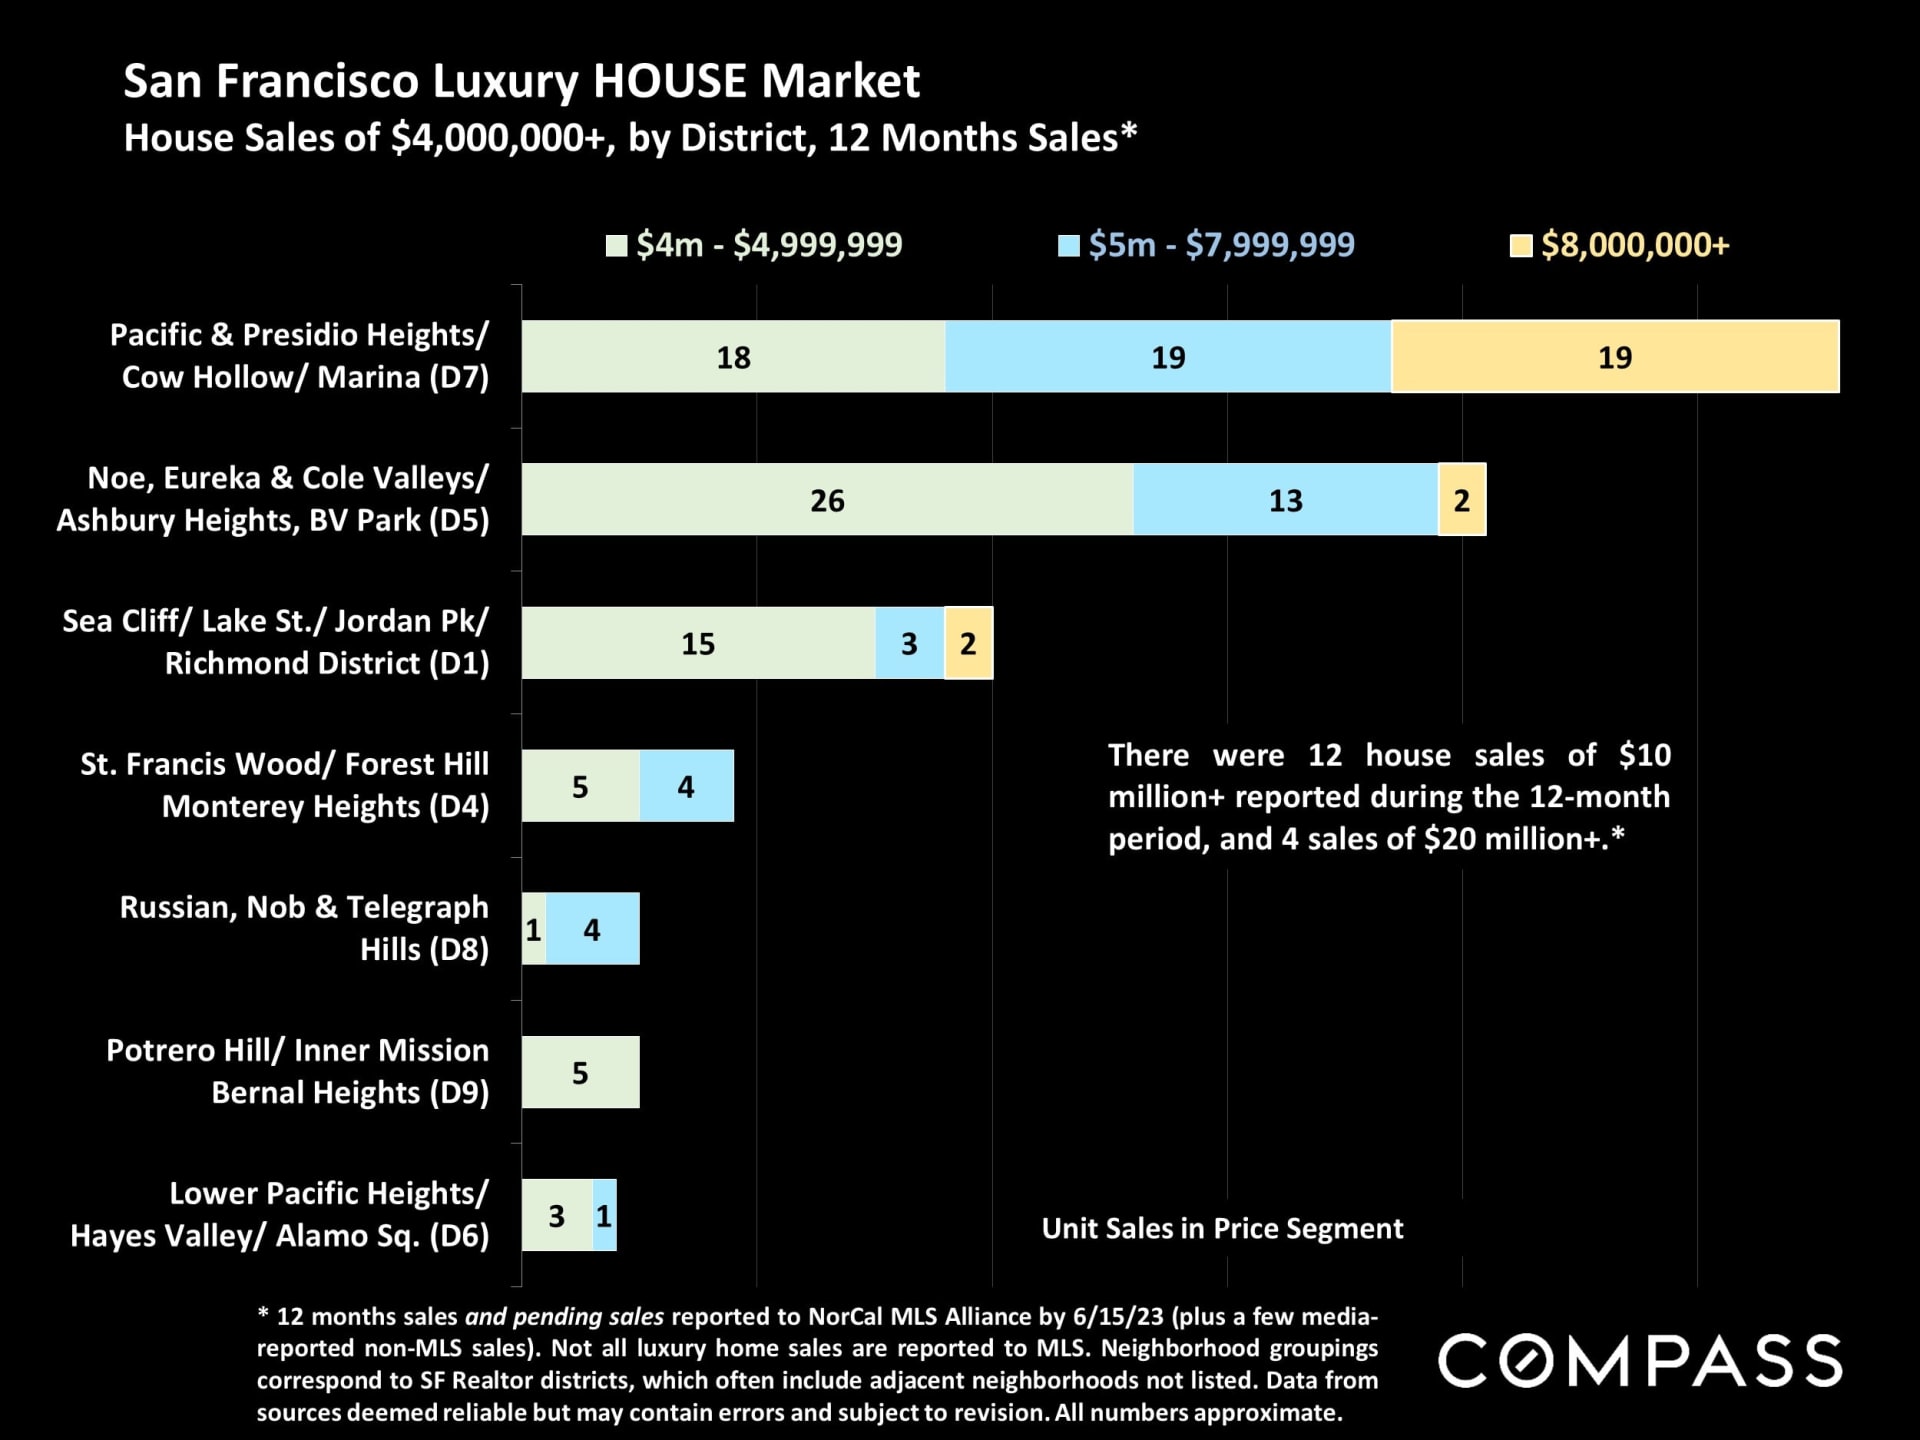
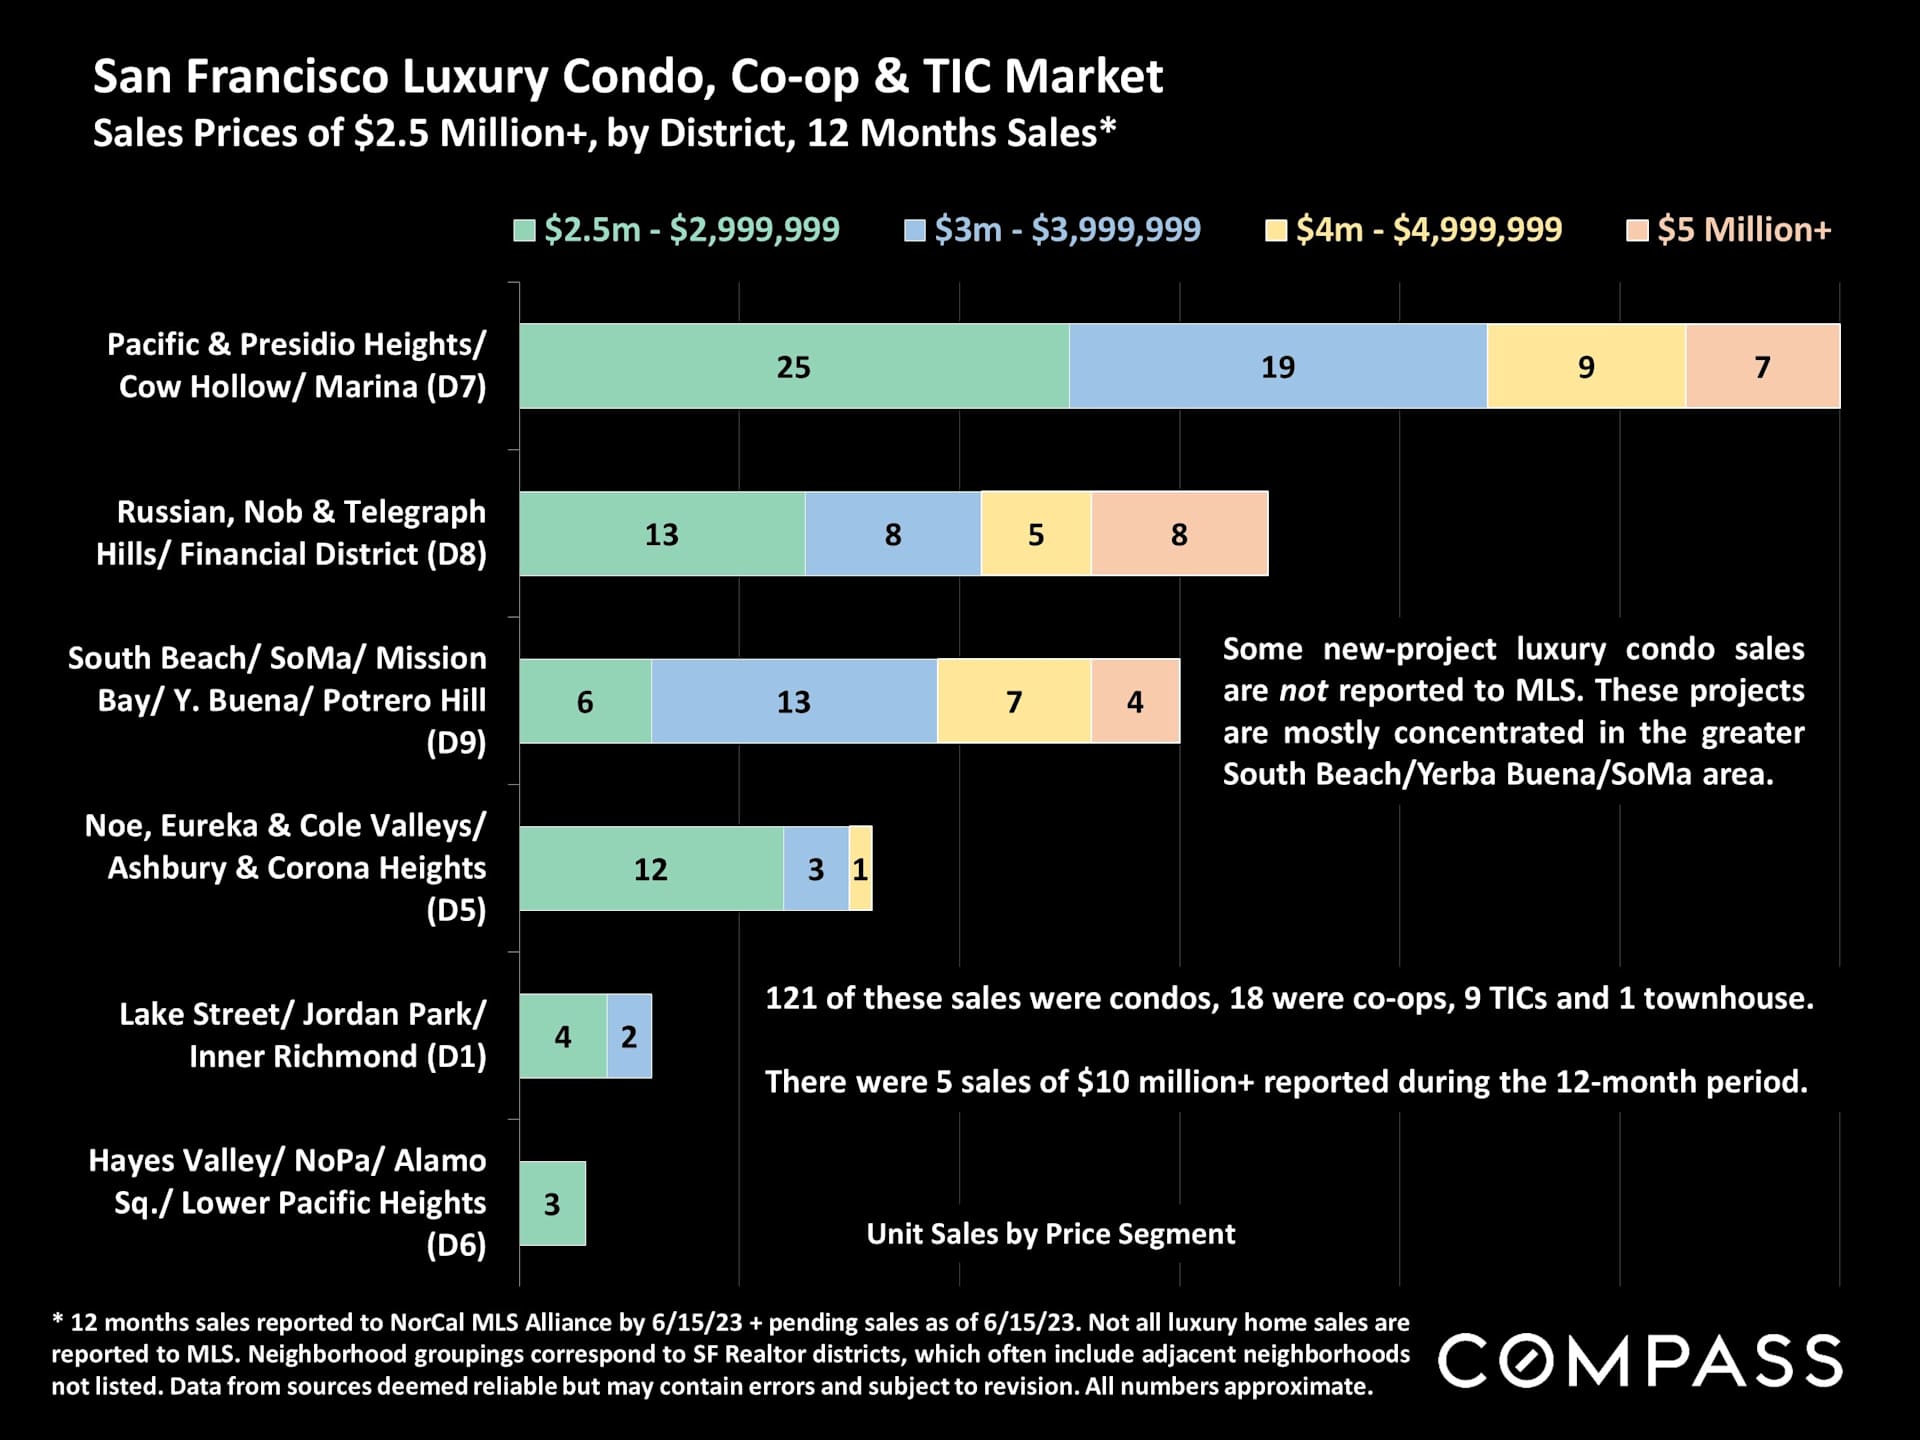
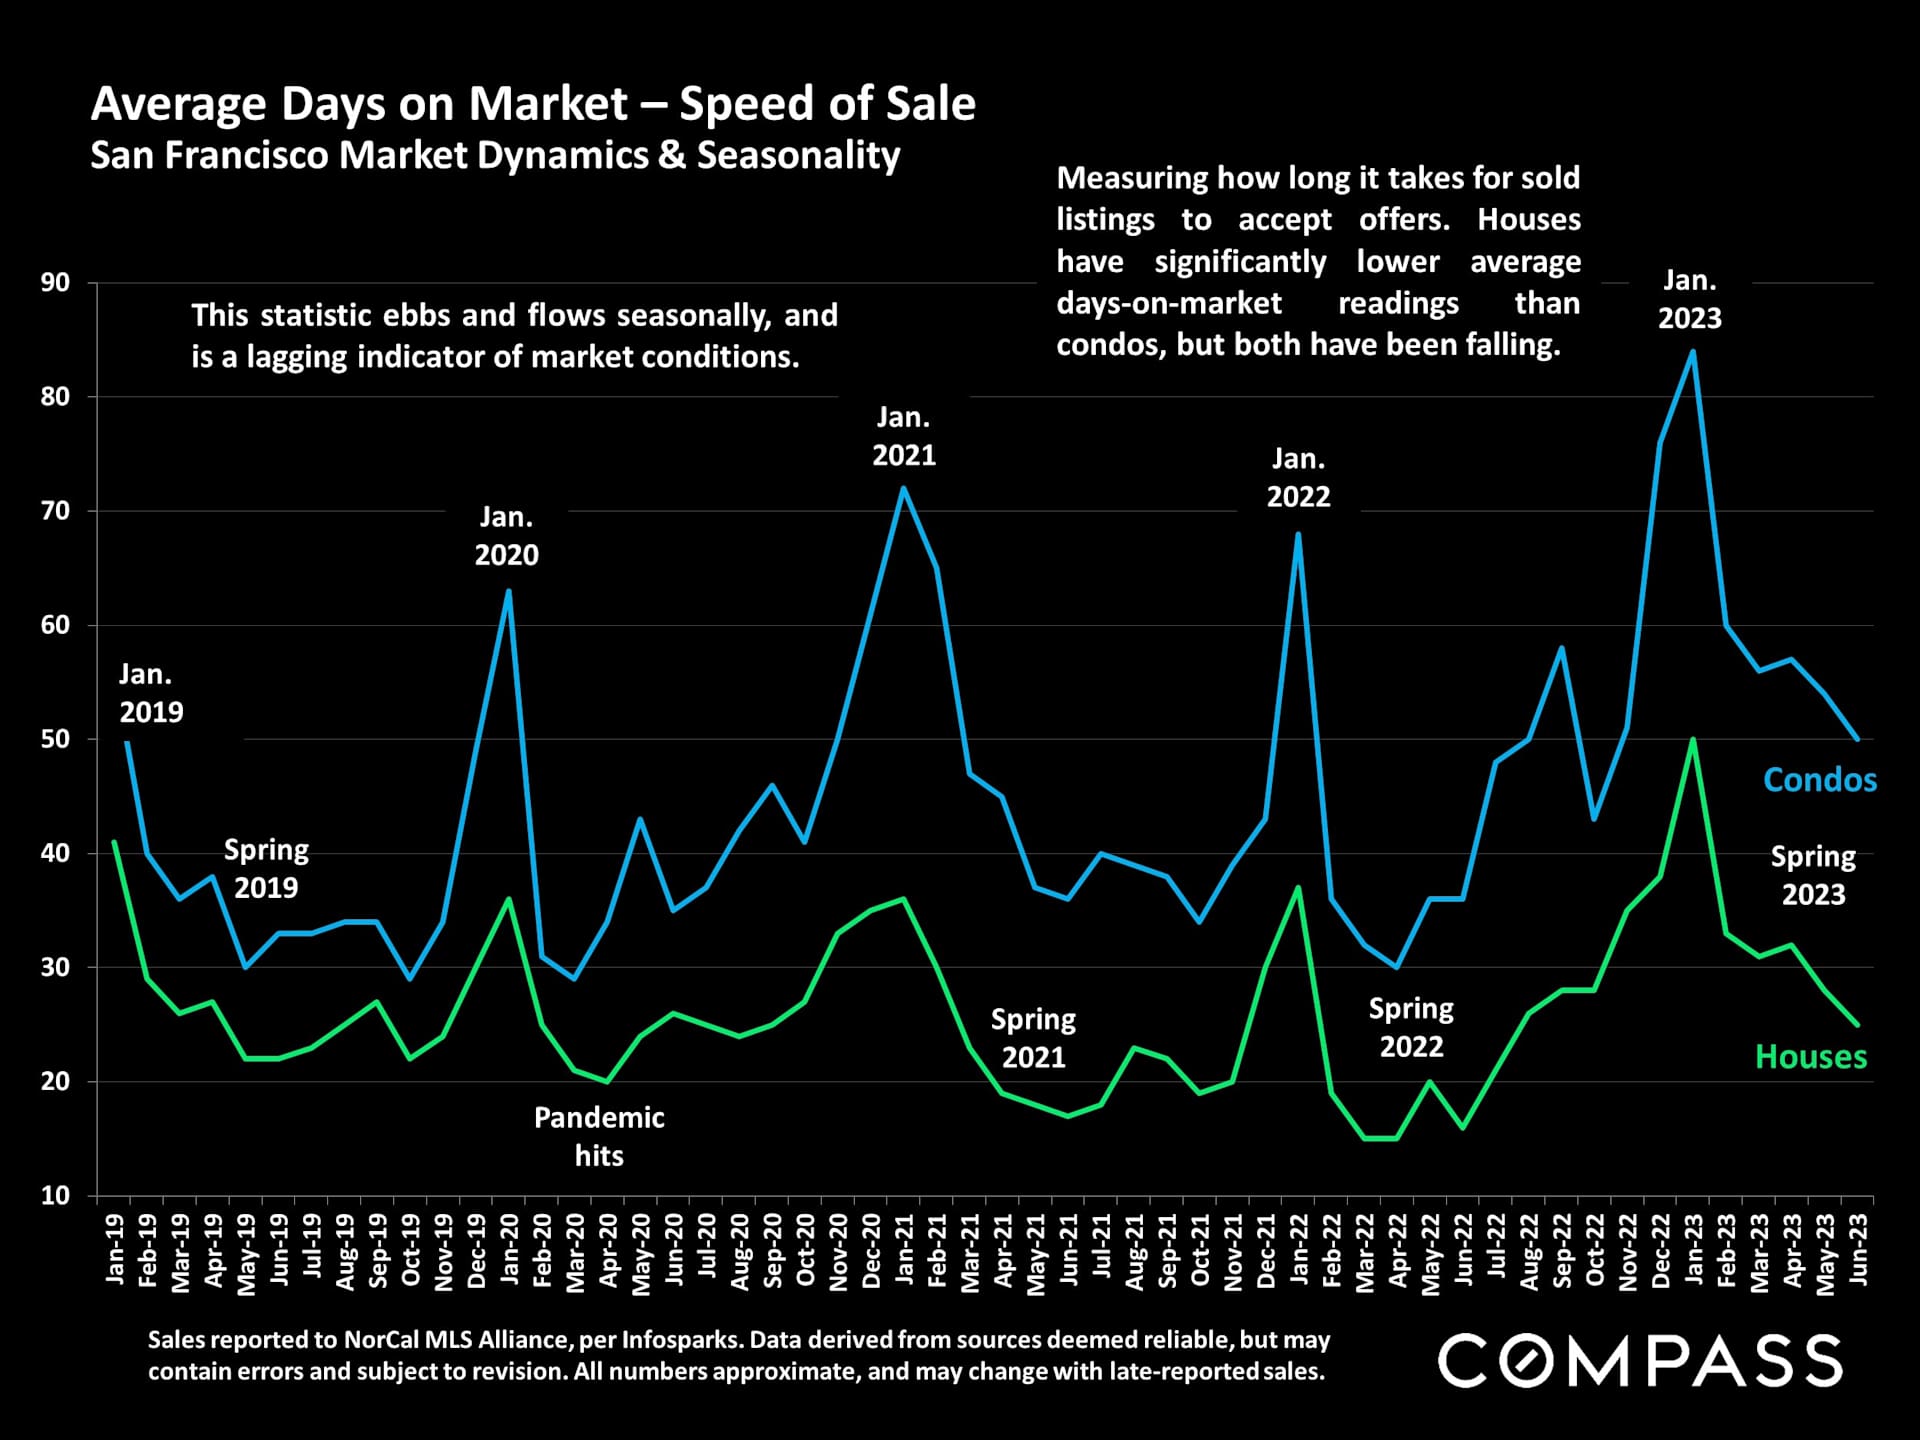
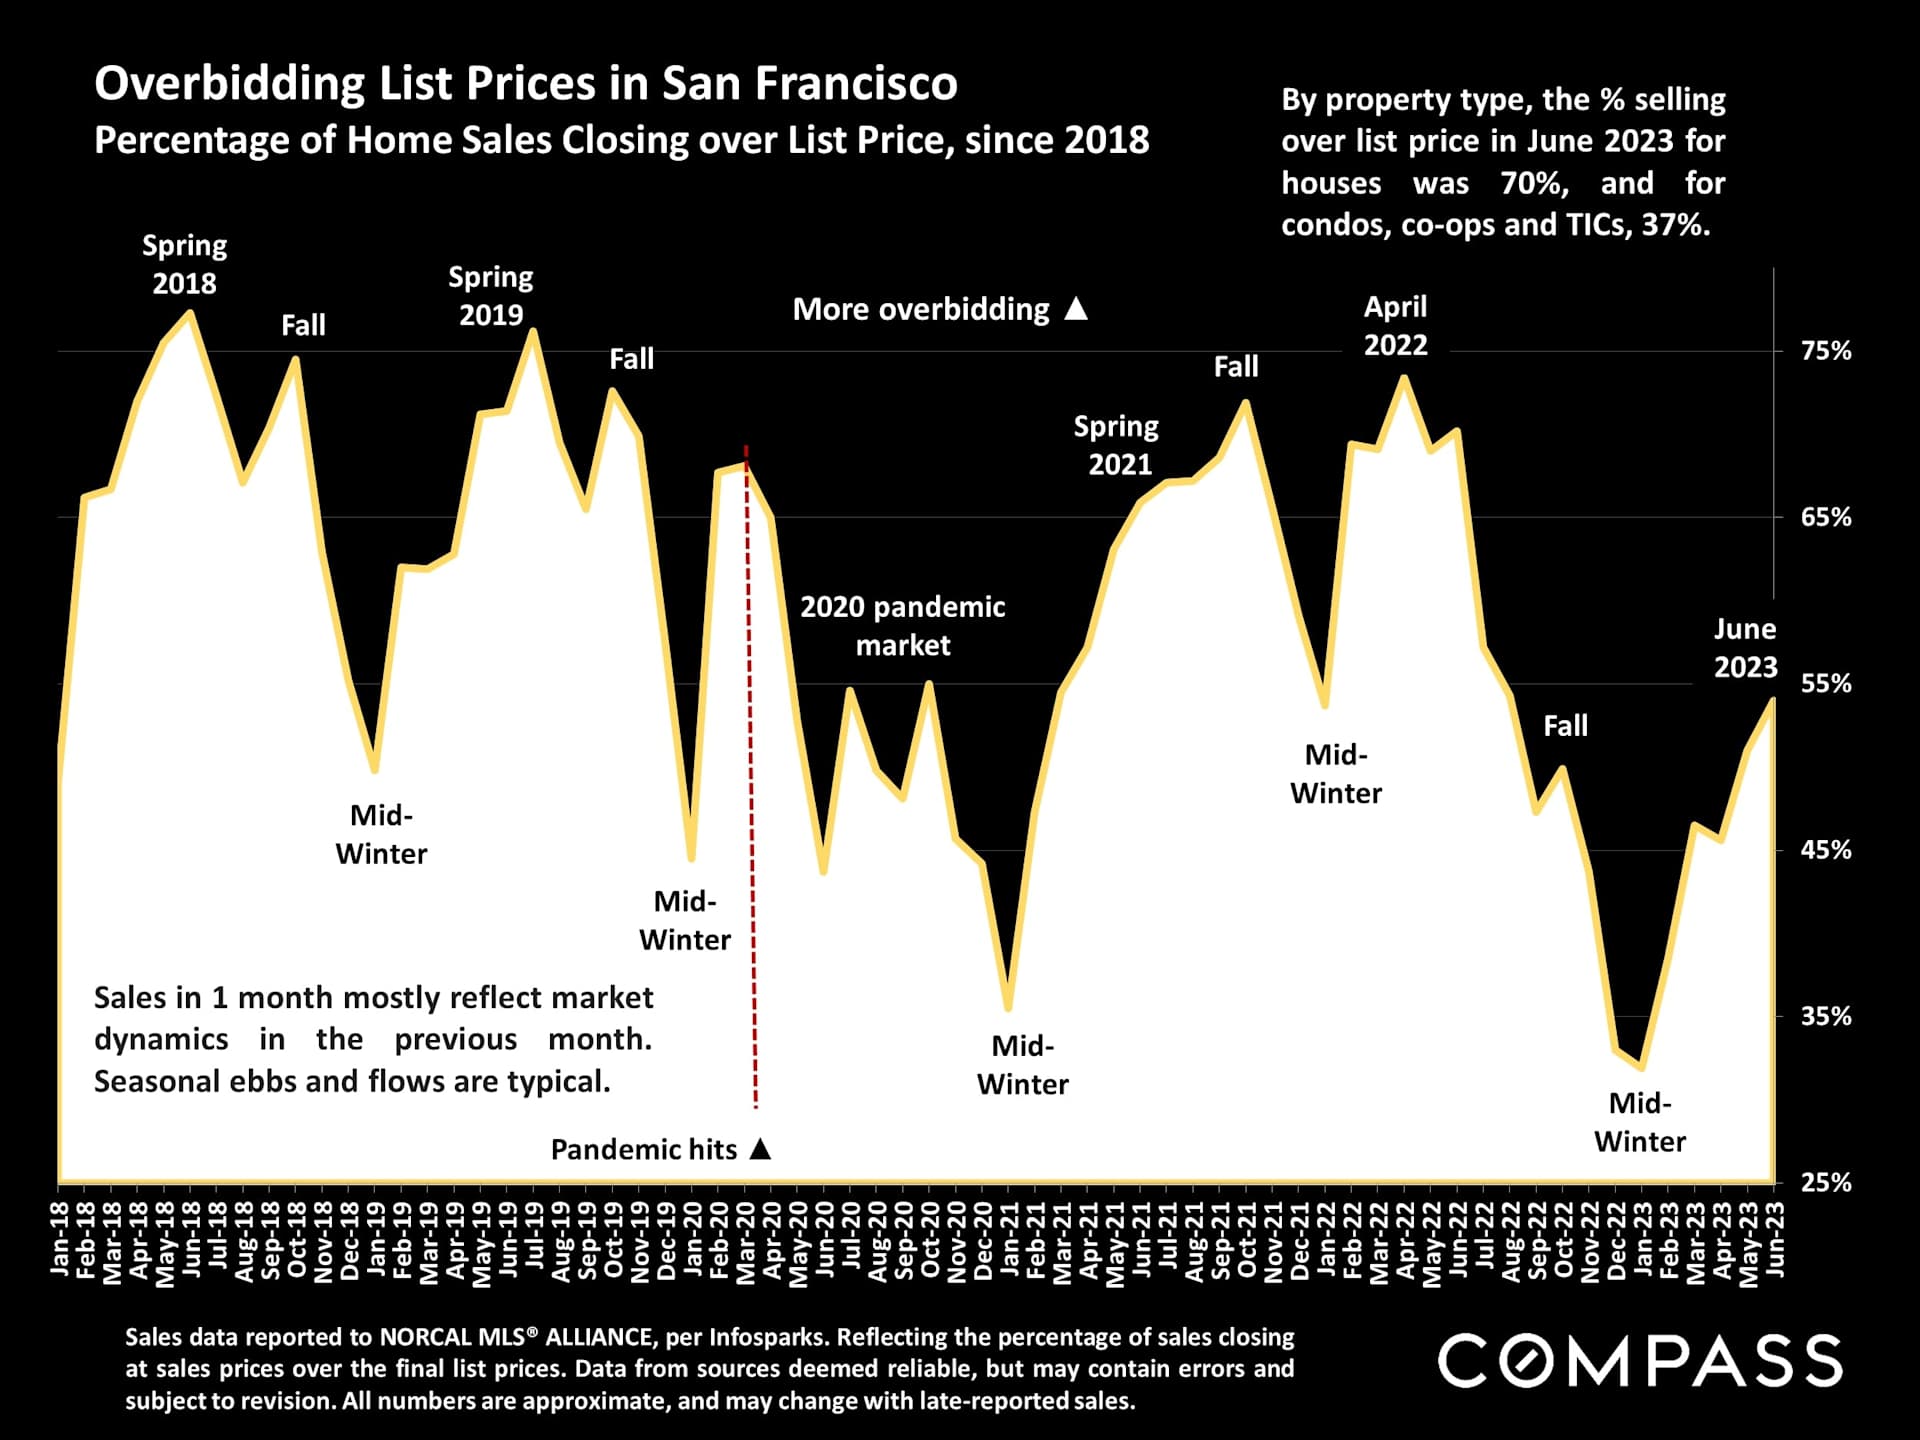
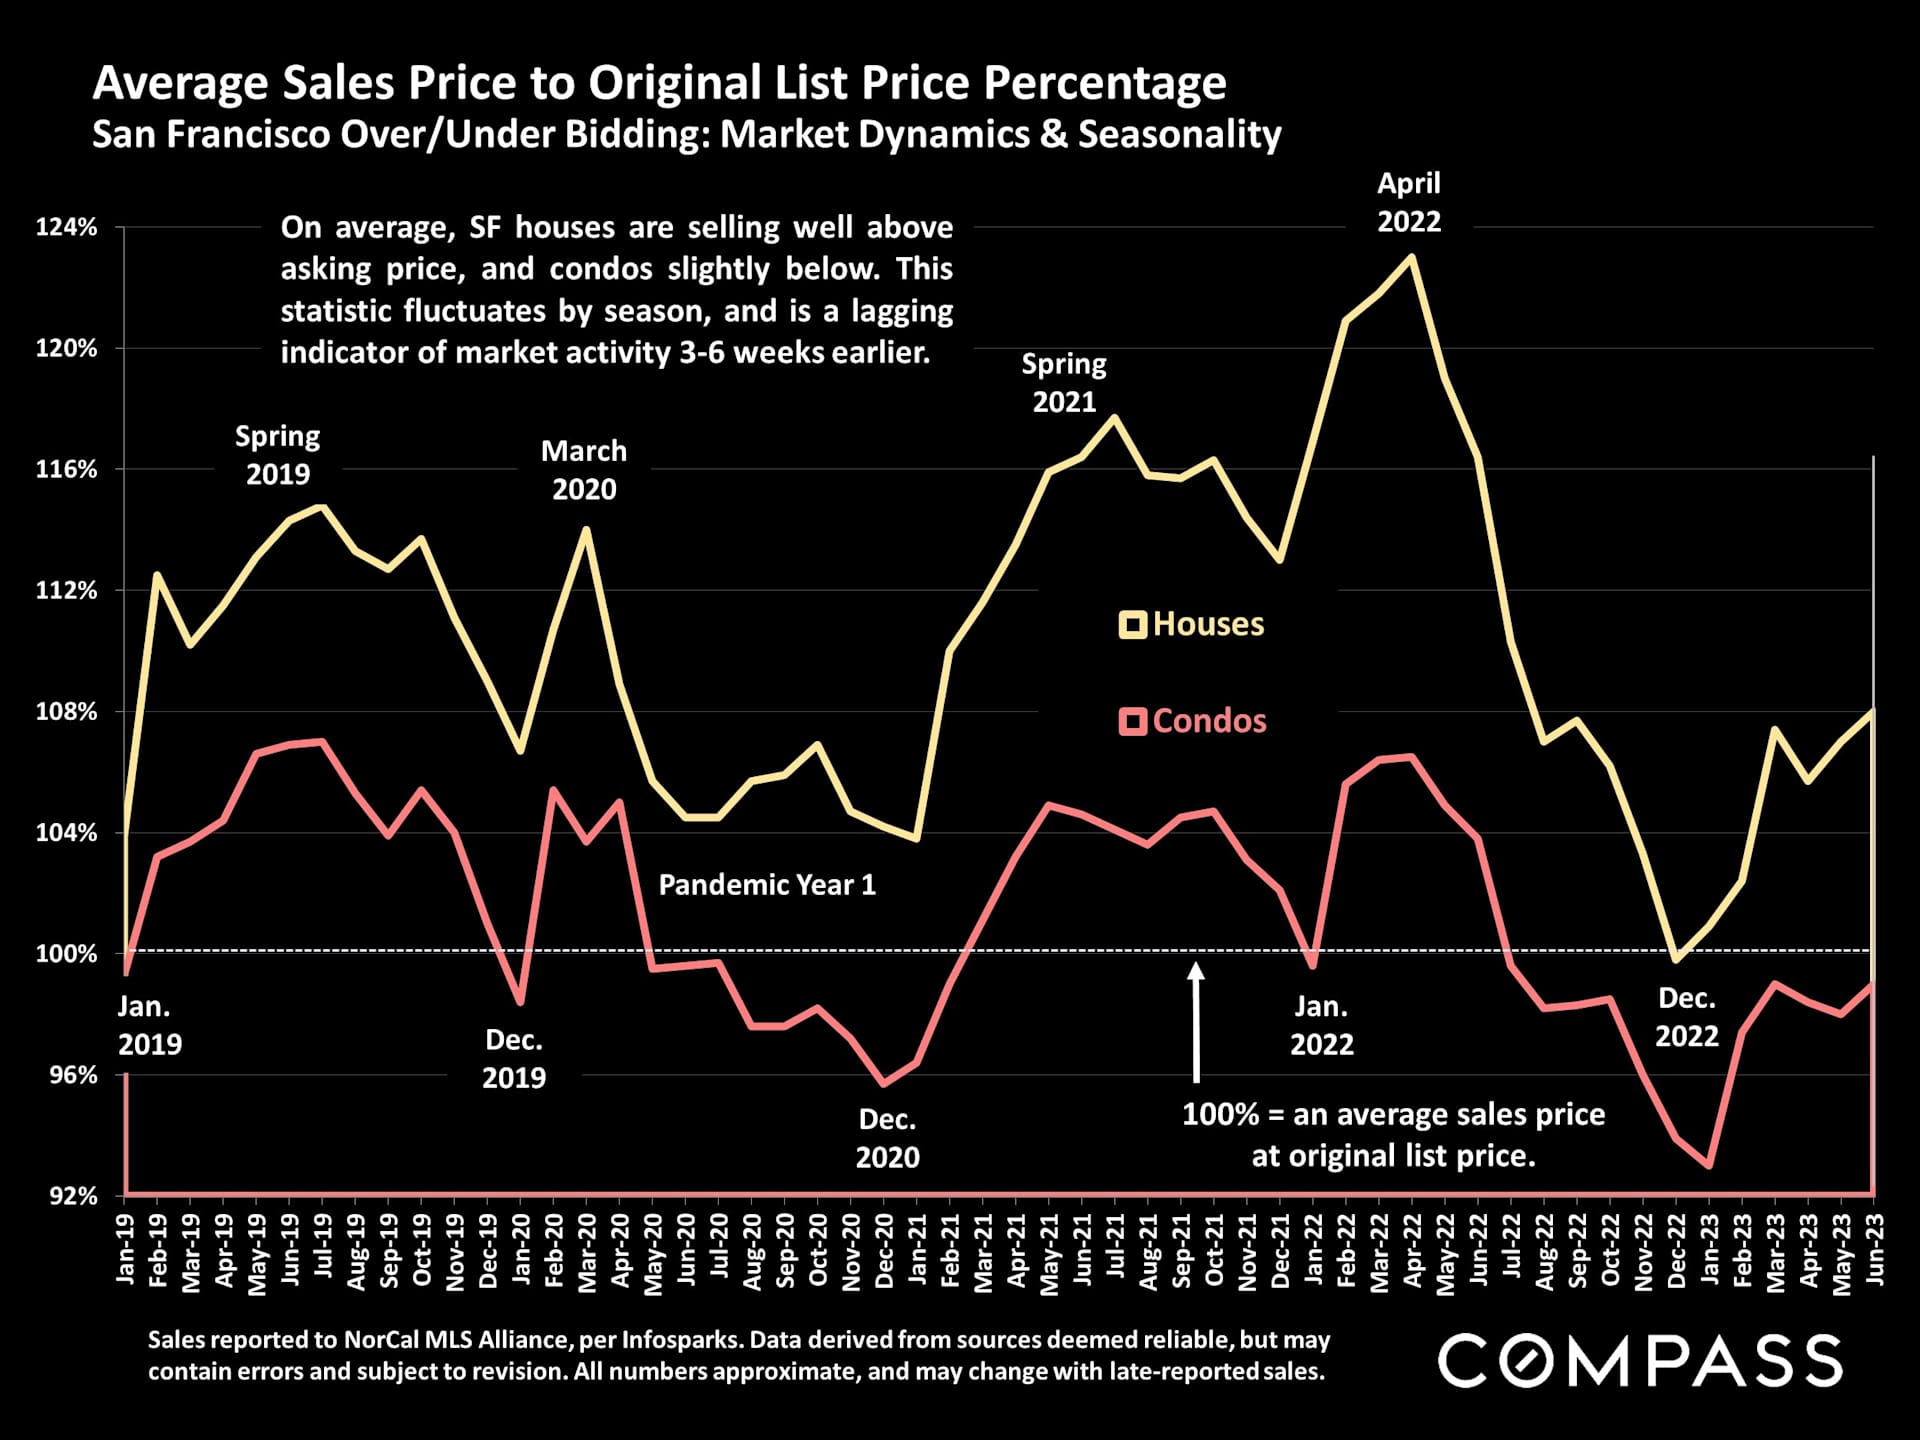
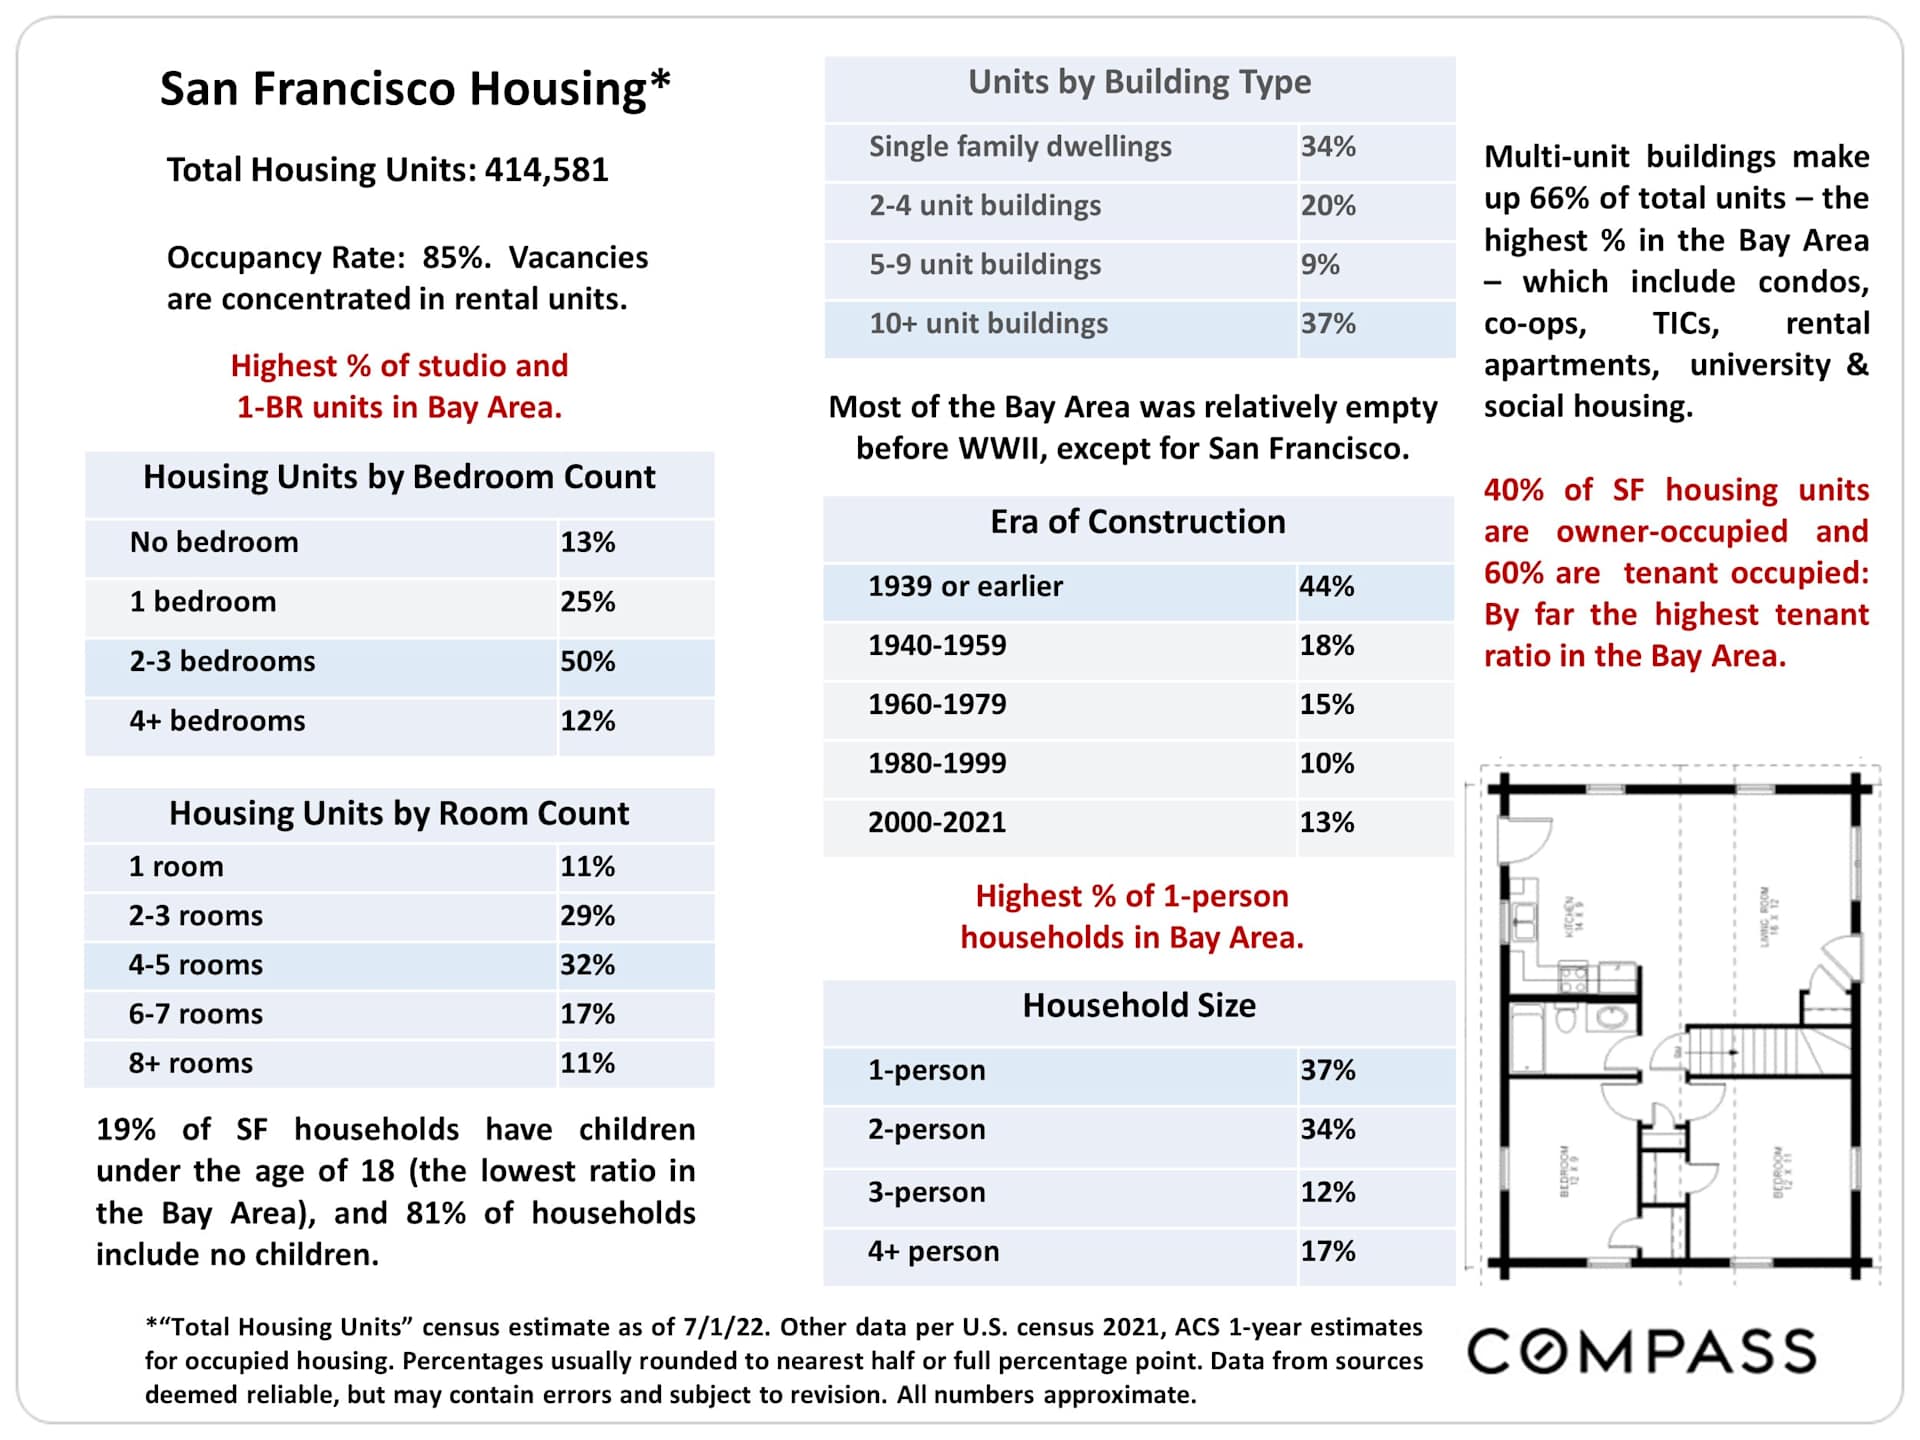
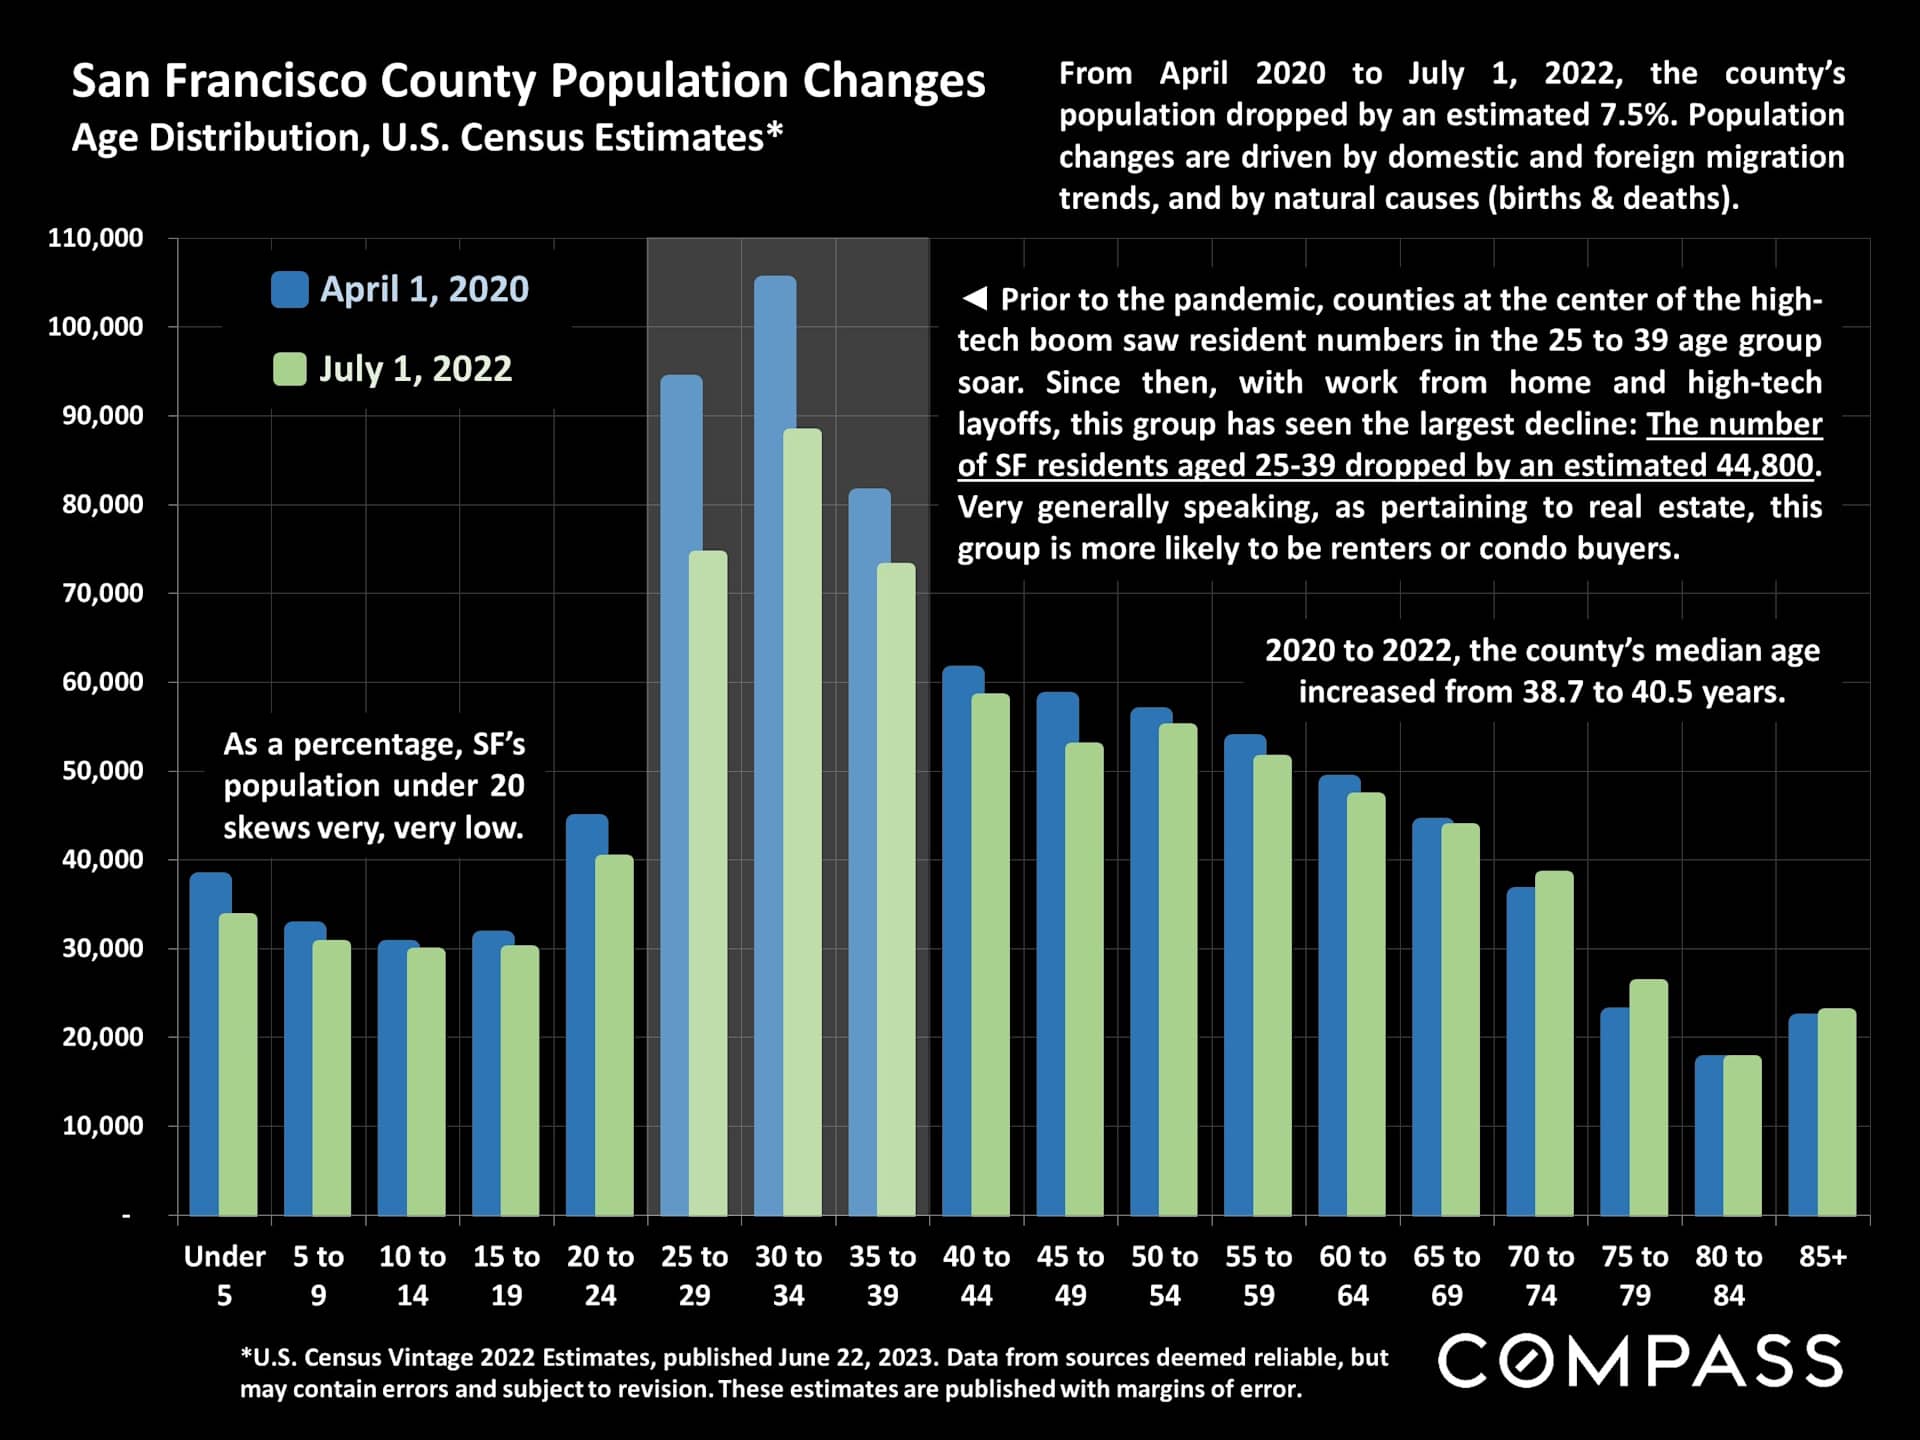
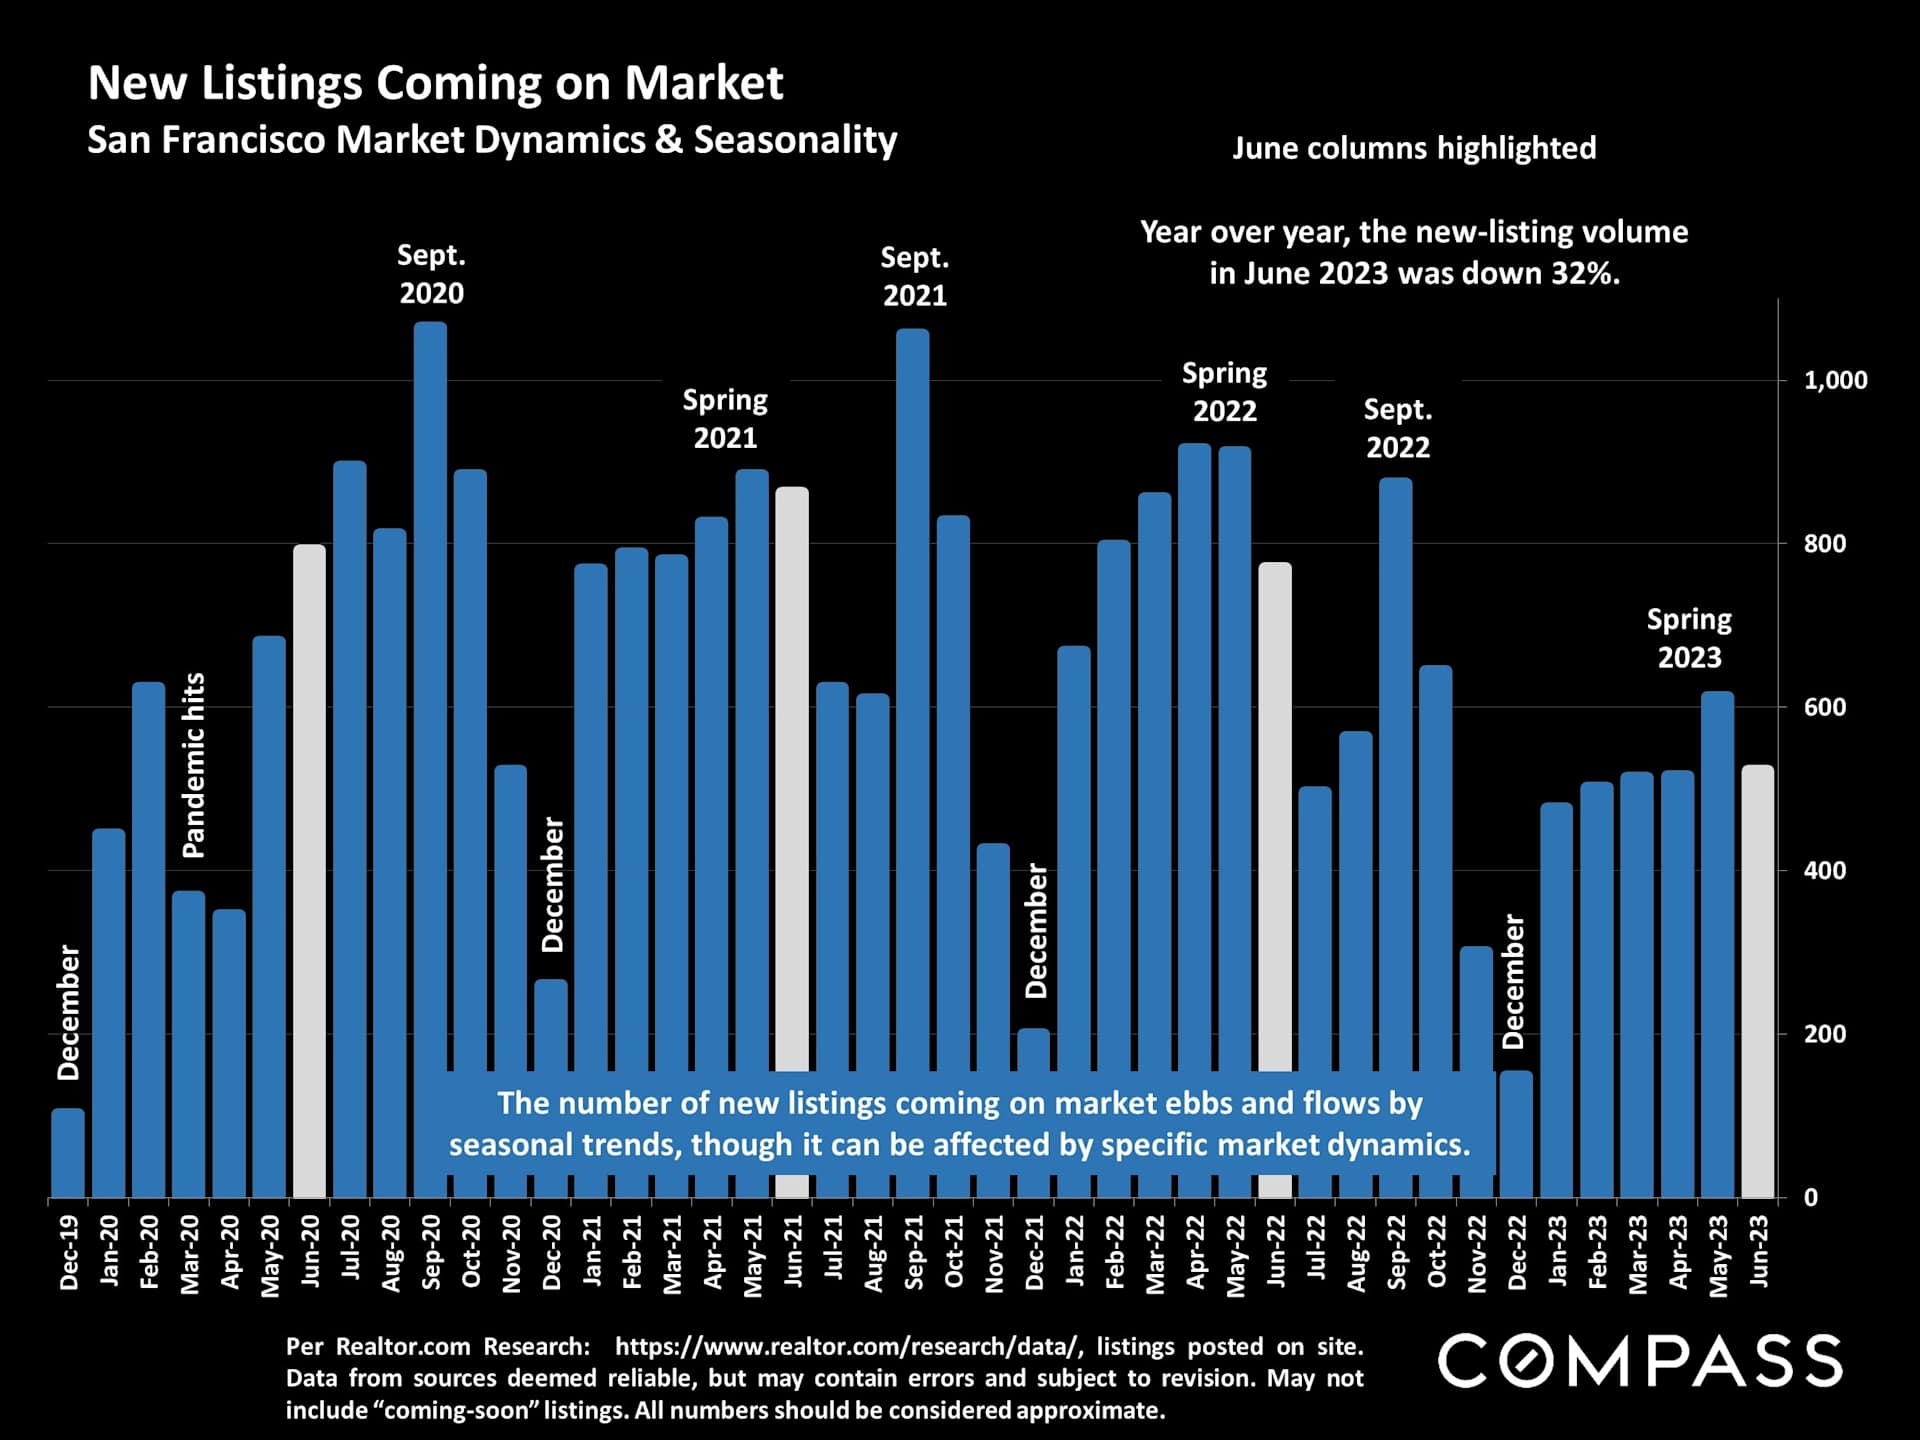
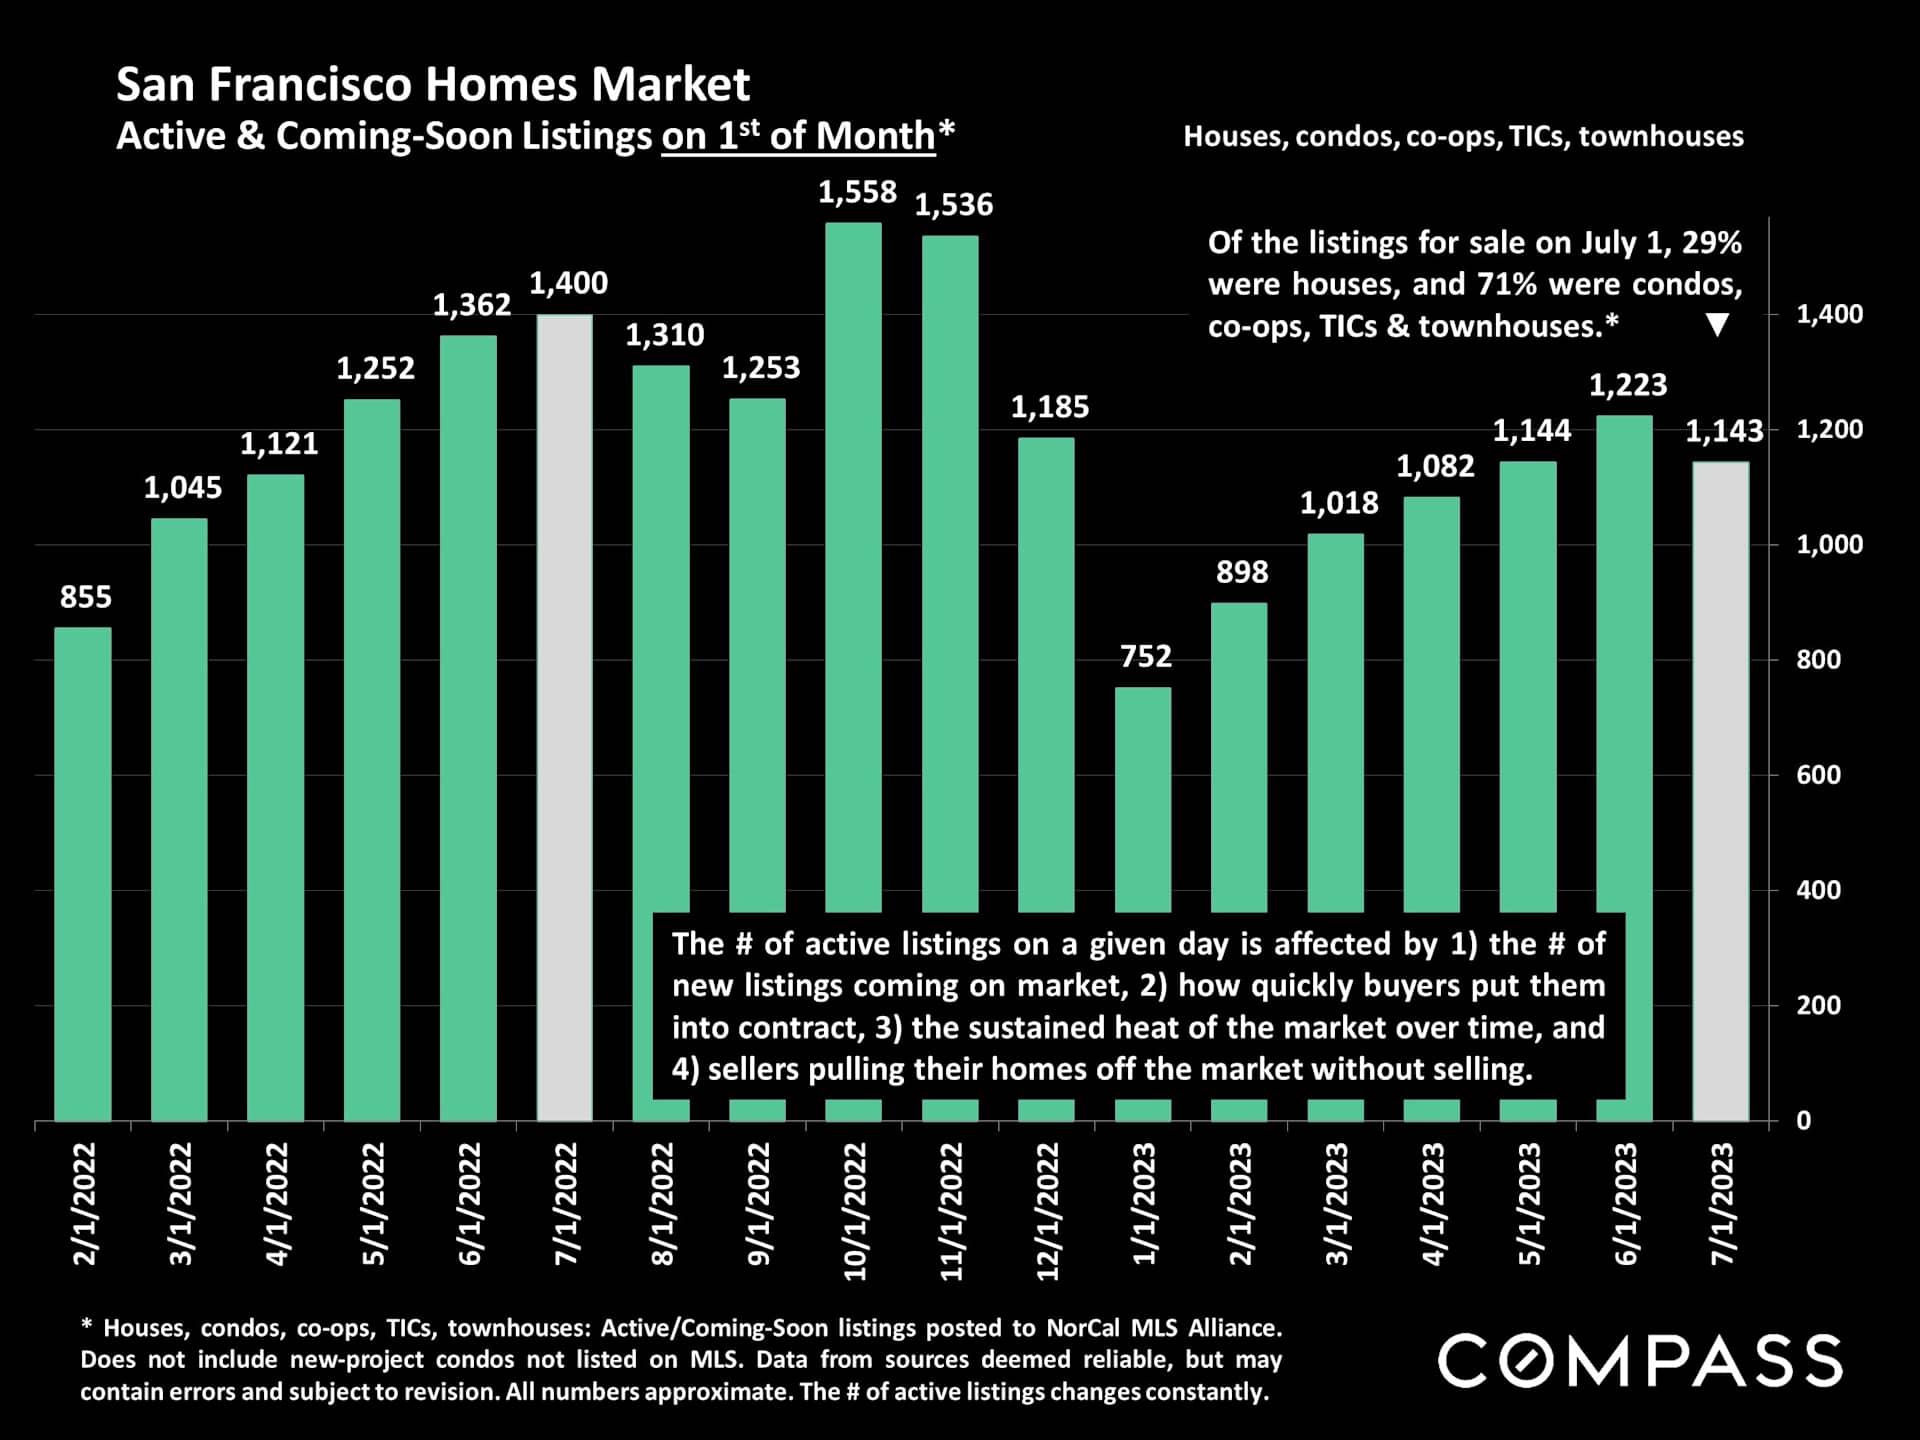
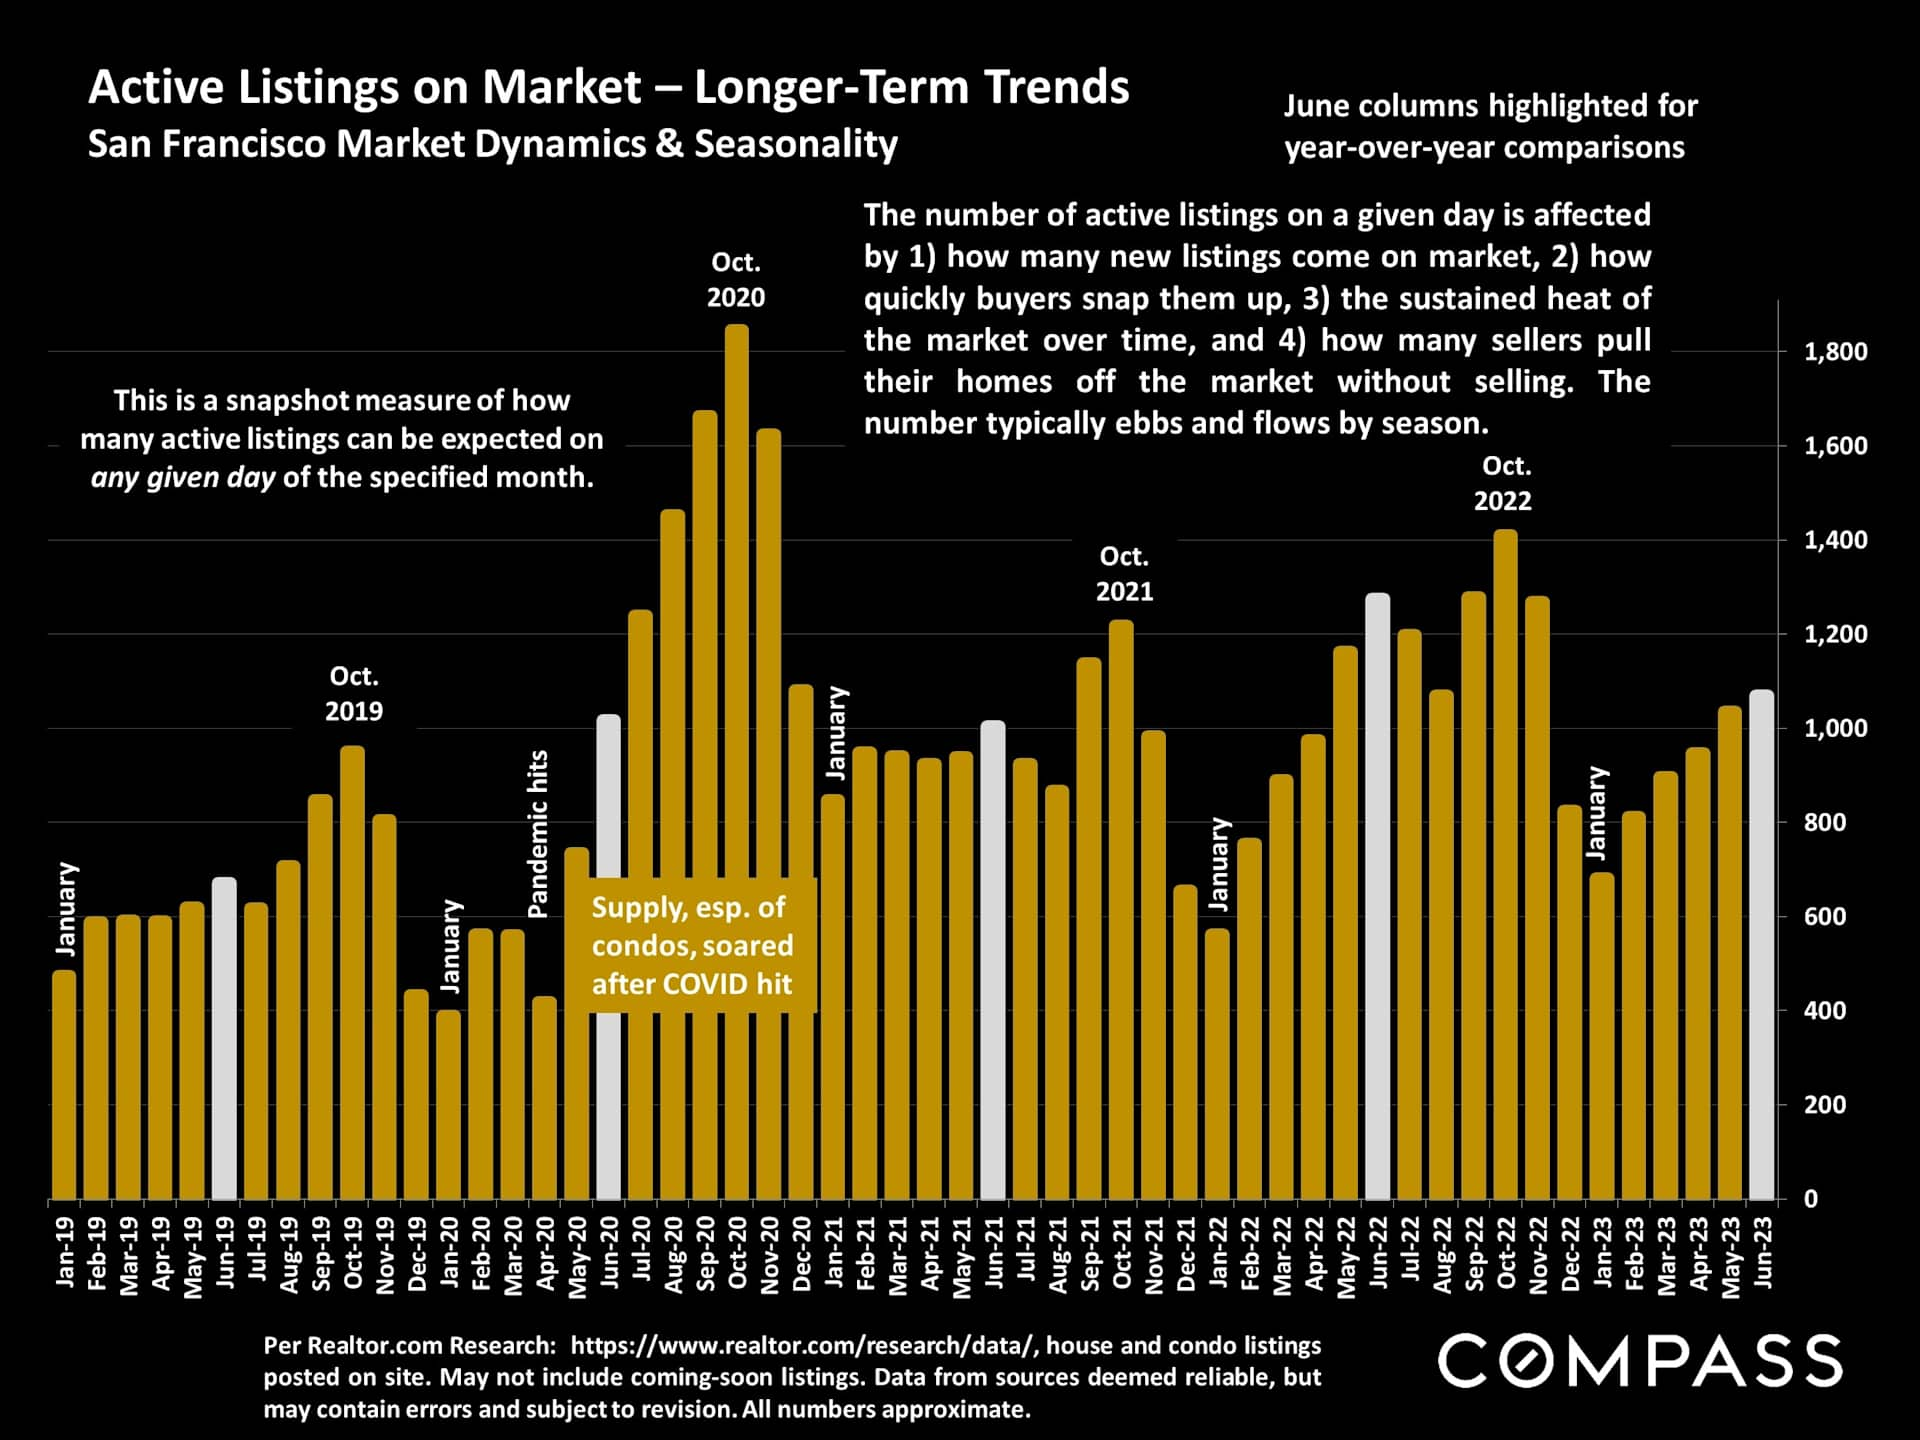
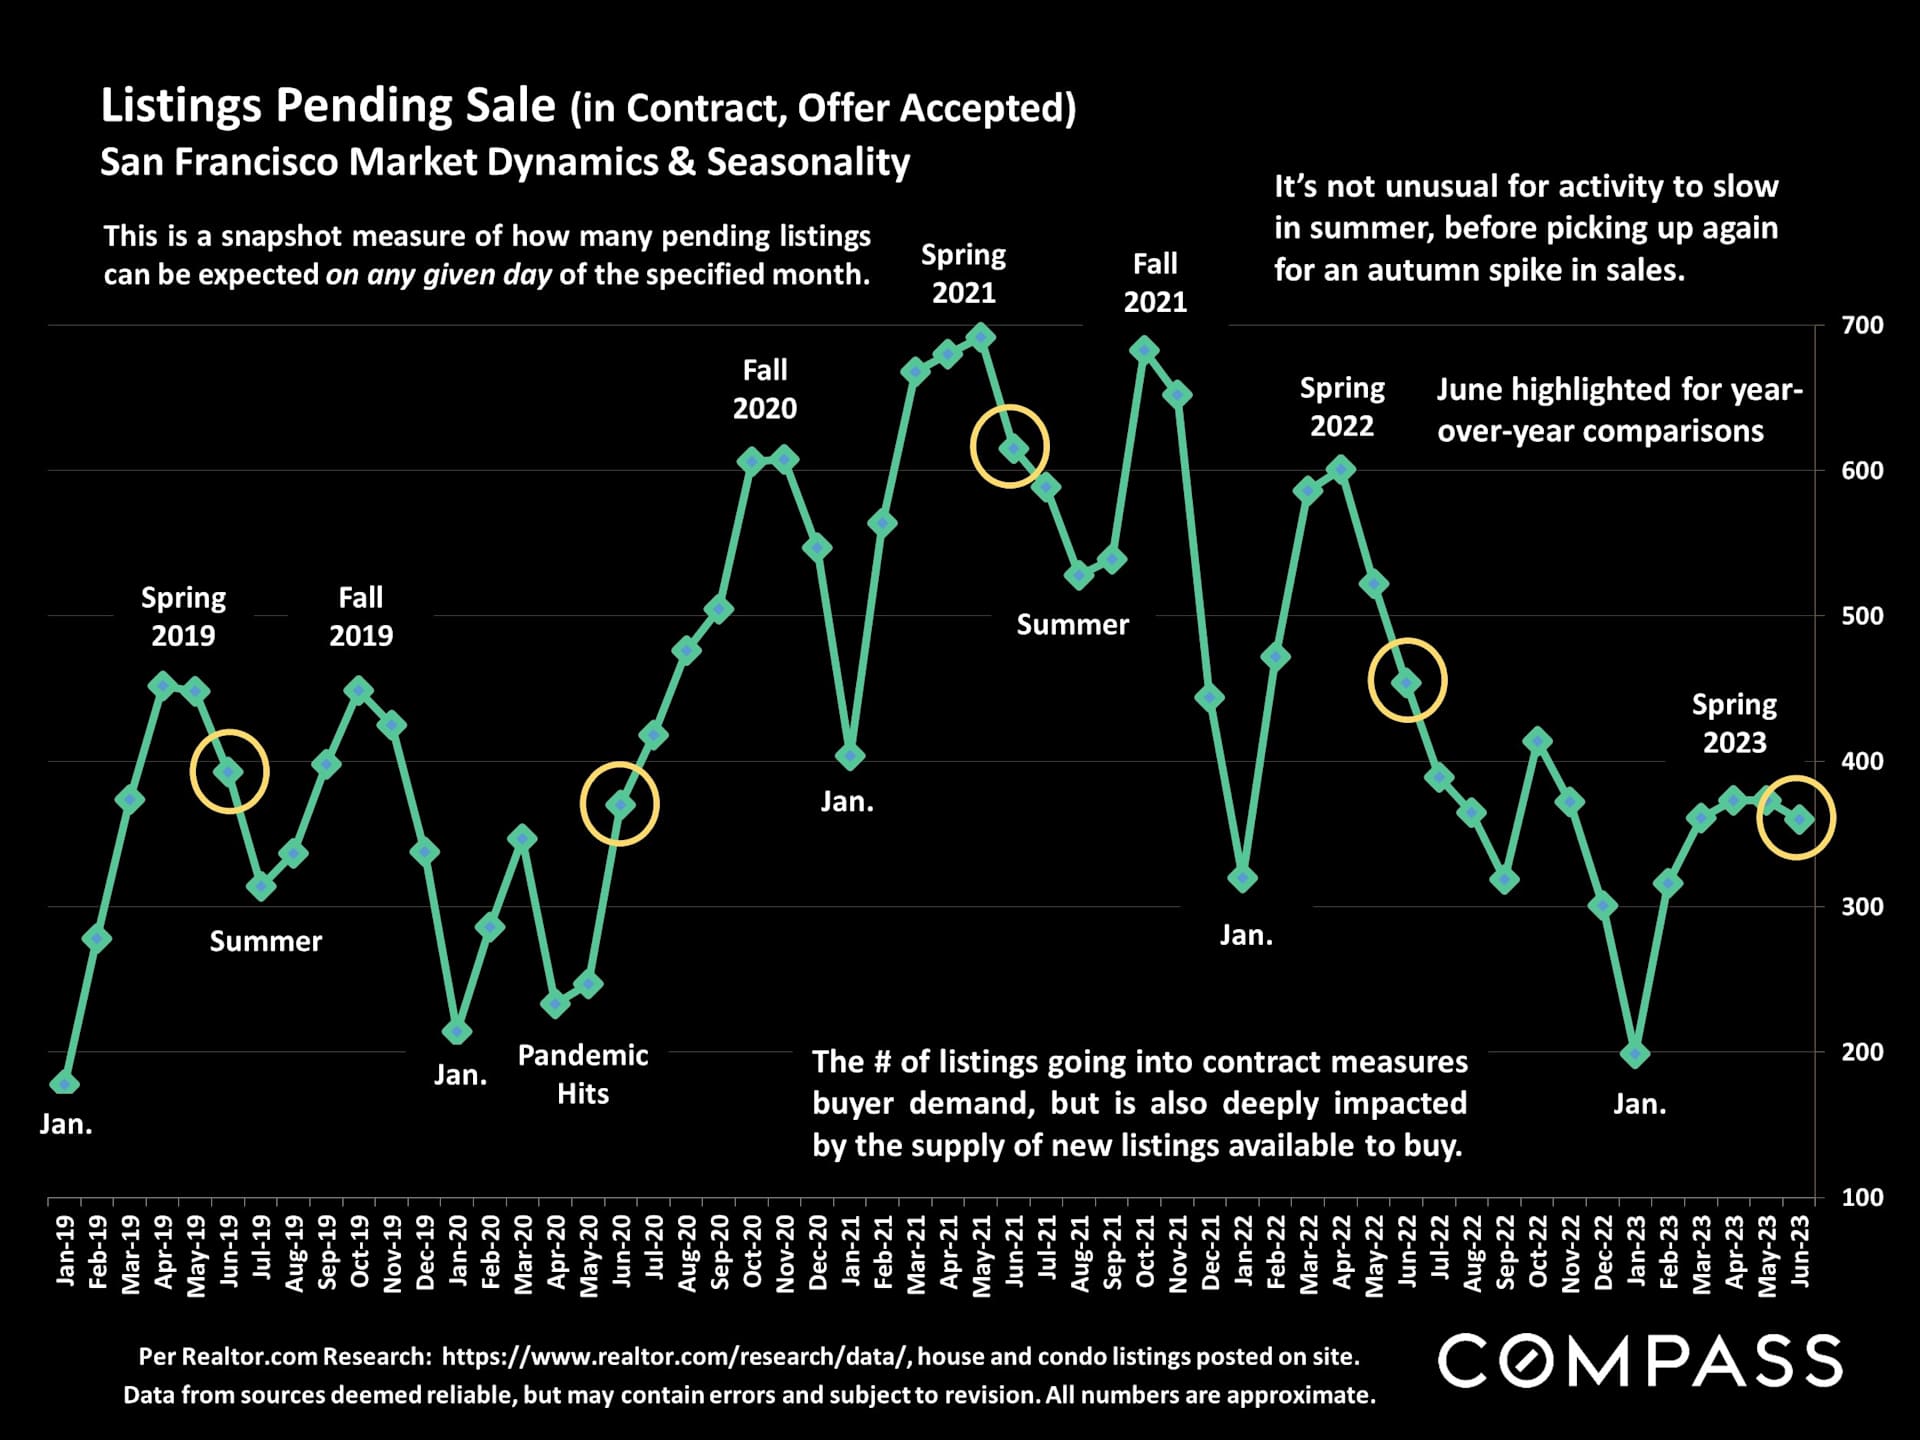
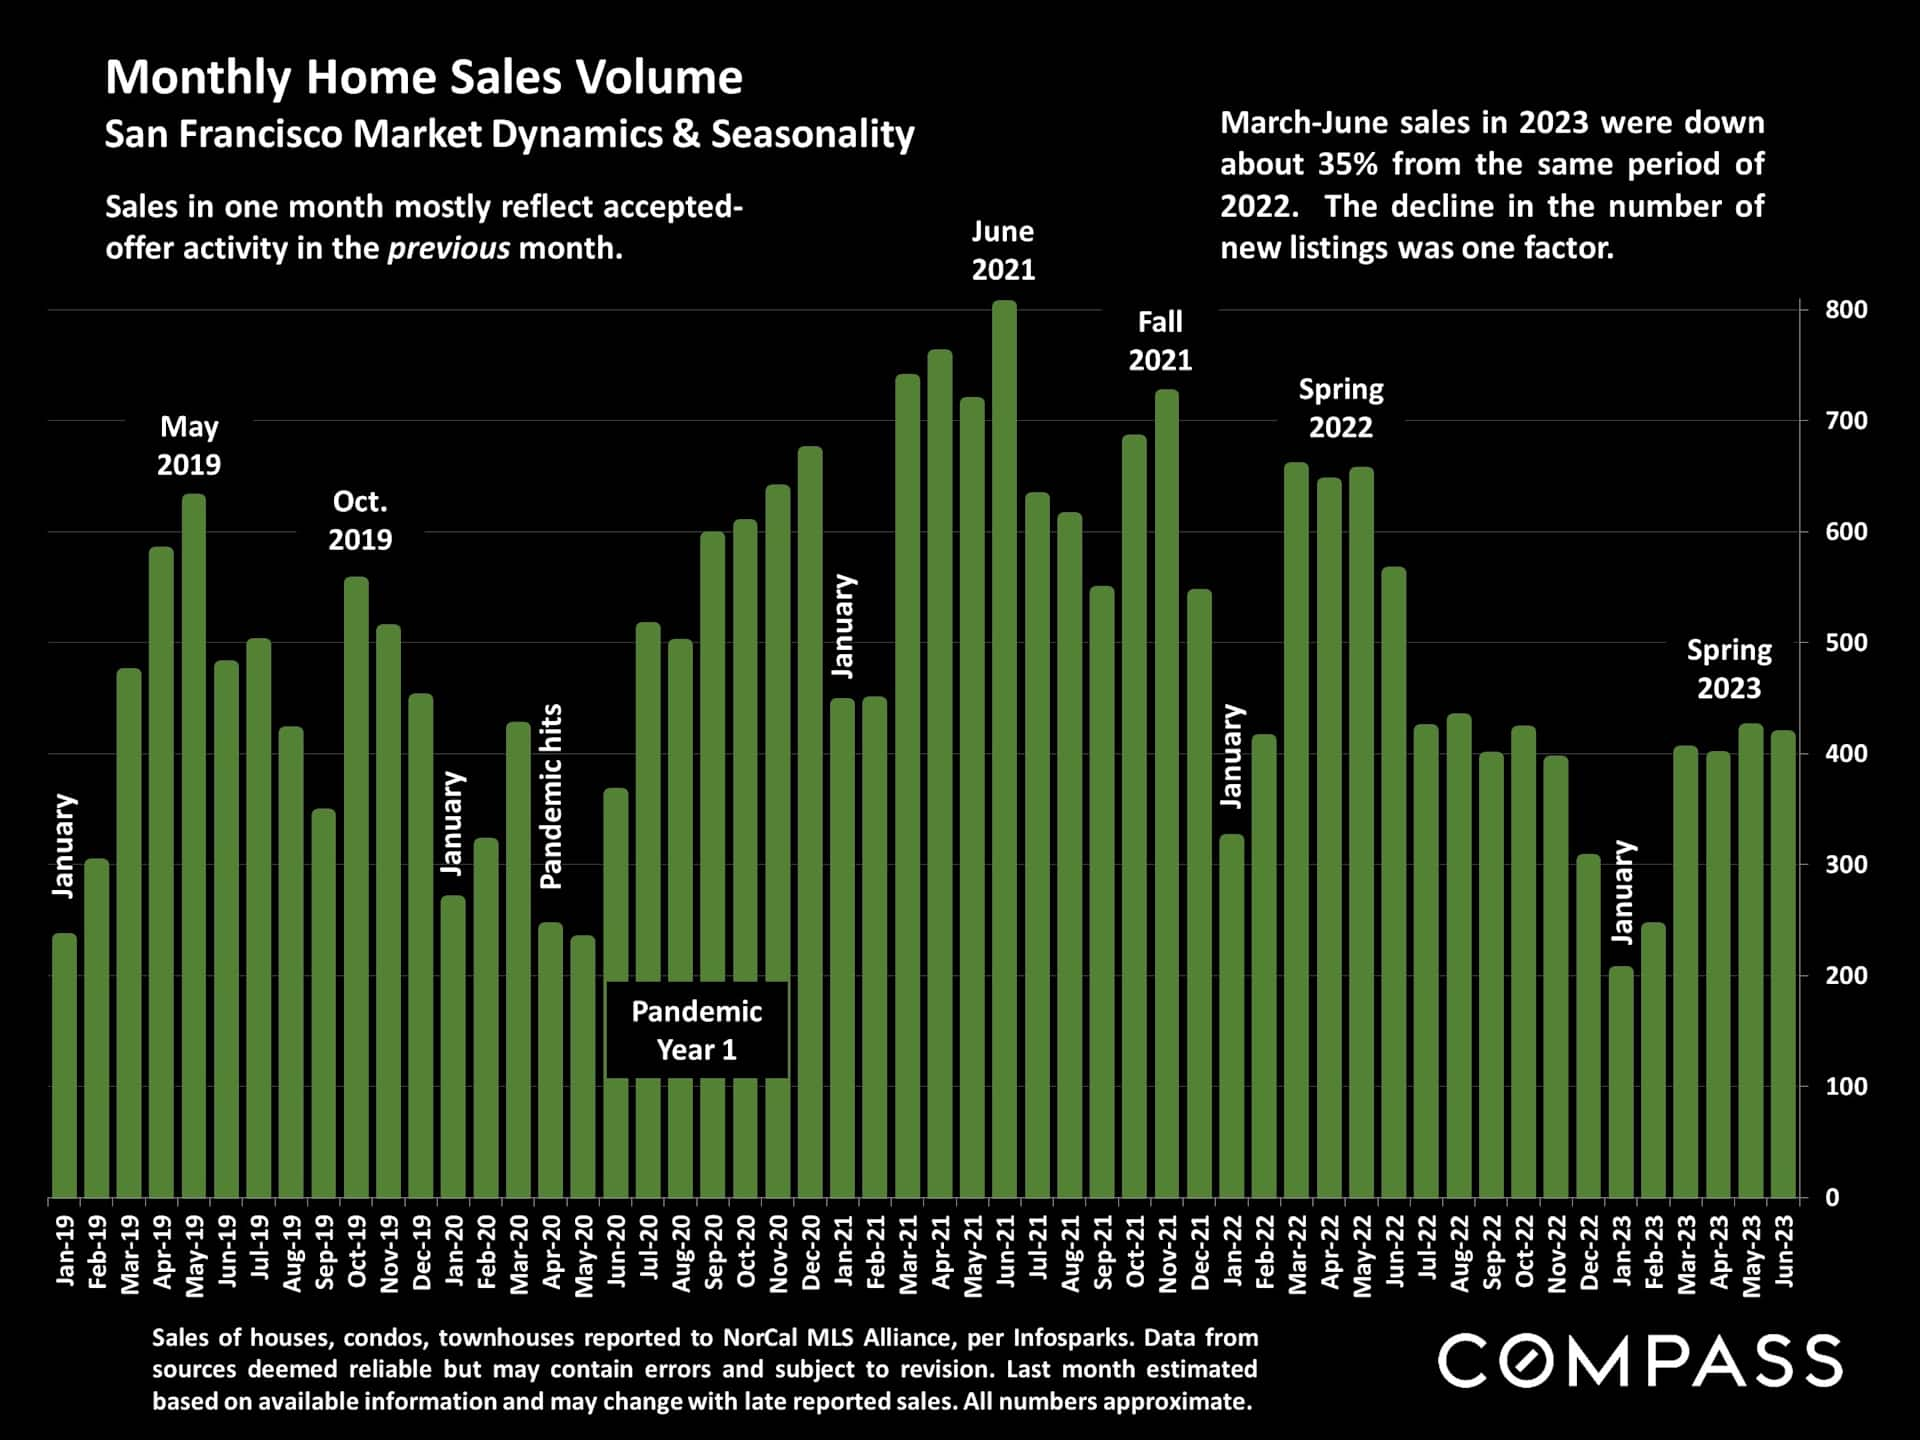
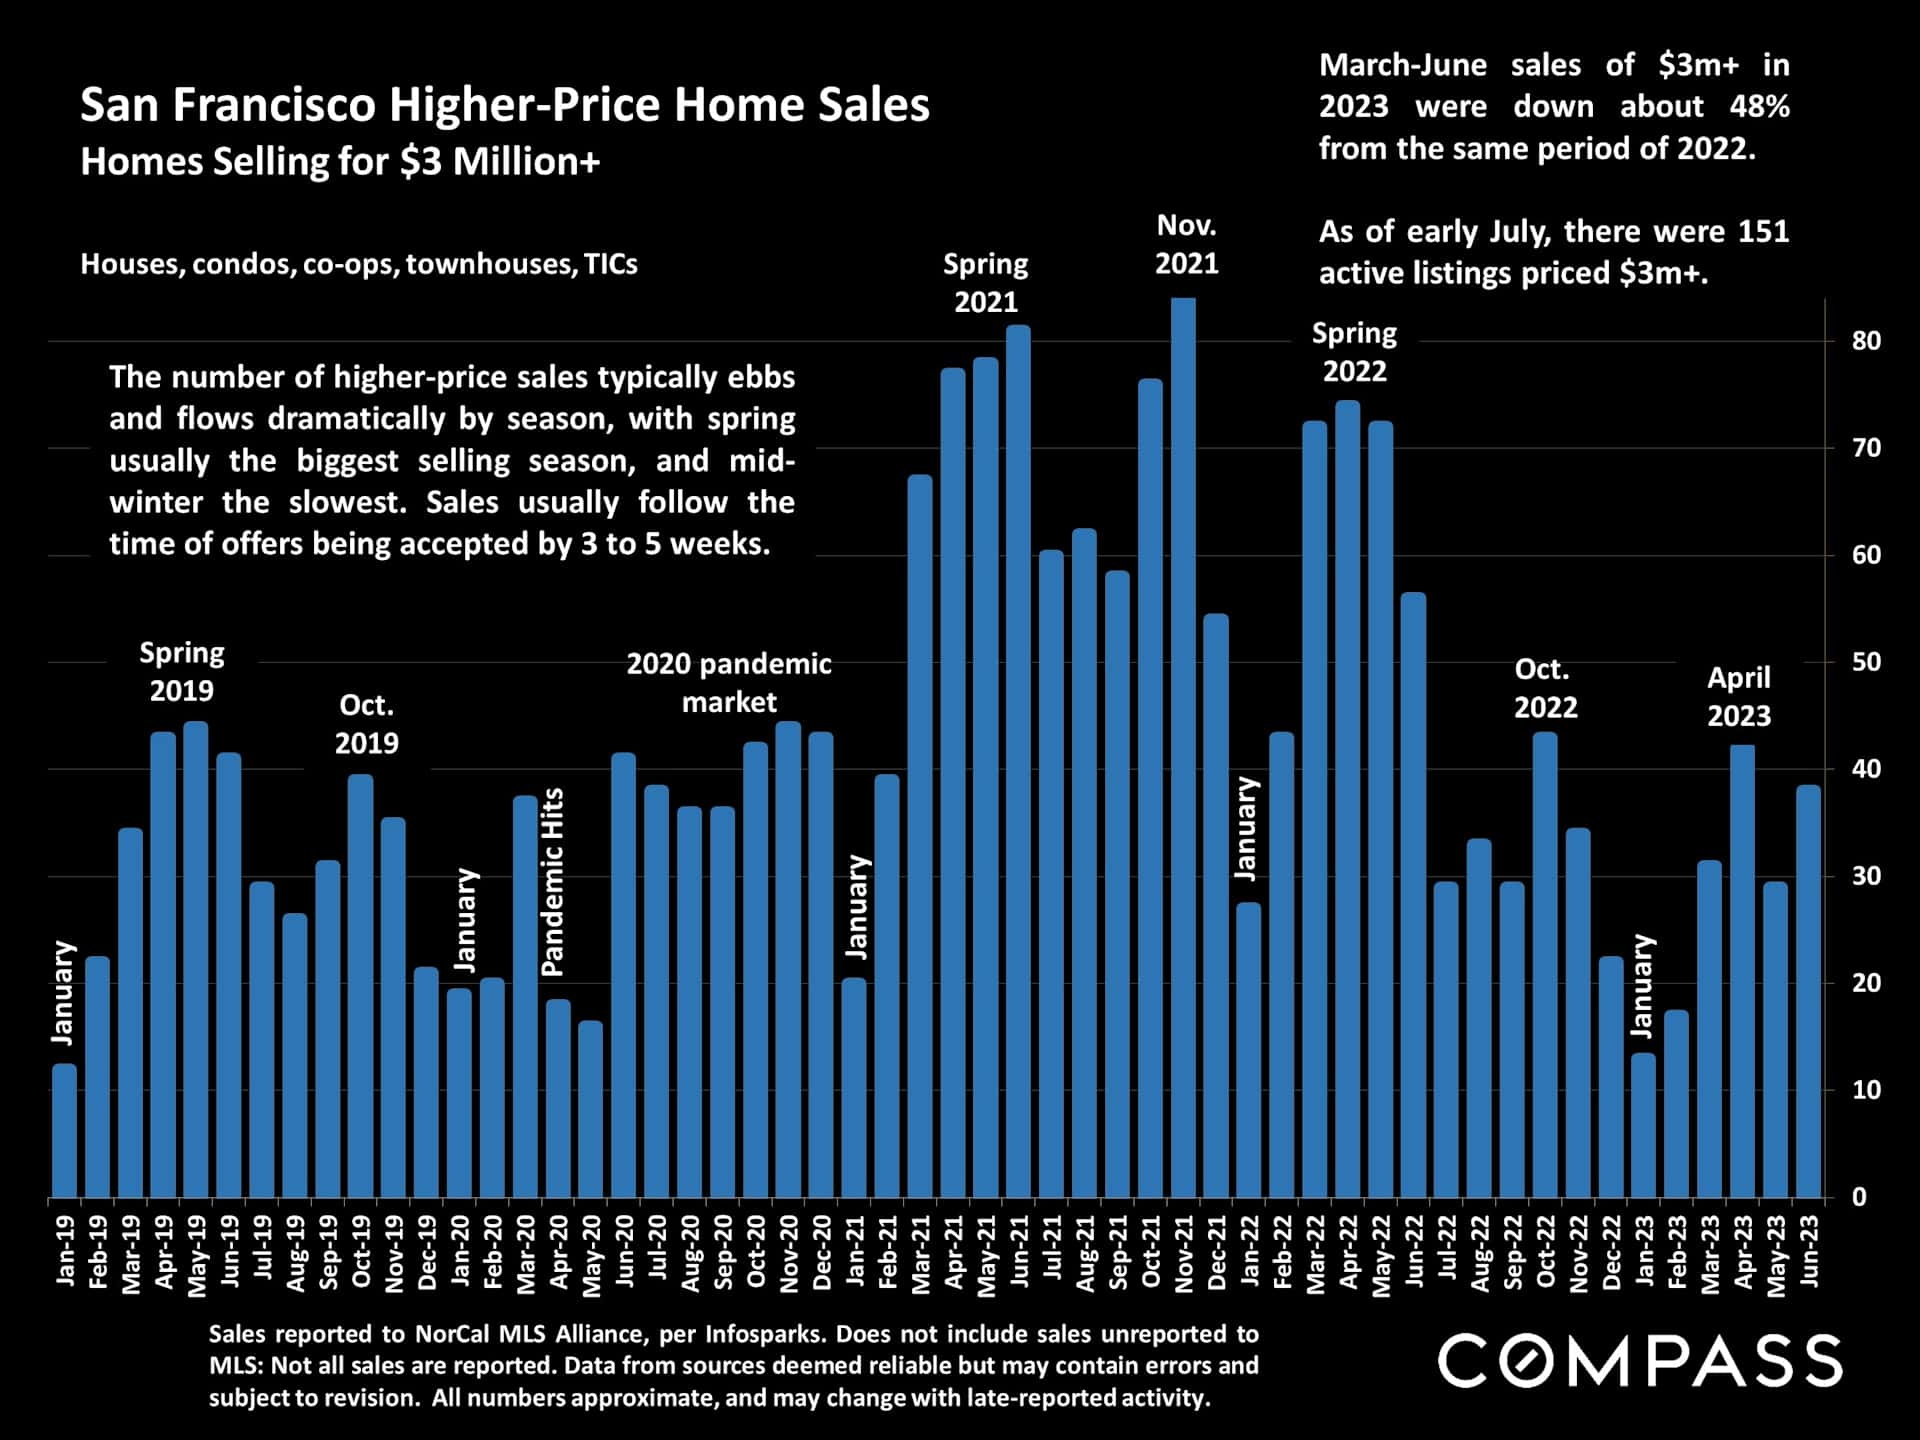
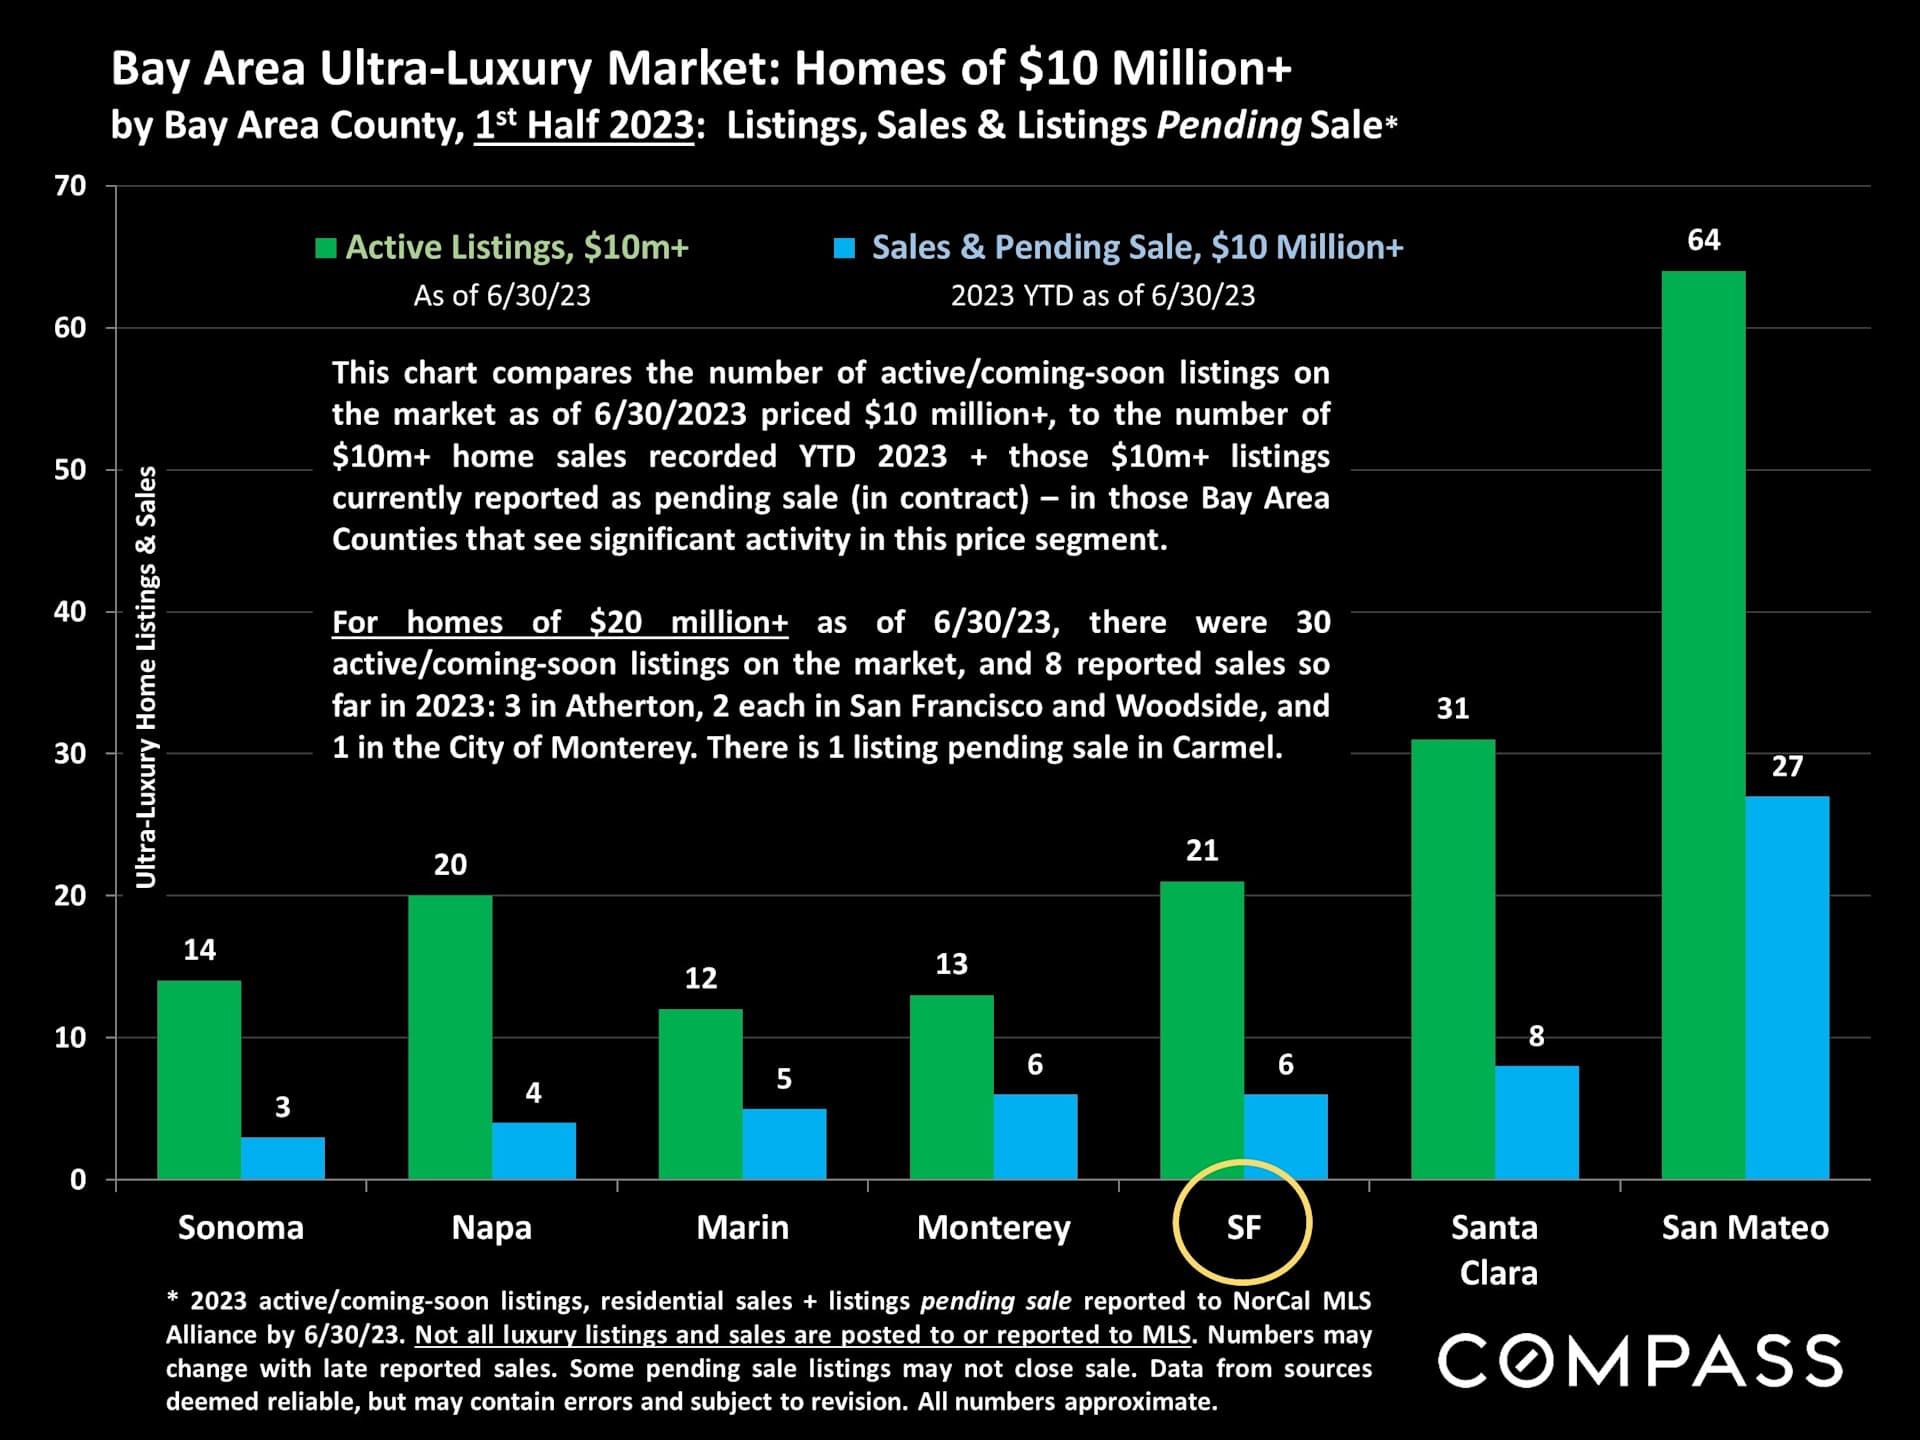
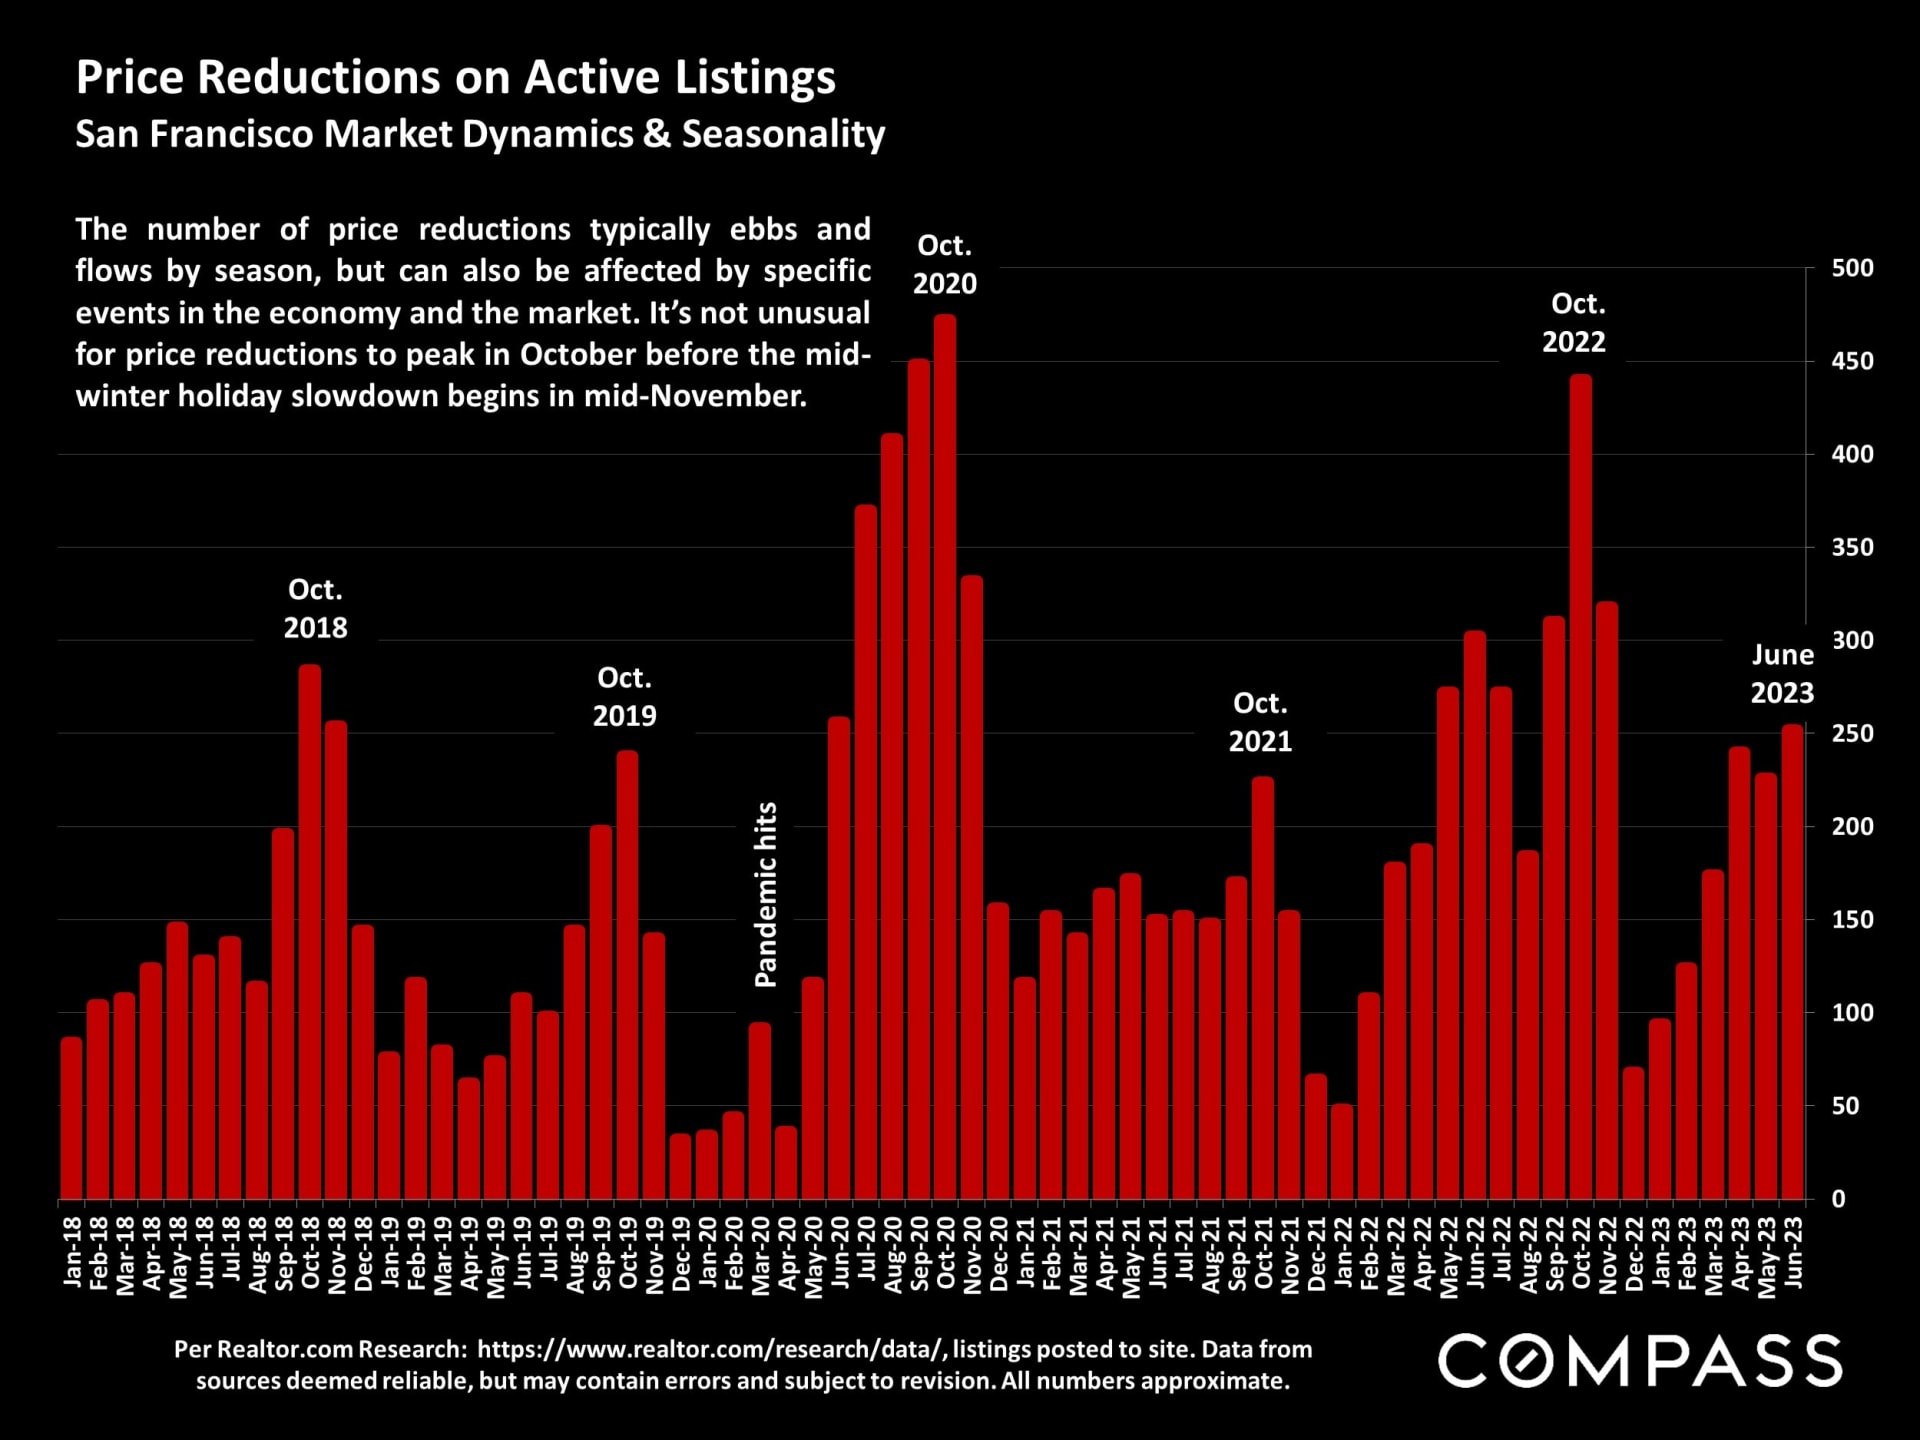
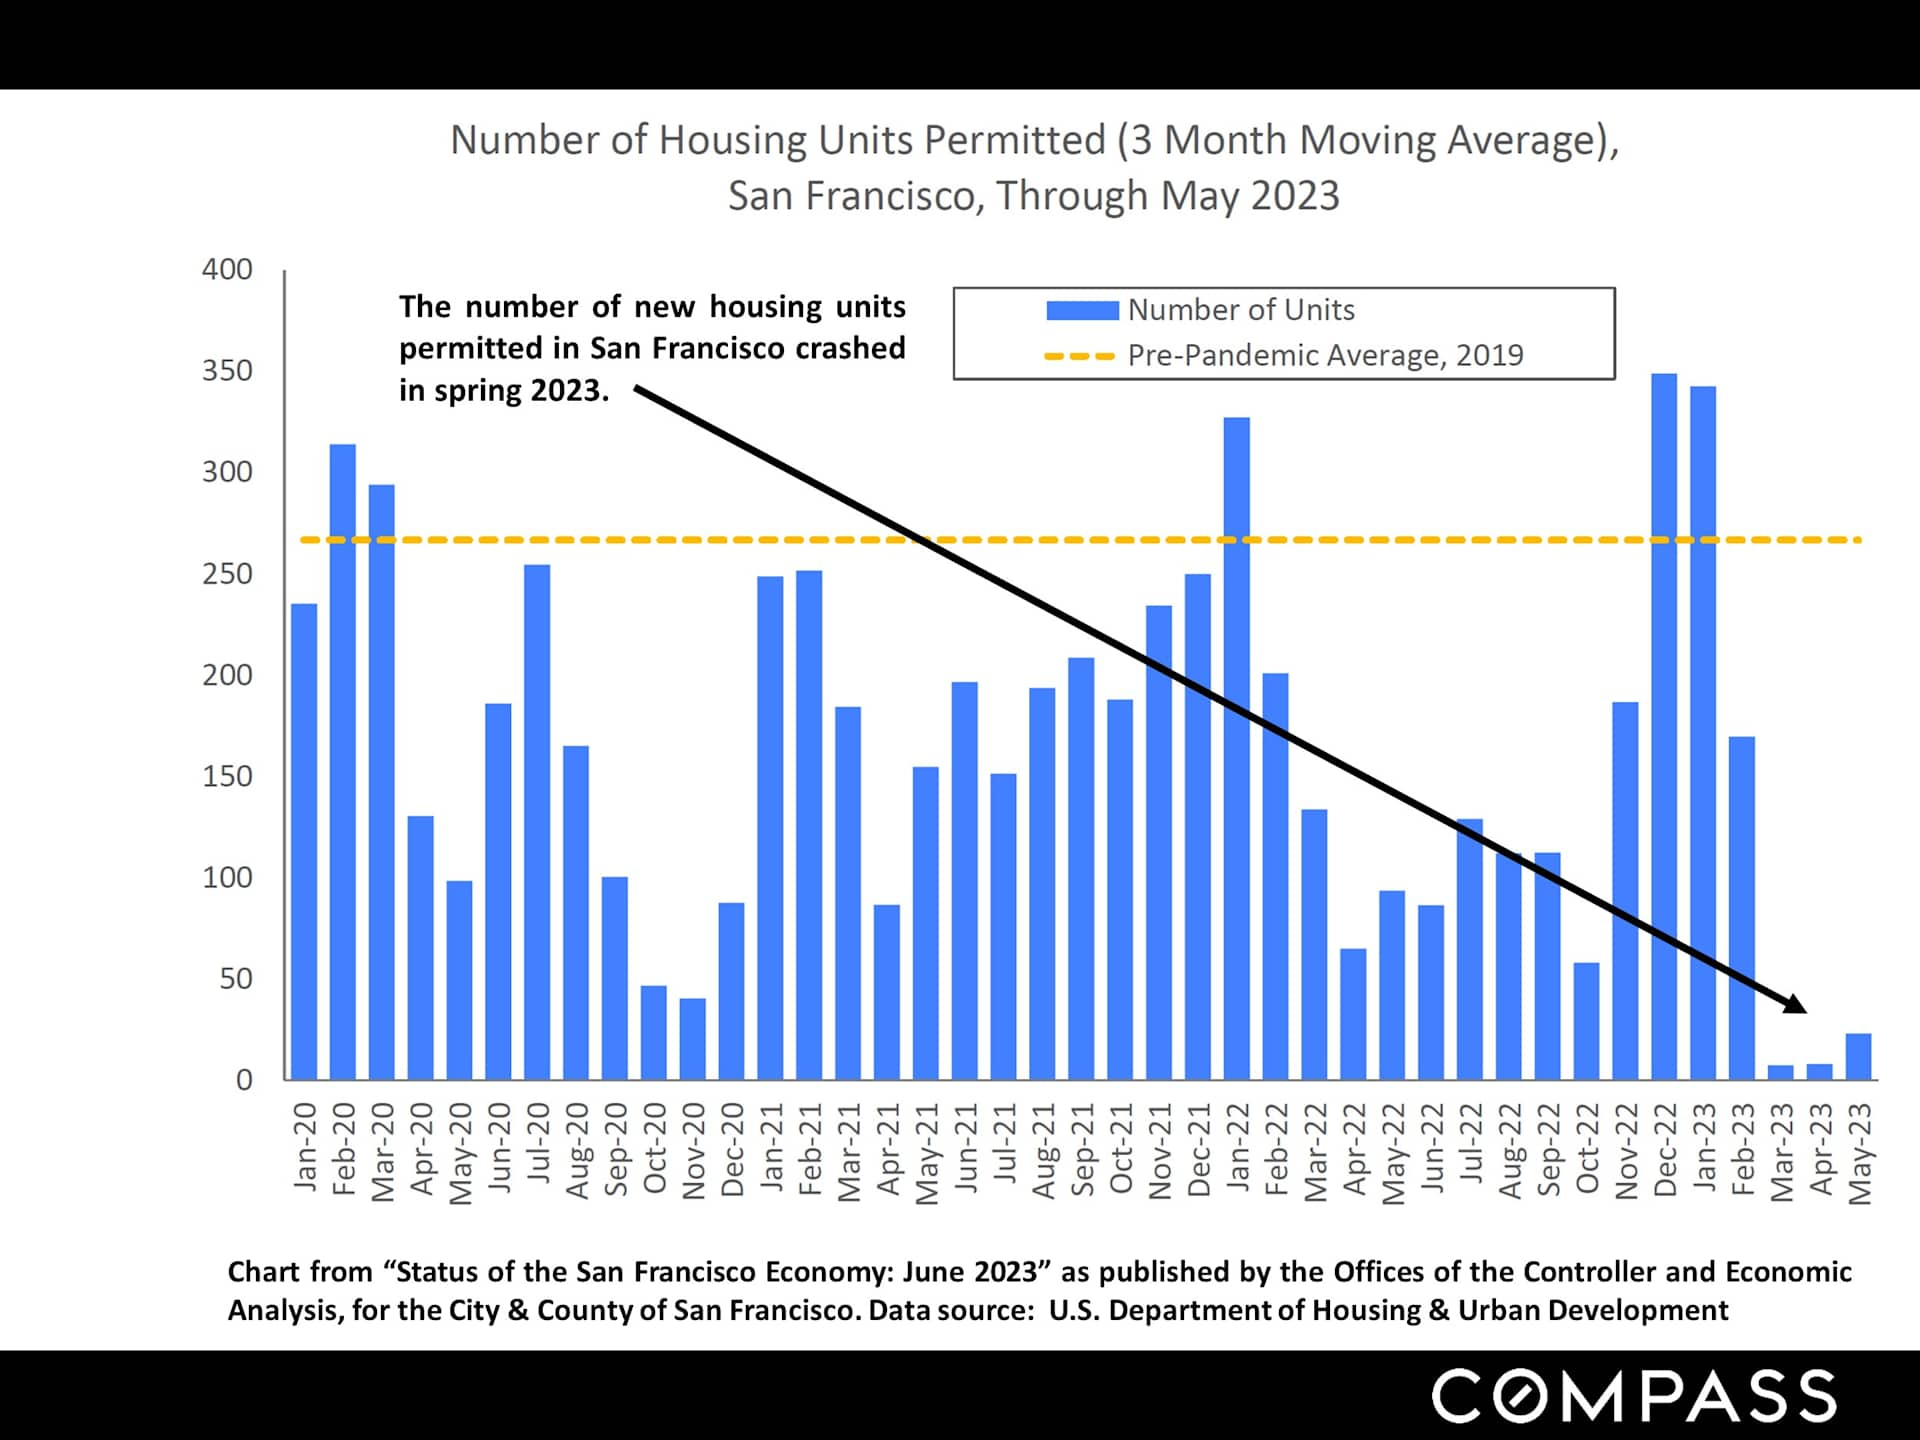
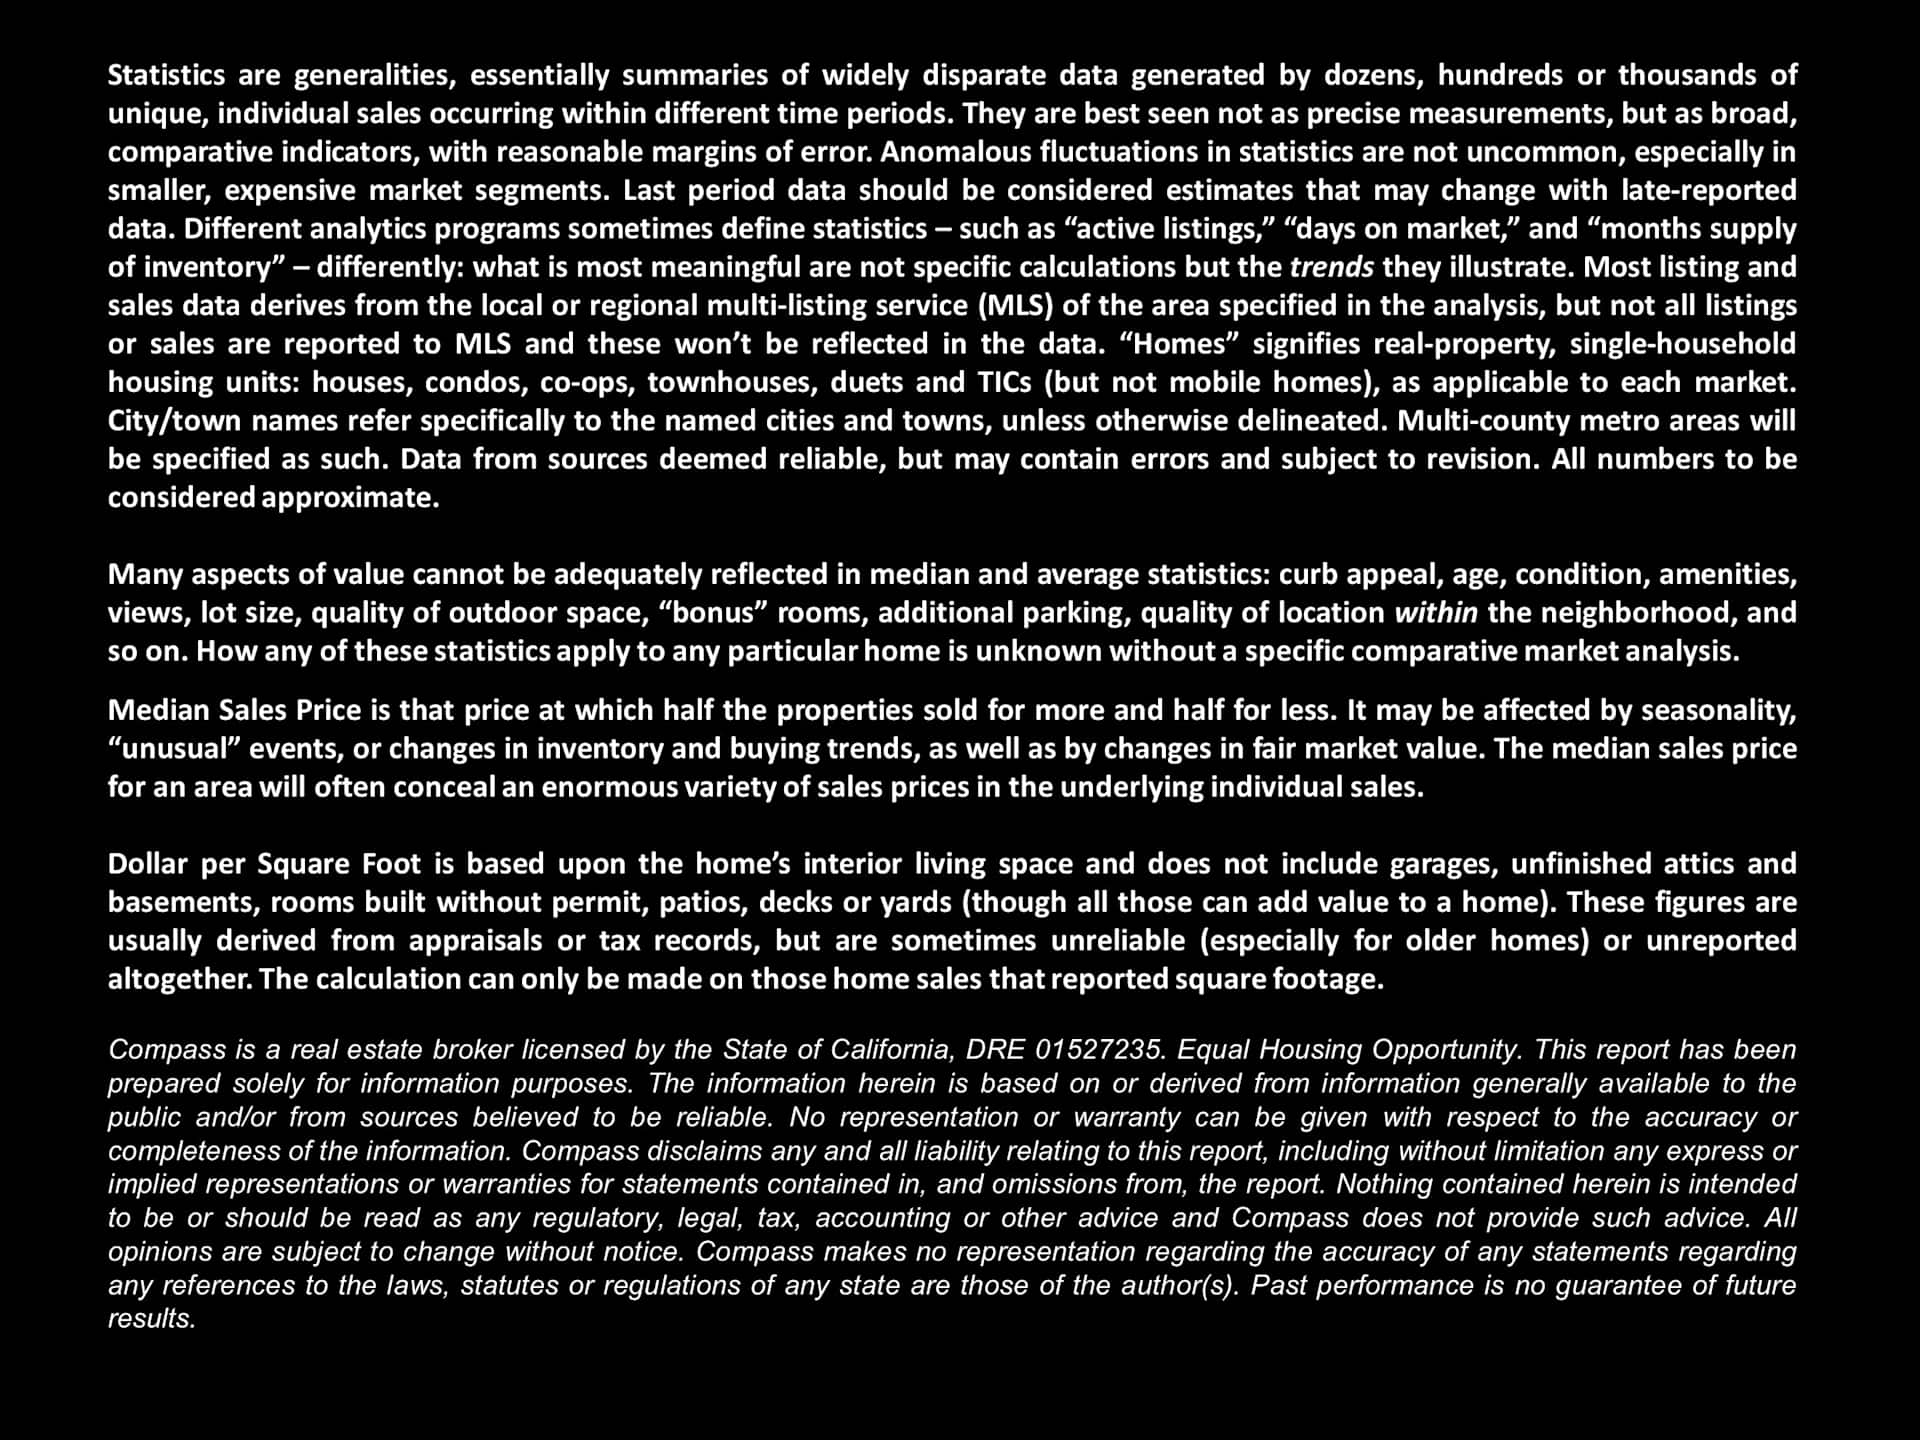
Text slide summarizing 2023 market dynamics, seller advantage, and seasonal Bay Area real estate trends.Chart of San Francisco quarterly median house prices from 2012 to 2023, peaking in Q2 2022 before declining.Chart of Bay Area county house price appreciation from 2000 to 2023, with Alameda highest at 243%.Chart of San Francisco condo prices by quarter, peaking at $1.3 million in Q2 2022 before declining.San Francisco house and condo median values per square foot, 2005–2023, shown as yellow bars and a white line.San Francisco spring 2023 real estate market table comparing price segments and property types.Bar chart comparing quarterly median house prices across four San Francisco district groups, Q2 2020–Q2 2023.Chart comparing quarterly median house sale prices across four San Francisco district groups, Q2 2020 to Q2 2023.San Francisco condo price chart comparing quarterly median sales prices across three district groups, Q2 2020 to Q2 2023.Bar chart comparing median San Francisco condo prices across three neighborhood groups, from Q2 2020 to Q2 2023.Chart comparing San Francisco luxury home sales by district and price segment over 12 months.Chart of San Francisco luxury condo, co-op, and TIC sales by district and price range.San Francisco days-on-market chart comparing condos and houses from January 2019 to June 2023.San Francisco overbidding chart shows monthly home sales over list price from 2018 to June 2023.Chart comparing San Francisco house and condo sale prices with original list prices, January 2019 to June 2023.San Francisco housing infographic with housing statistics, highlighted occupancy figures, and an apartment floor plan.San Francisco County population by age group in 2020 and 2022, with the largest decline among ages 25–39.Chart of monthly San Francisco new listings from December 2019 to June 2023, with June 2023 highlighted.San Francisco active and coming-soon listing counts, peaking in October 2022 and recovering by July 2023.San Francisco active-listings trend chart, January 2019–June 2023, with June comparisons highlighted.Line chart of San Francisco pending listings, January 2019–June 2023, with seasonal peaks and annotated market trends.Bar chart of San Francisco monthly home sales, January 2019–June 2023, with pandemic and seasonal annotations.Chart of San Francisco home sales over $3 million, with monthly bars from 2019 to June 2023.Chart comparing $10 million-plus active listings and 2023 sales or pending sales across seven Bay Area counties.Bar chart of San Francisco active-listing price reductions, January 2018 to June 2023, with October peaks and pandemic marker.Chart of San Francisco housing permits through May 2023, with a dashed 2019 average and a sharp spring decline.Real estate market statistics definitions and Compass disclaimer.

Work With Us

We will help you understand the complex aspects of the transaction and share our expertise so that you can make the best decisions possible. We are experienced, market savvy, and energetic. With both of us working for our clients, you get twice the amount of attention and insight.