
The SF Team, Eva + James, Compass

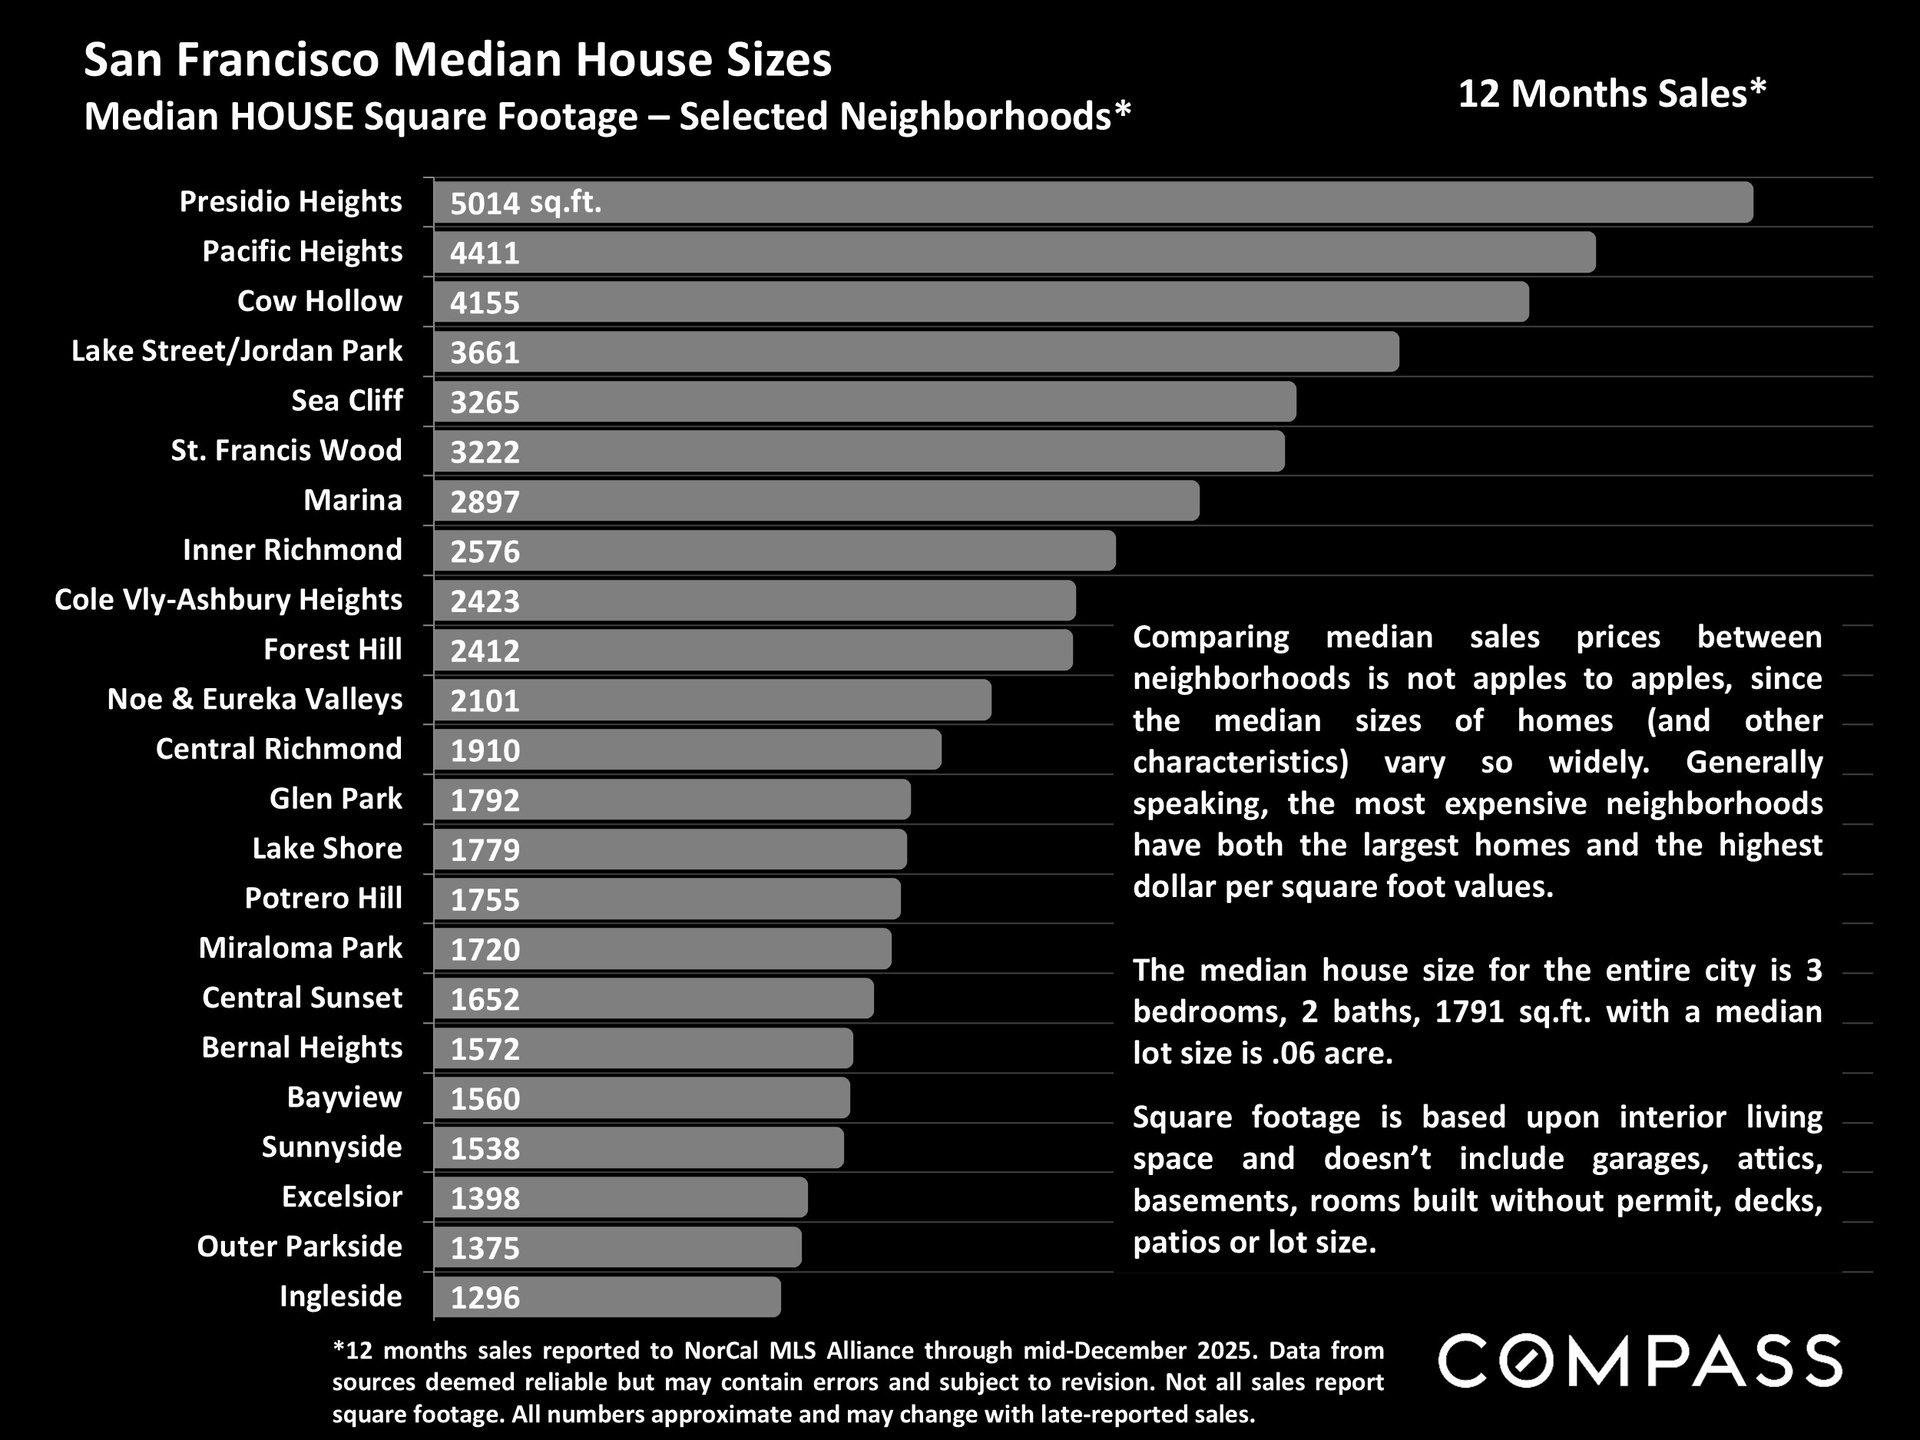
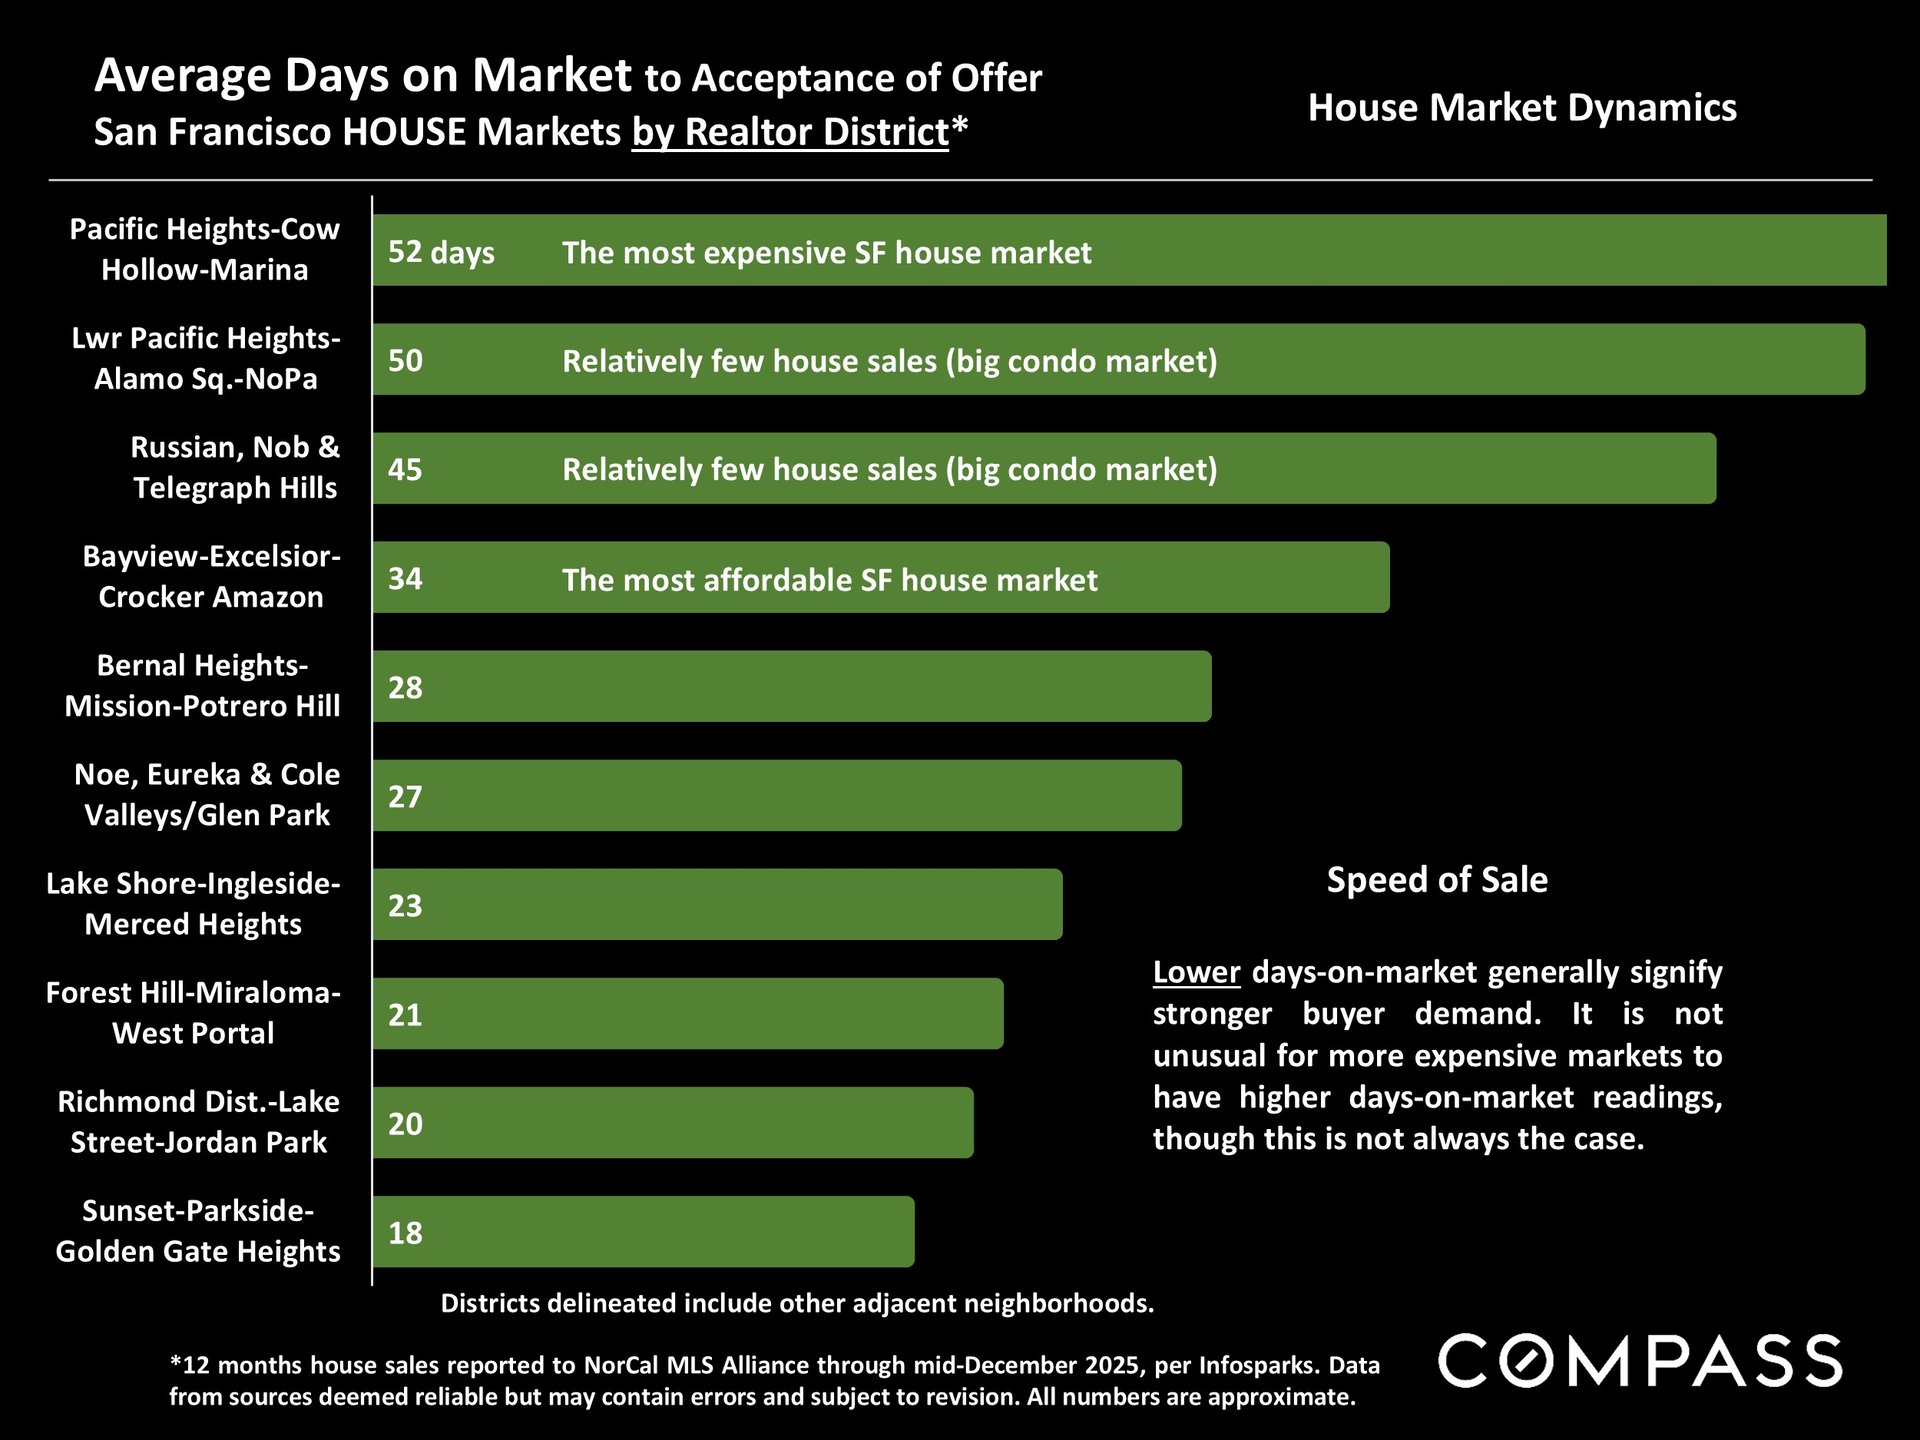
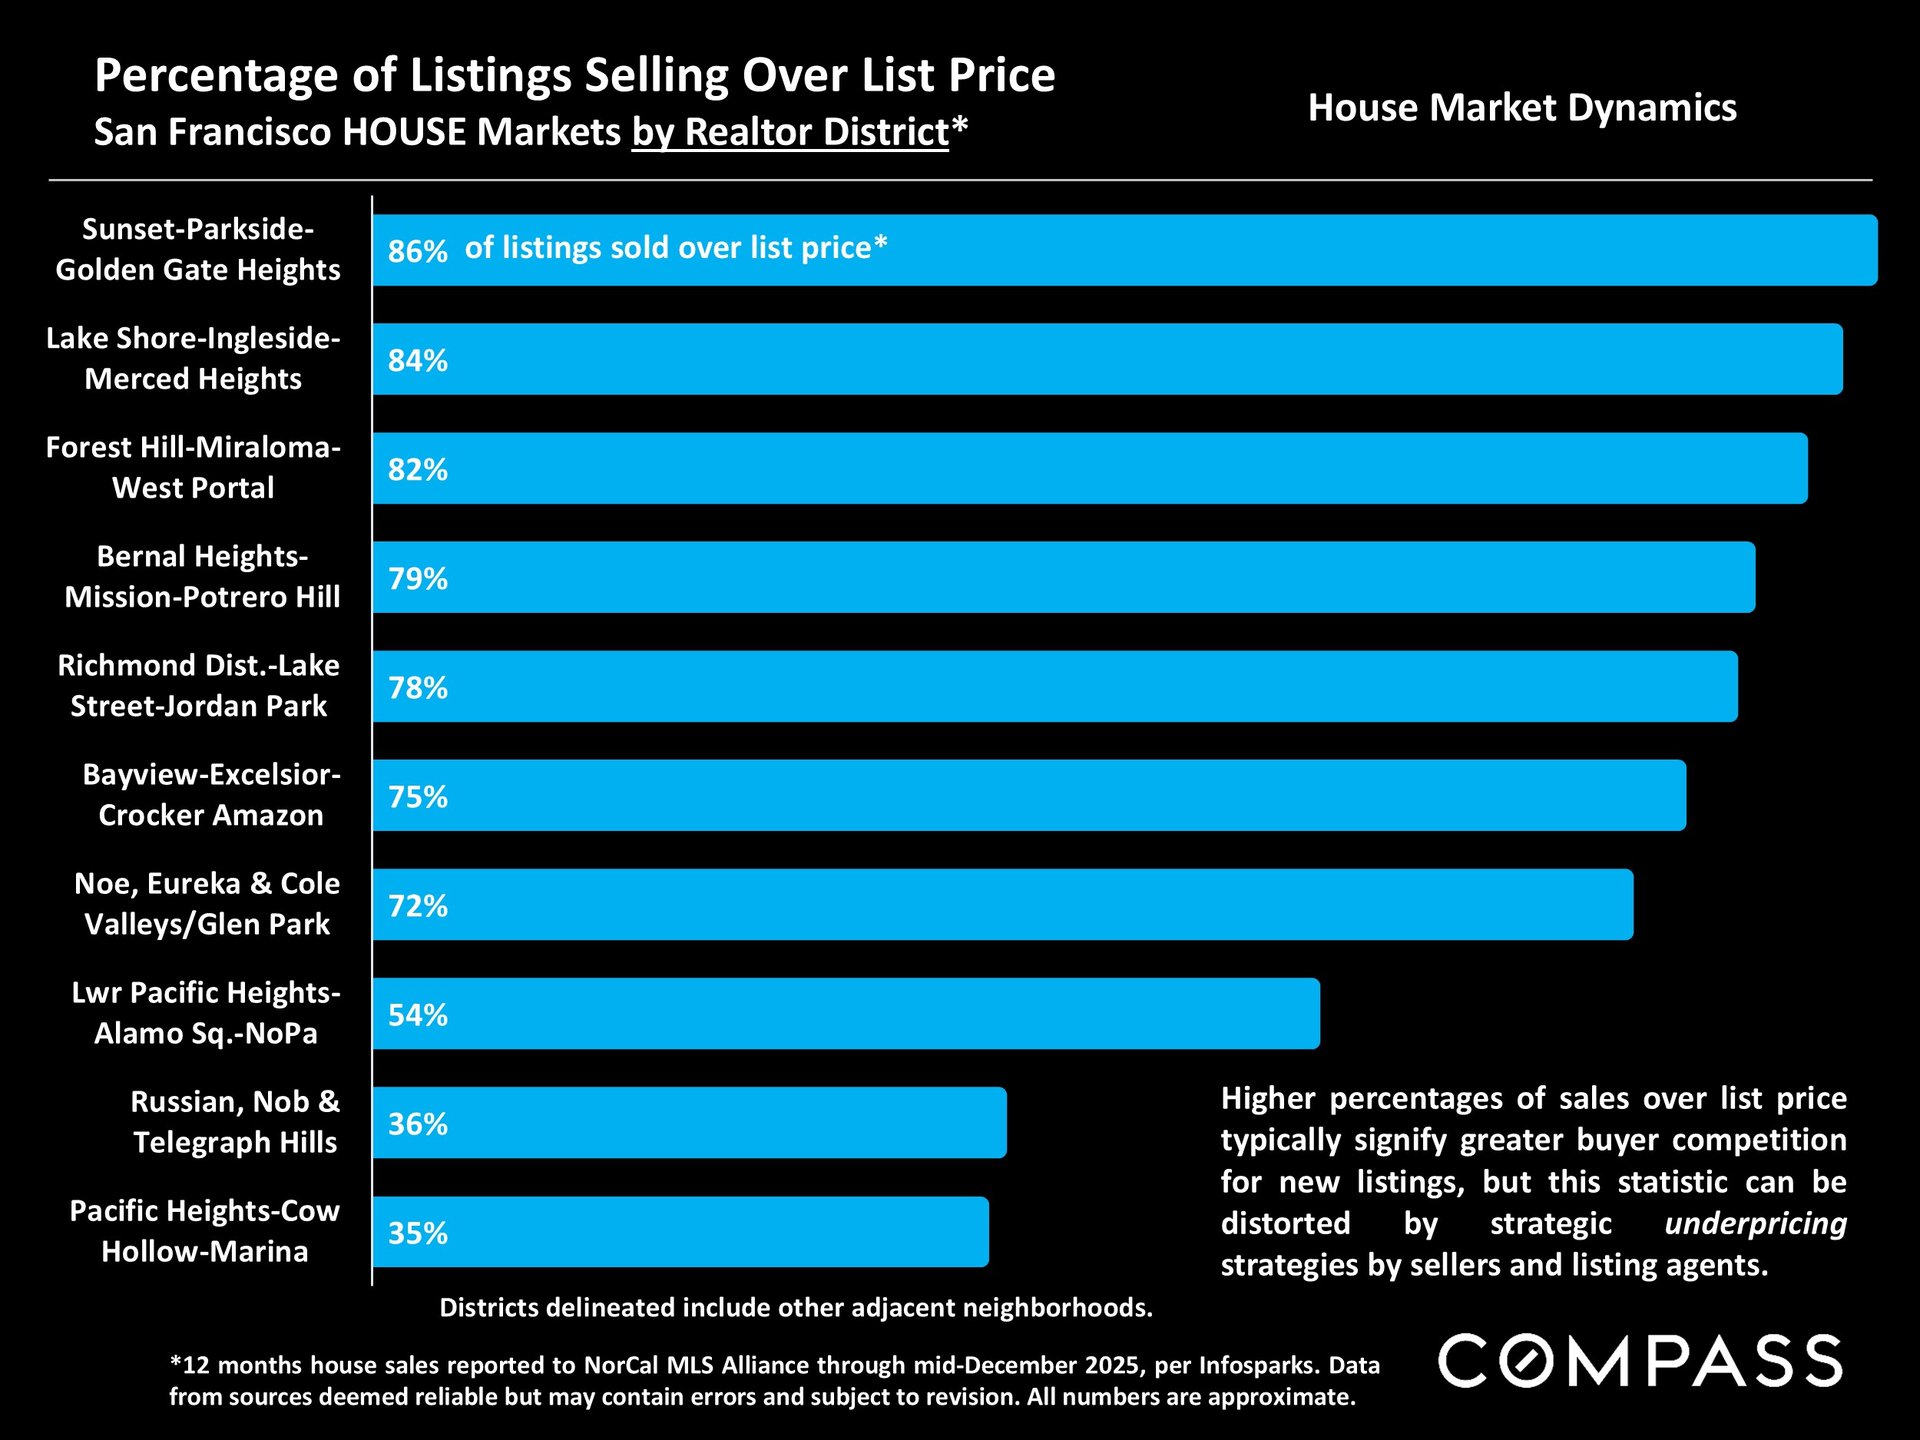
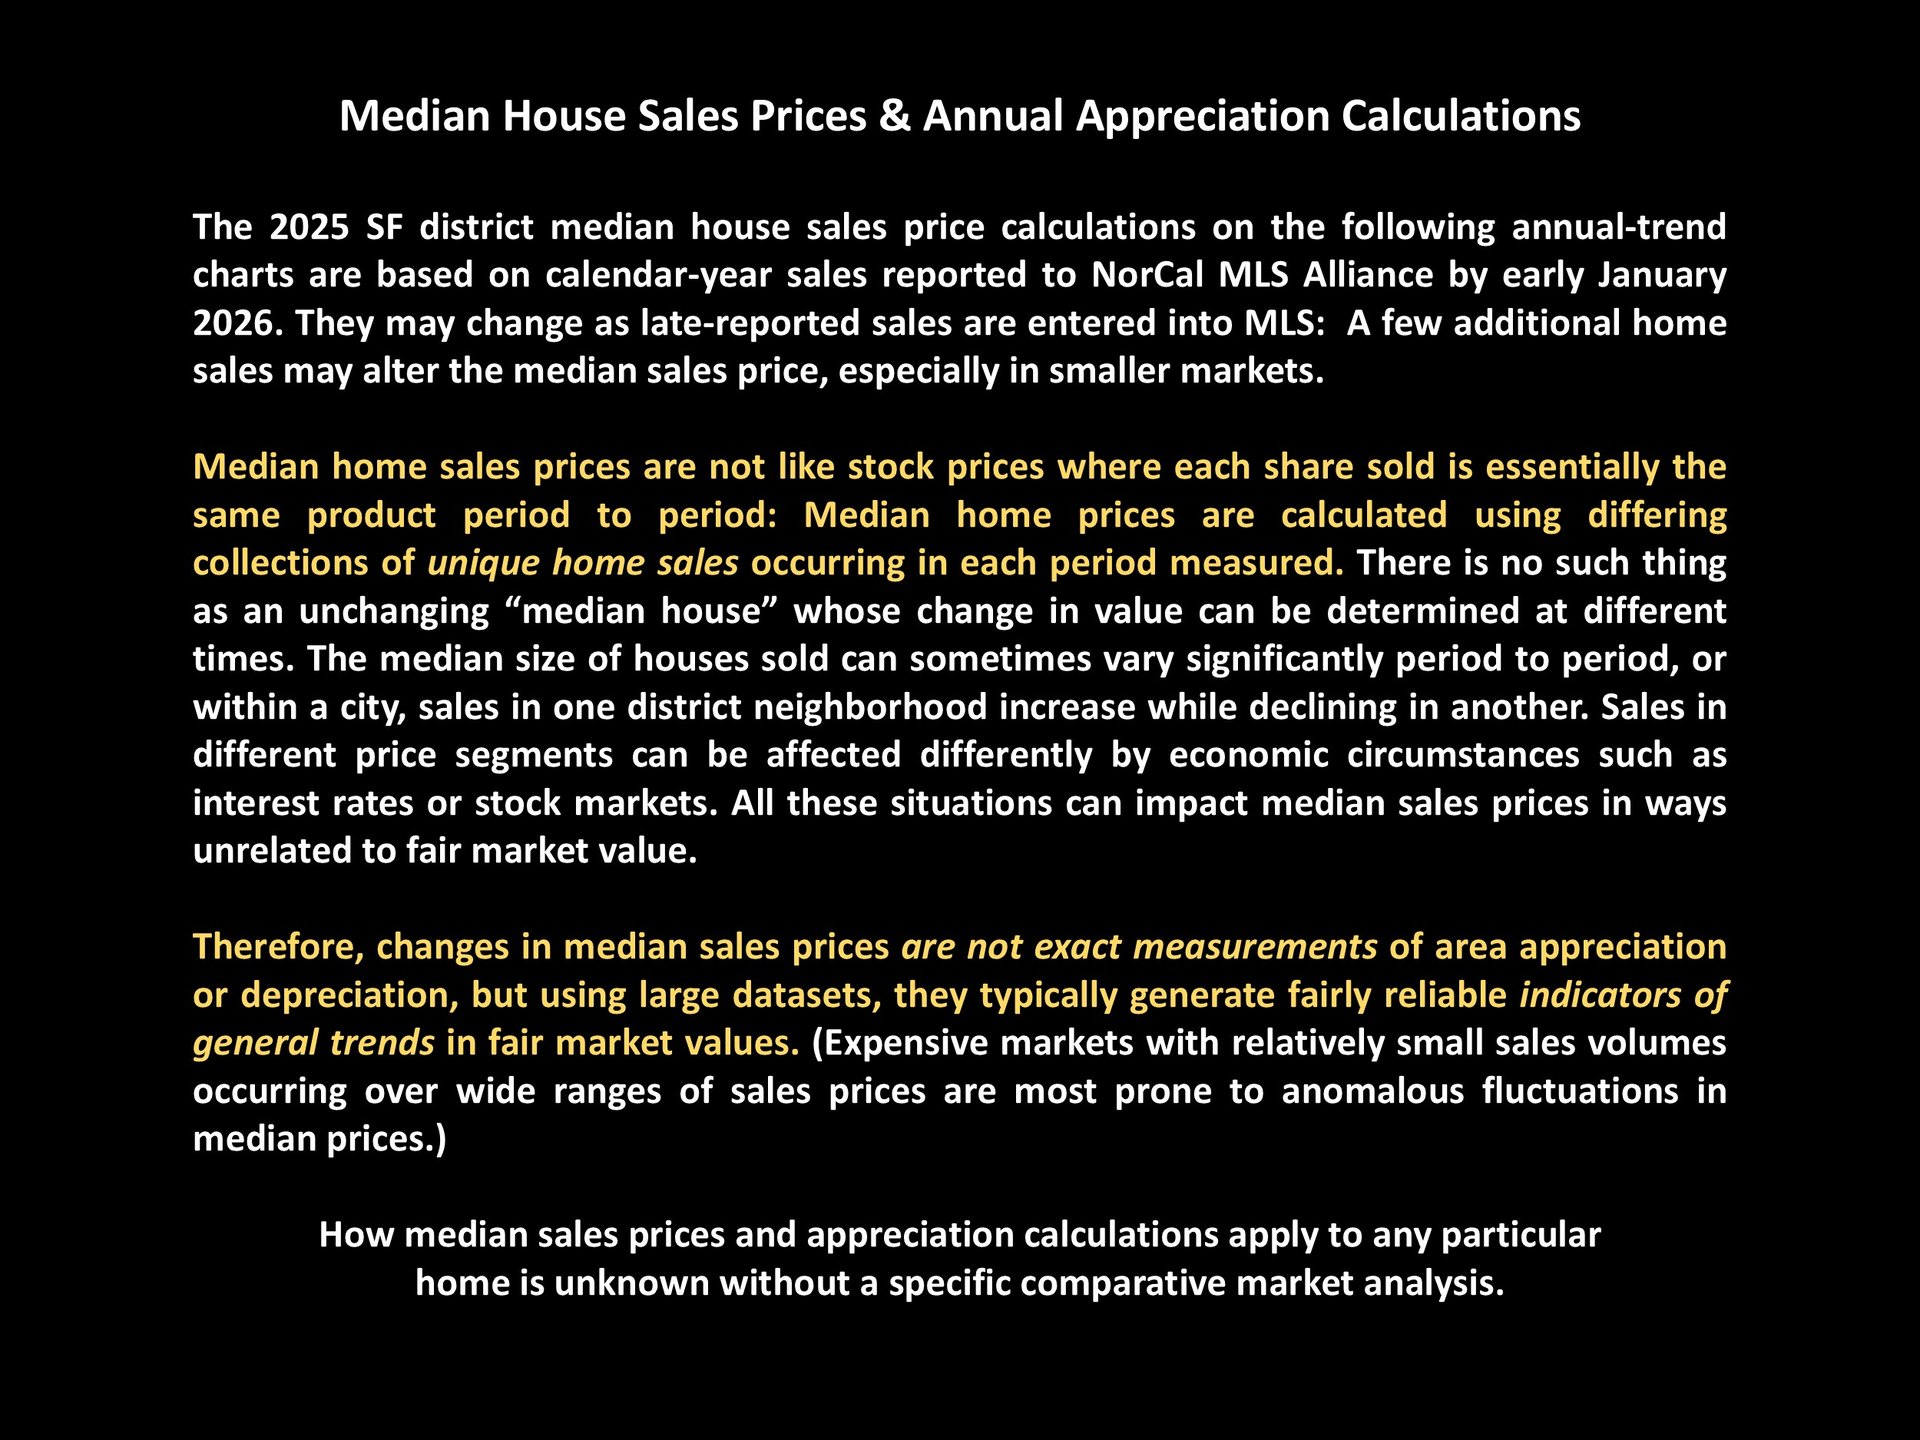
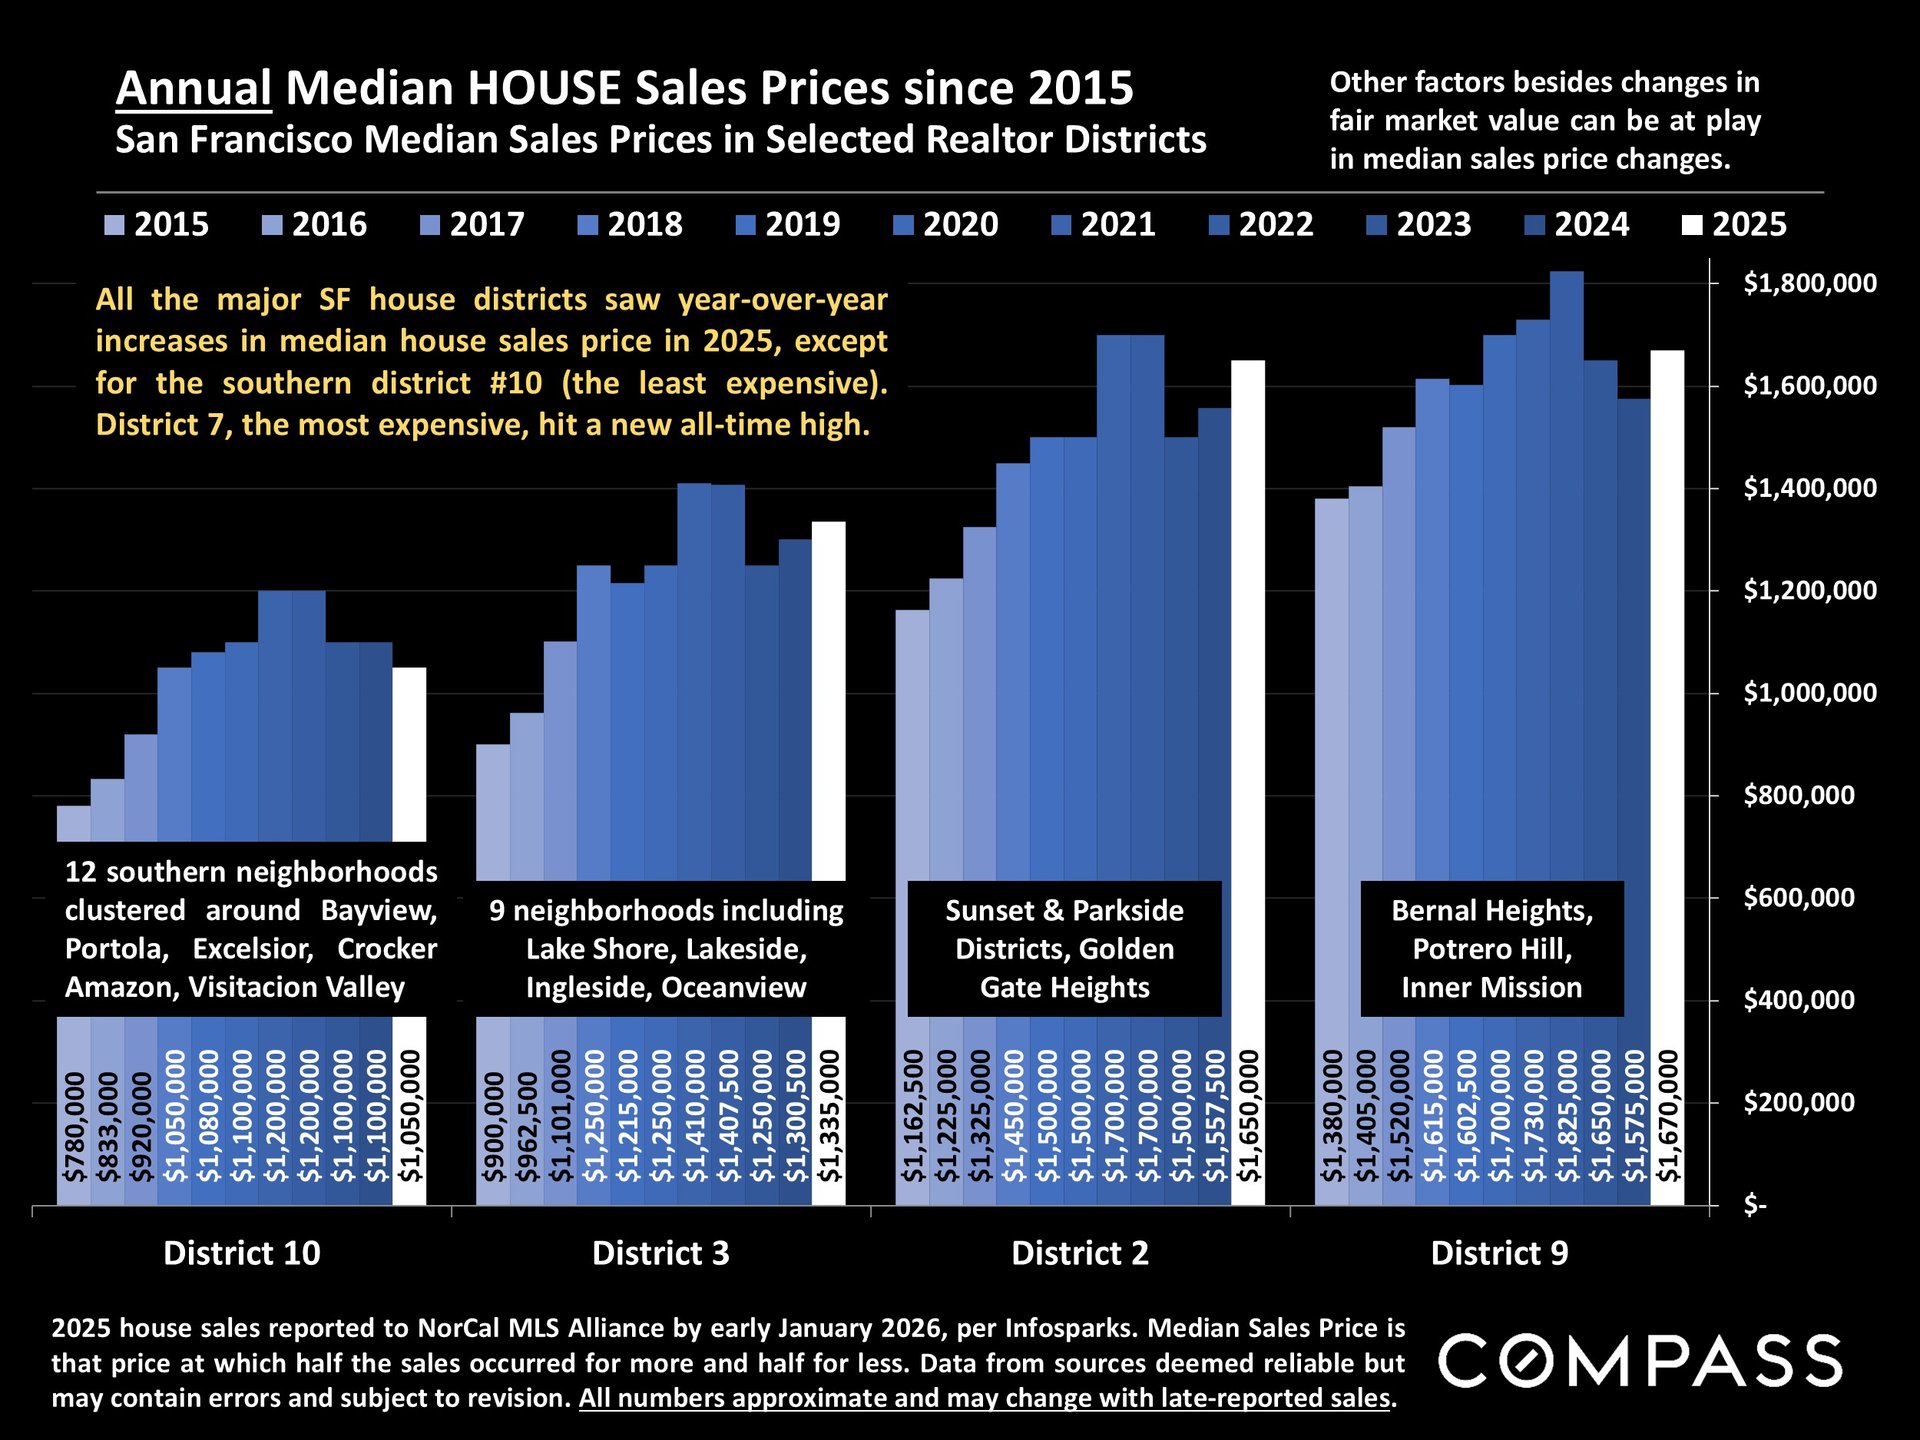
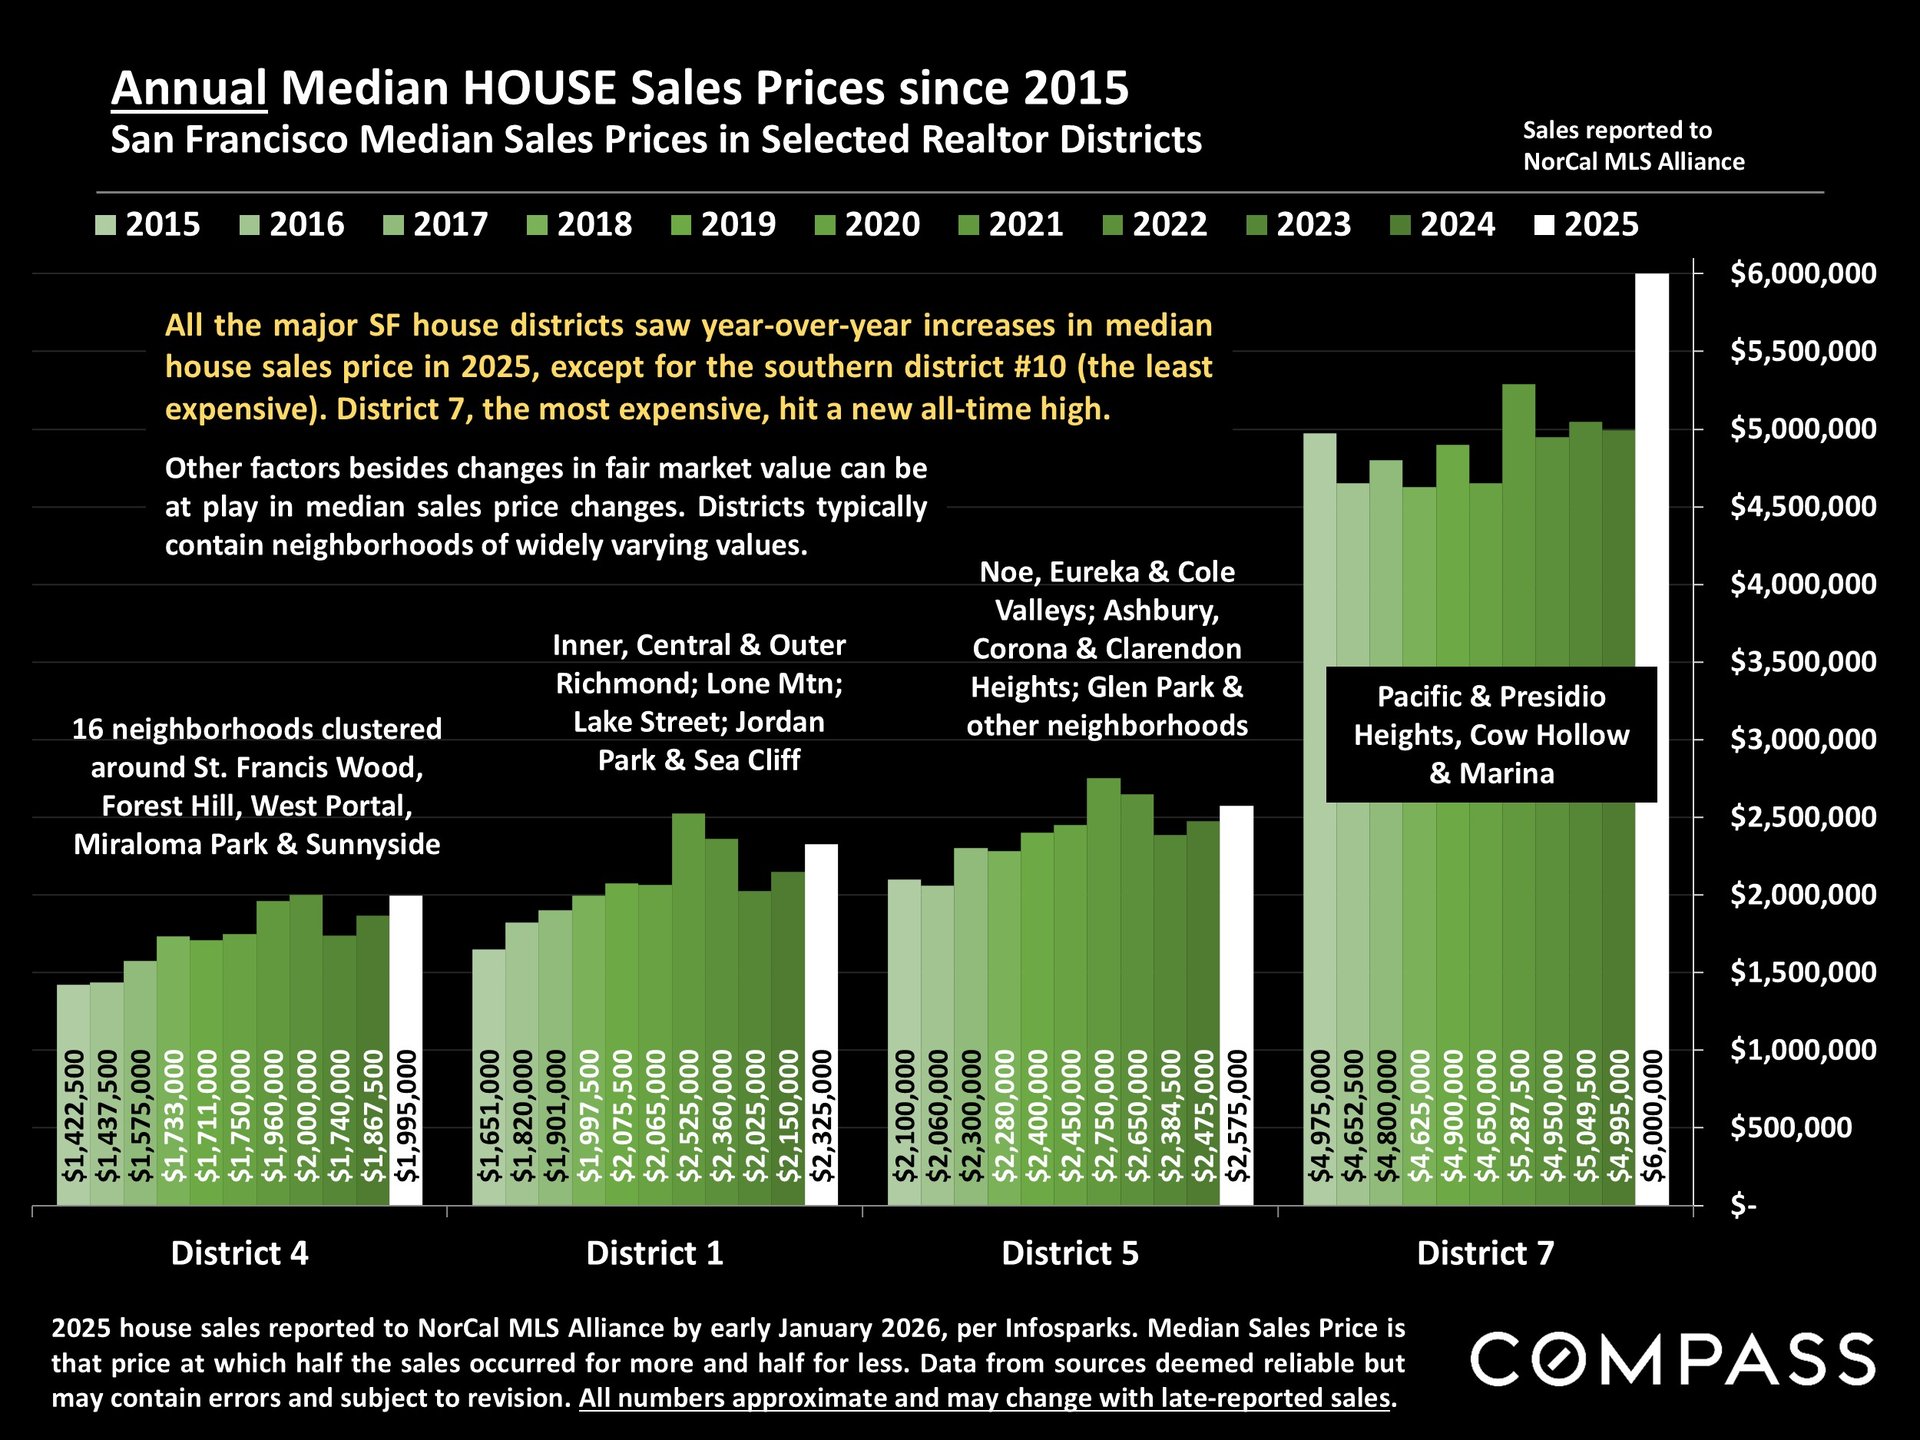
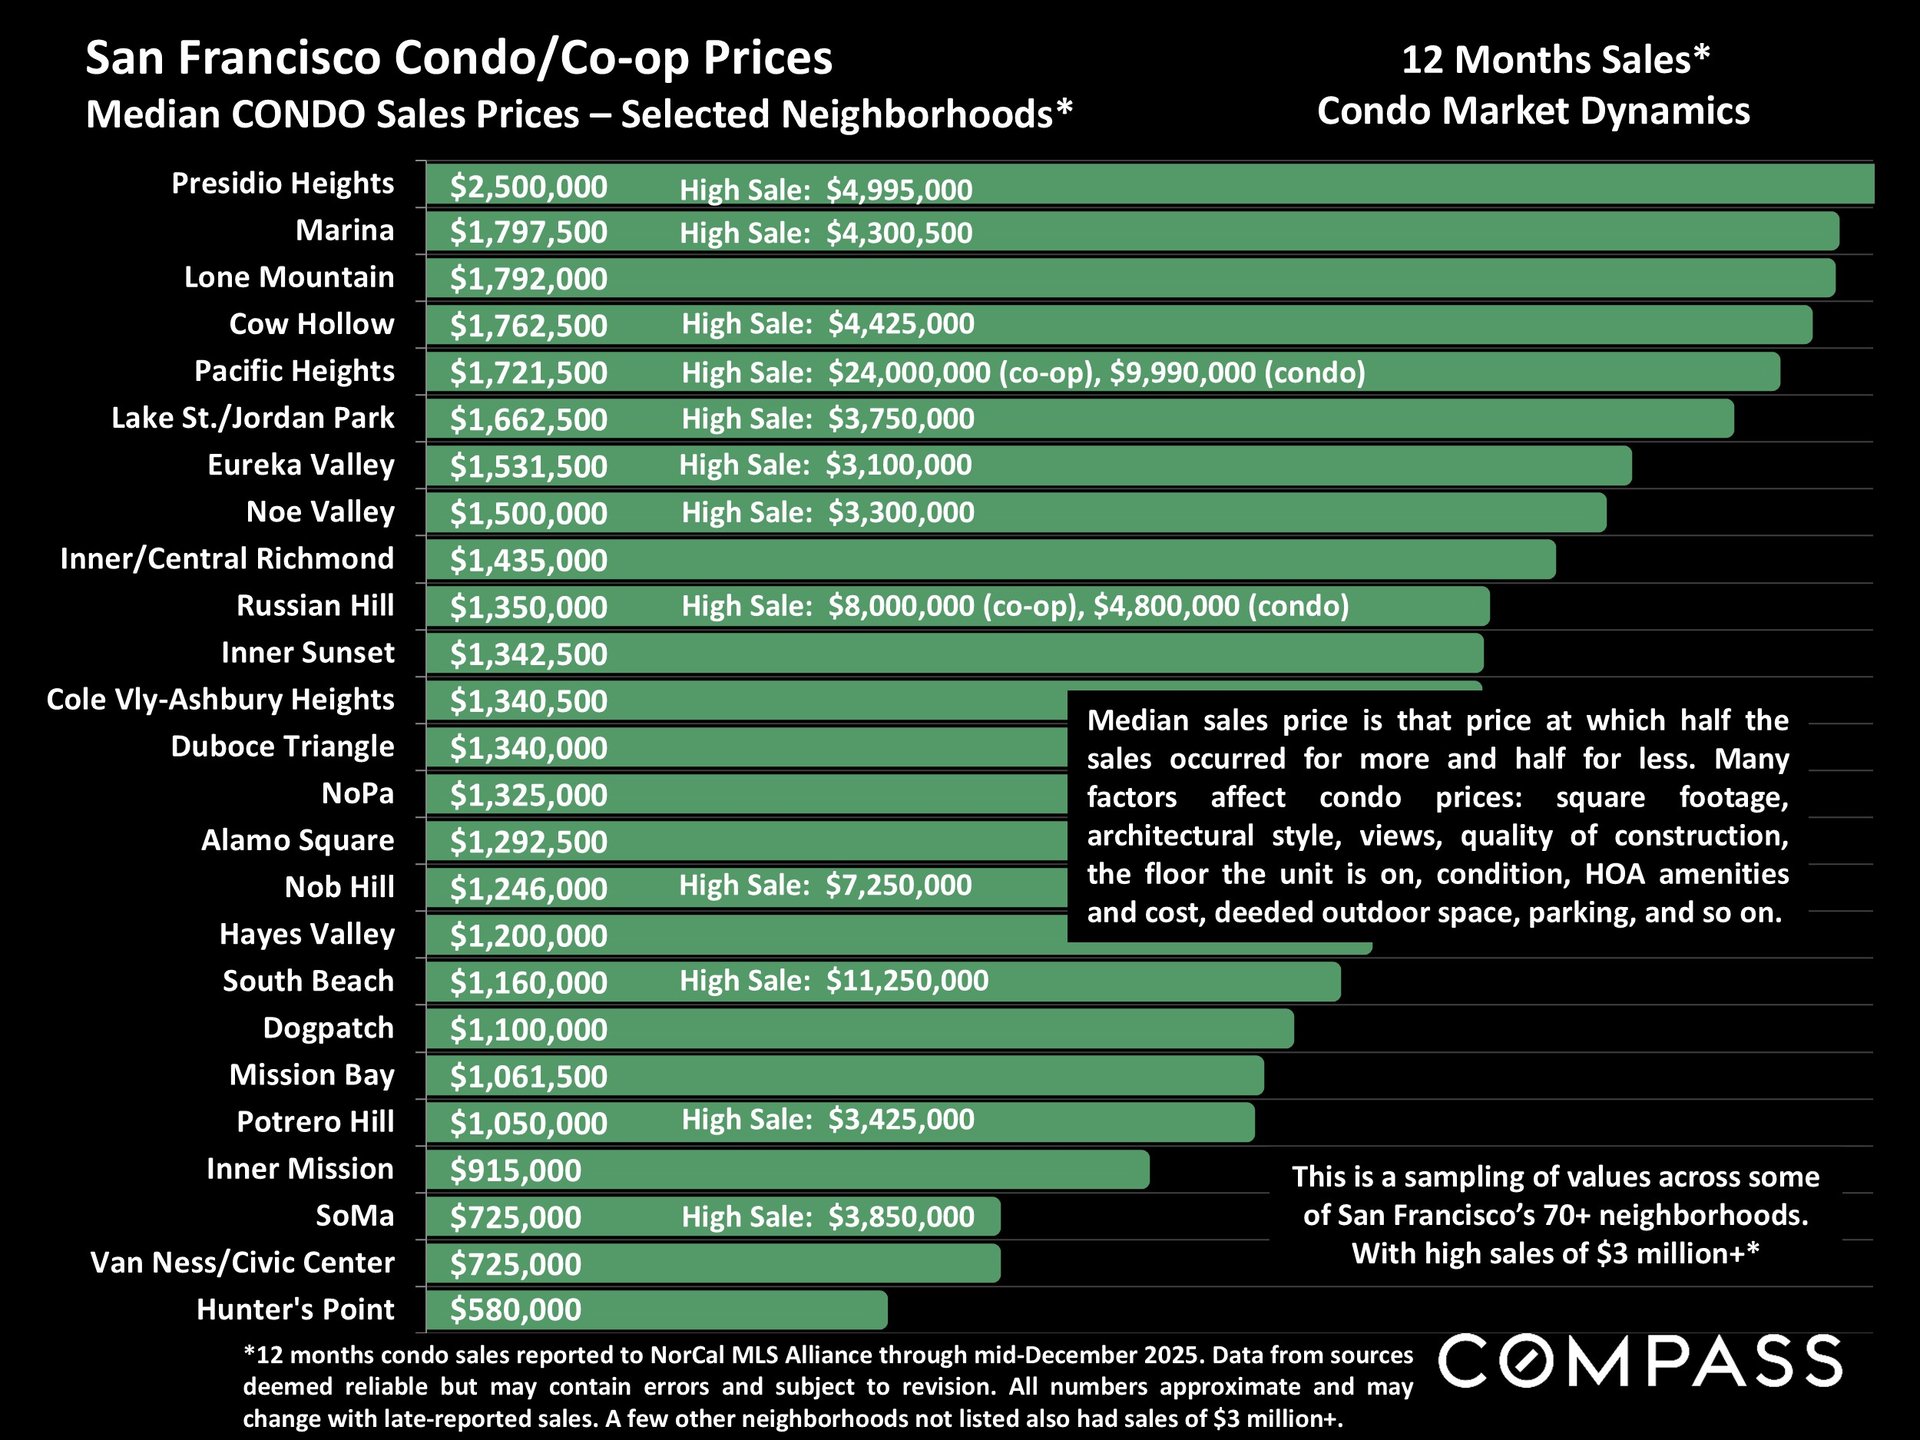
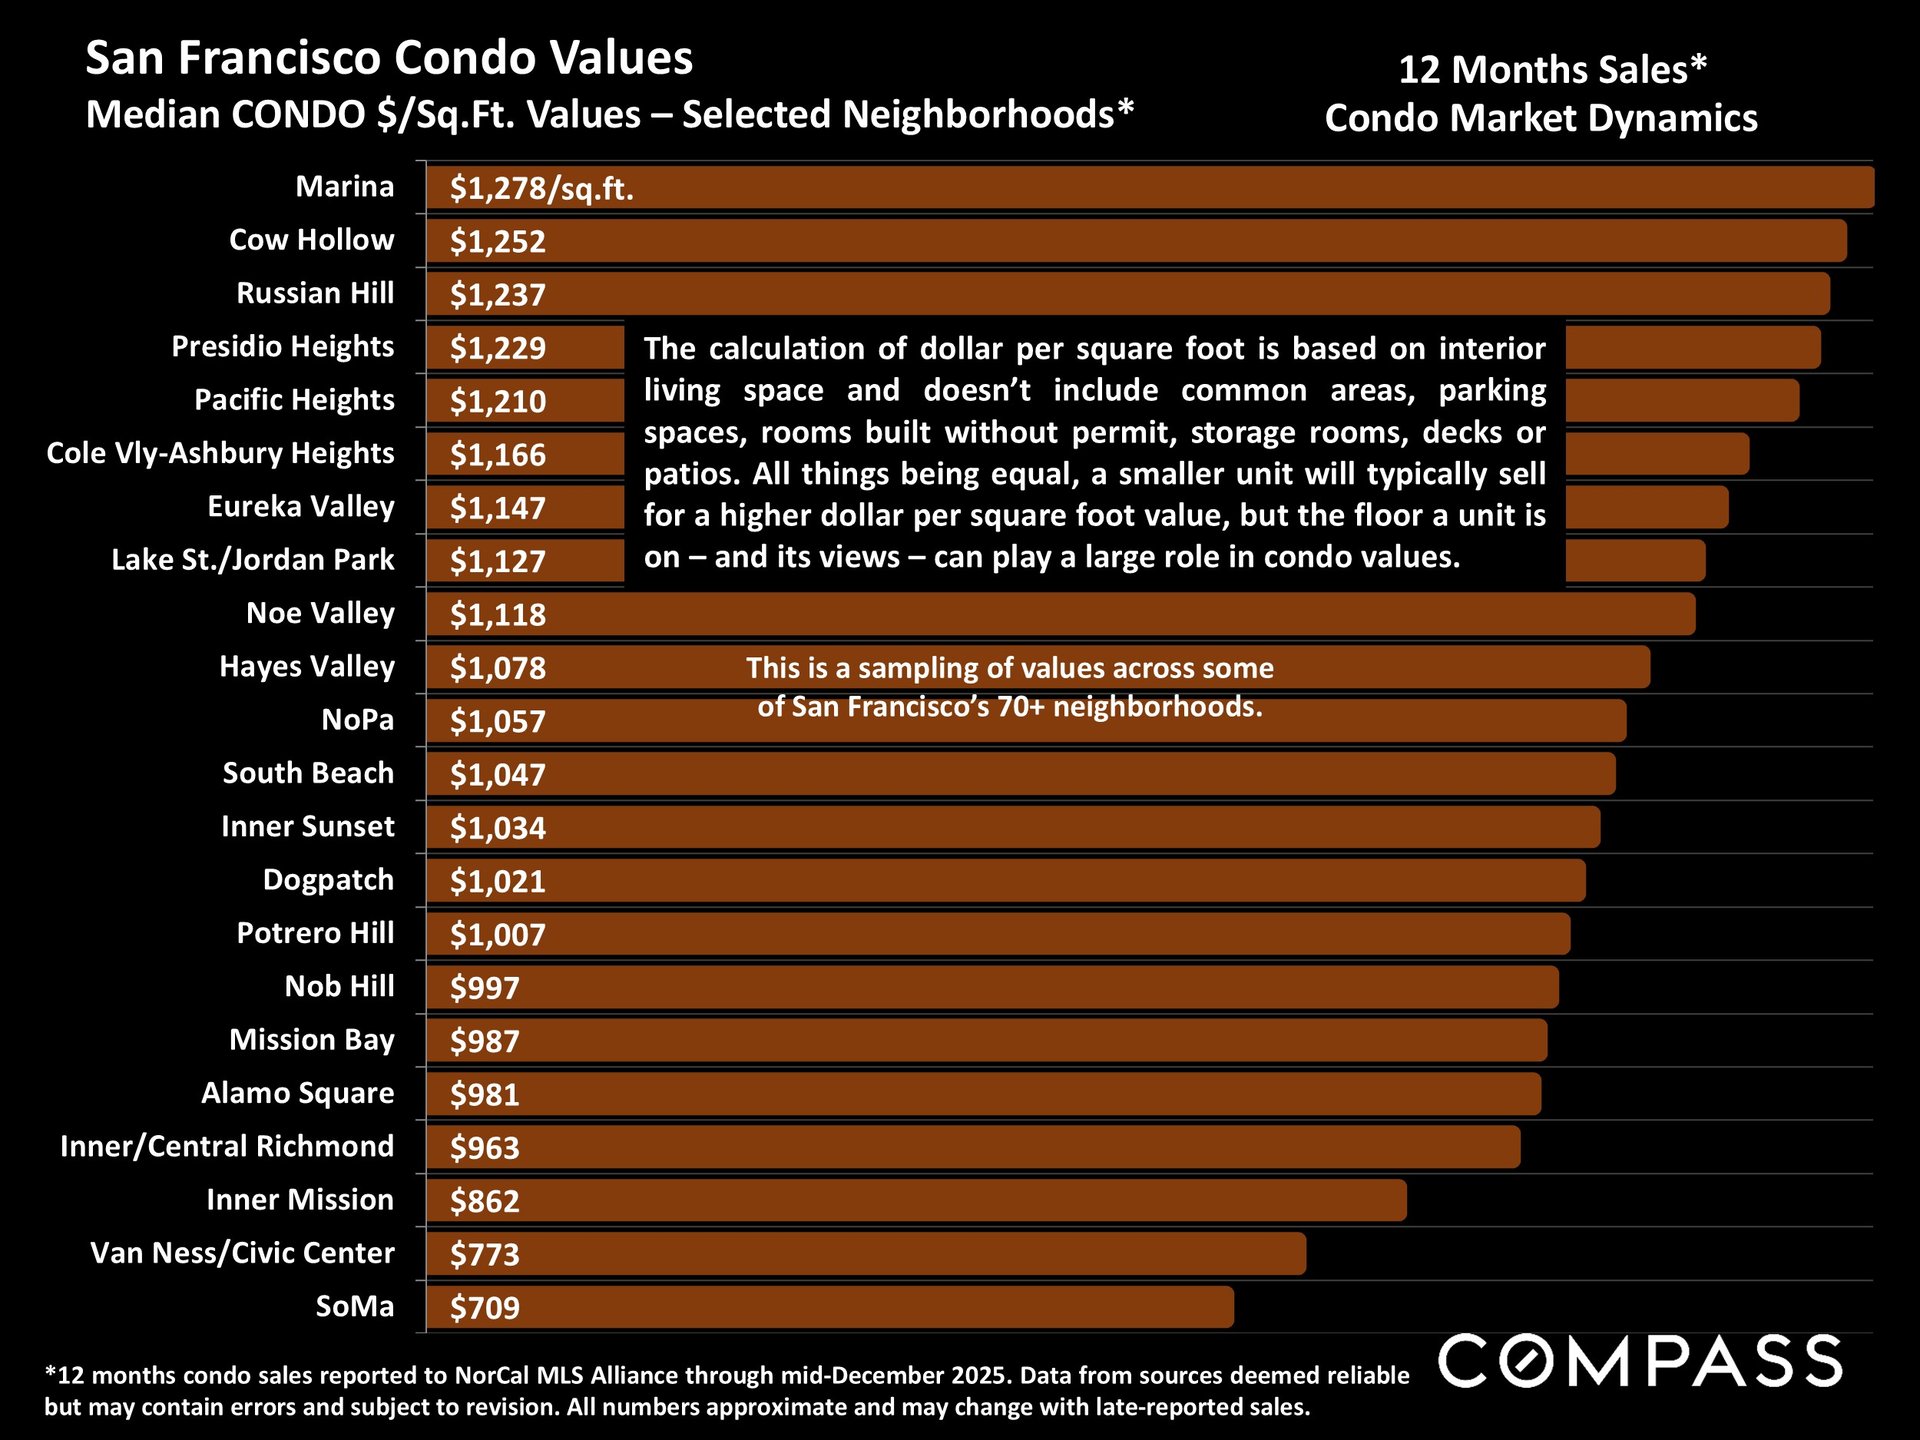
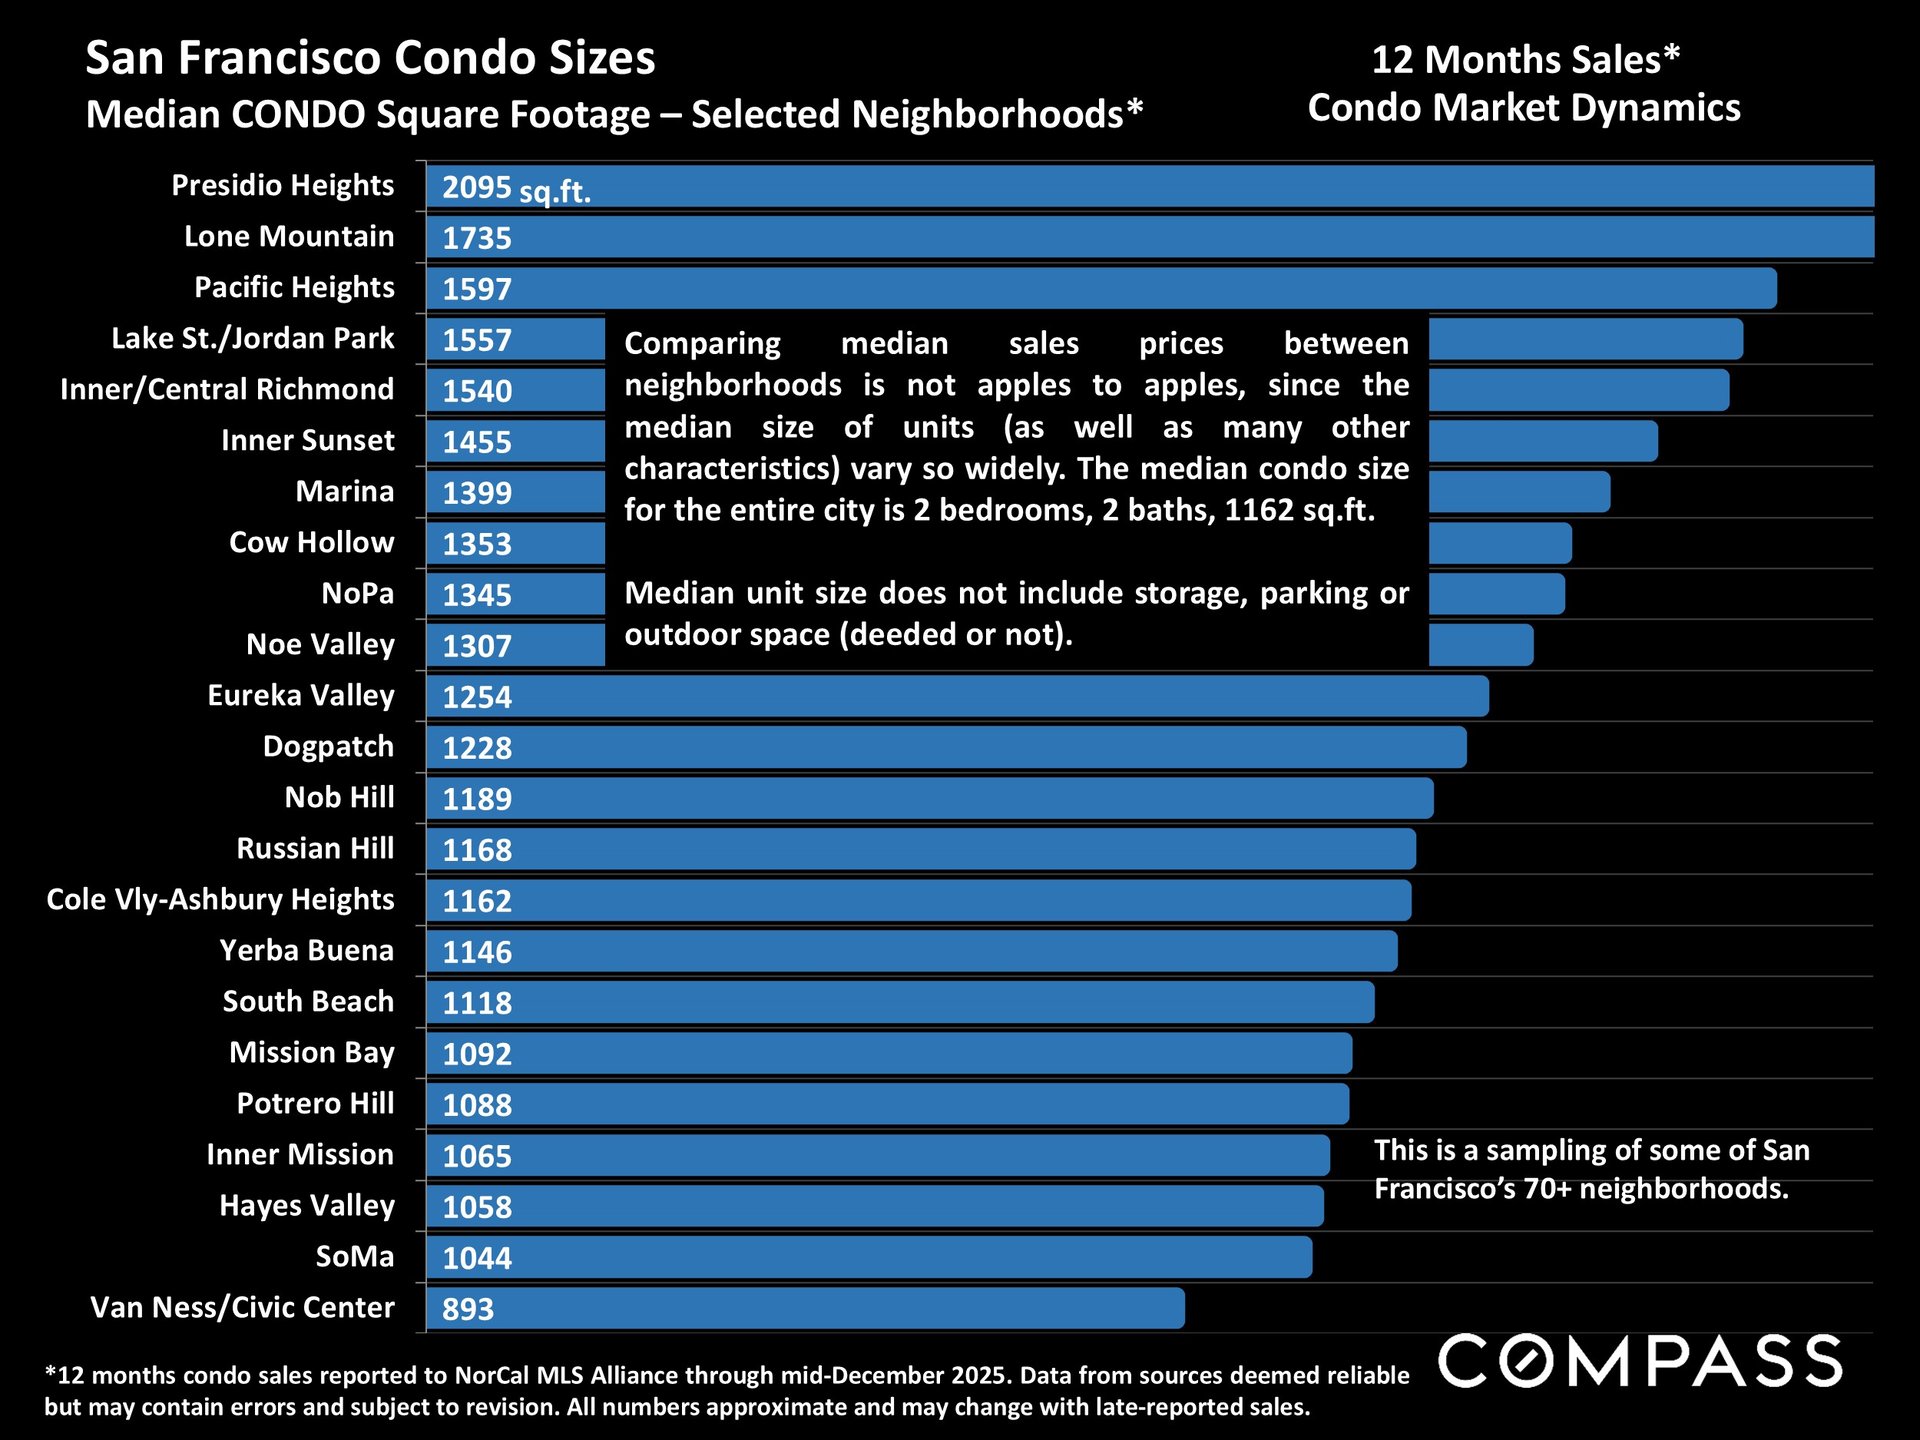
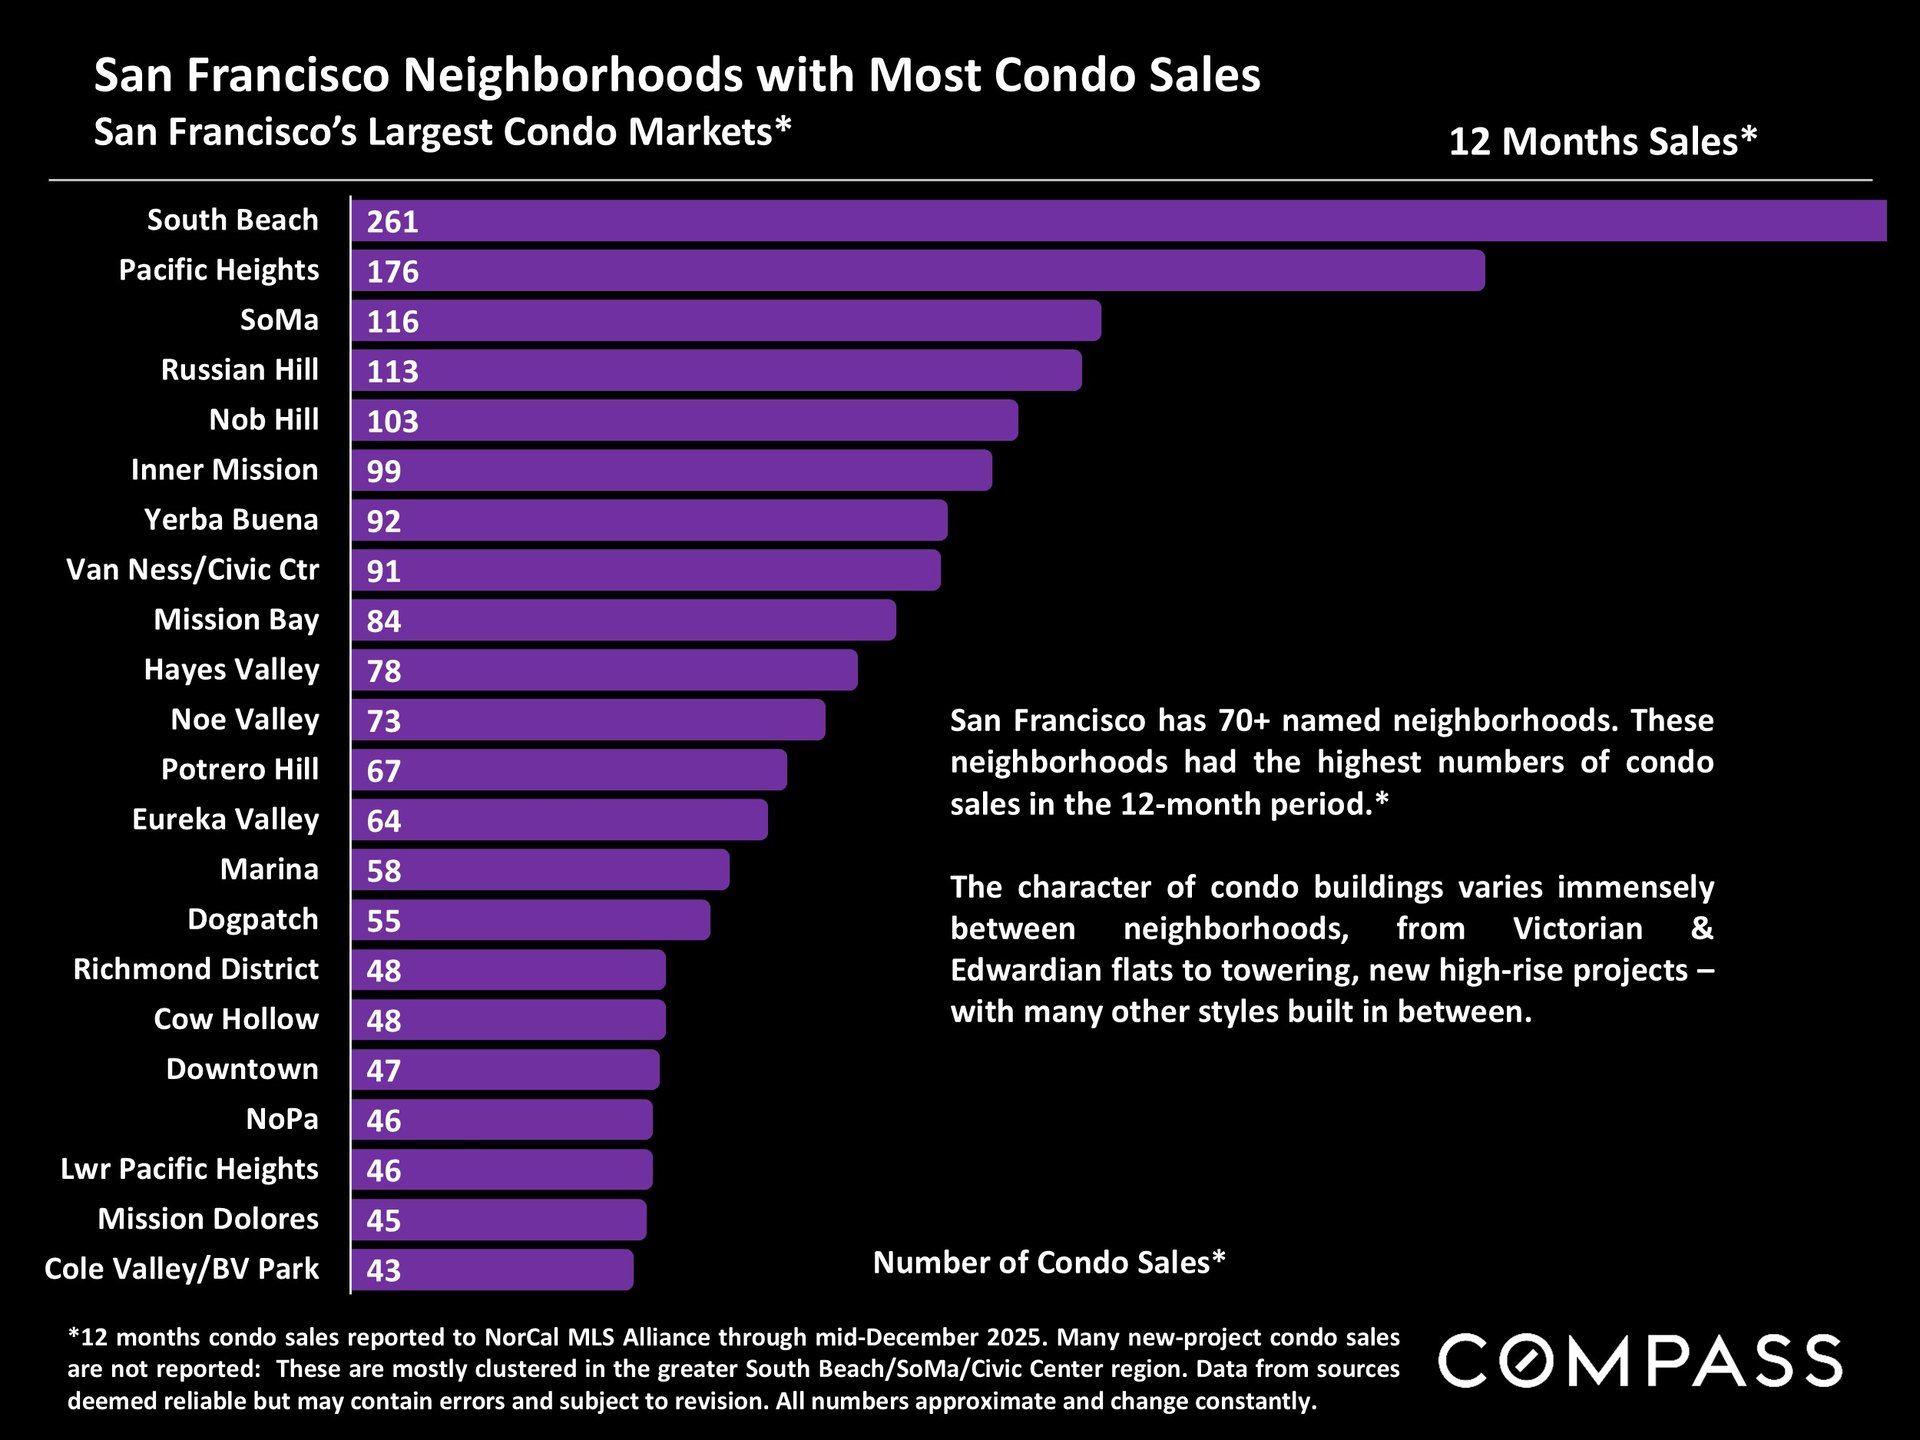
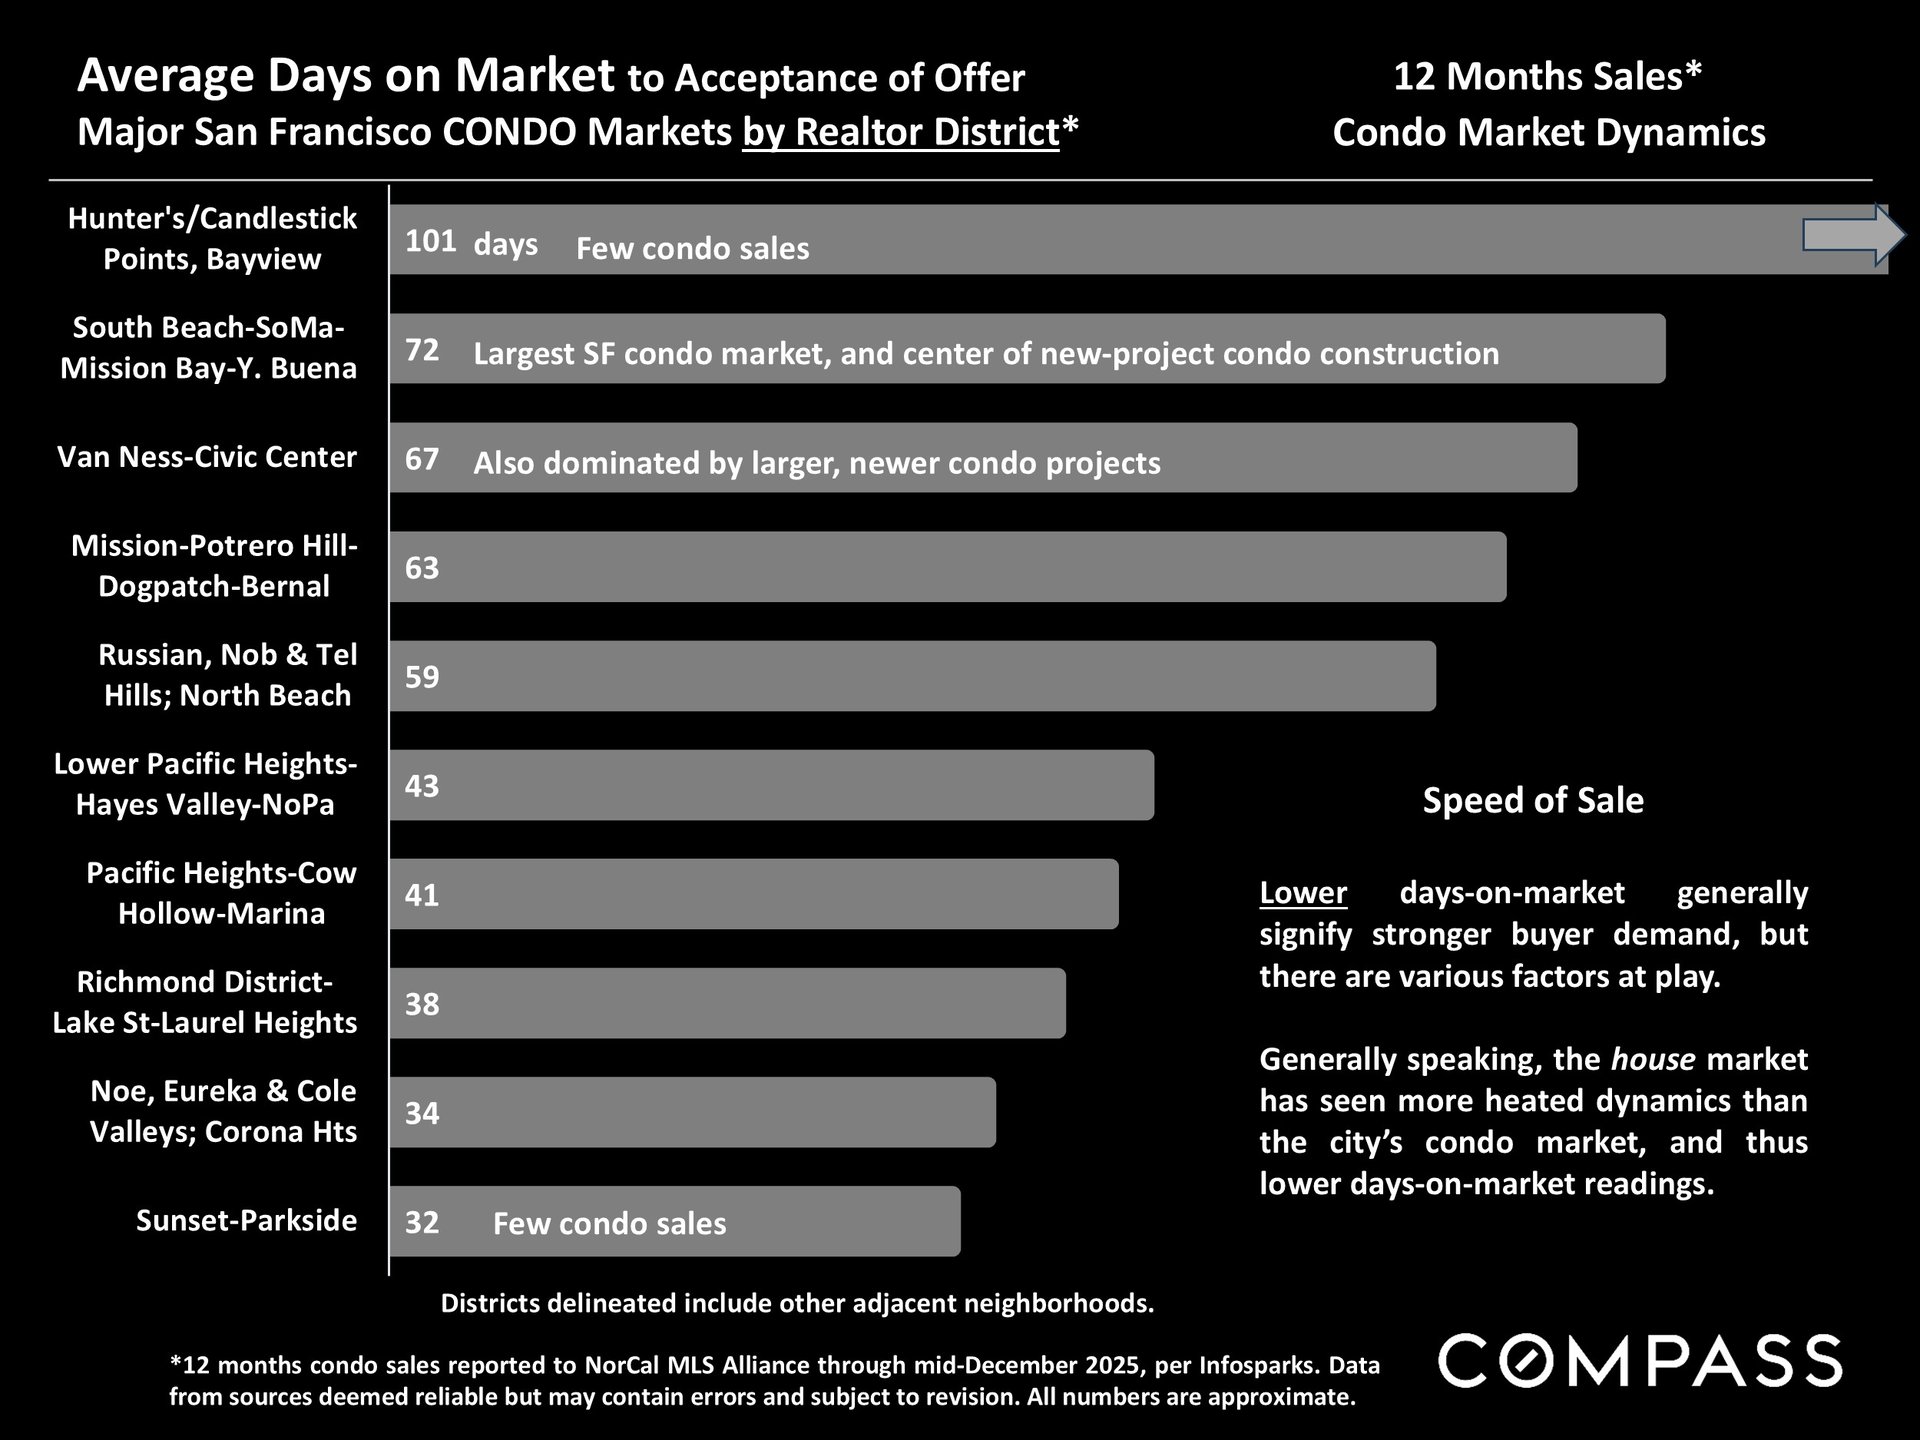
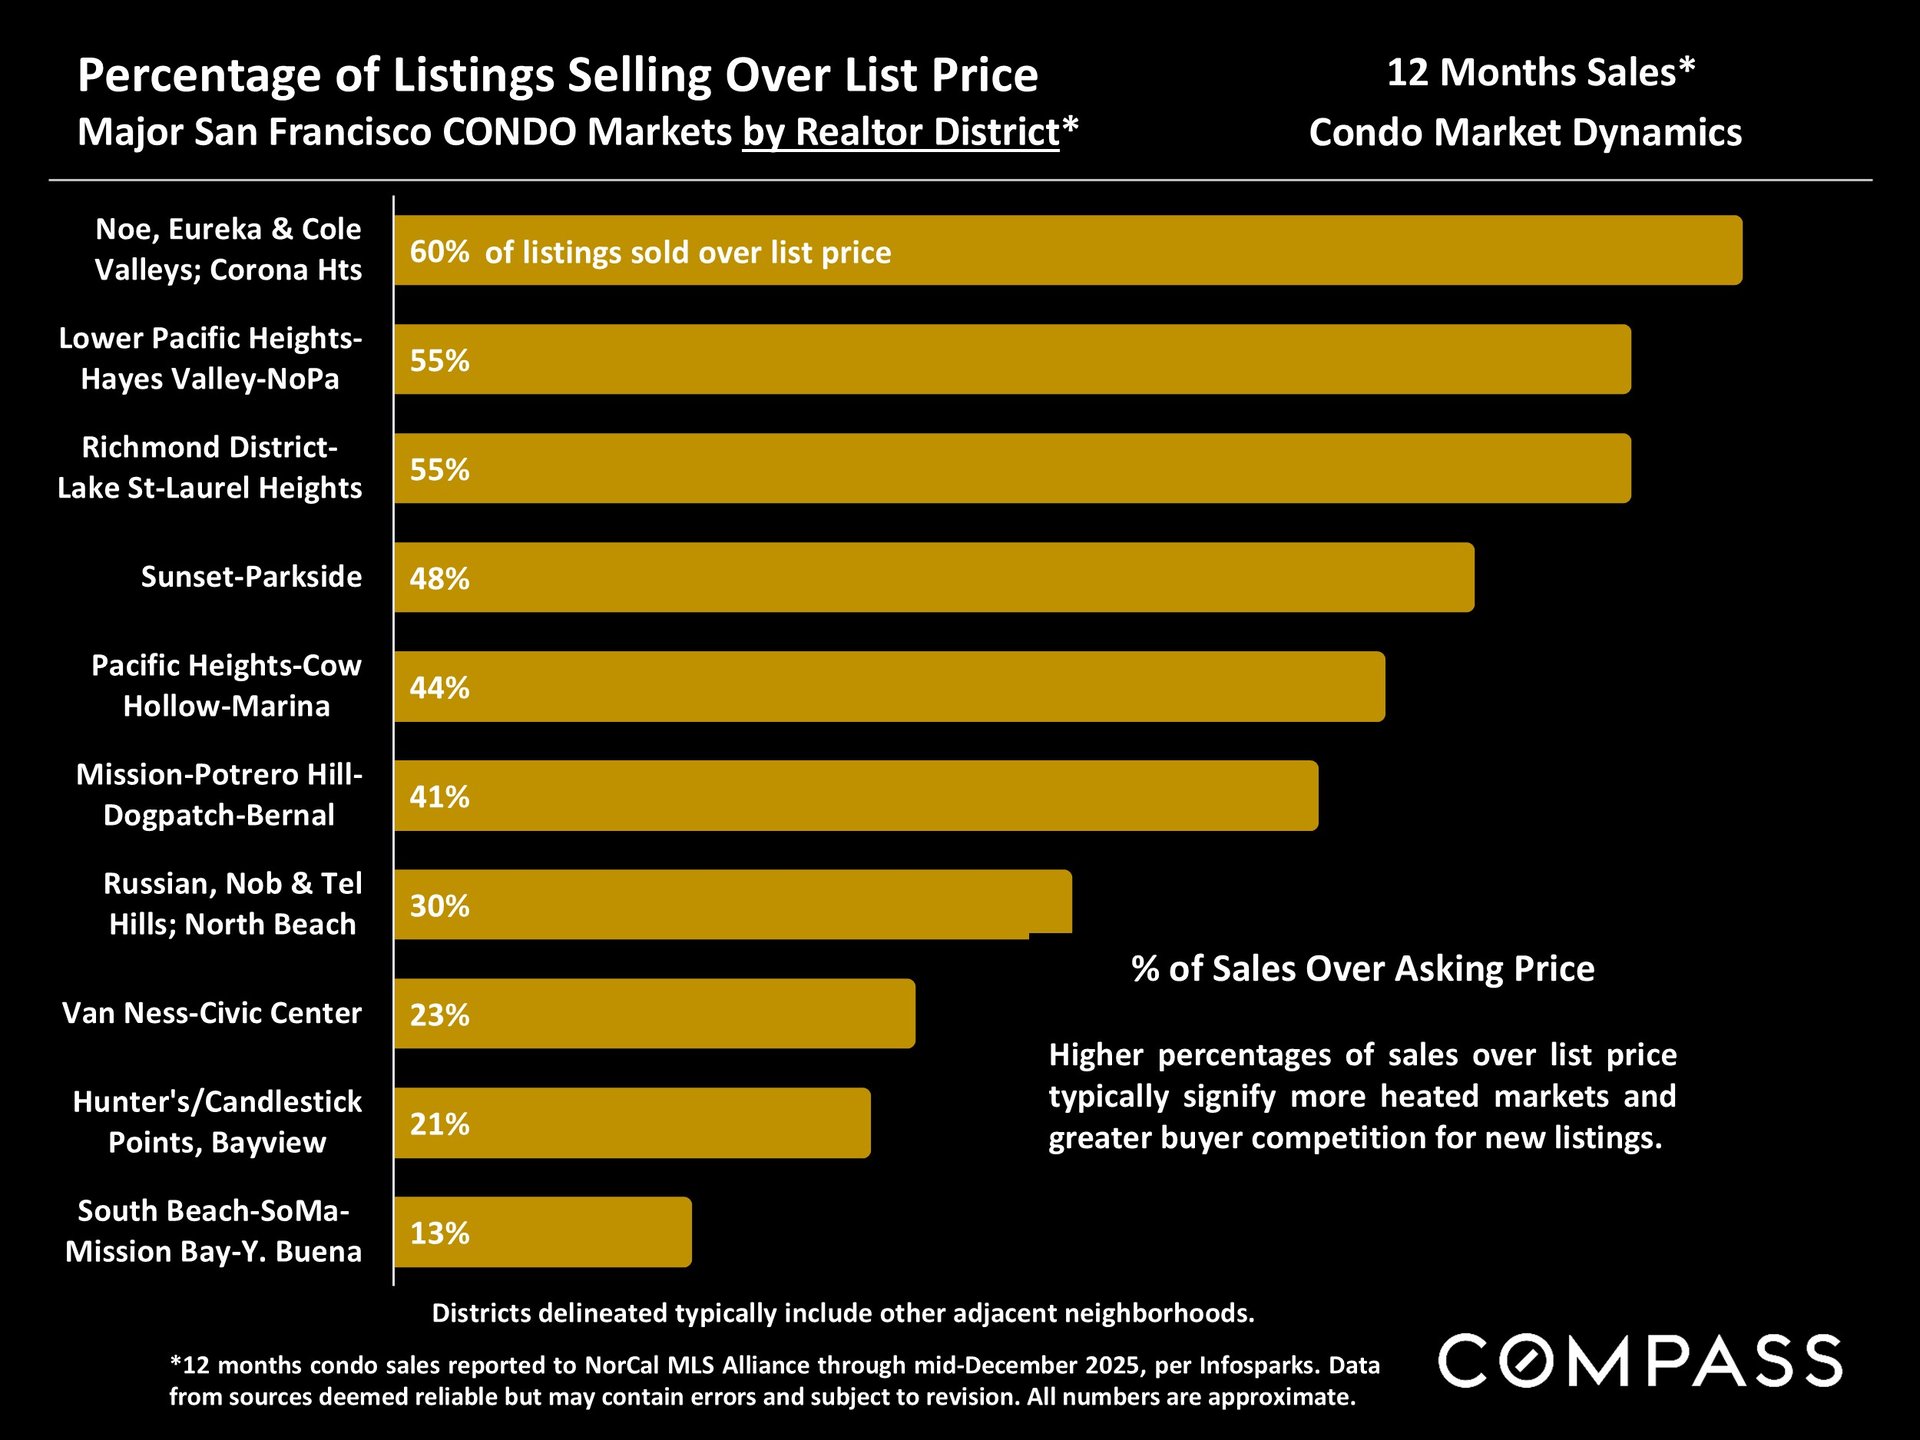
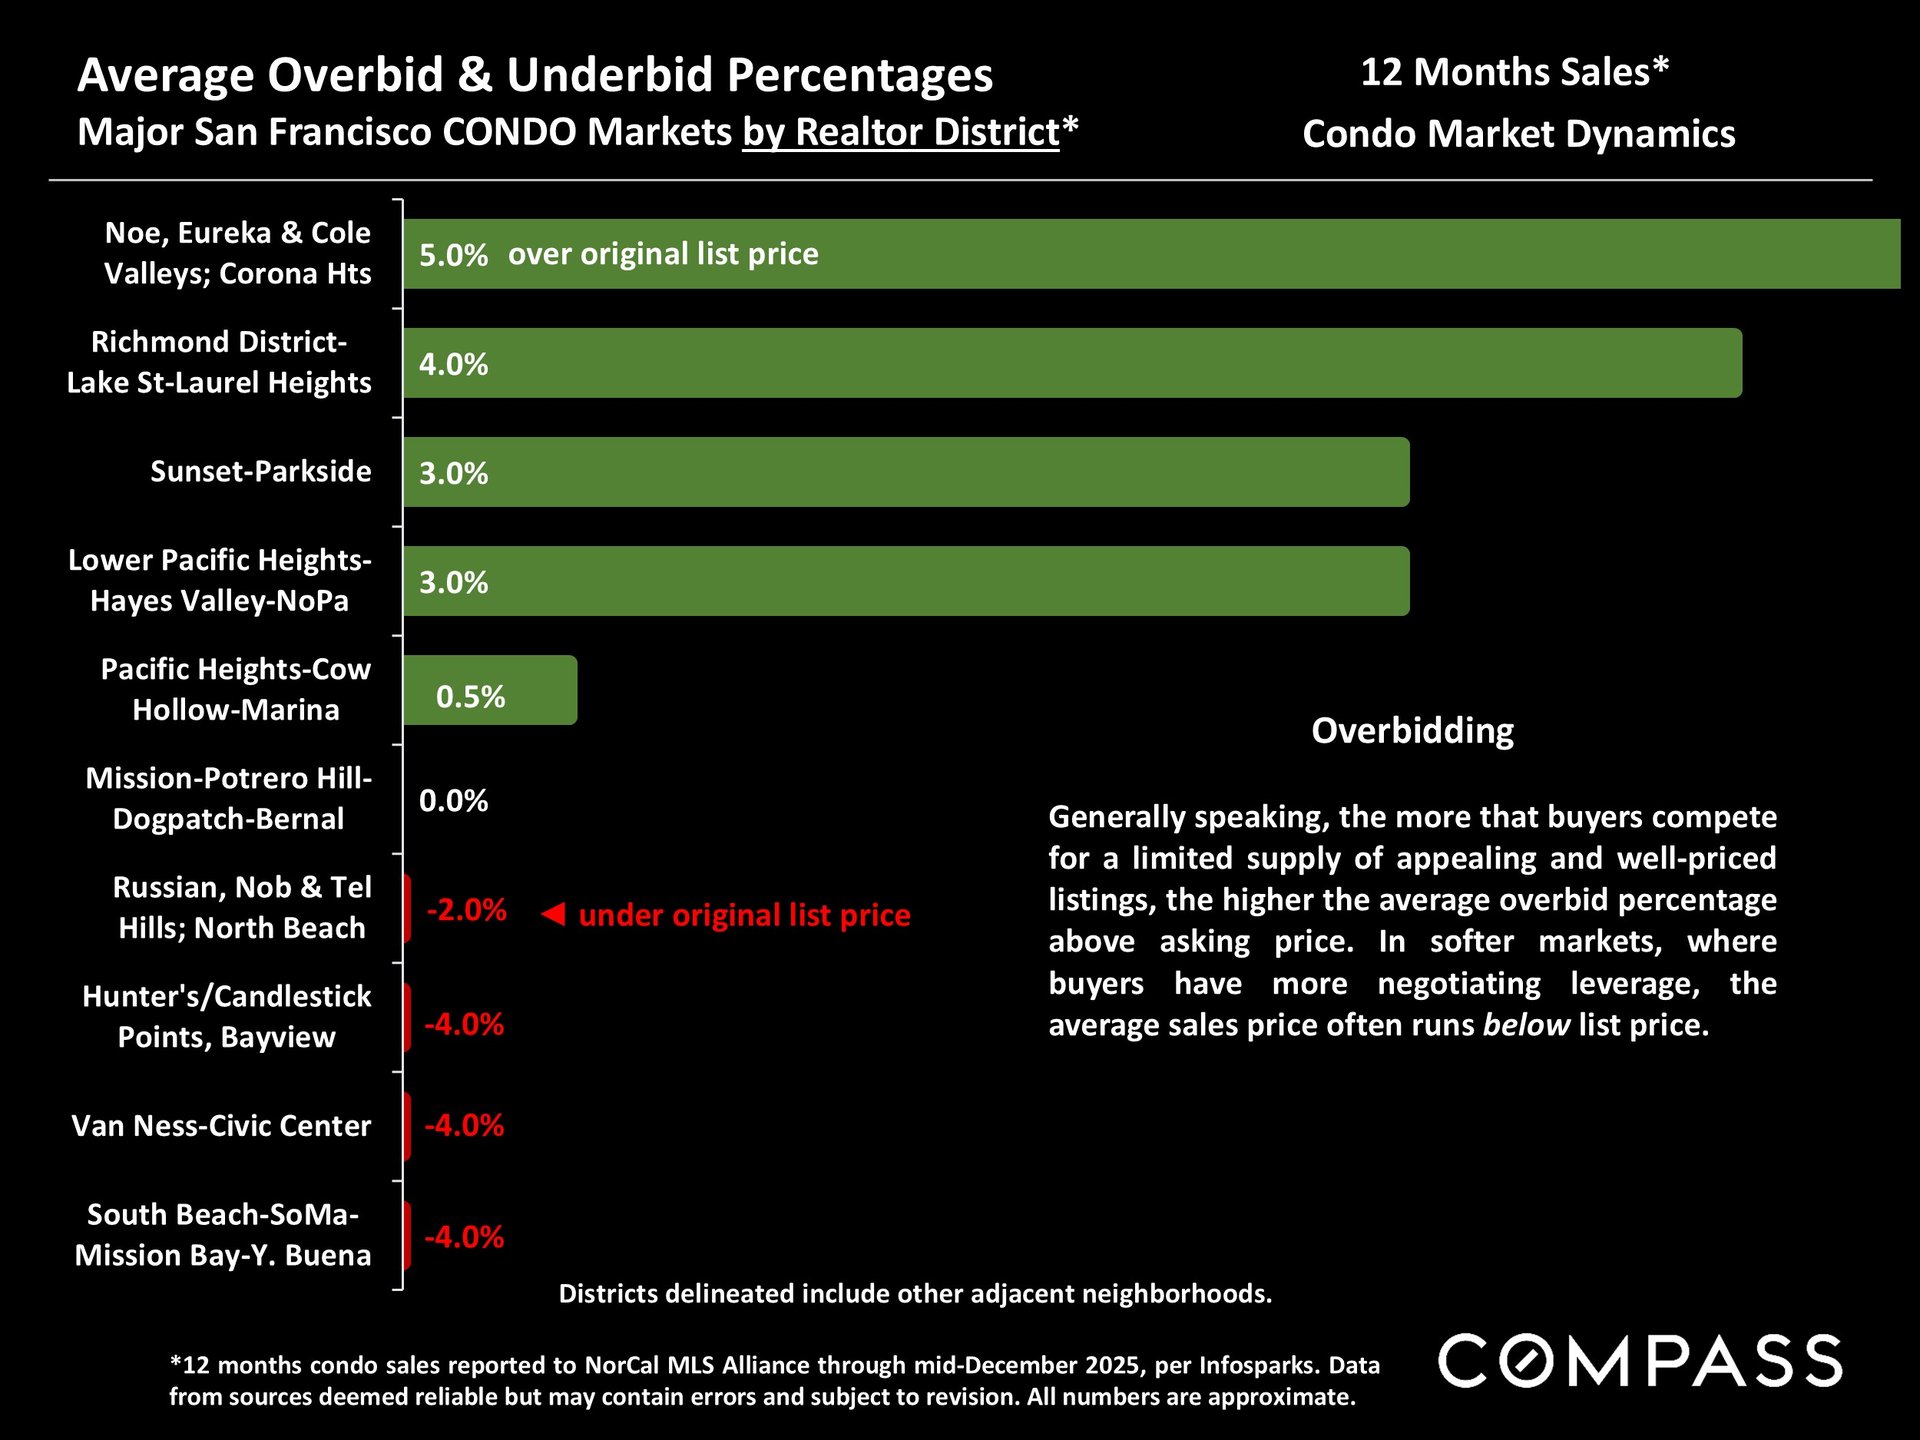
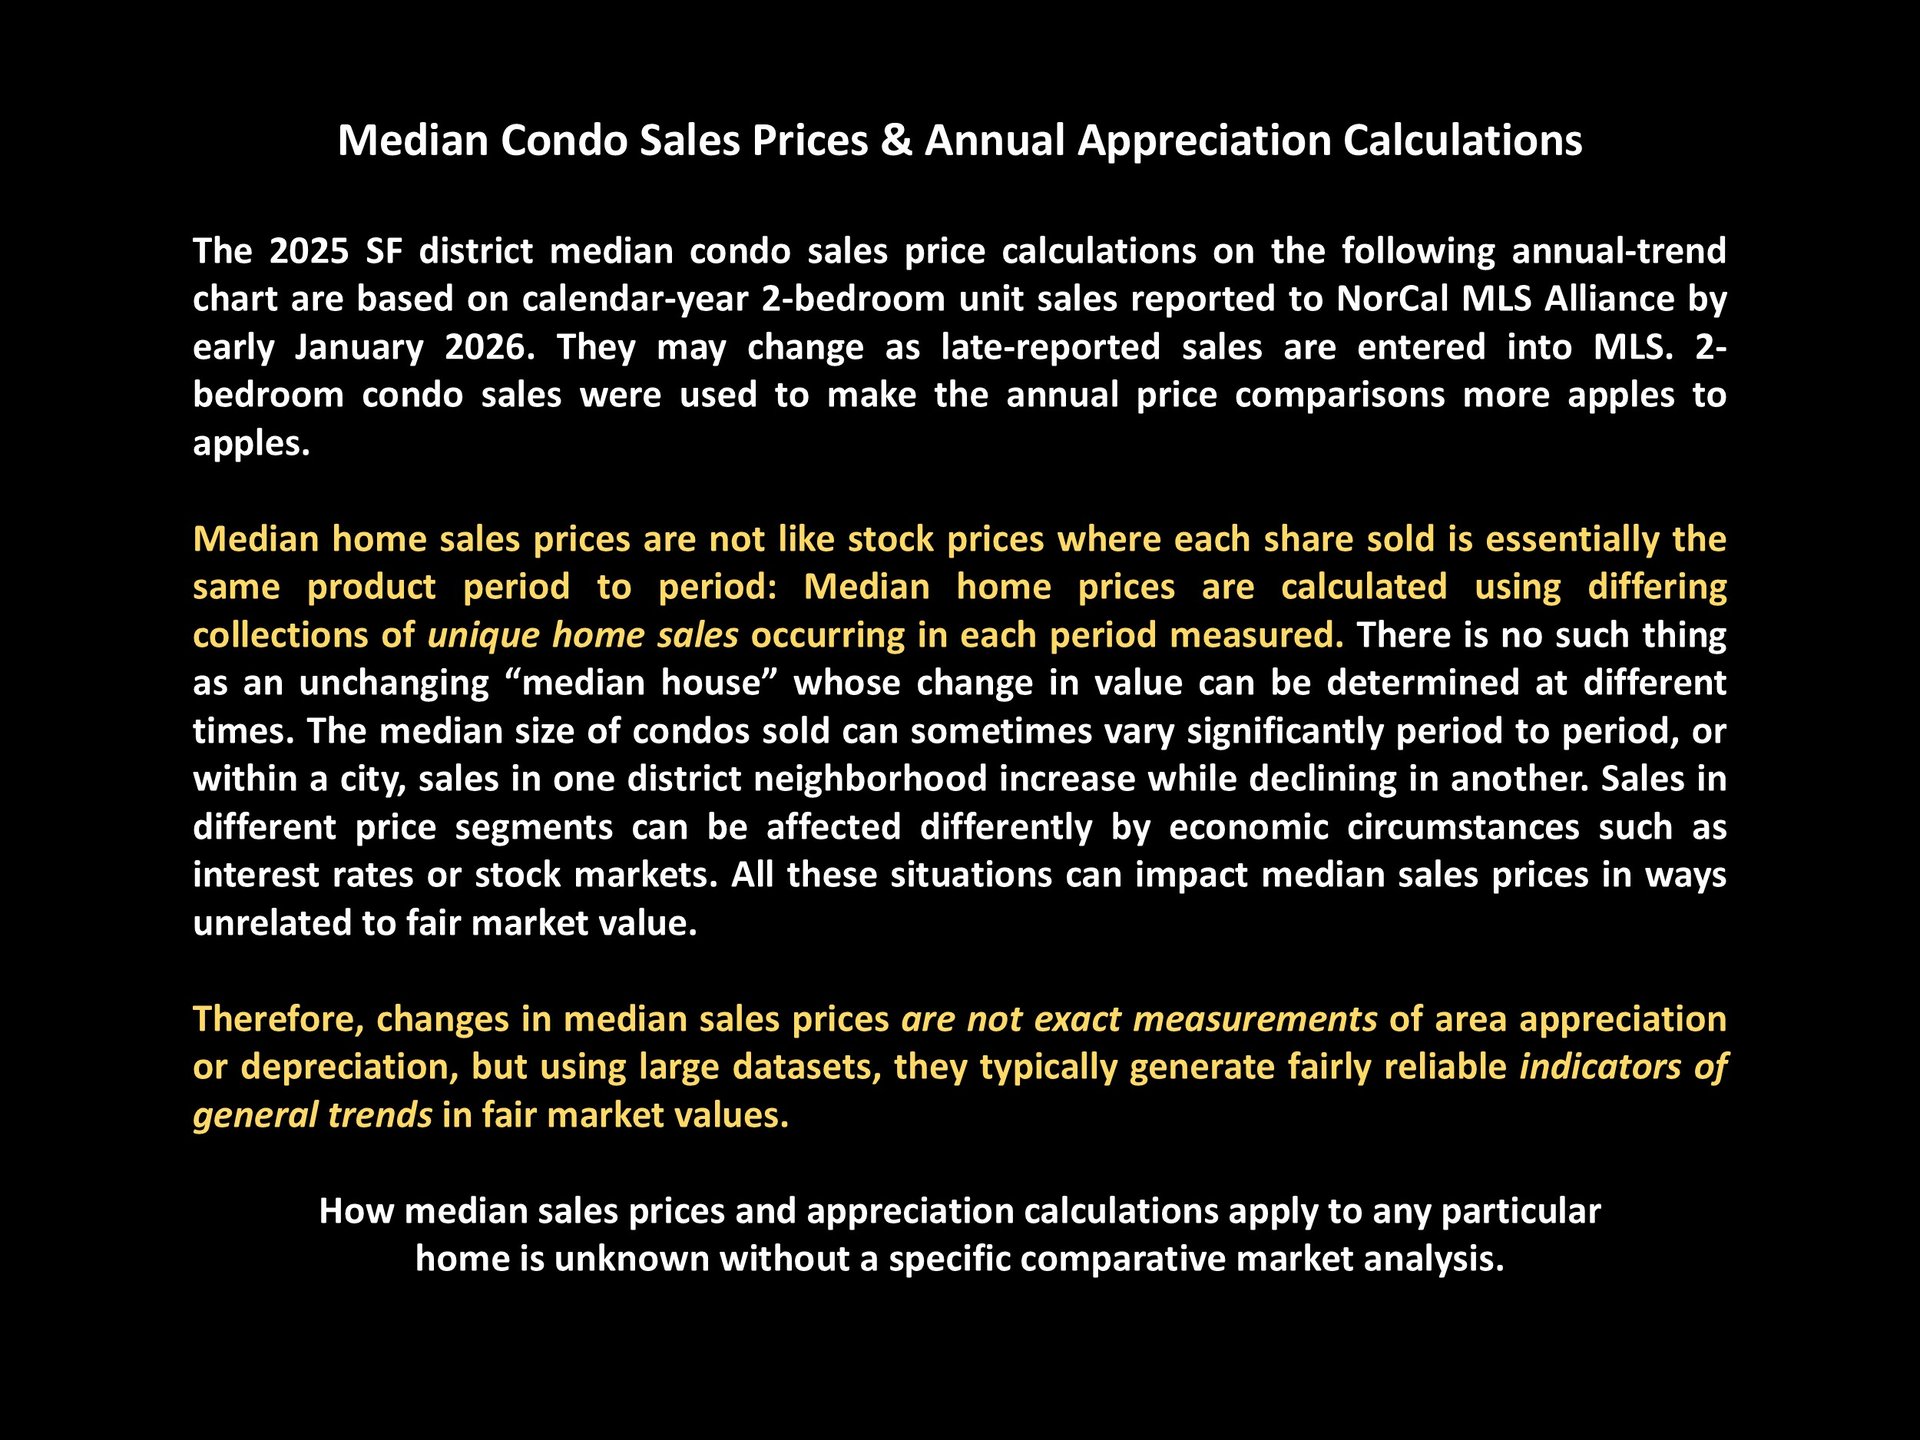
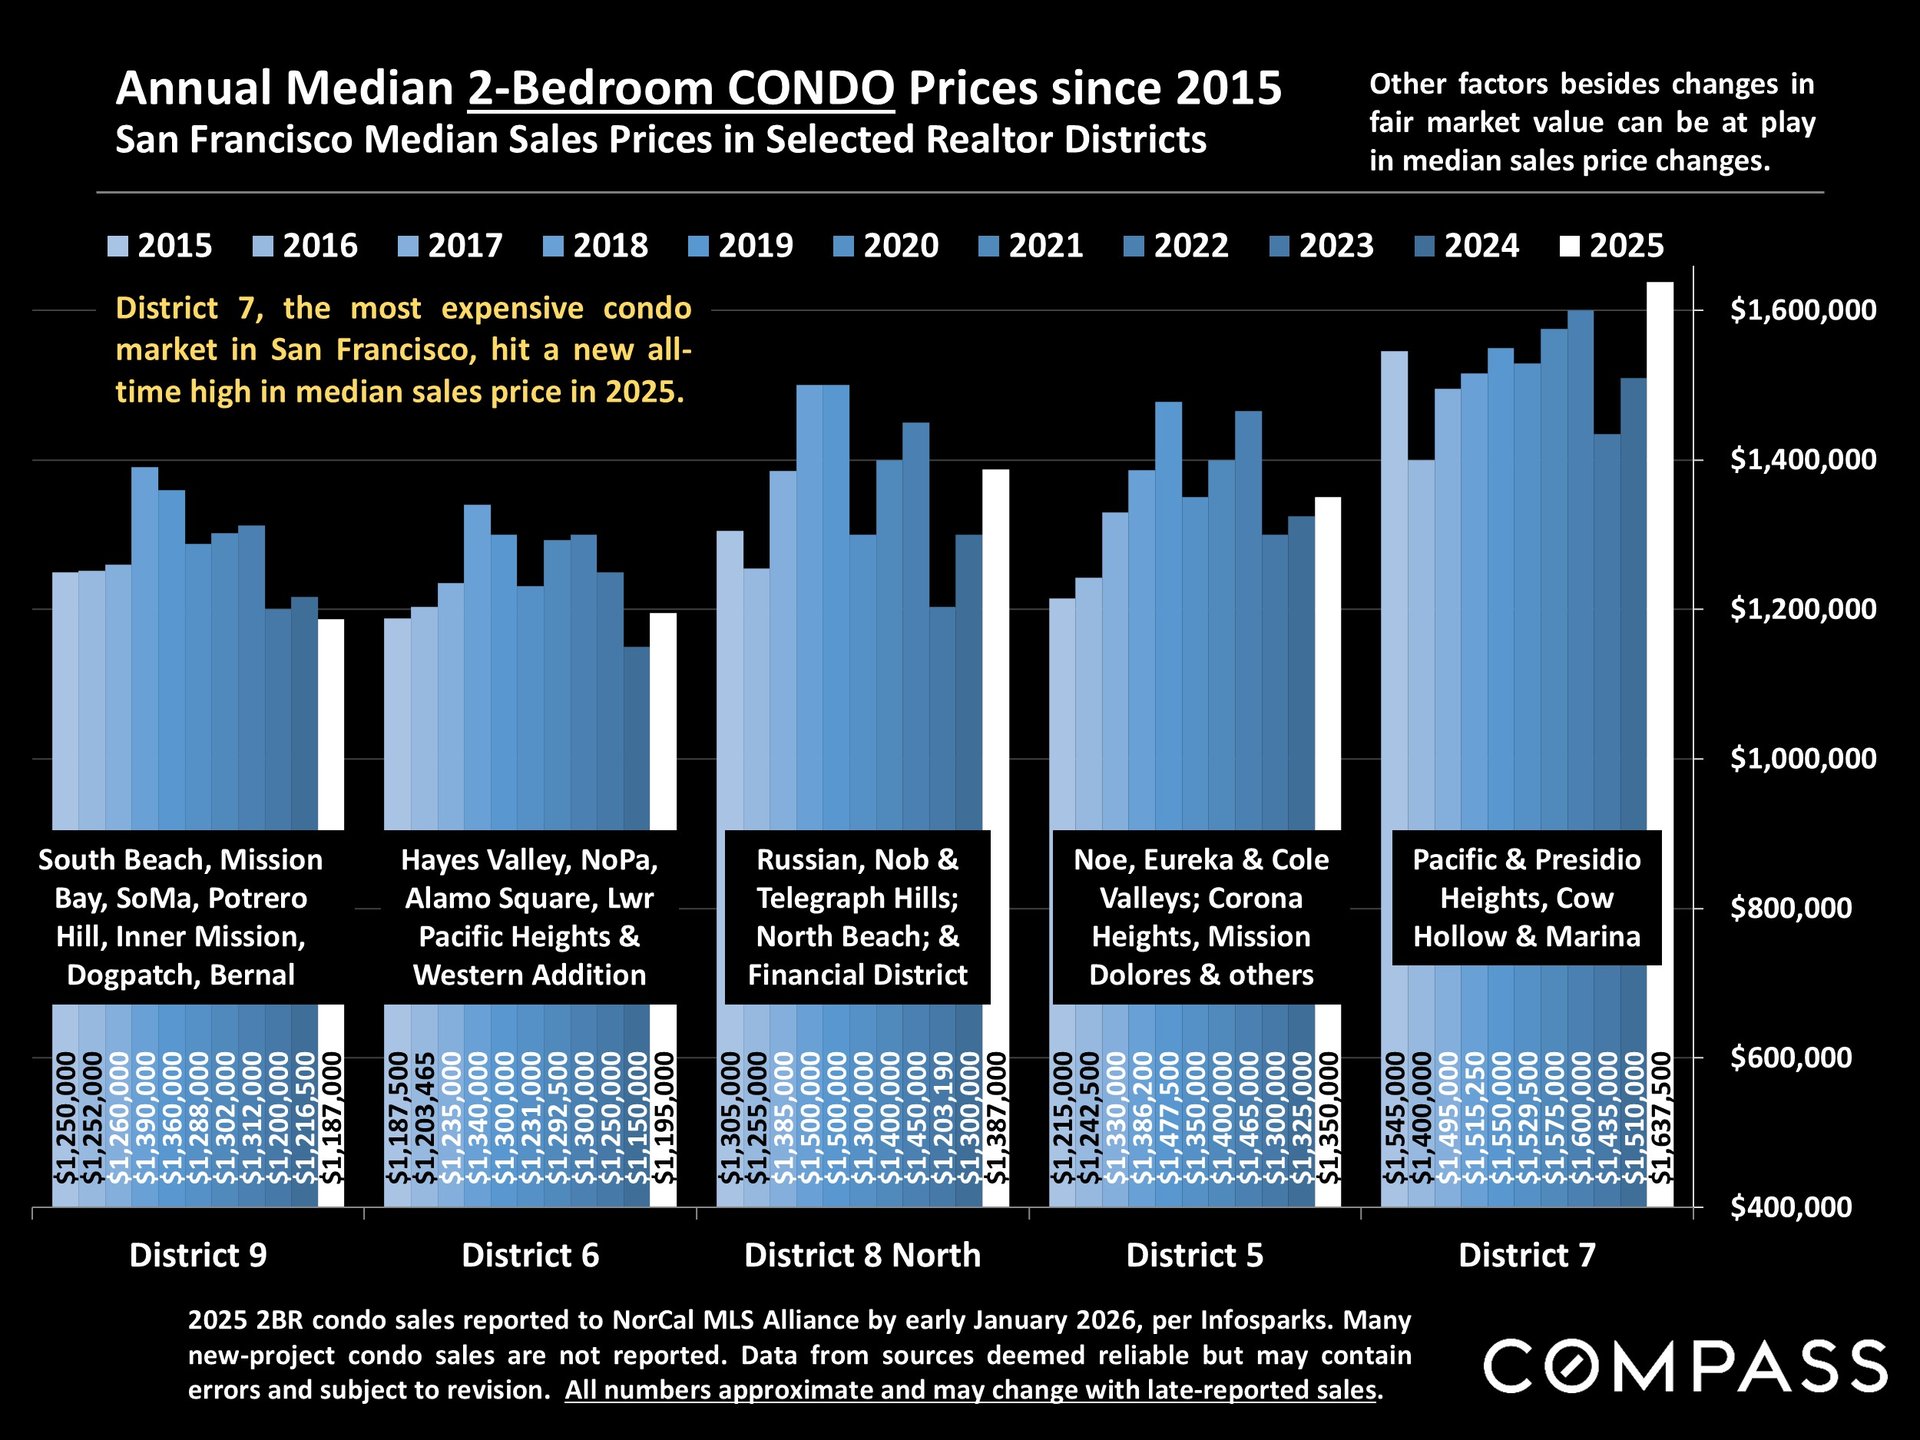
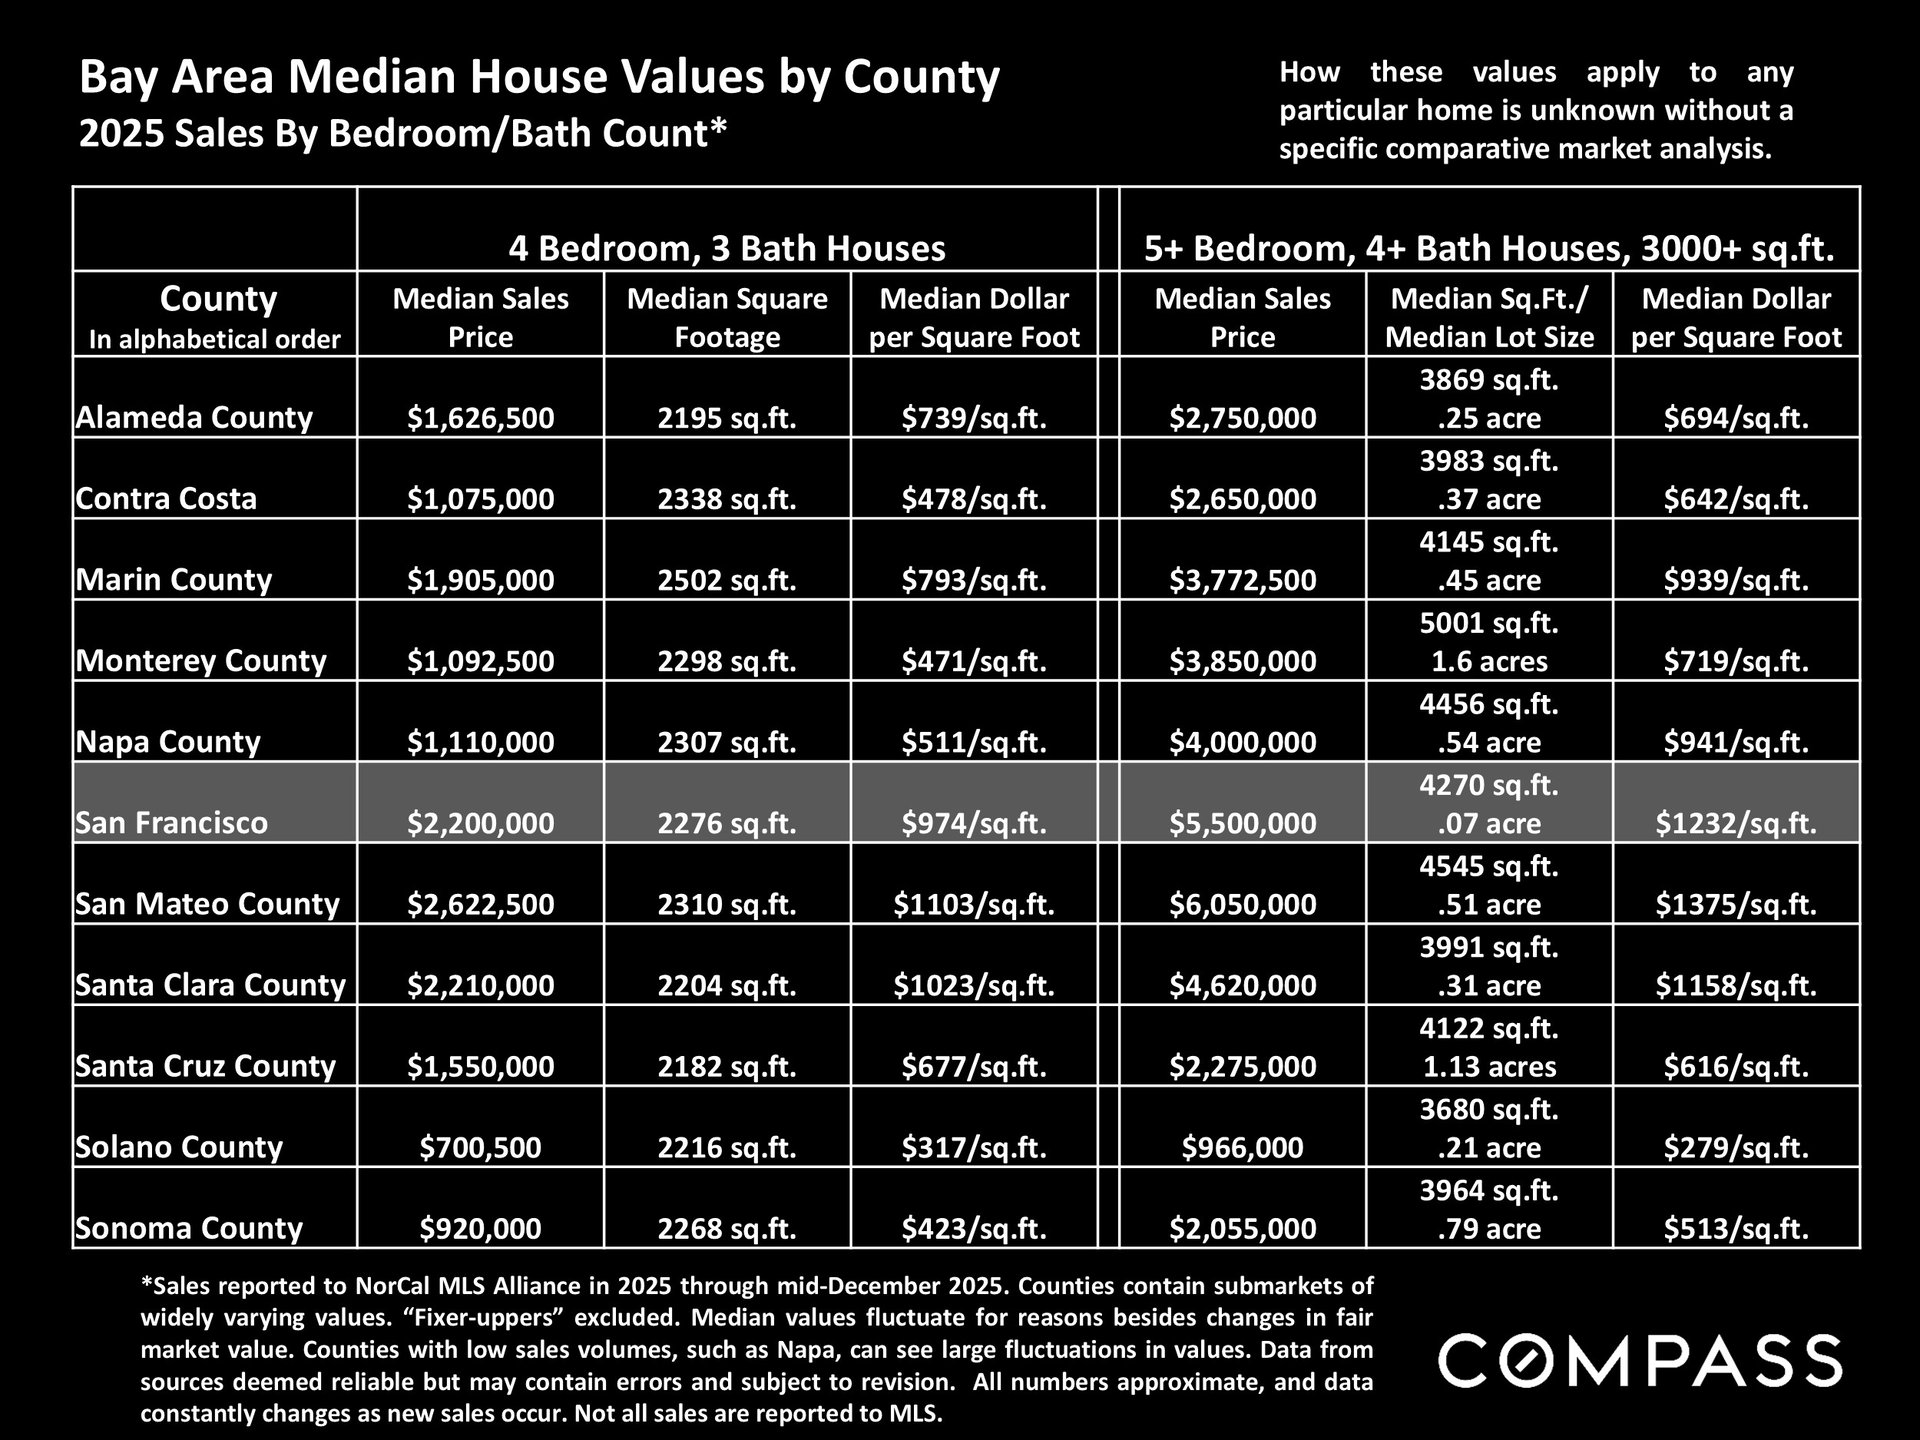
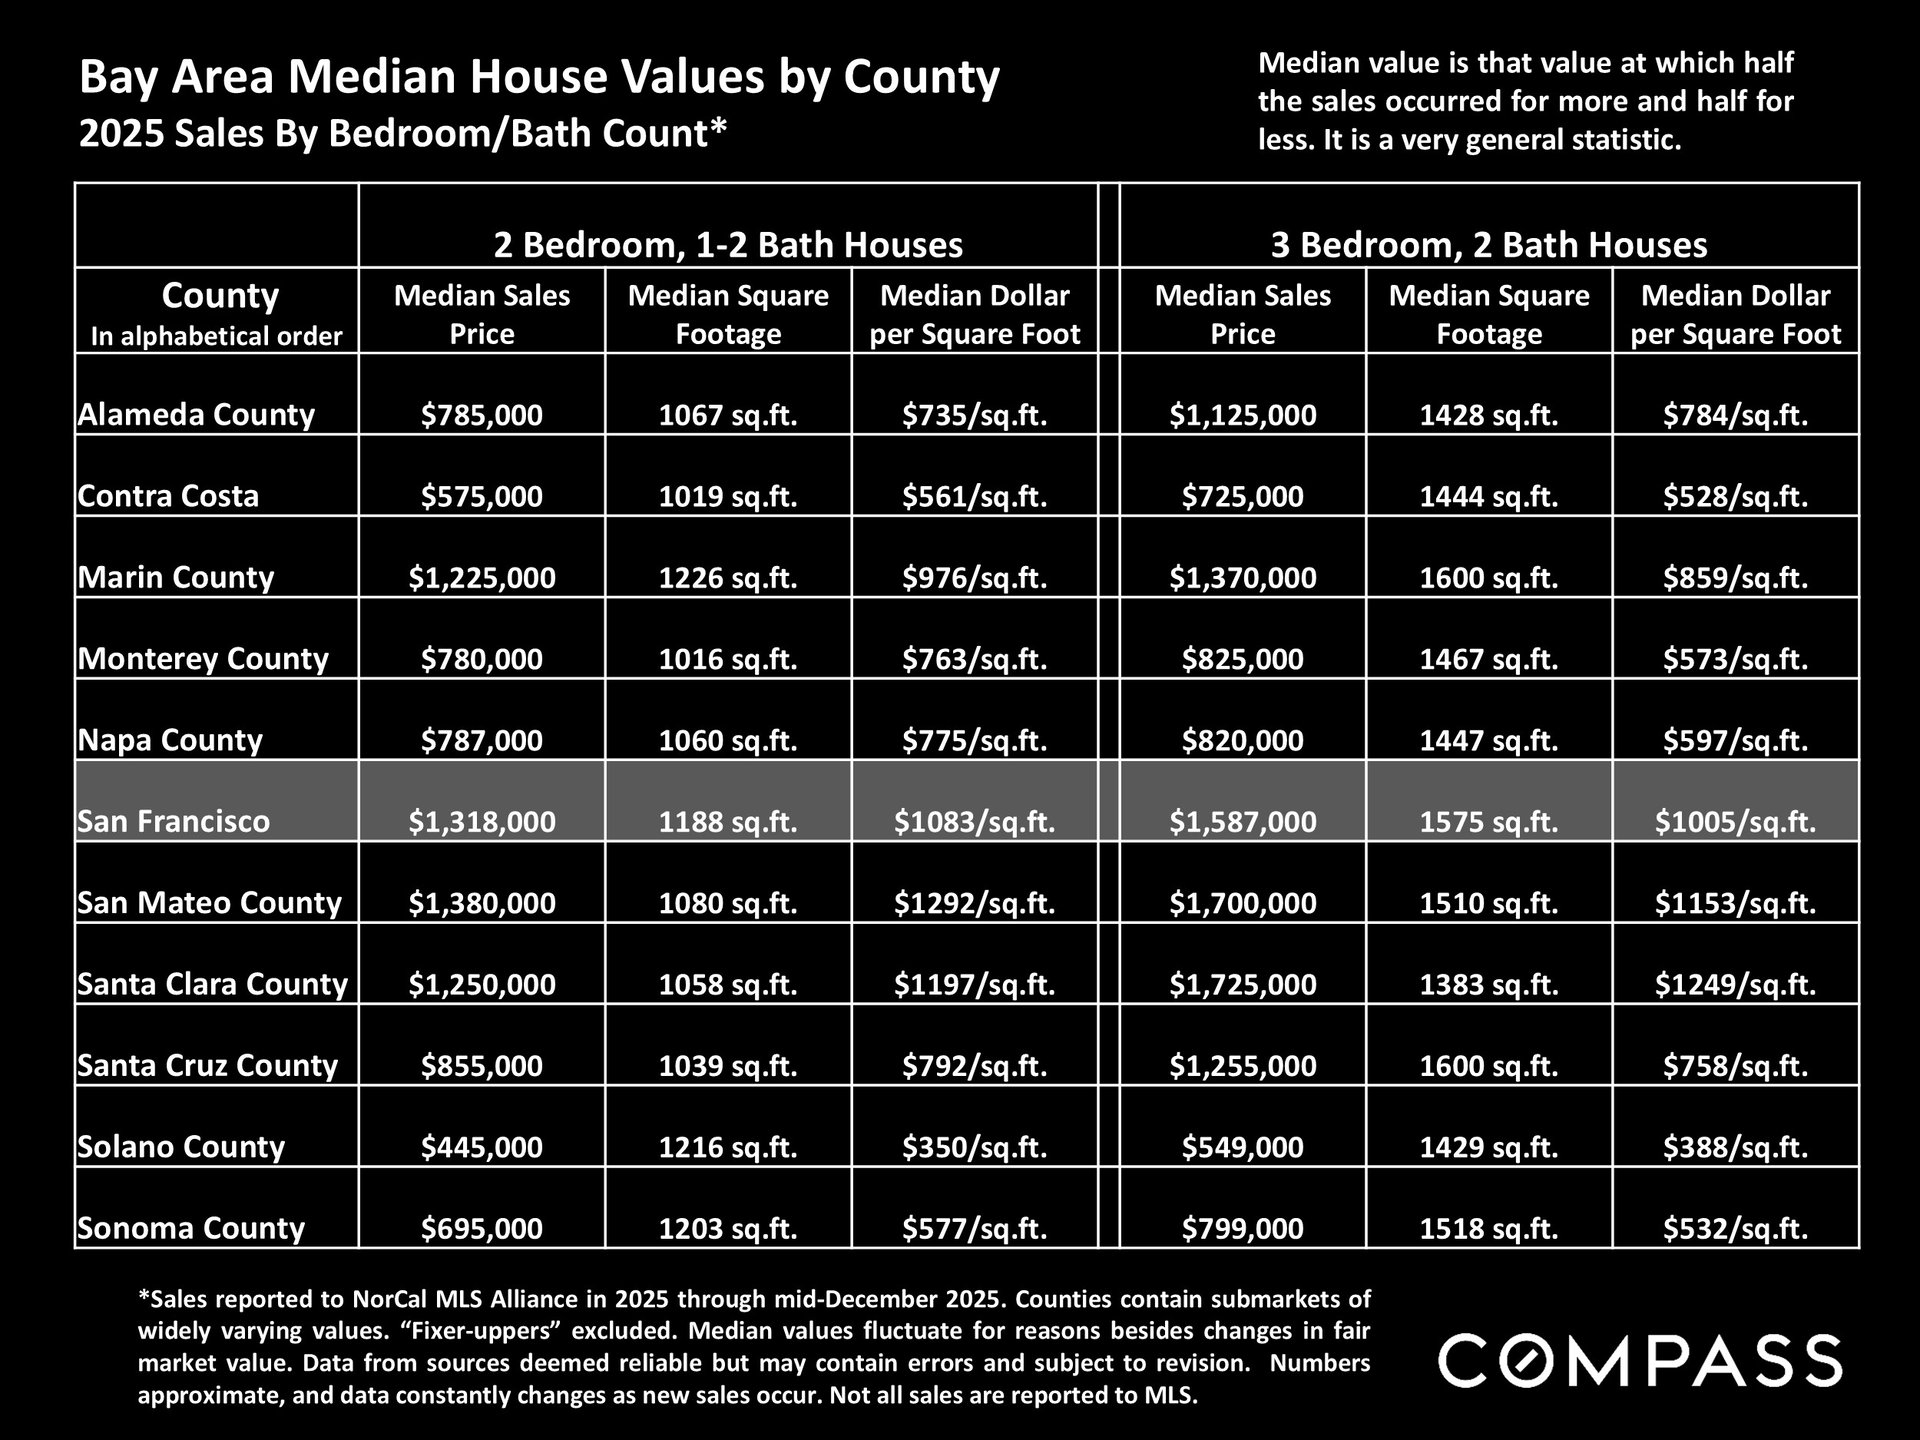
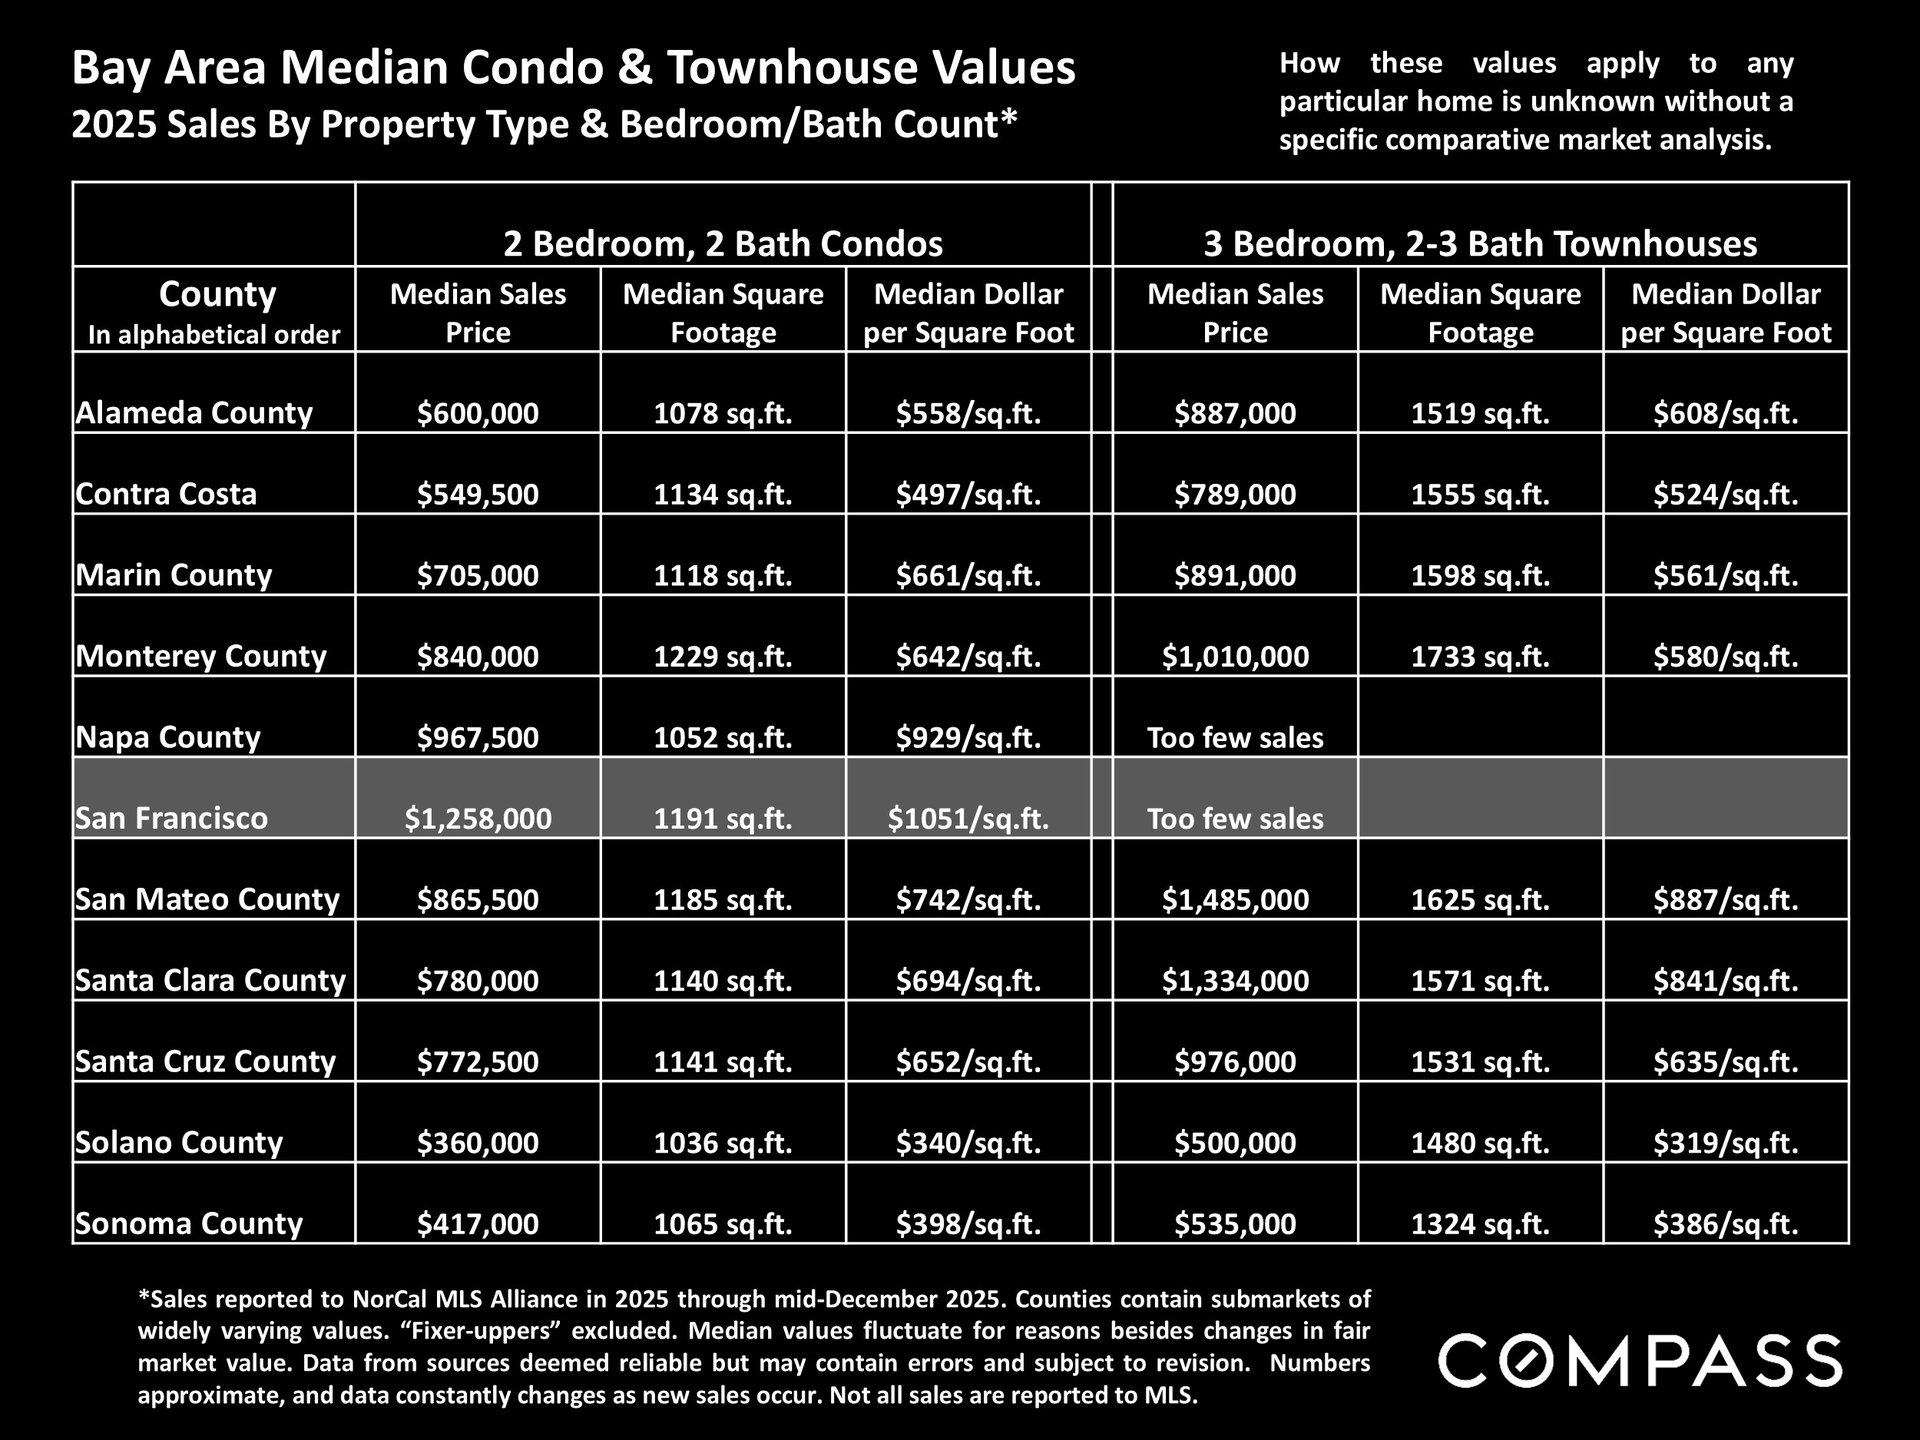
San Francisco house market report by neighborhood and Realtor district, with a Golden Gate Bridge banner.Chart of median San Francisco house prices by neighborhood, with selected high sales and explanatory market notes.Bar chart of median San Francisco house prices by neighborhood, ranging from $1,864,000 in Outer Richmond to $917,500 in Bayview.Bar chart comparing median house prices per square foot across selected San Francisco neighborhoods.Bar chart comparing median house square footage across 24 San Francisco neighborhoods; Presidio Heights has the largest homes.Bar chart ranking San Francisco neighborhoods by house sales; Parkside leads with 194, followed by Sunset with 191.San Francisco house-market infographic compares days on market across ten realtor districts, with green bars and Compass branding.Bar chart compares San Francisco house districts by share of listings selling over list price, ranging from 35% to 86%.Chart of San Francisco house overbids by district, ranging from 21% above list price to 1% below.Chart of San Francisco $5 million-plus home sales by district and price segment, led by Pacific Heights and nearby neighborhoods.Graphic explaining how San Francisco median home sale prices and annual appreciation calculations are interpreted.Chart of annual median house sale prices in San Francisco Districts 10, 3, 2, and 9 from 2015 to 2025.Bar chart comparing 2015–2025 median house sale prices in four San Francisco districts; District 7 is highest.San Francisco condo market report for neighborhoods and realtor districts, with a Golden Gate Bridge panorama and Compass branding.Chart comparing median condo sale prices across selected San Francisco neighborhoods, from Presidio Heights to Hunter's Point.San Francisco condo values chart, with Marina highest at $1,278 per square foot and SoMa lowest at $709.Chart comparing median condo sizes across selected San Francisco neighborhoods, from 893 to 2,095 square feet.Bar chart of San Francisco condo sales by neighborhood; South Beach leads with 261 sales, followed by Pacific Heights with 176.Chart compares days on market across San Francisco condo districts, ranging from 32 days in Sunset-Parkside to 101 in Bayview.Bar chart of San Francisco condo sales over asking, led by Noe, Eureka and Cole Valleys at 60%.Chart of San Francisco condo overbid and underbid percentages by realtor district, with results from 5% to -4%.Text graphic explaining San Francisco condo median sale price calculations and their limits as measures of appreciation.Bar chart comparing annual median two-bedroom condo prices across five San Francisco districts from 2015 to 2025.Table comparing 2025 median home sale prices and property sizes across Bay Area counties.Bay Area 2025 home-value table by county and bedroom count, with the San Francisco row highlighted.Bay Area condo and townhouse median values by county and bedroom and bath count for 2025.Real estate report notes explain statistics, median sales price, price per square foot, and legal disclaimers.

Work With Us

We will help you understand the complex aspects of the transaction and share our expertise so that you can make the best decisions possible. We are experienced, market savvy, and energetic. With both of us working for our clients, you get twice the amount of attention and insight.