
The SF Team, Eva + James, Compass

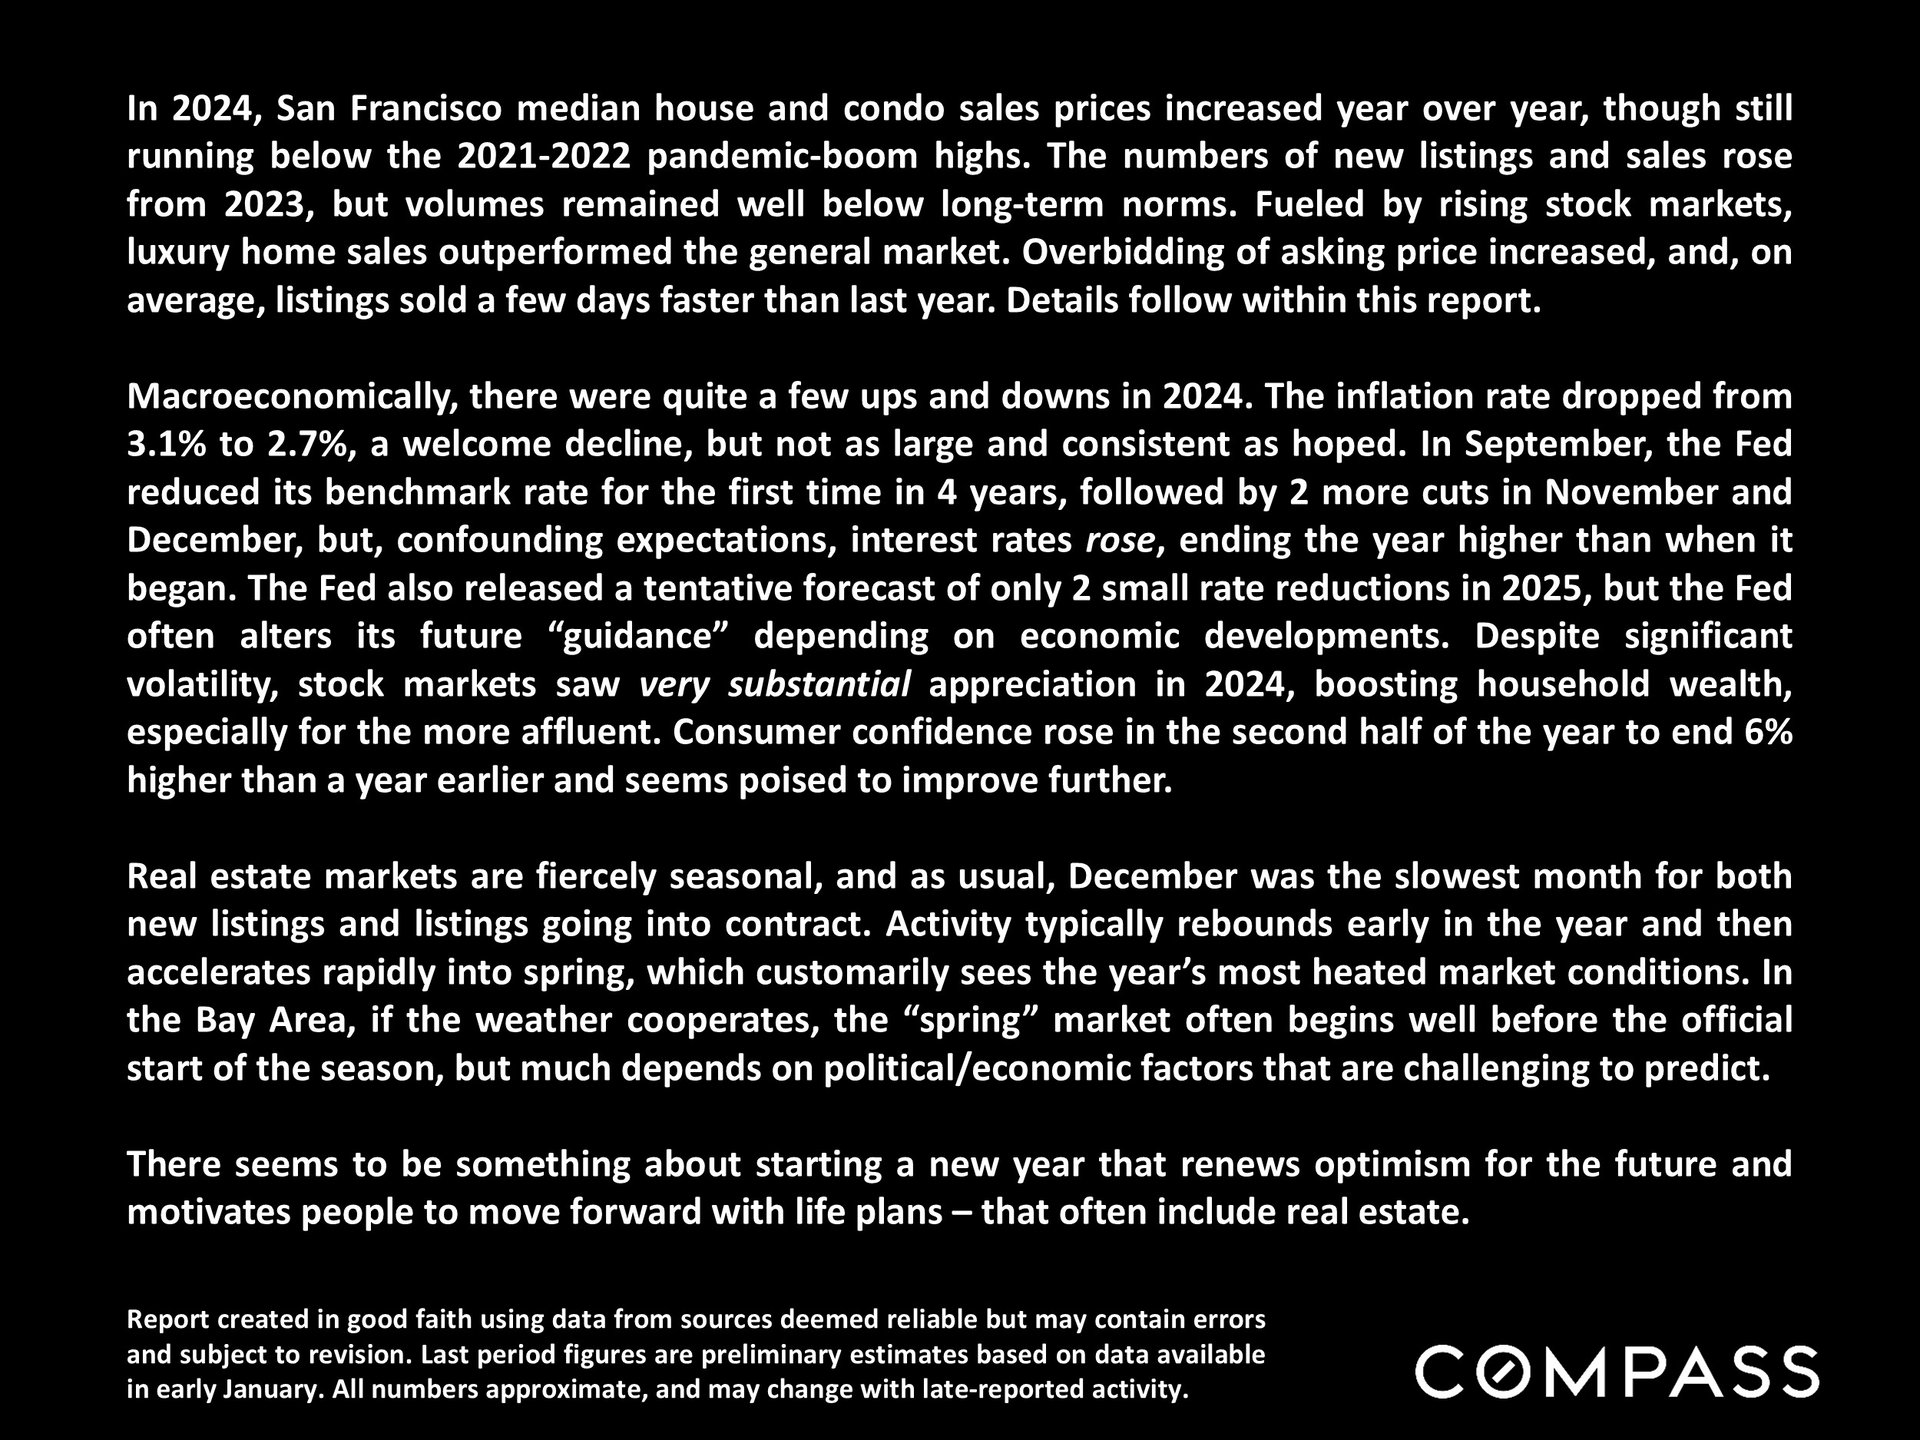
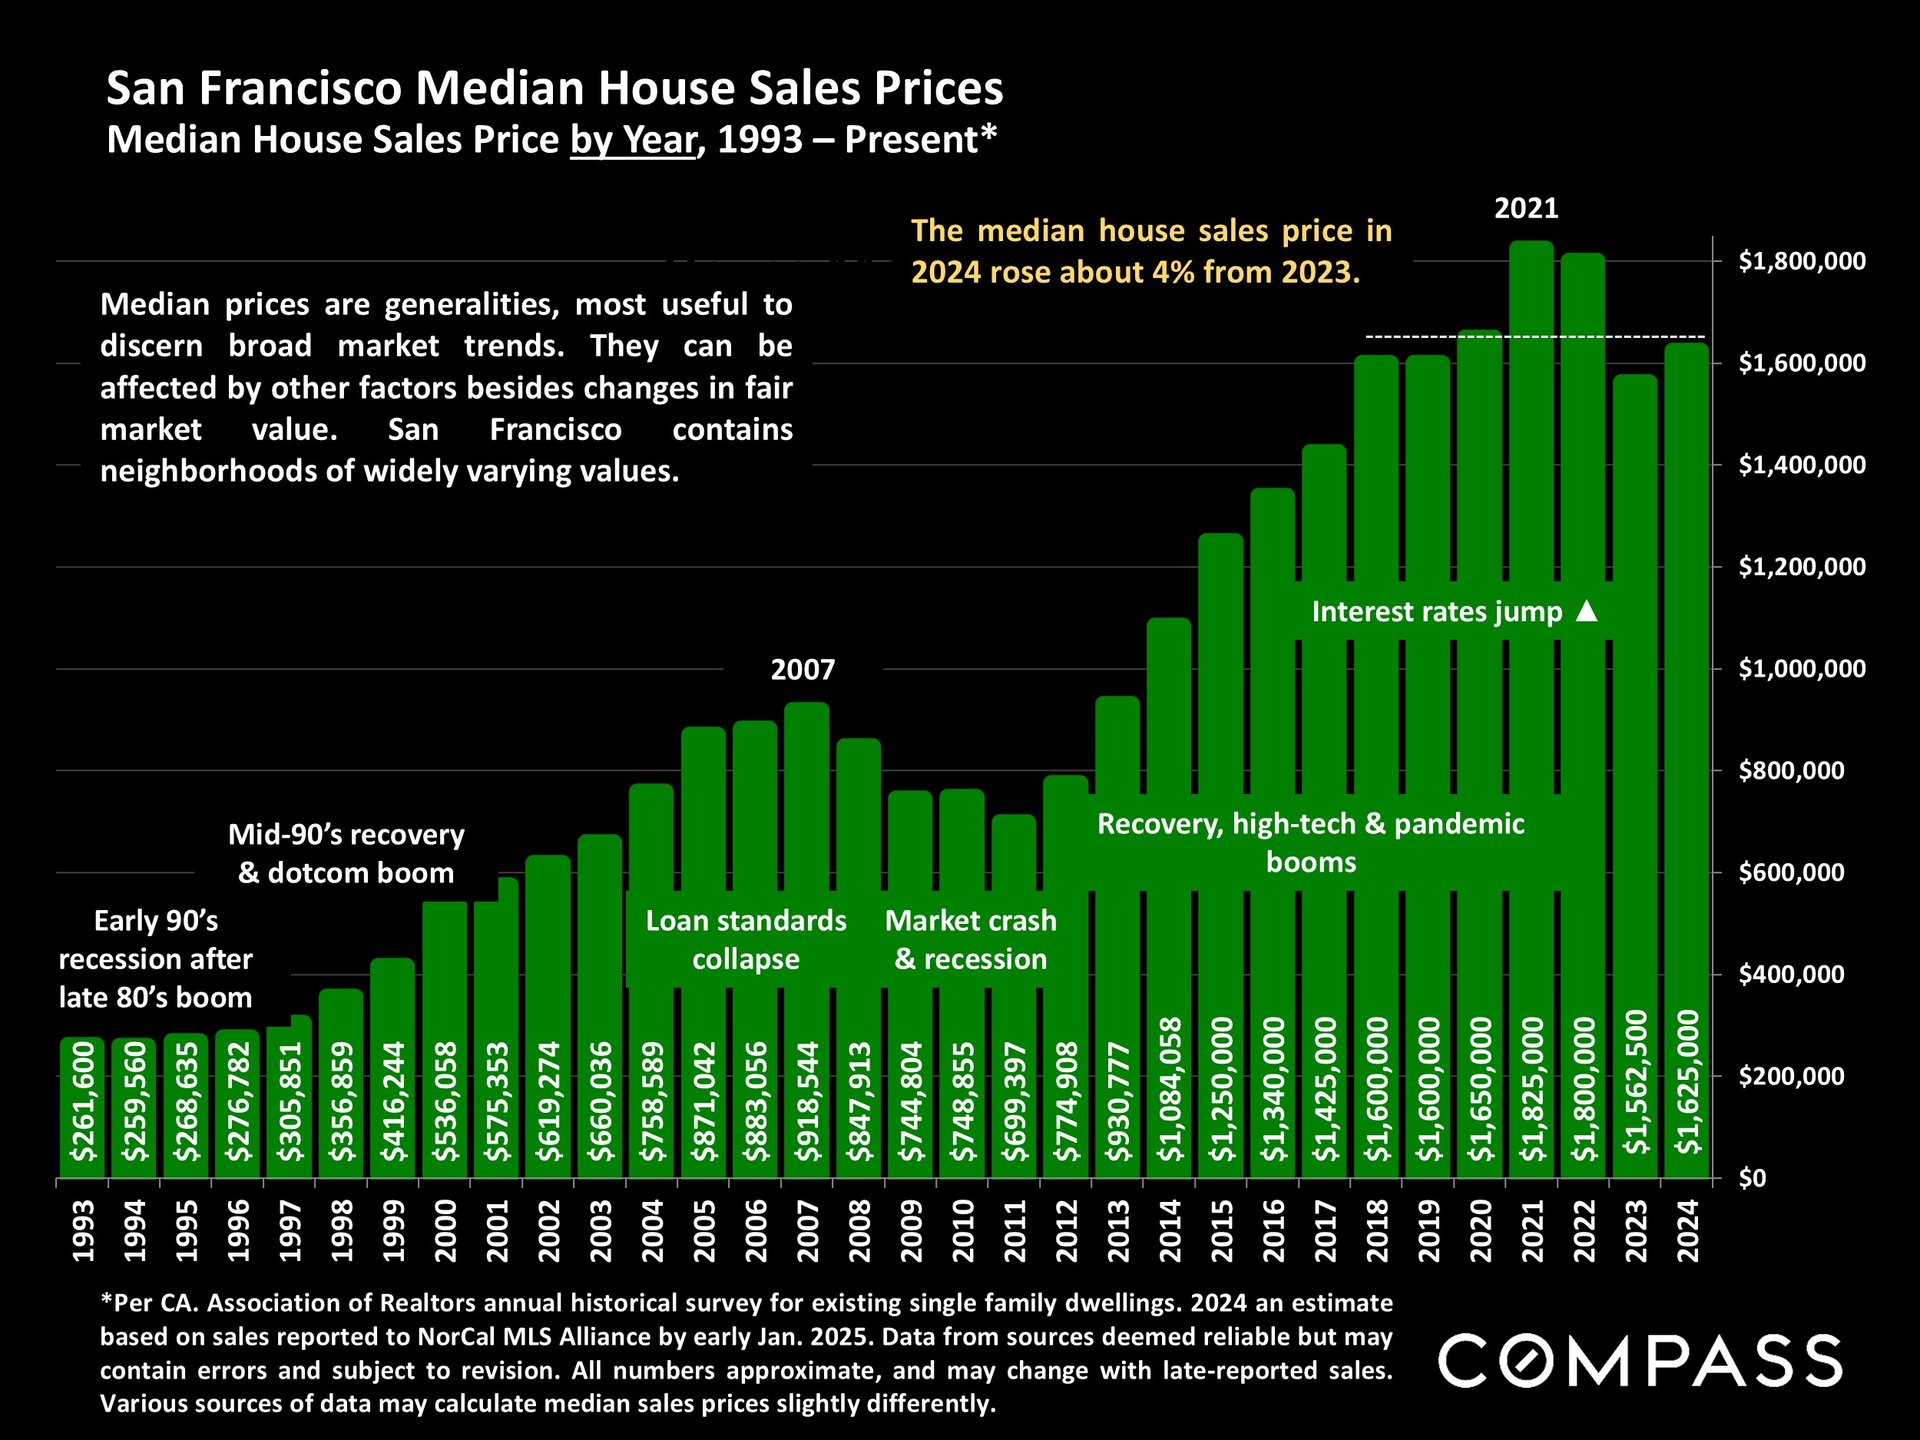
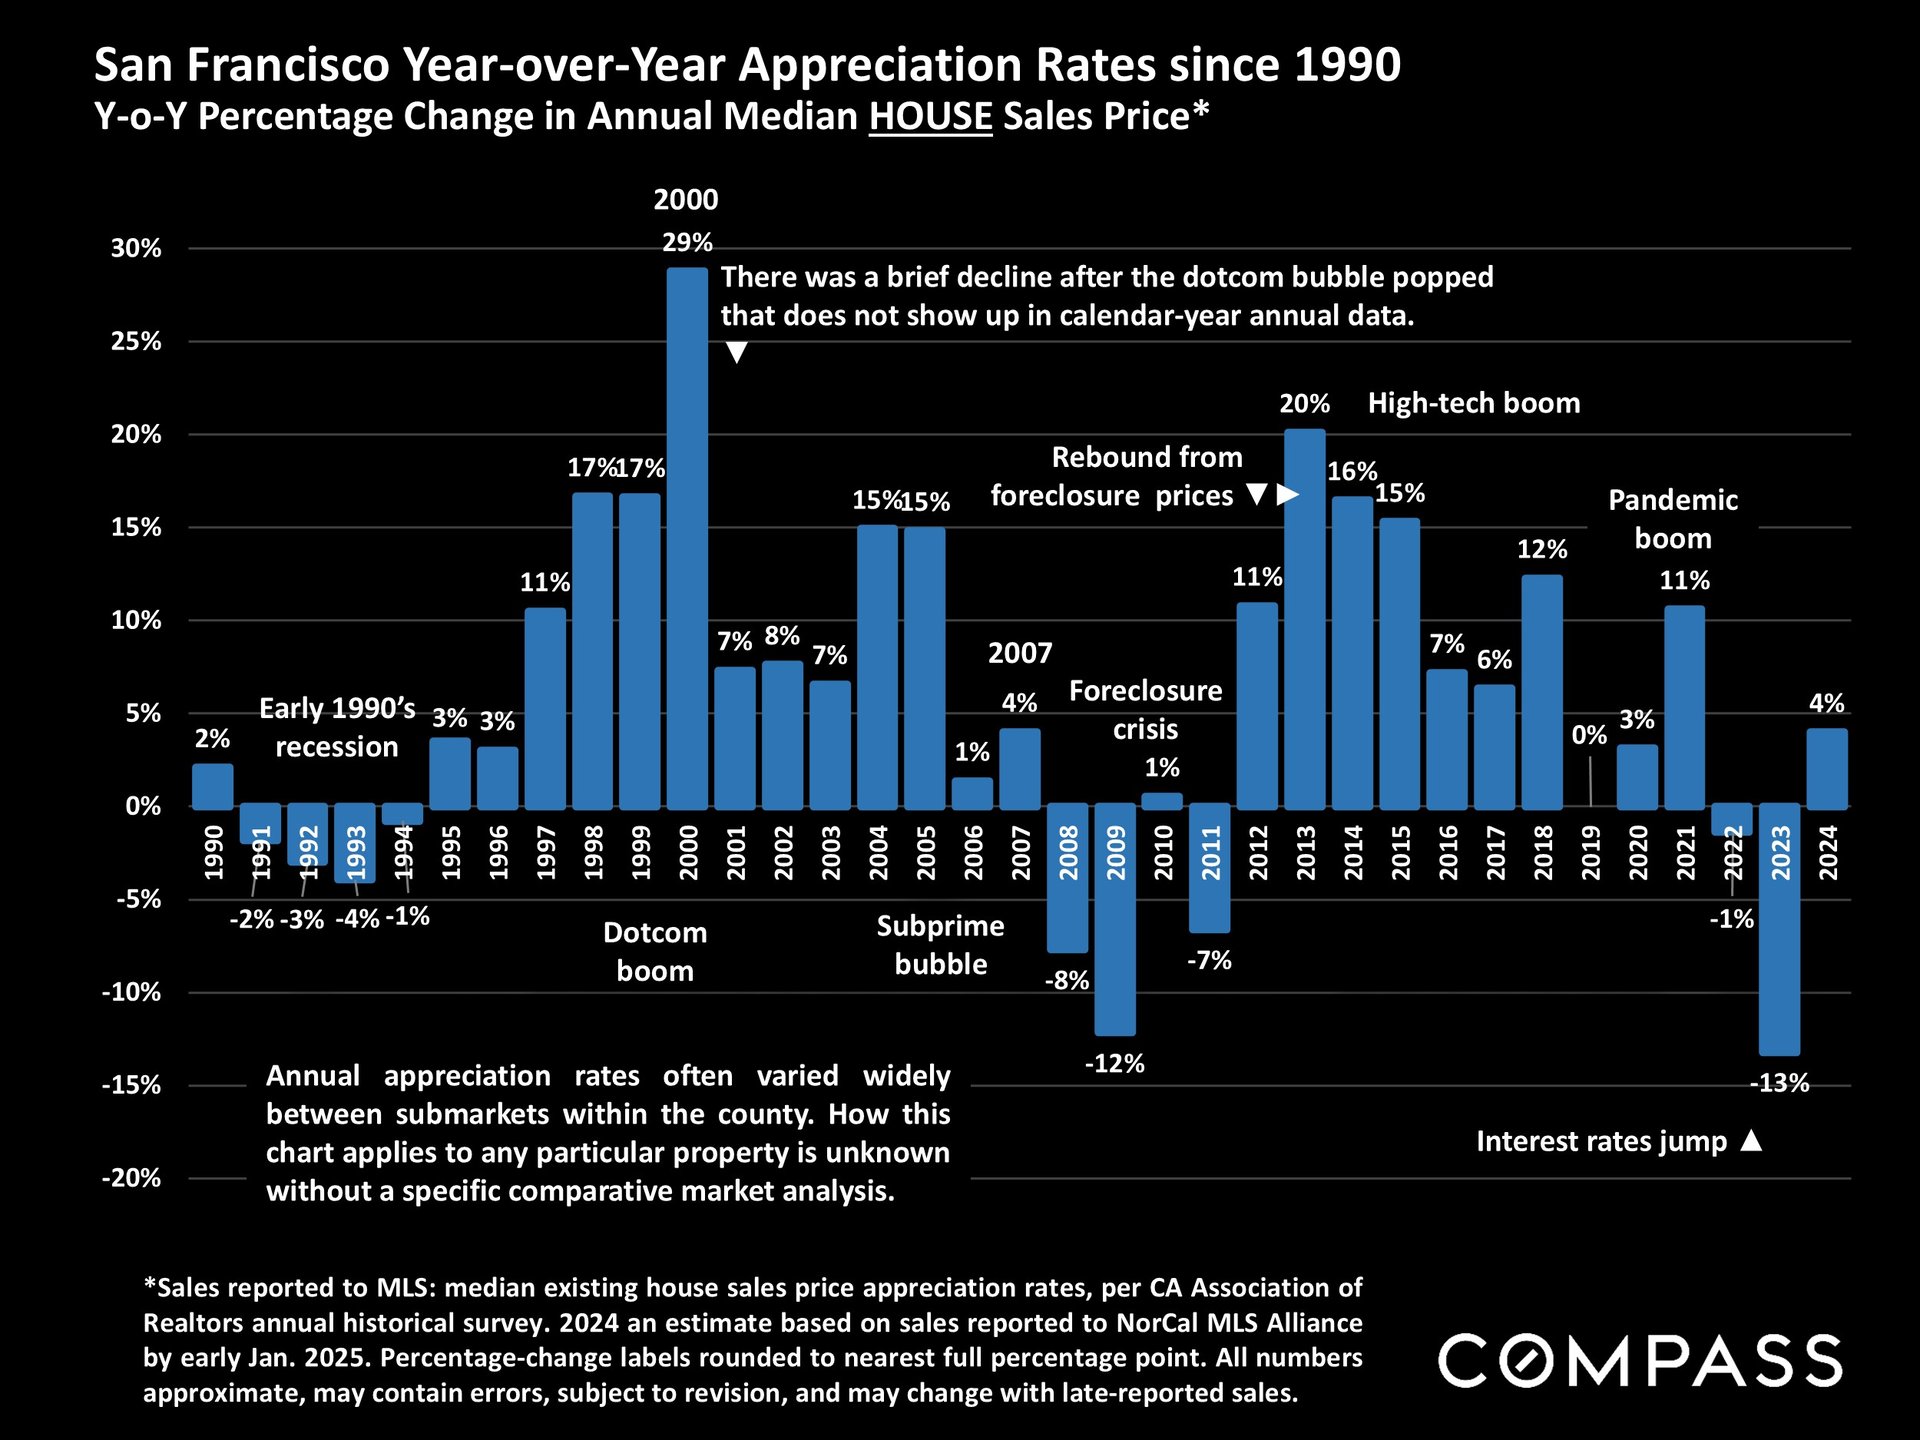
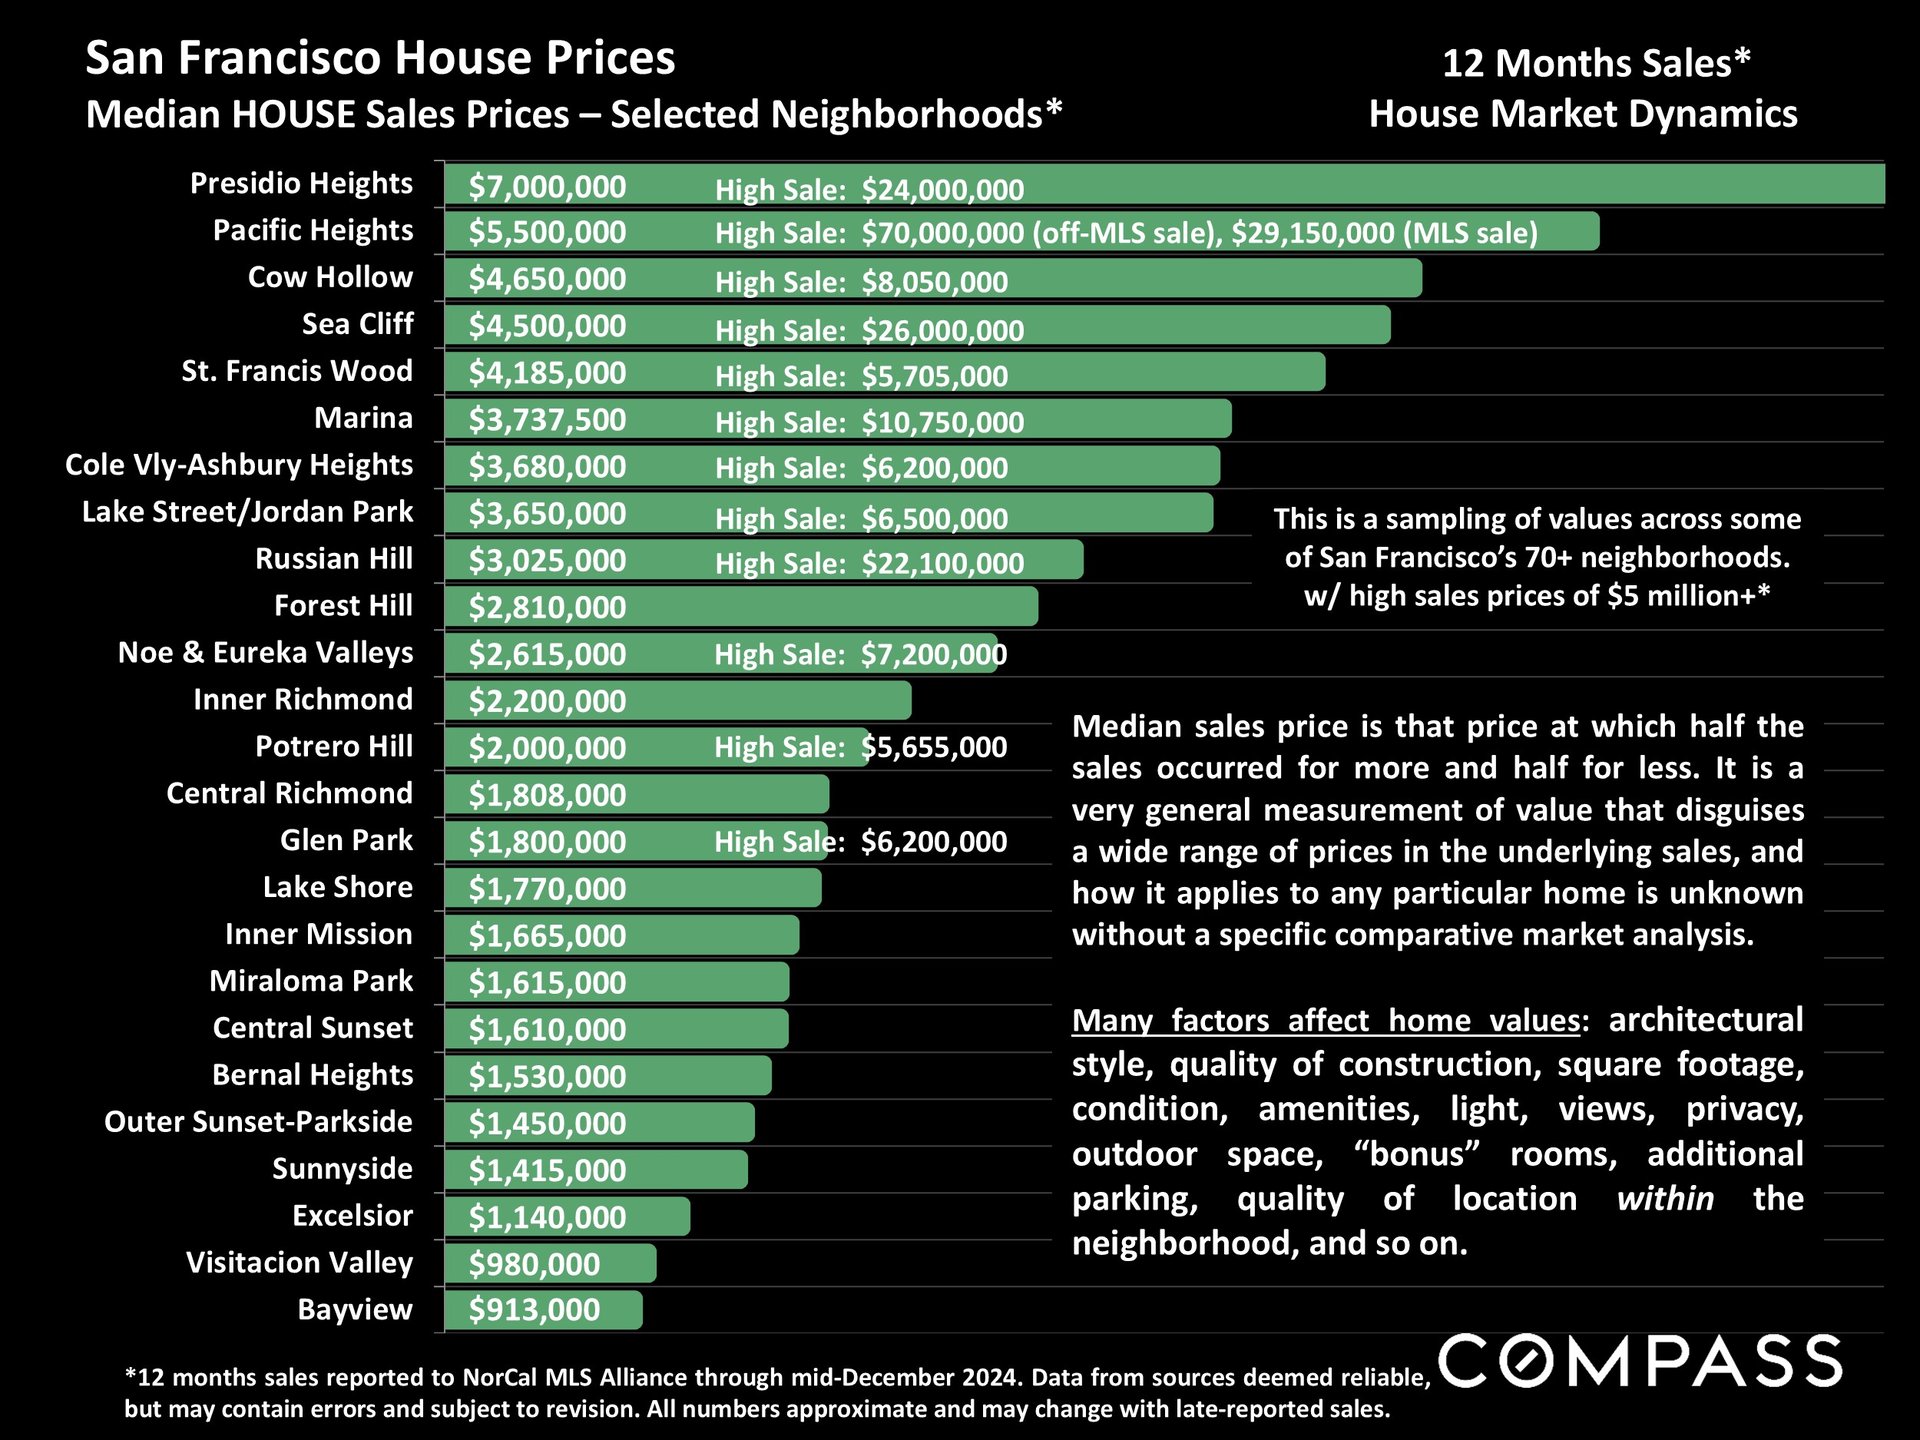
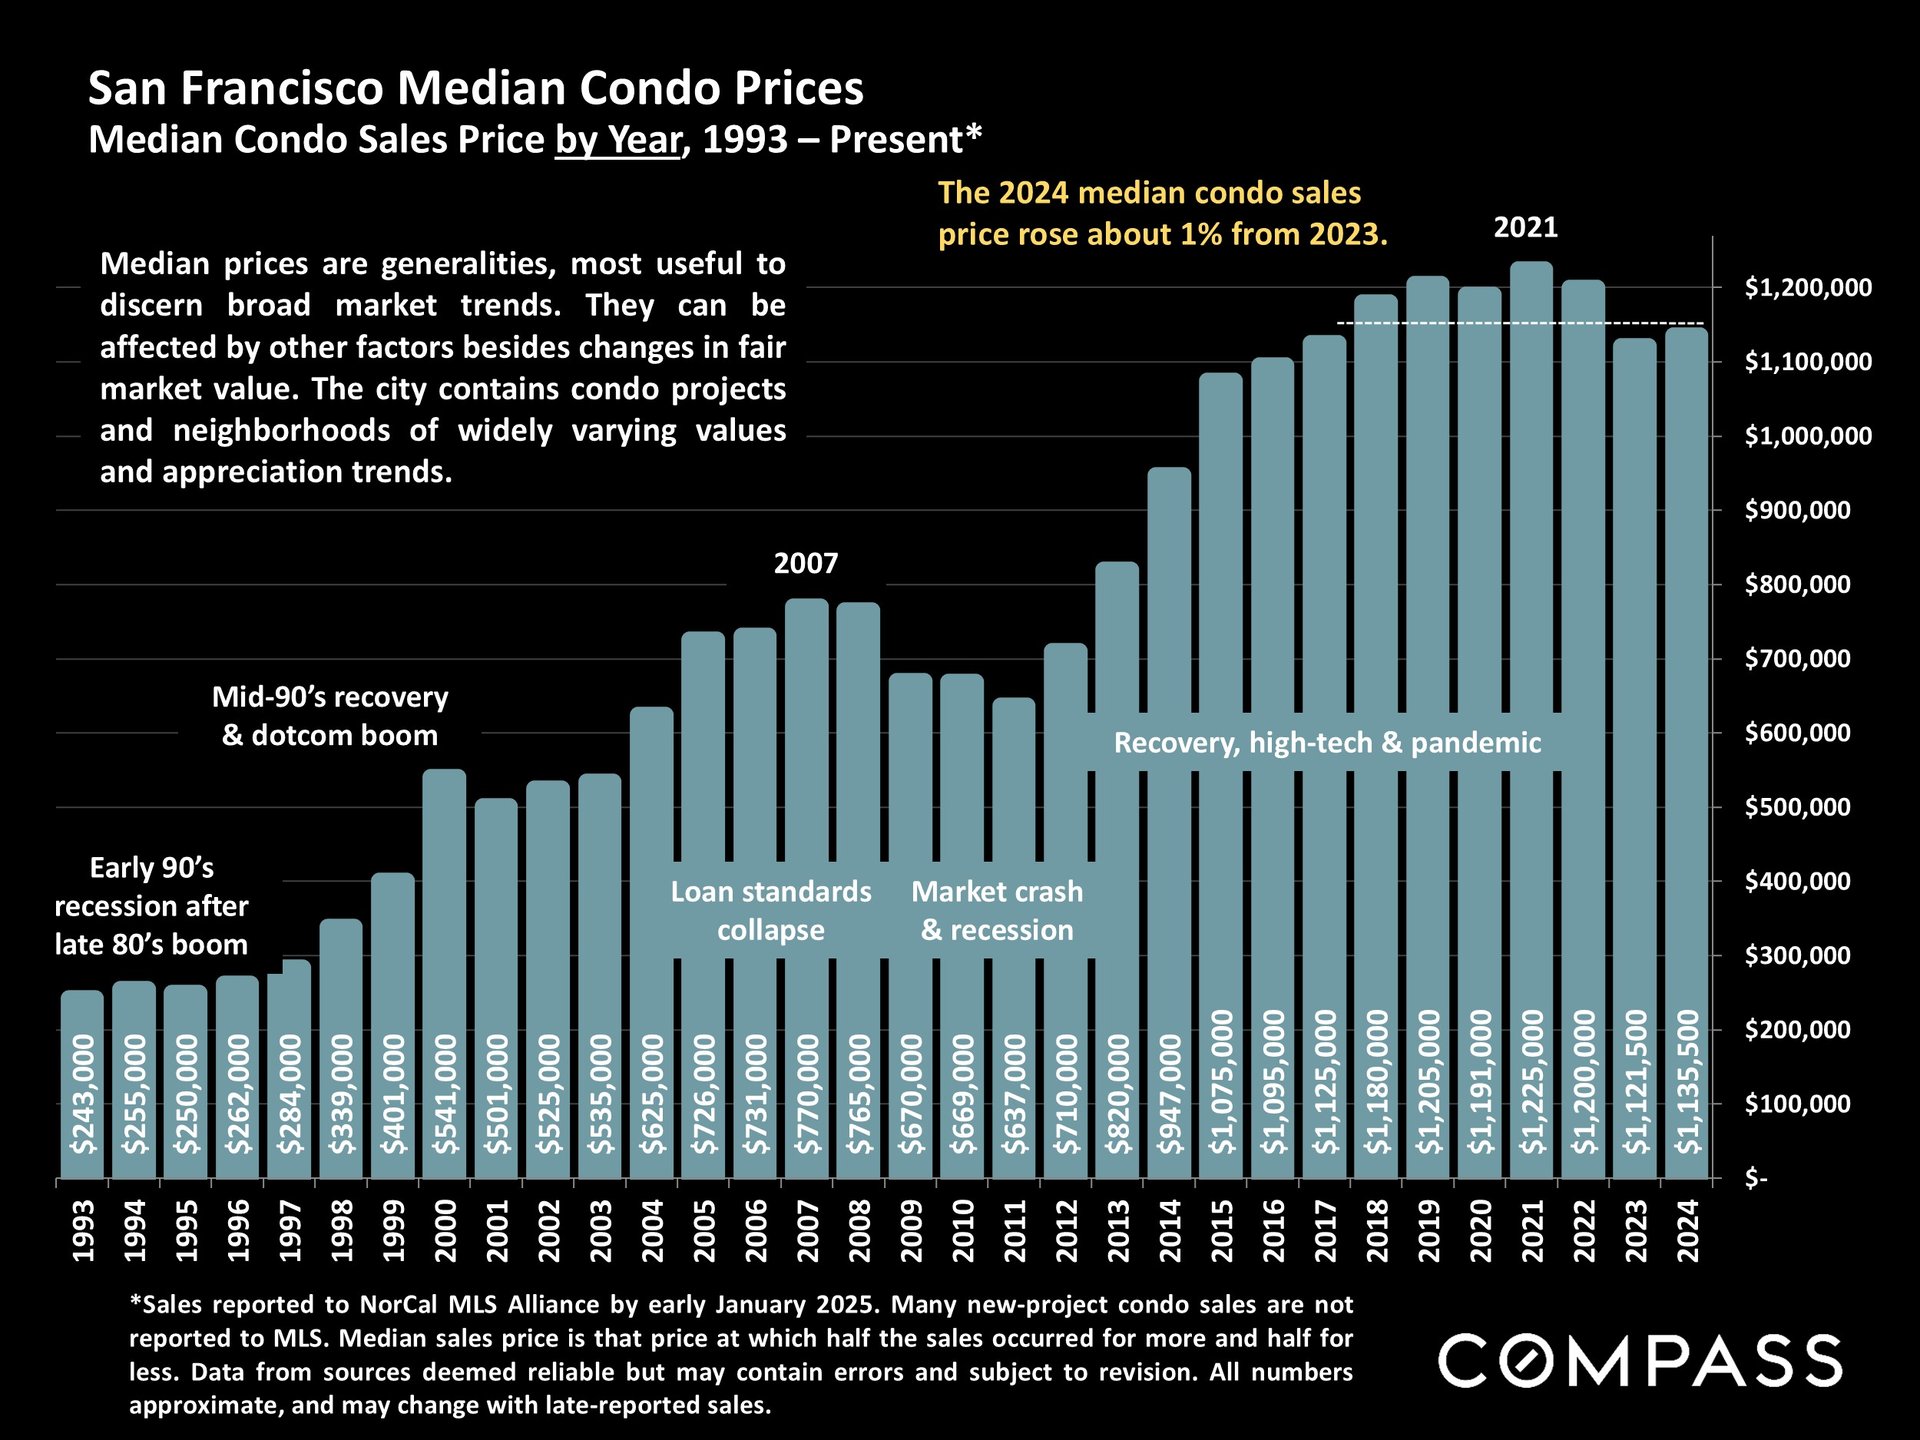
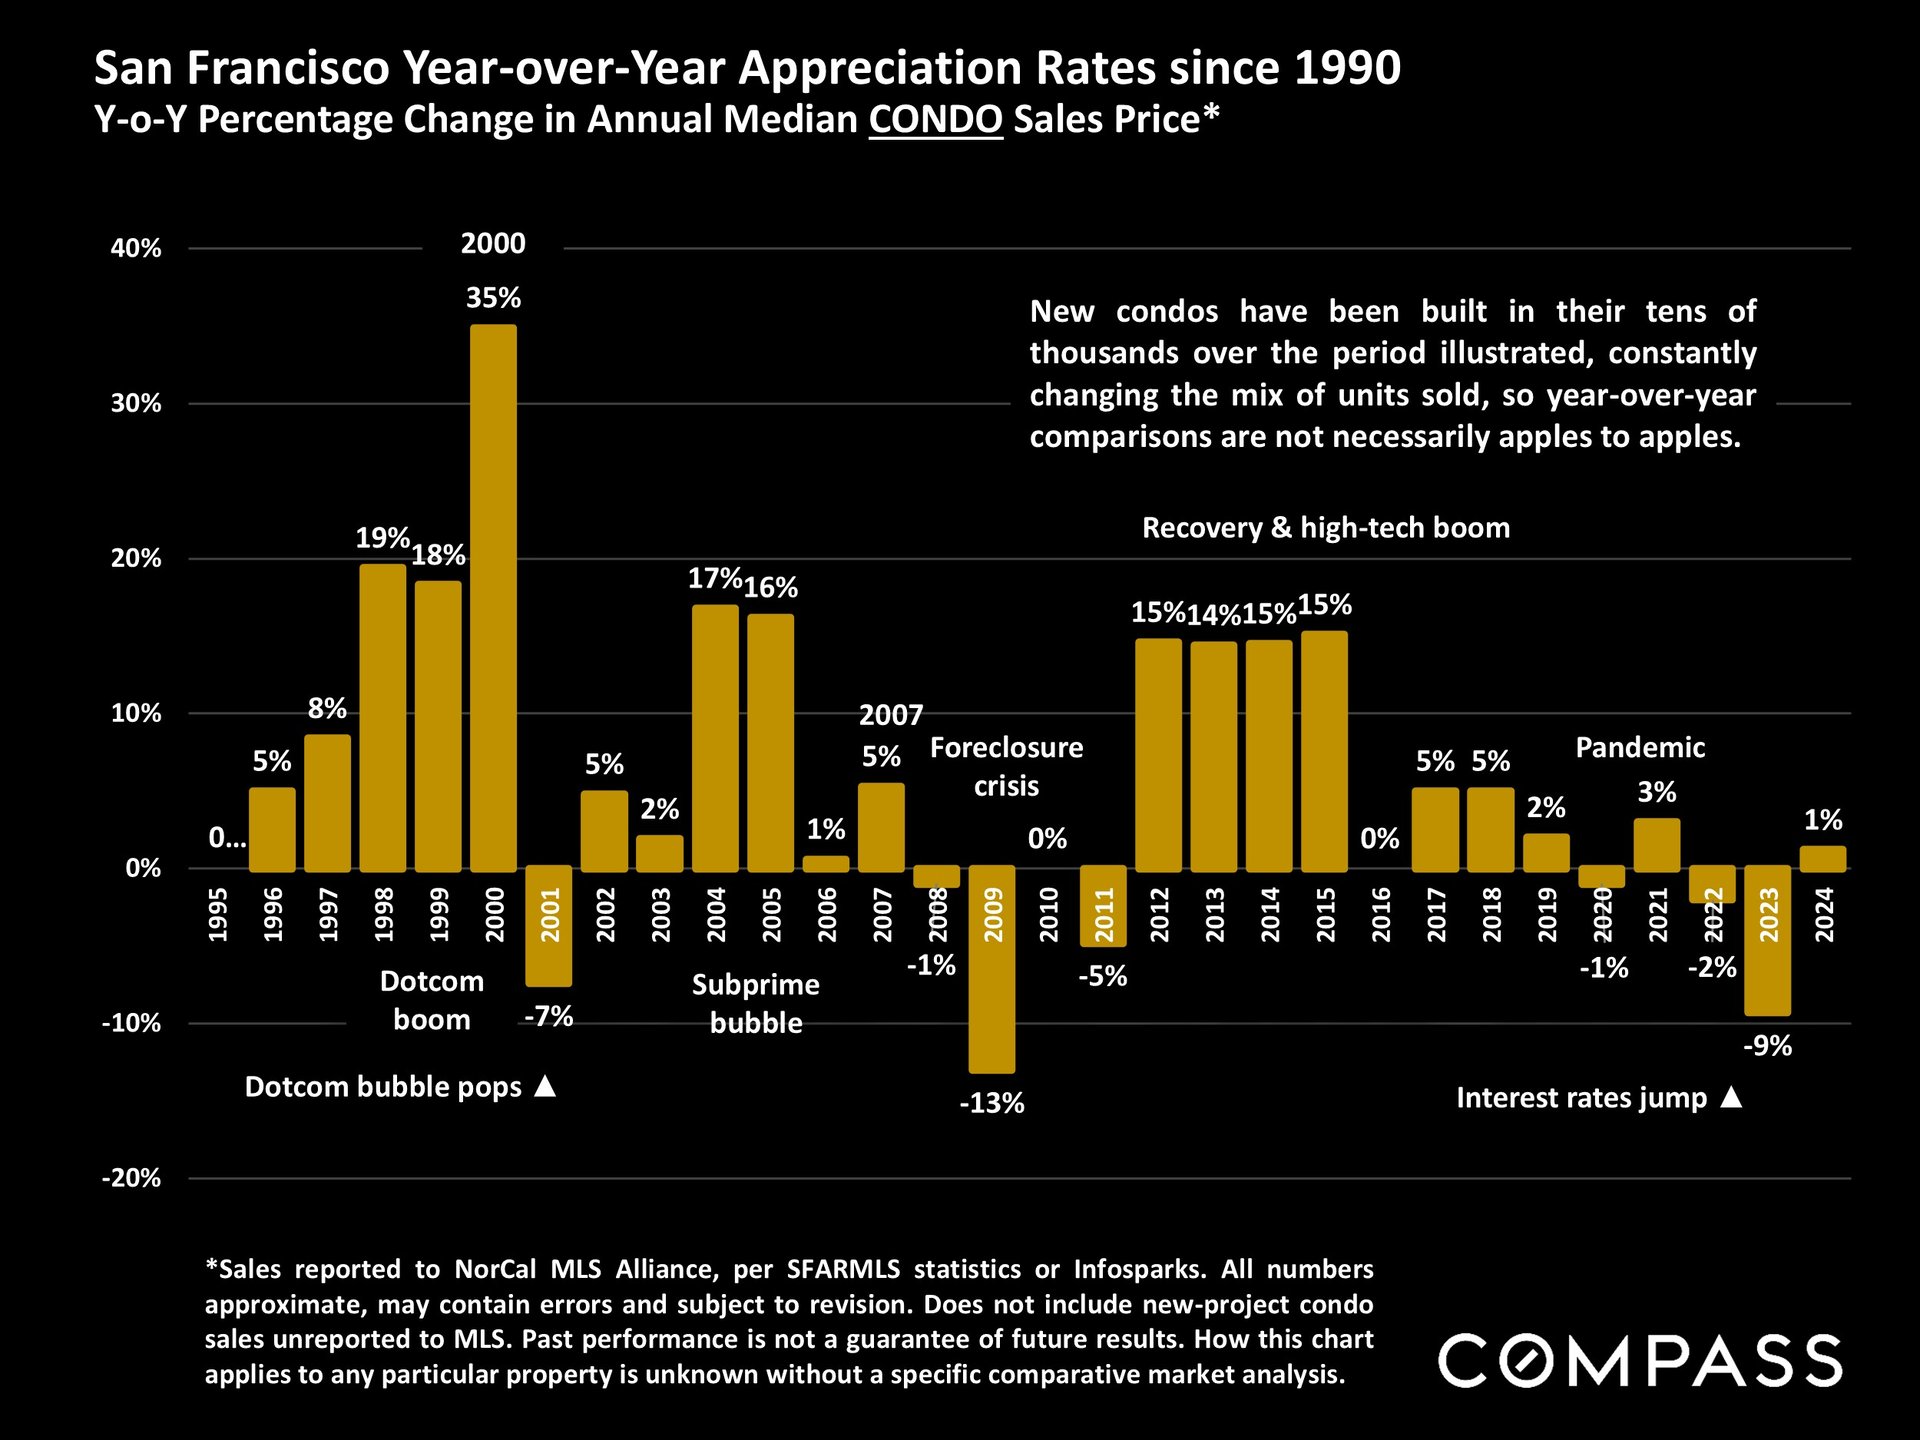
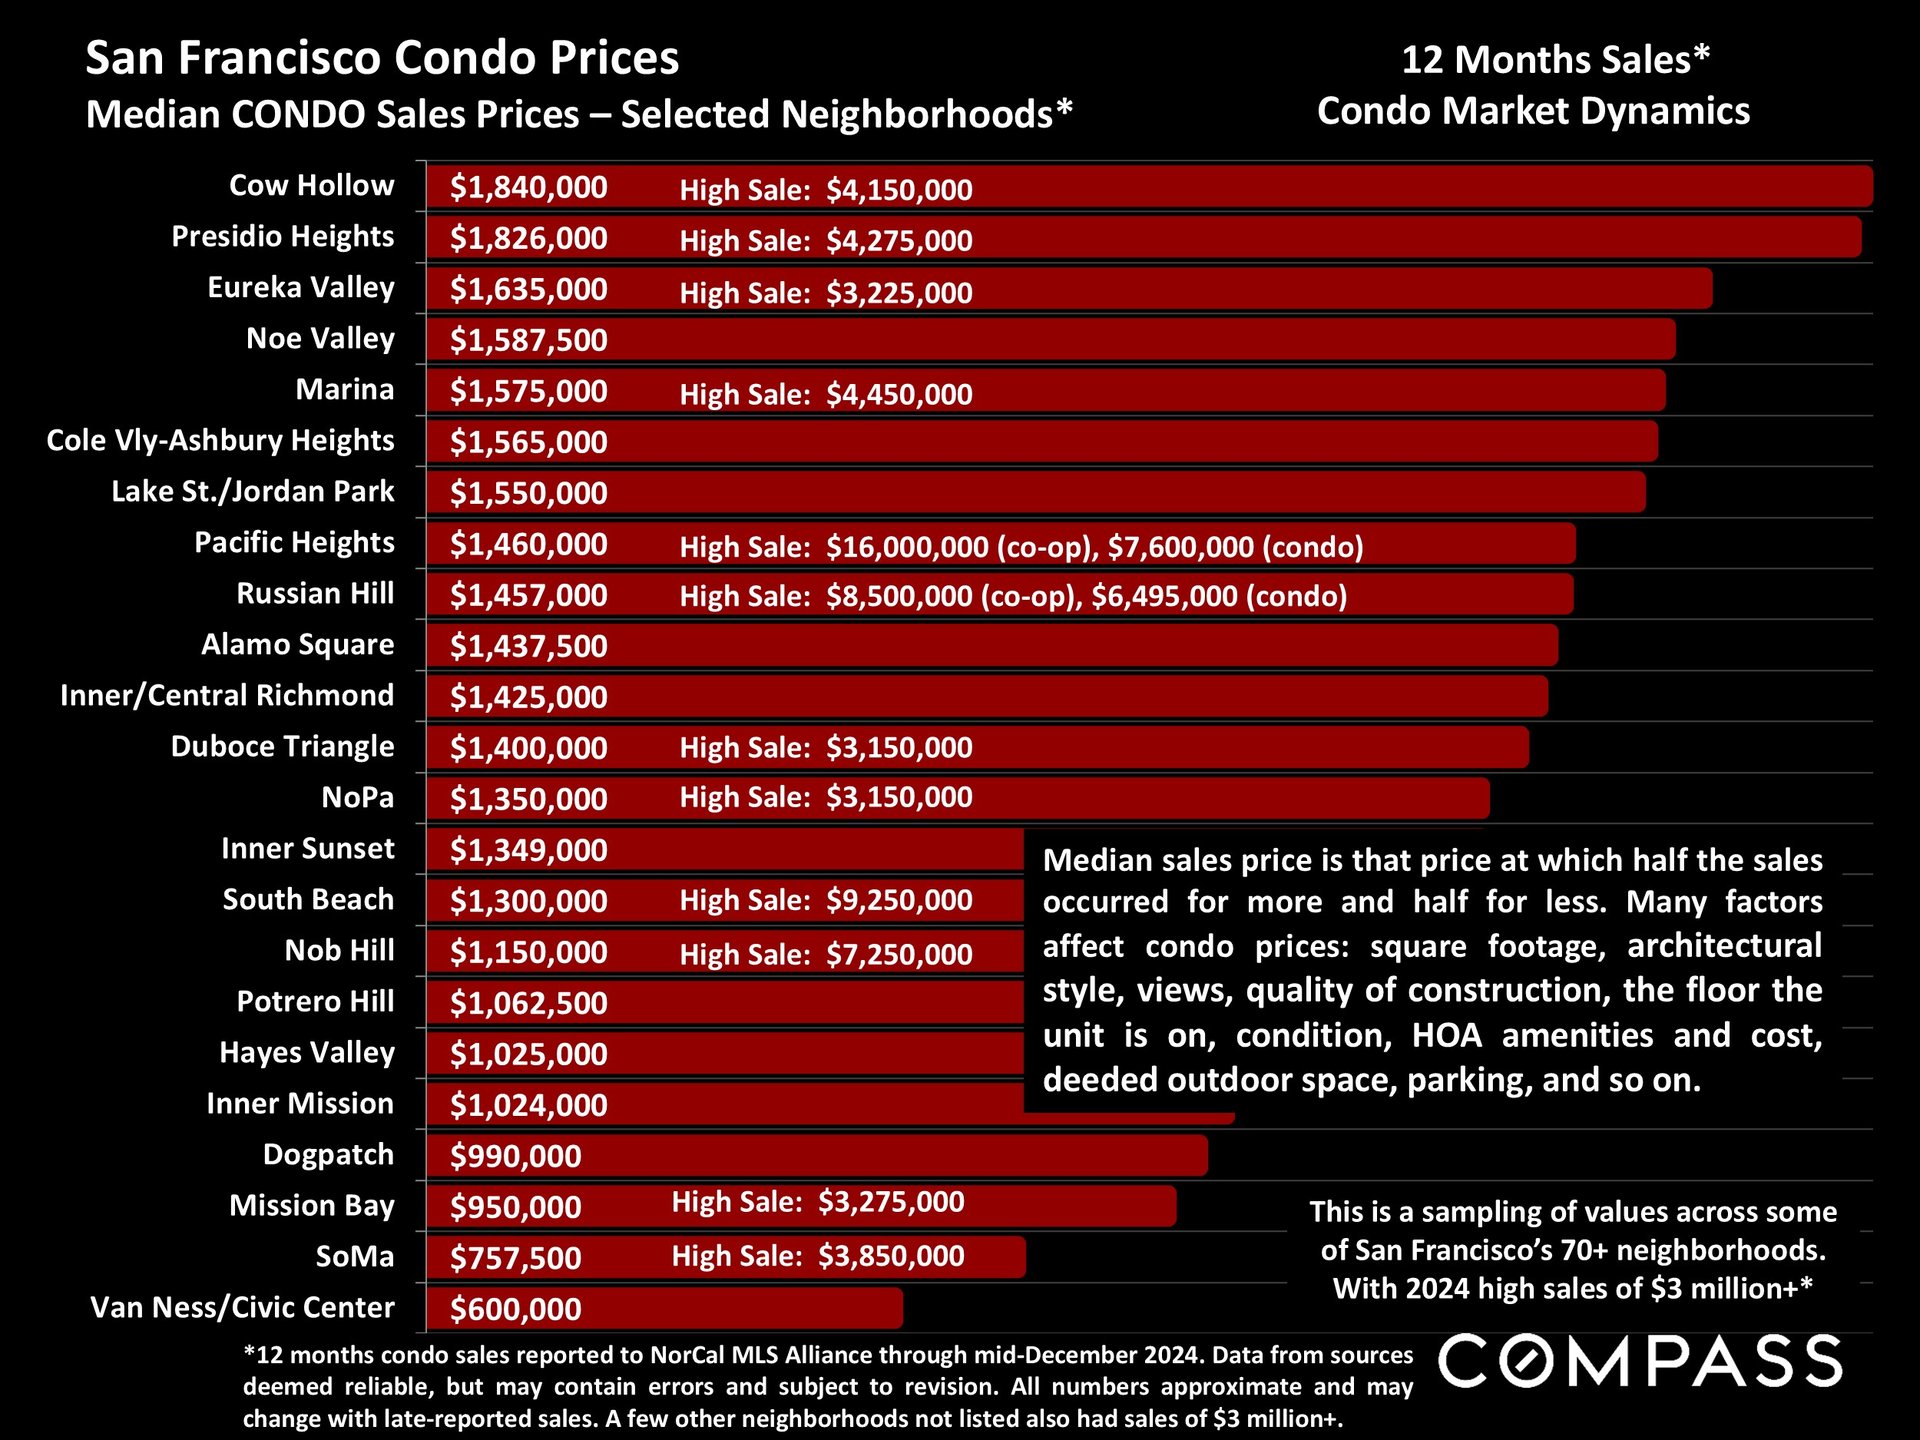
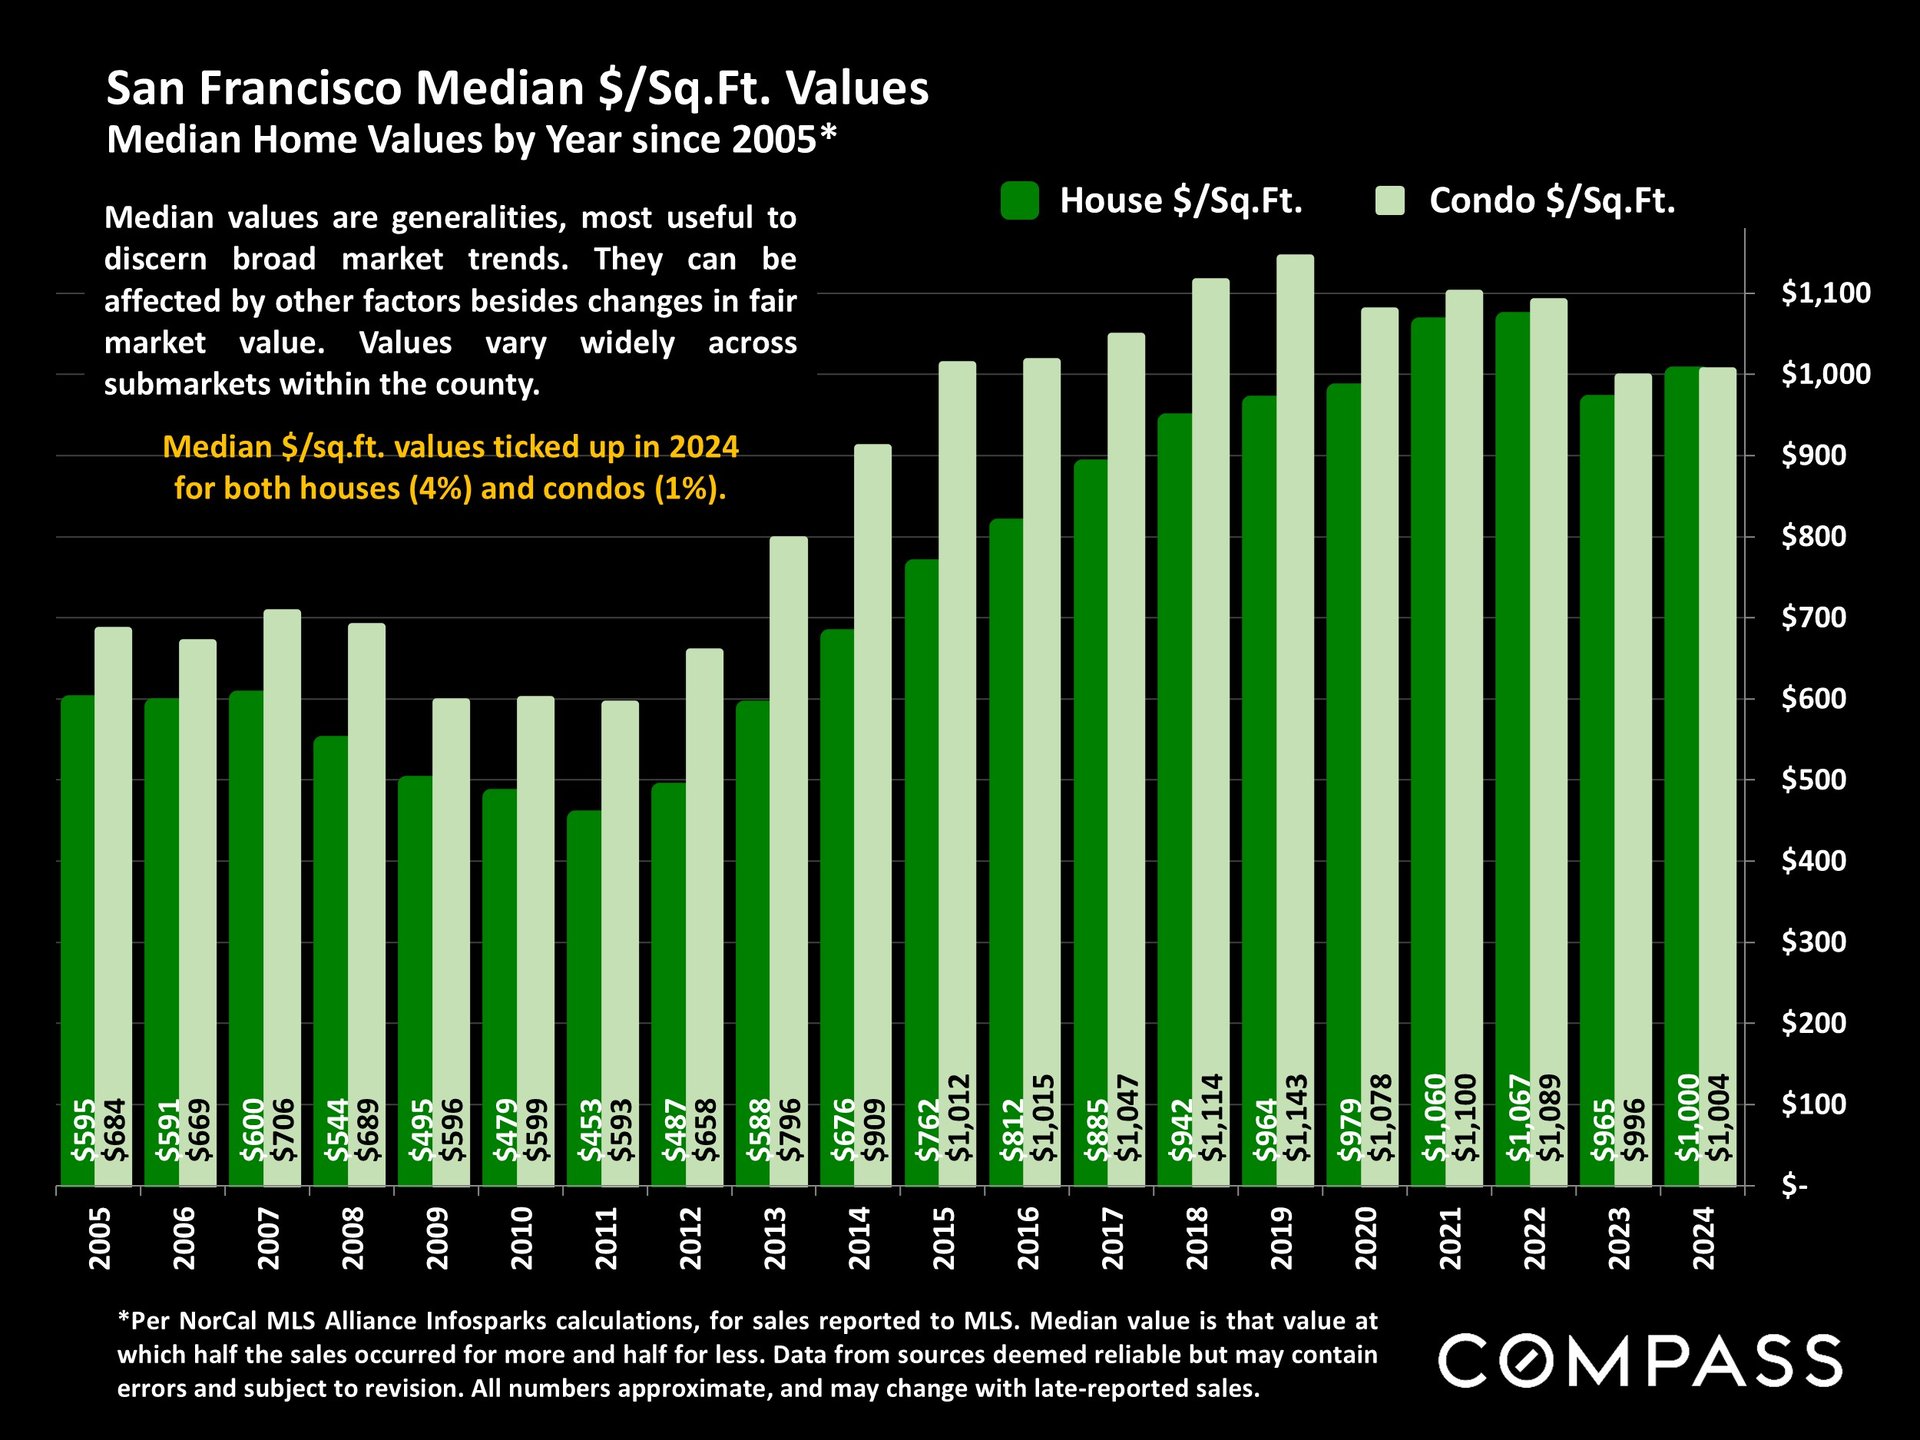
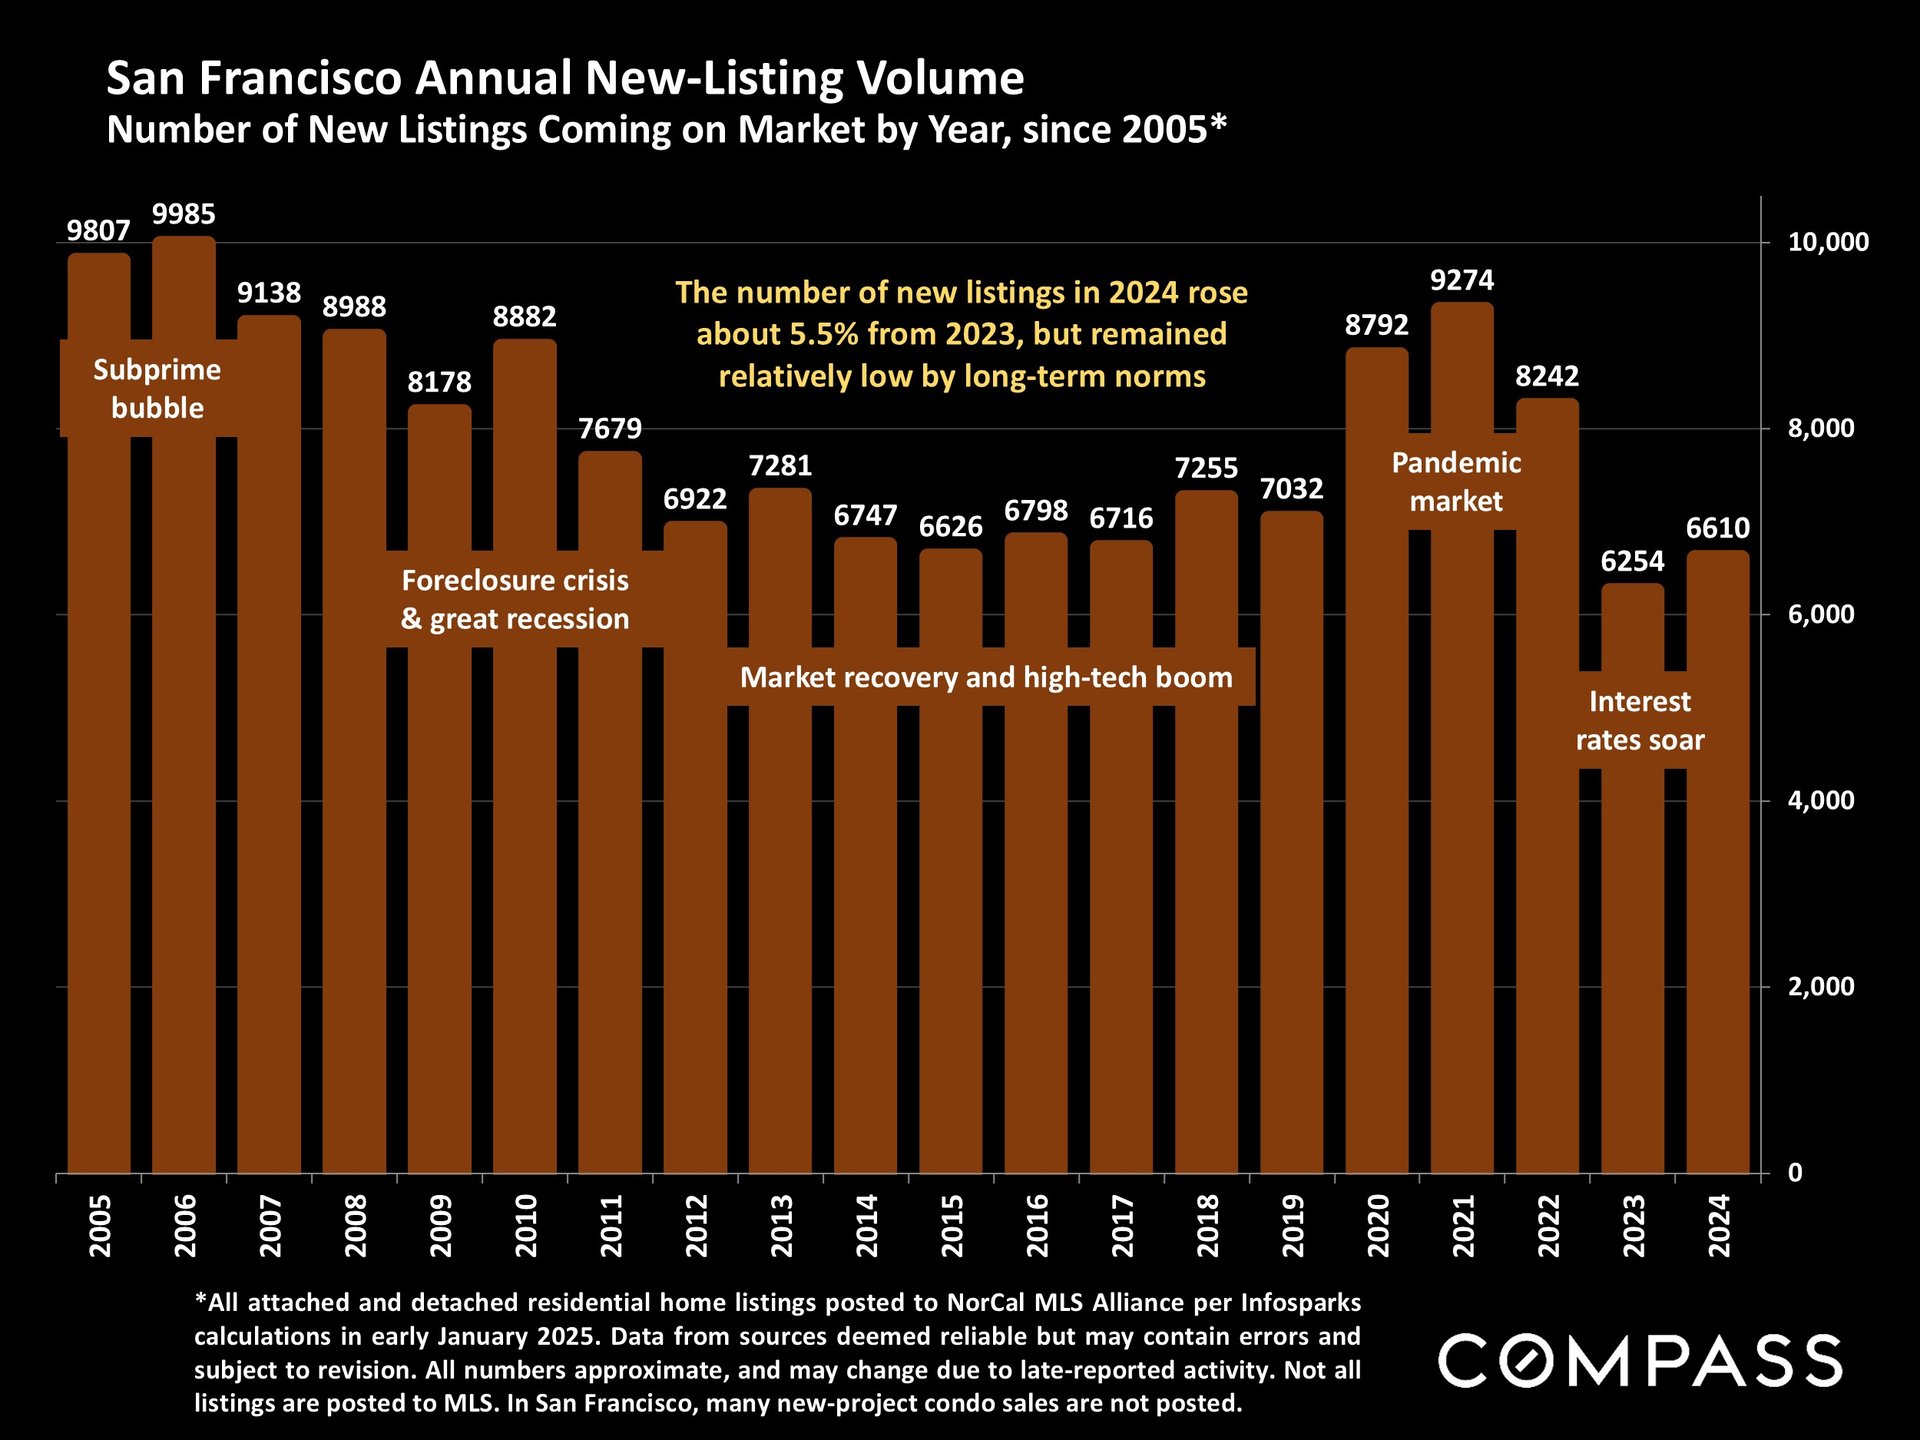
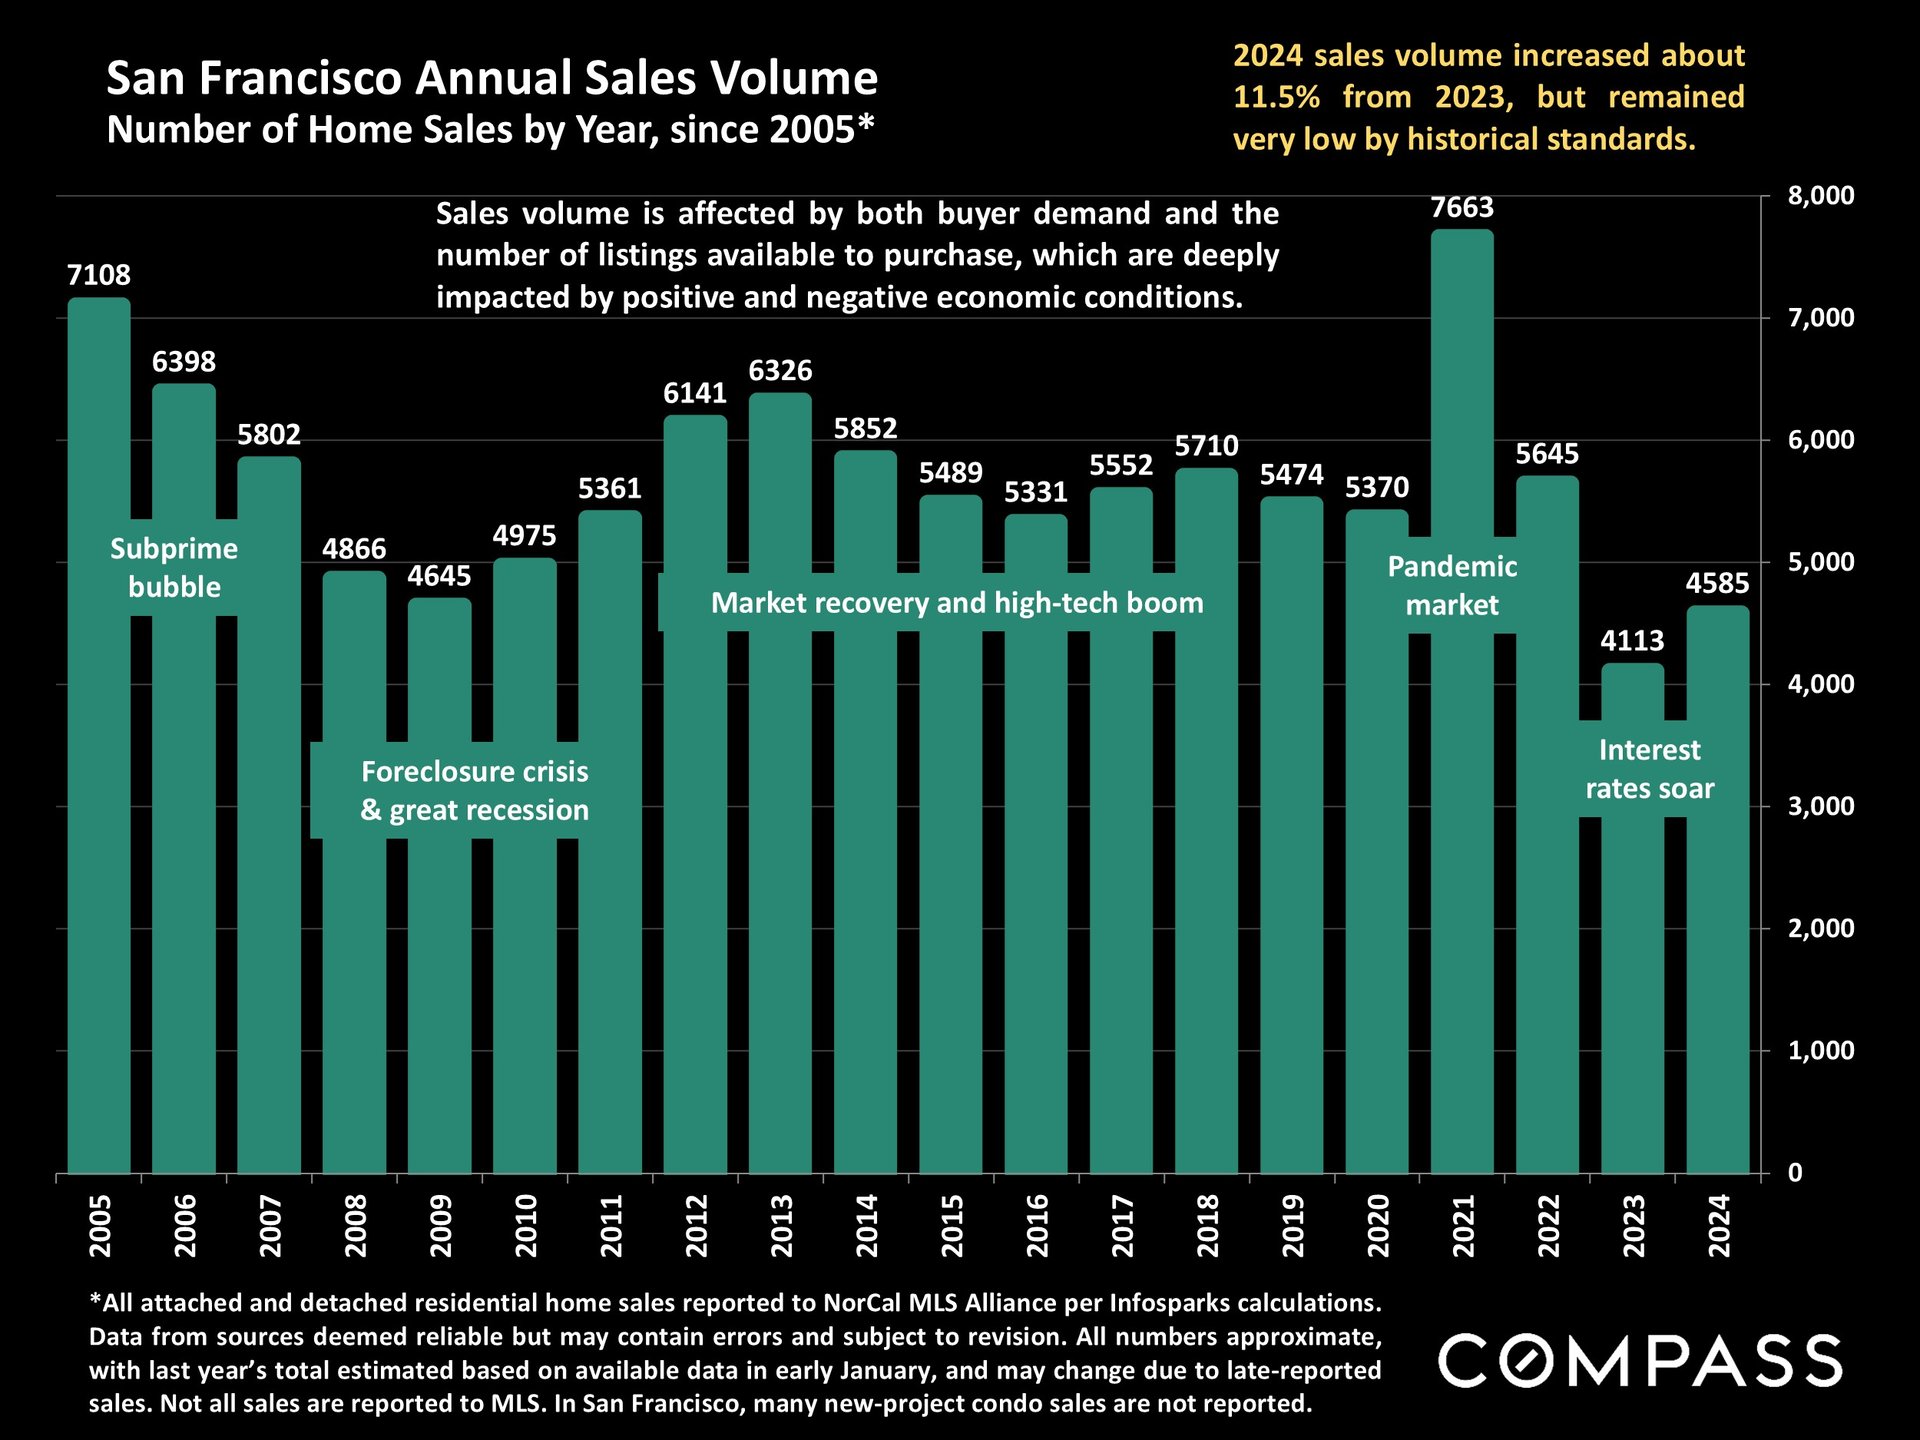
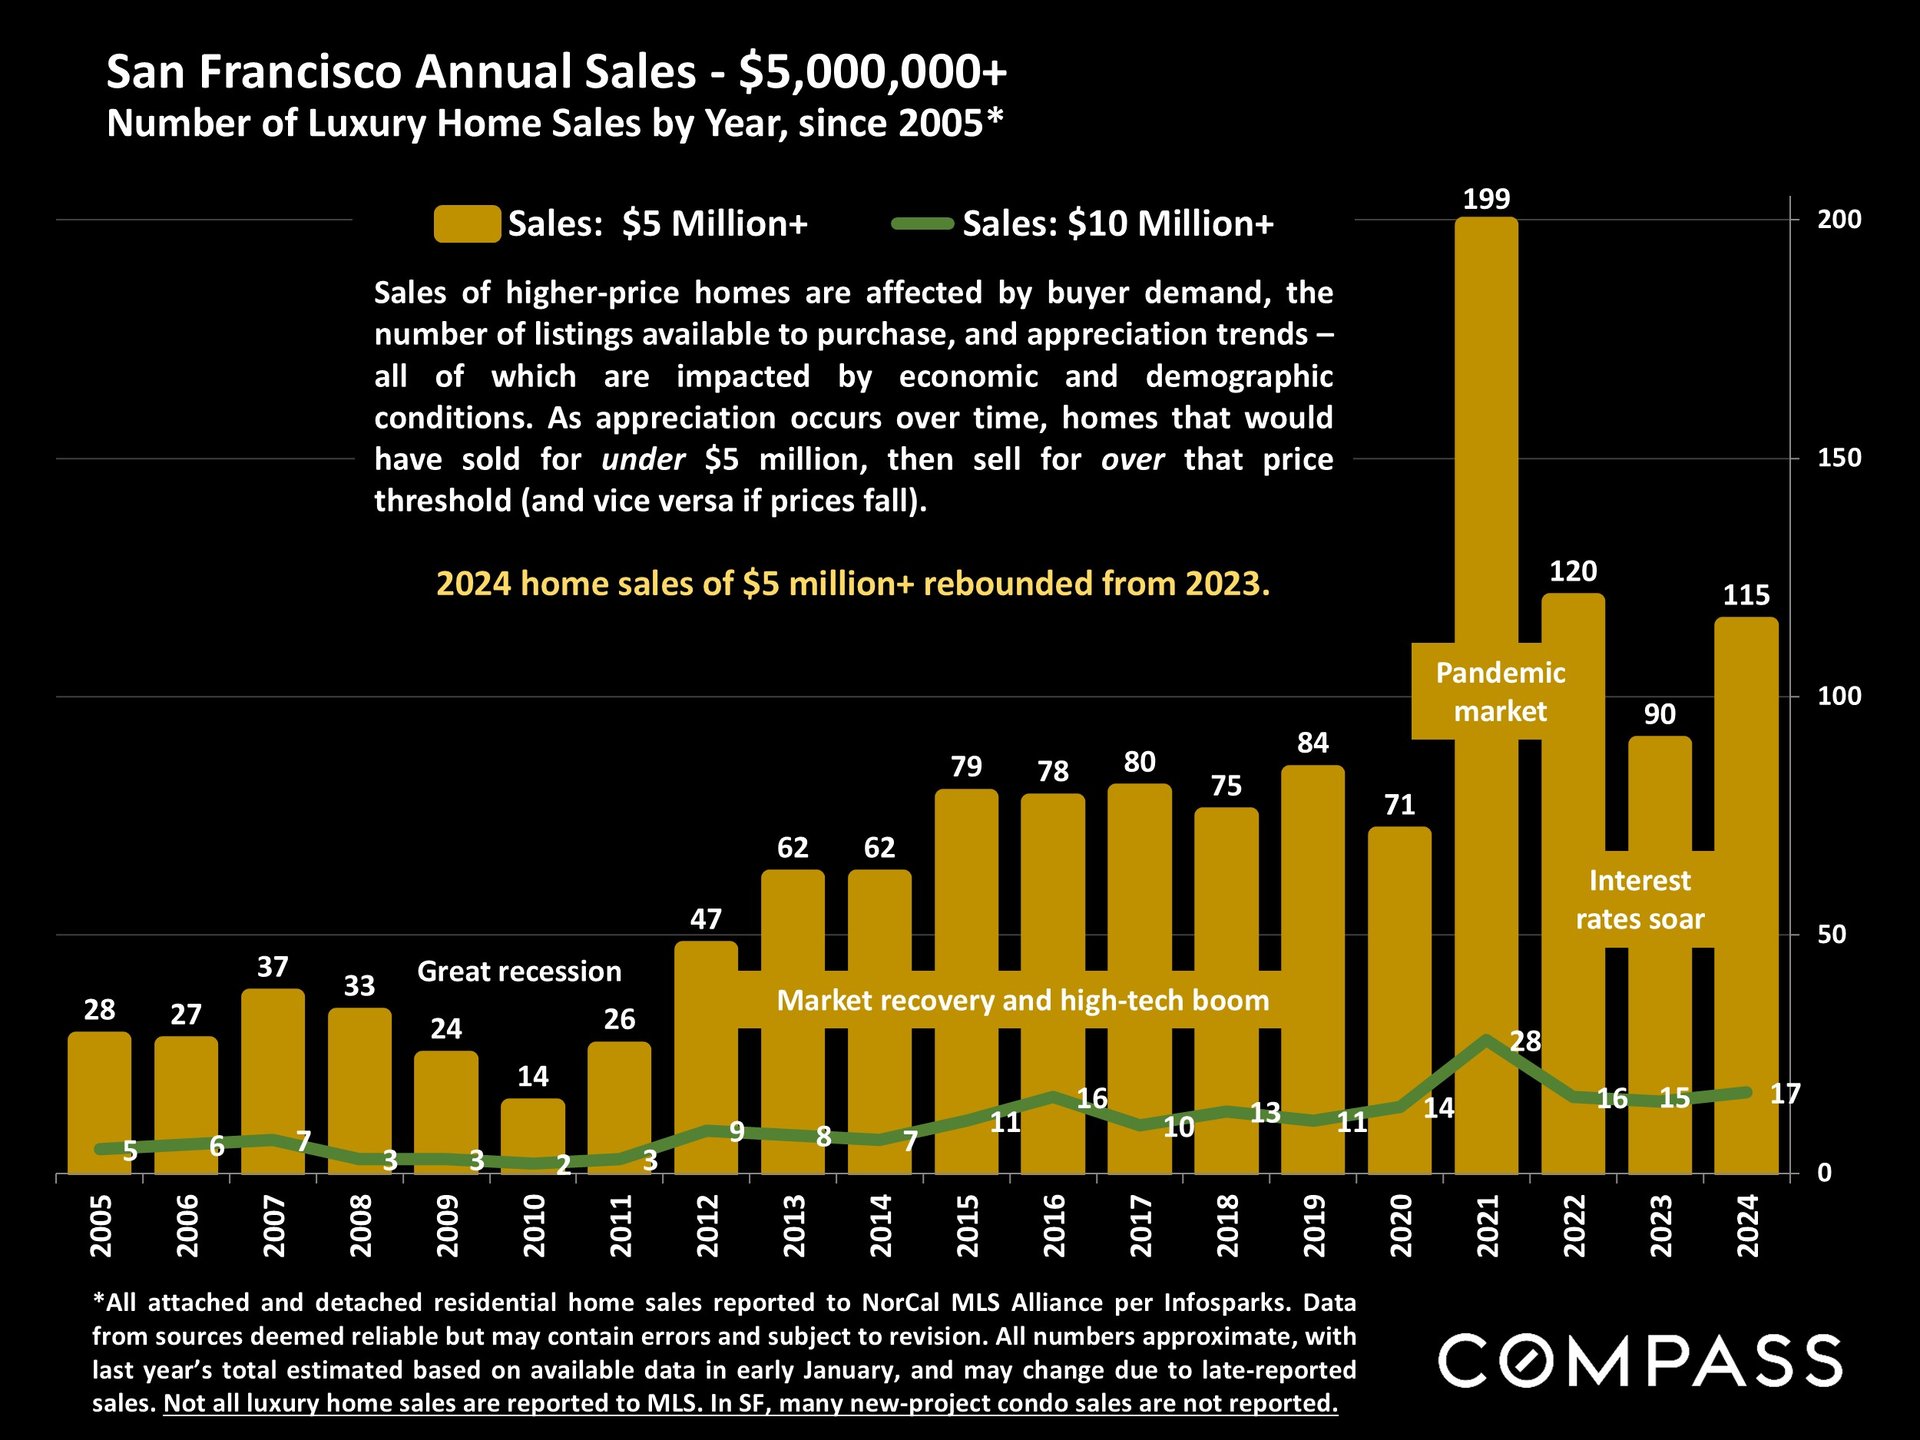
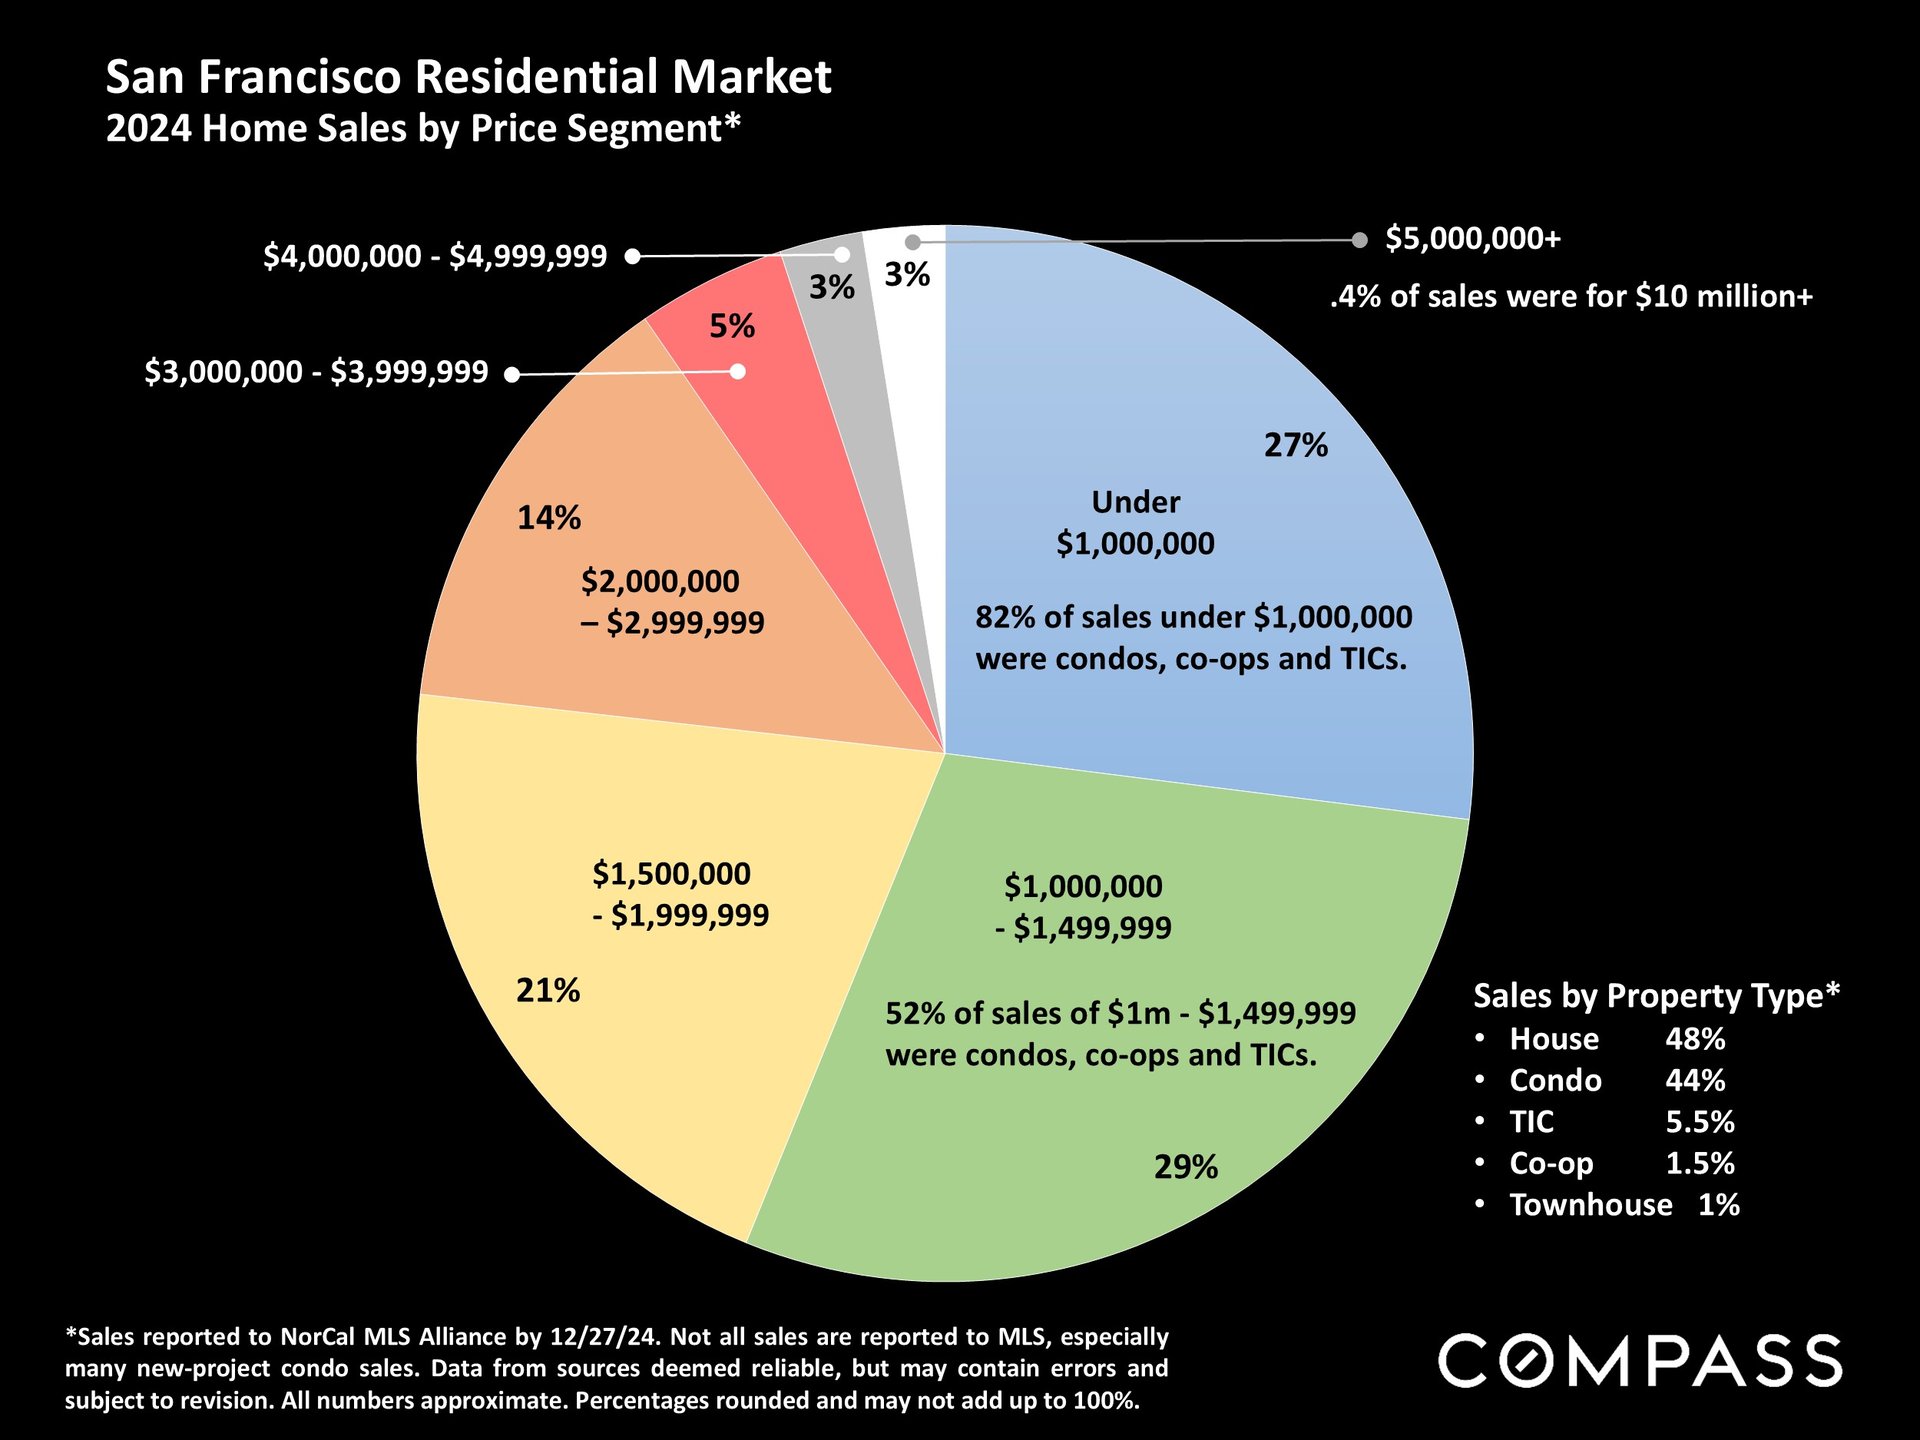
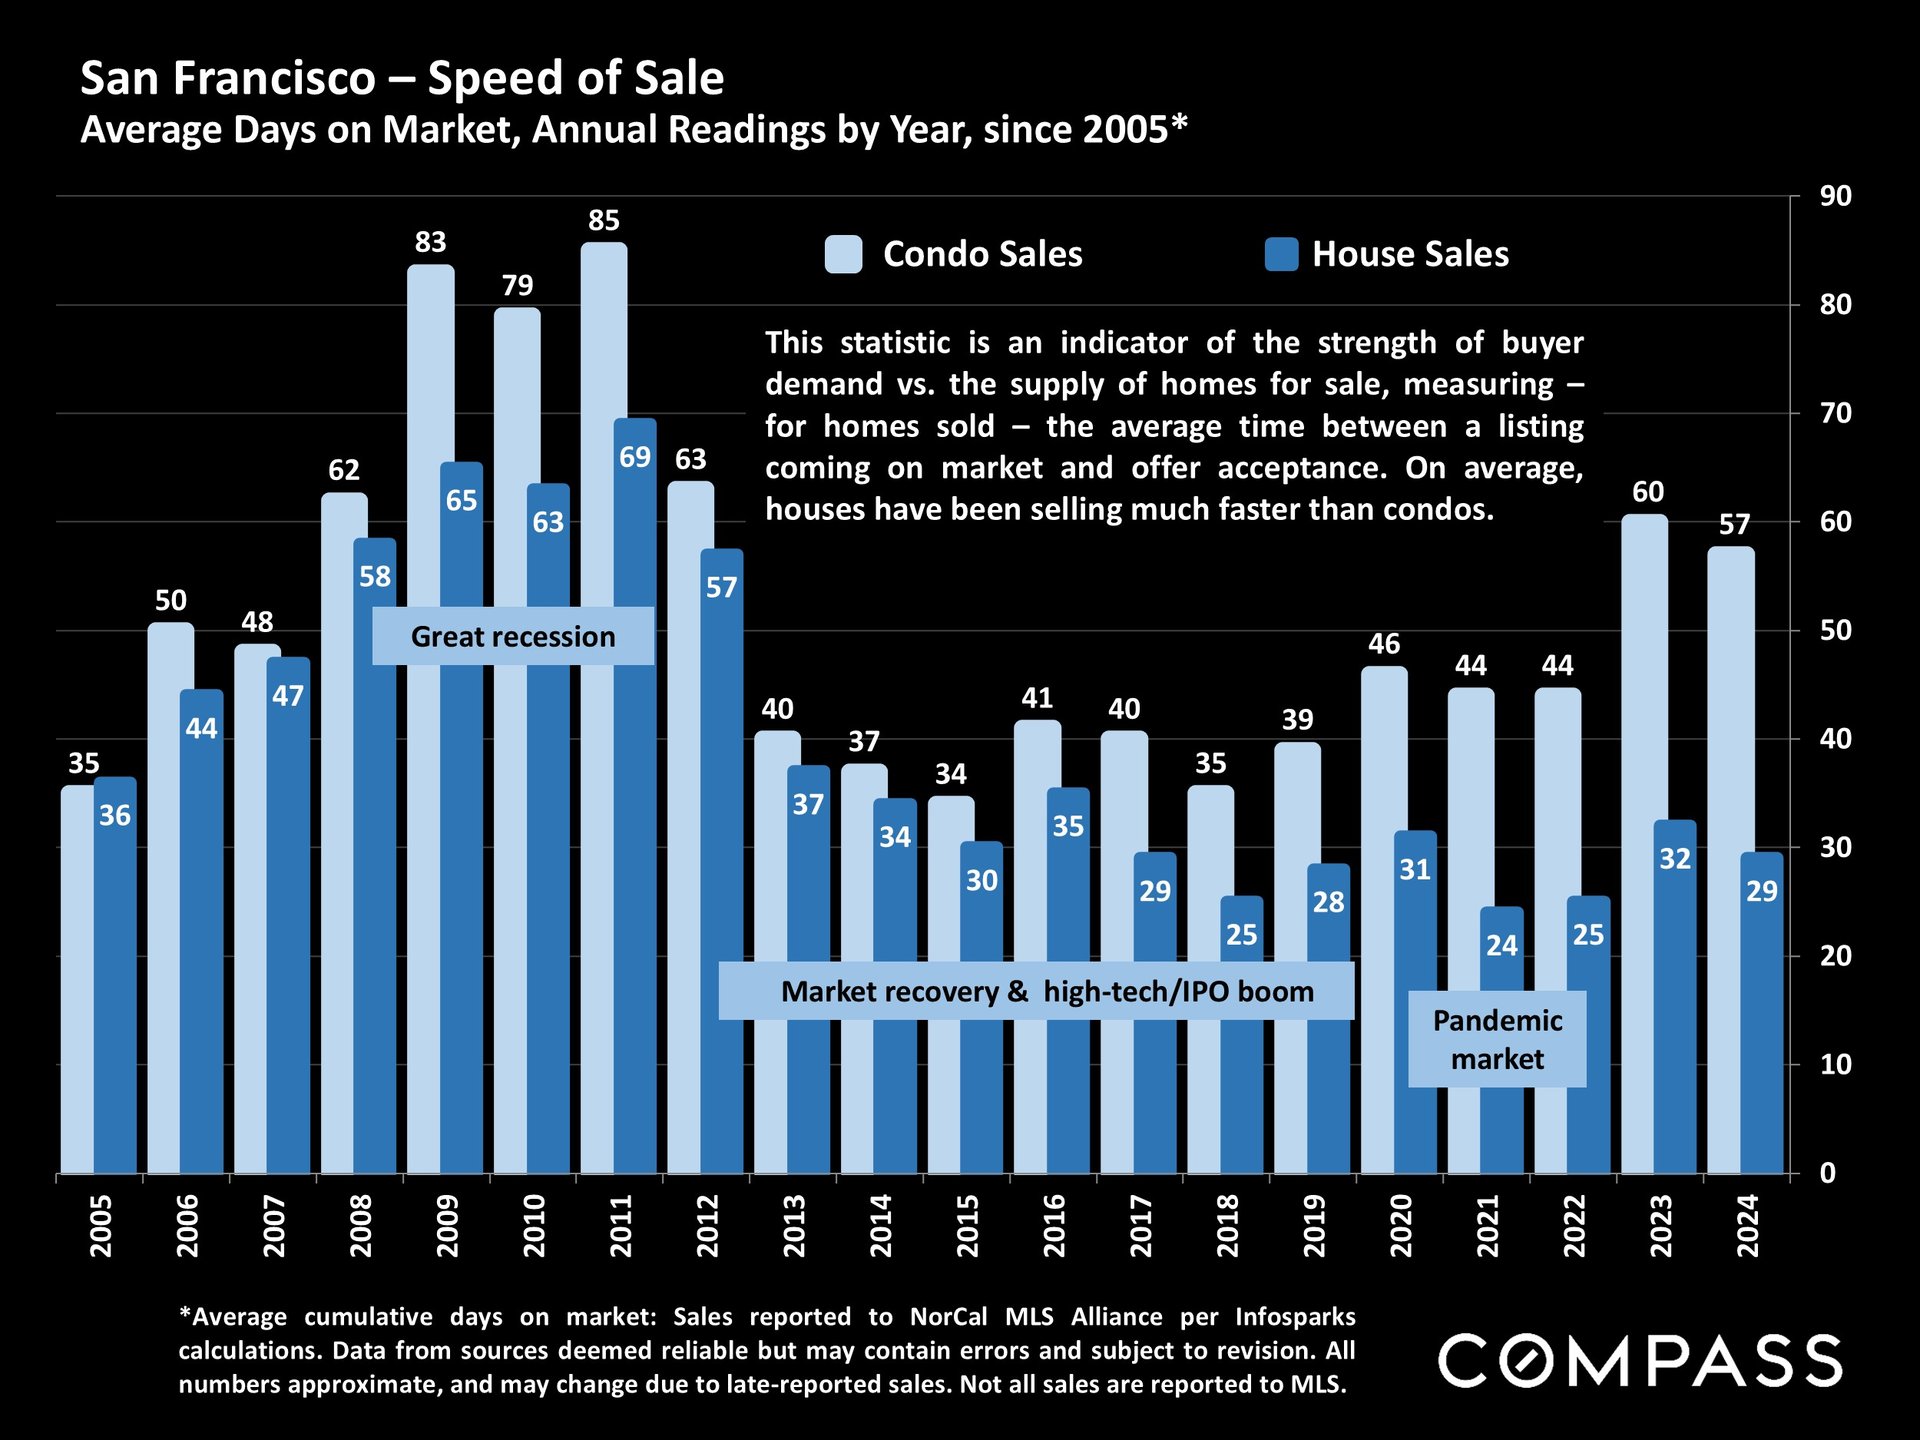
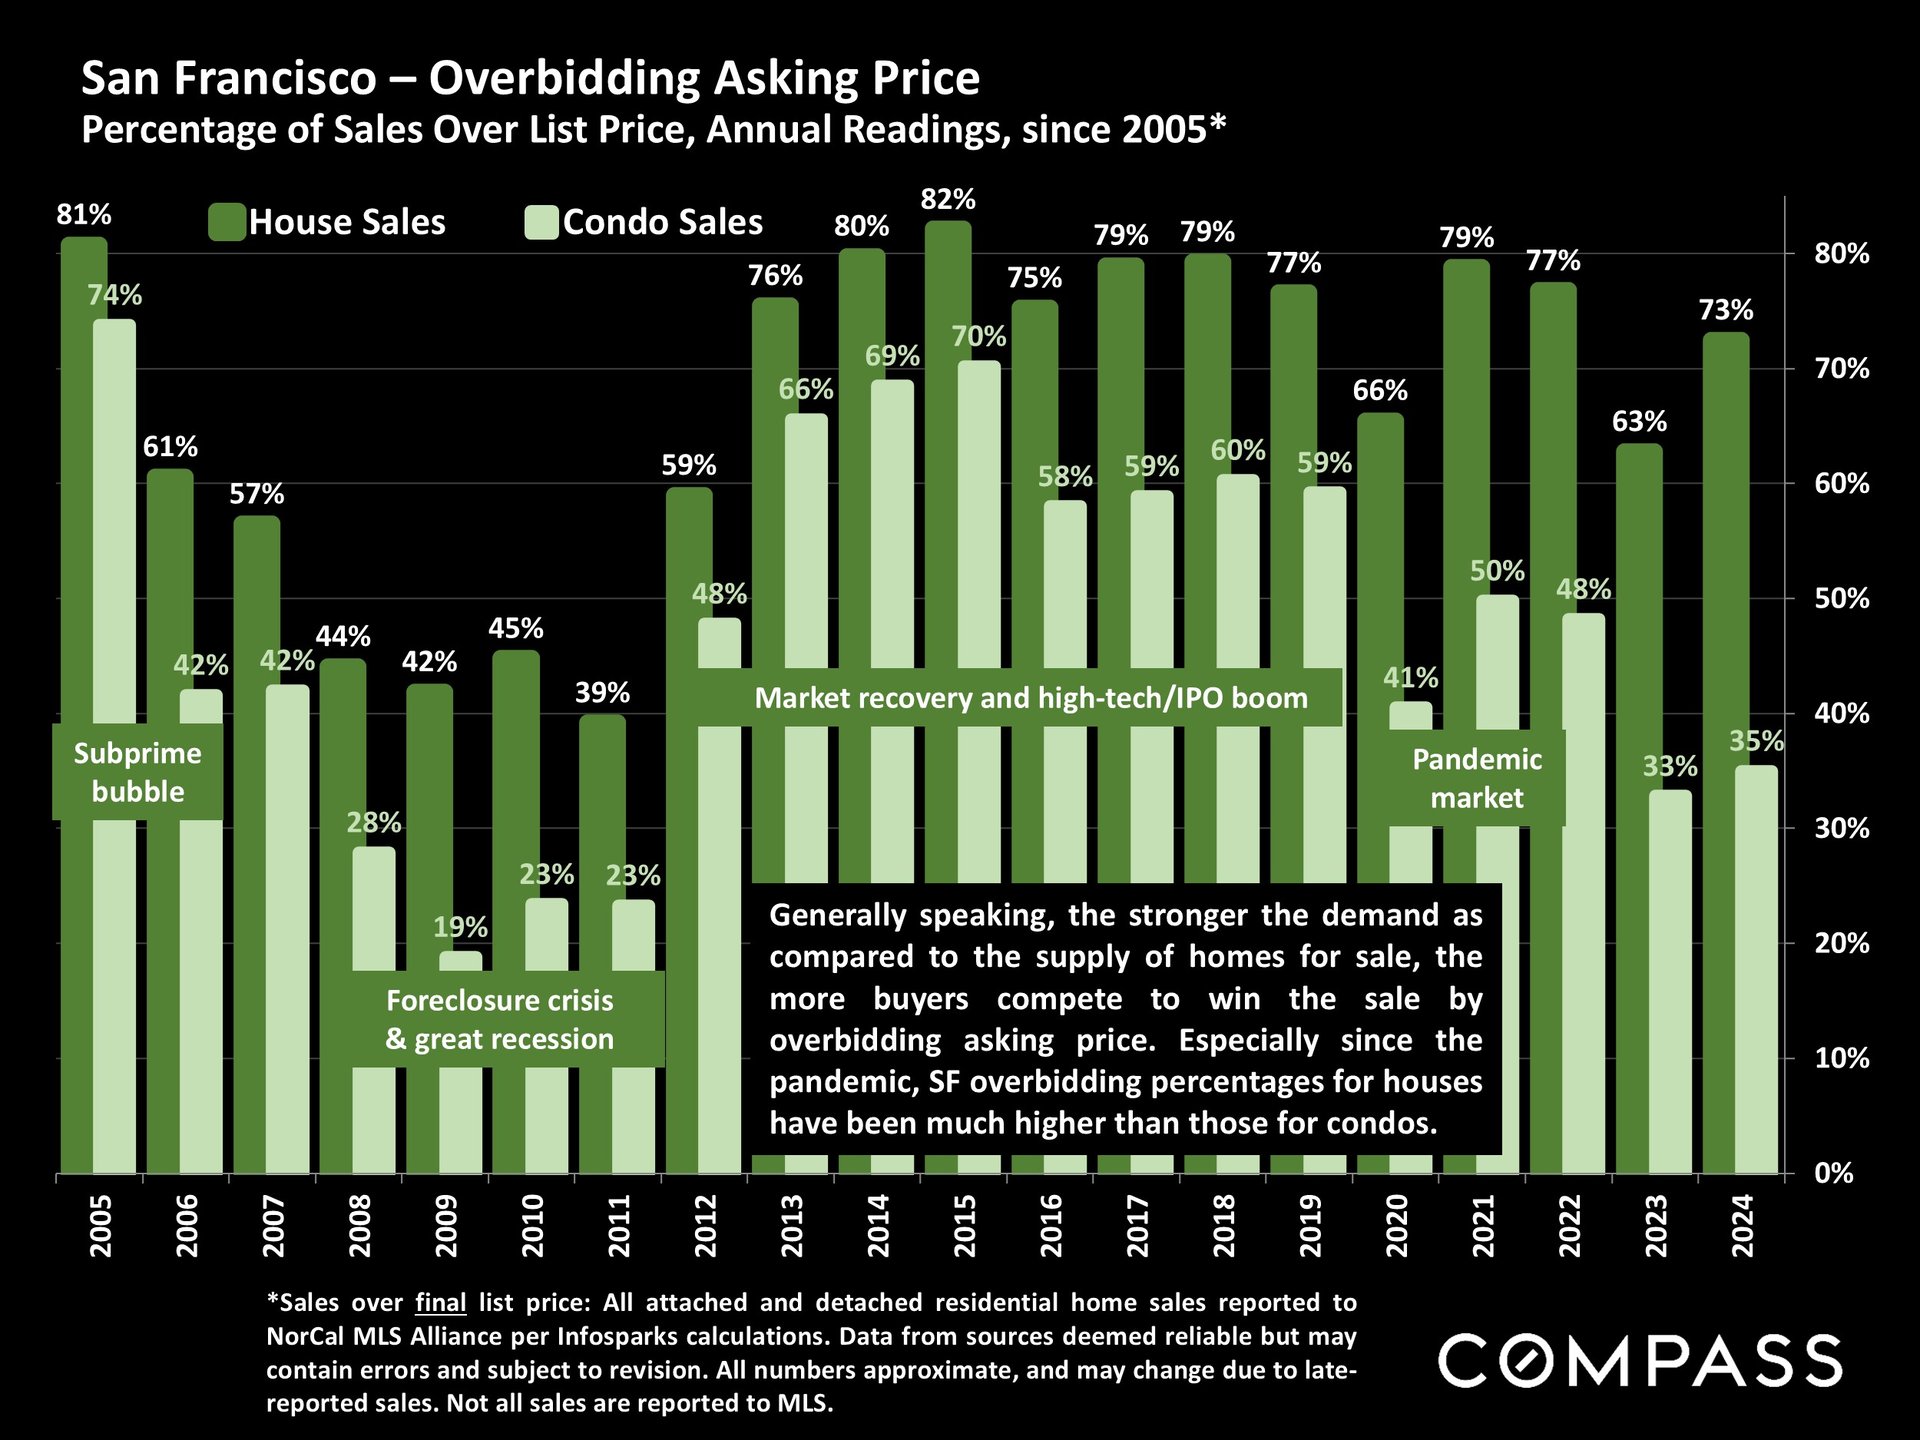
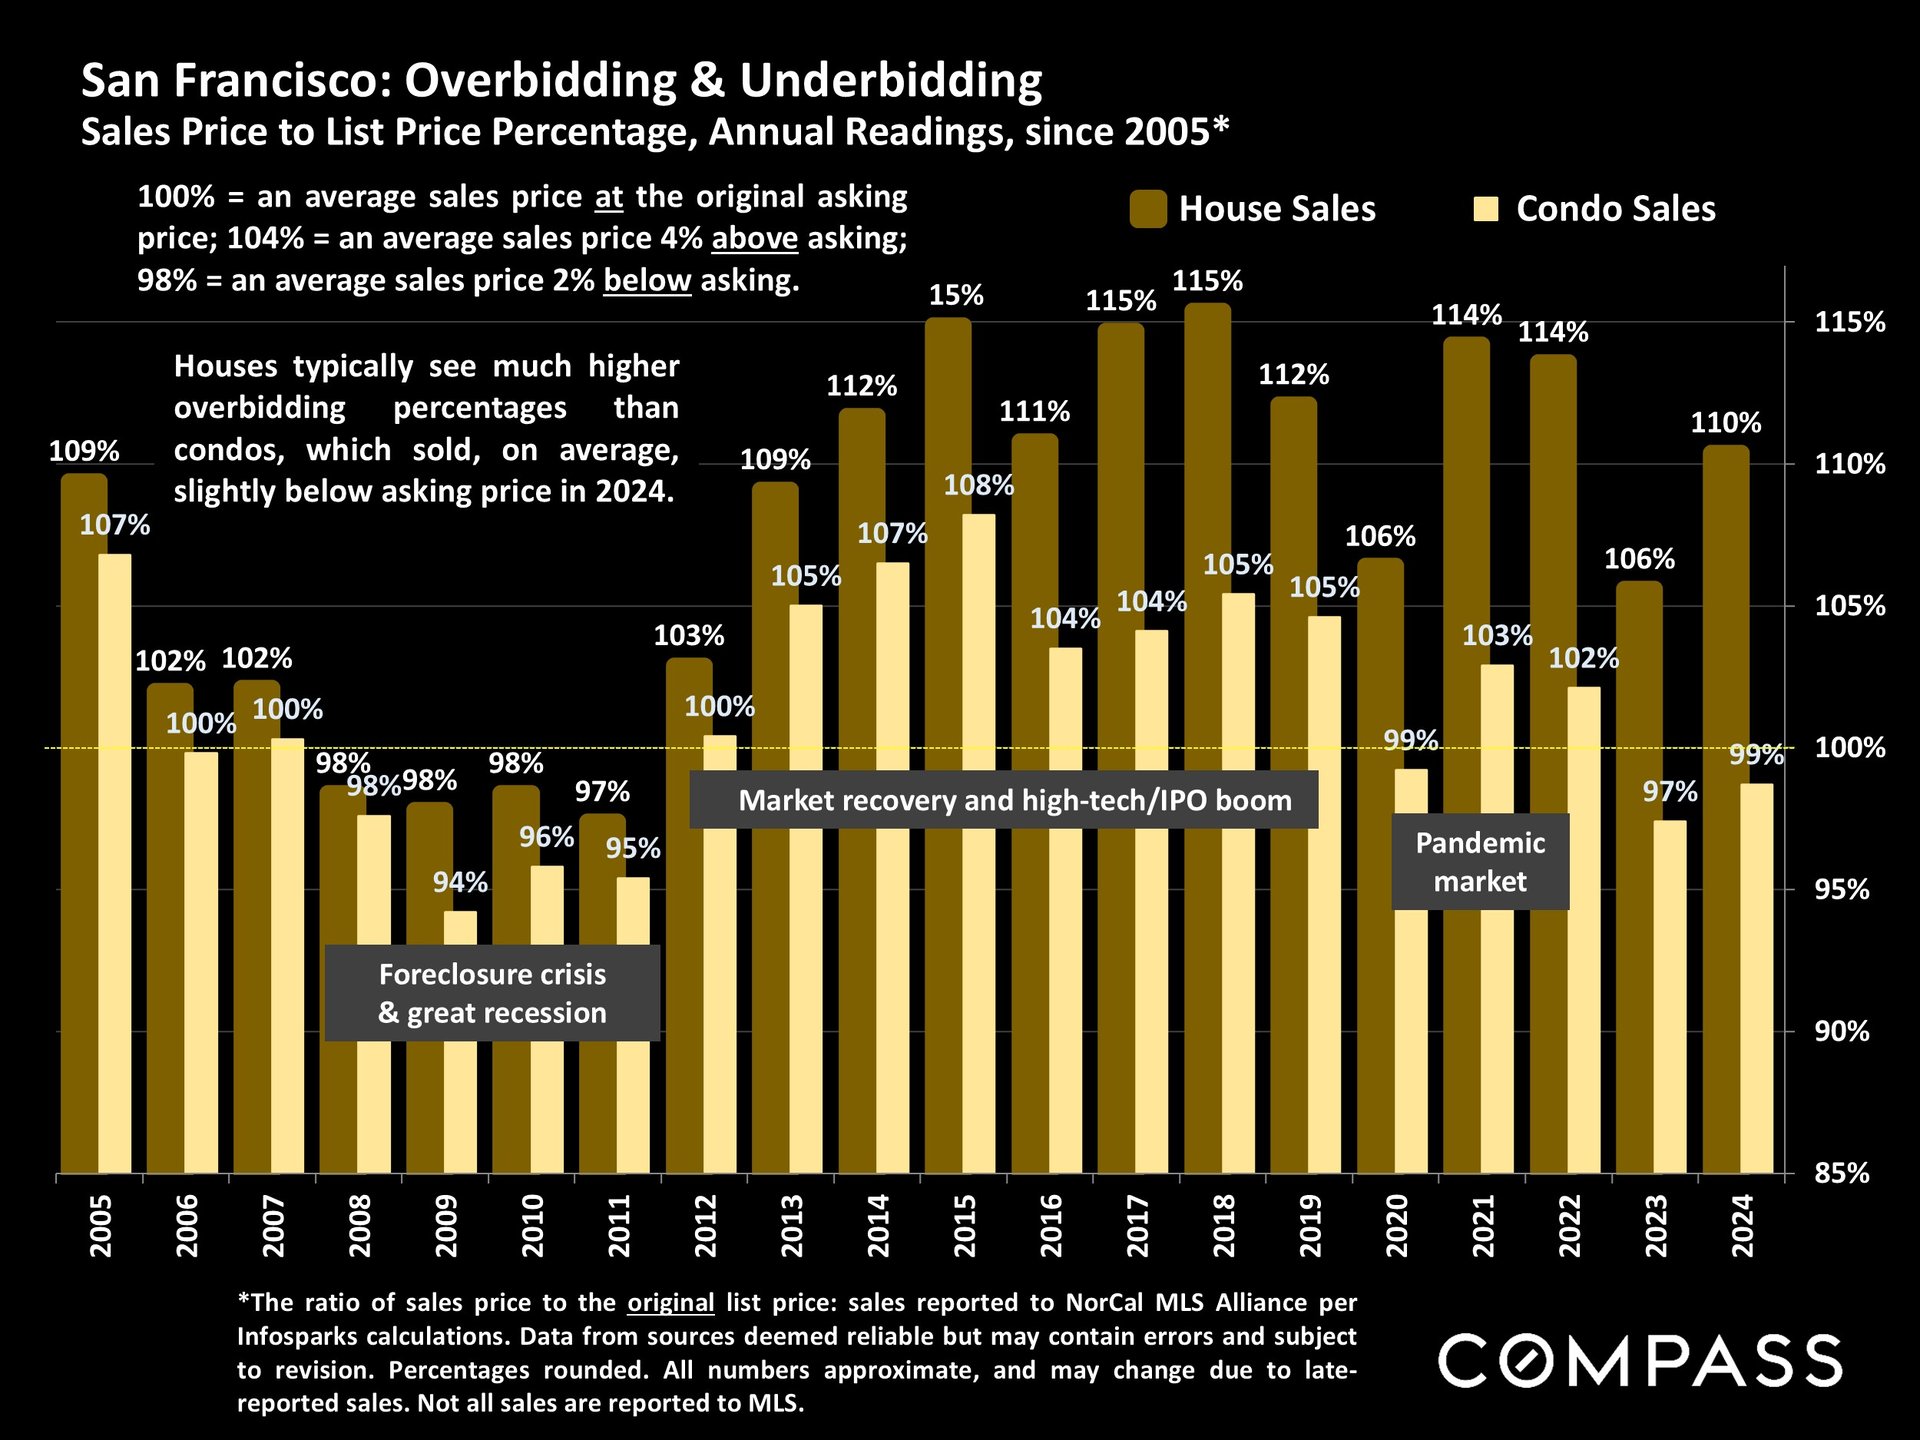
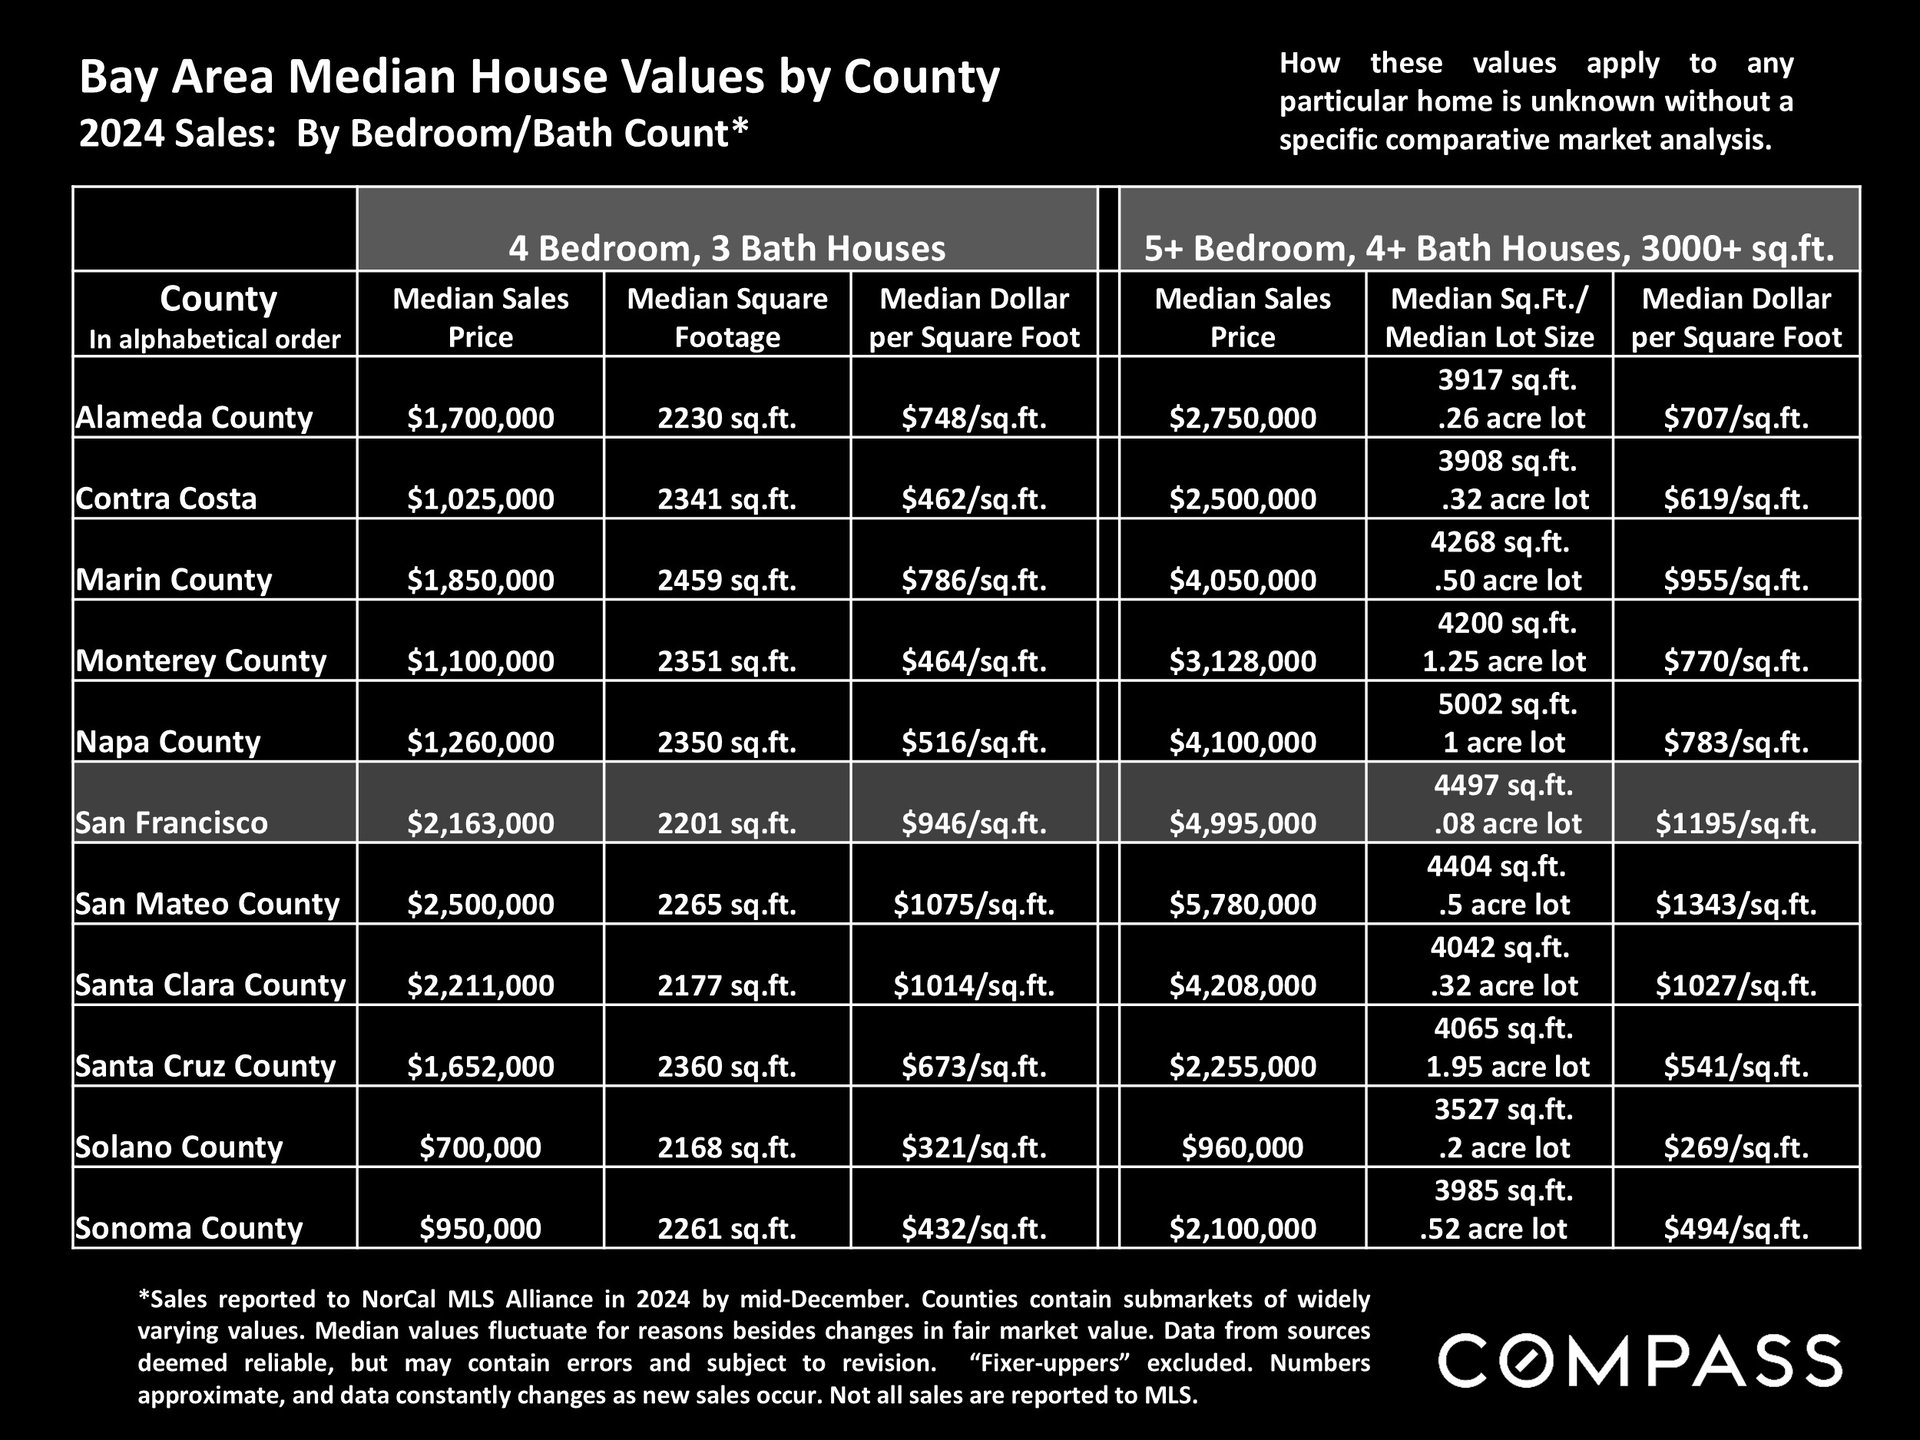
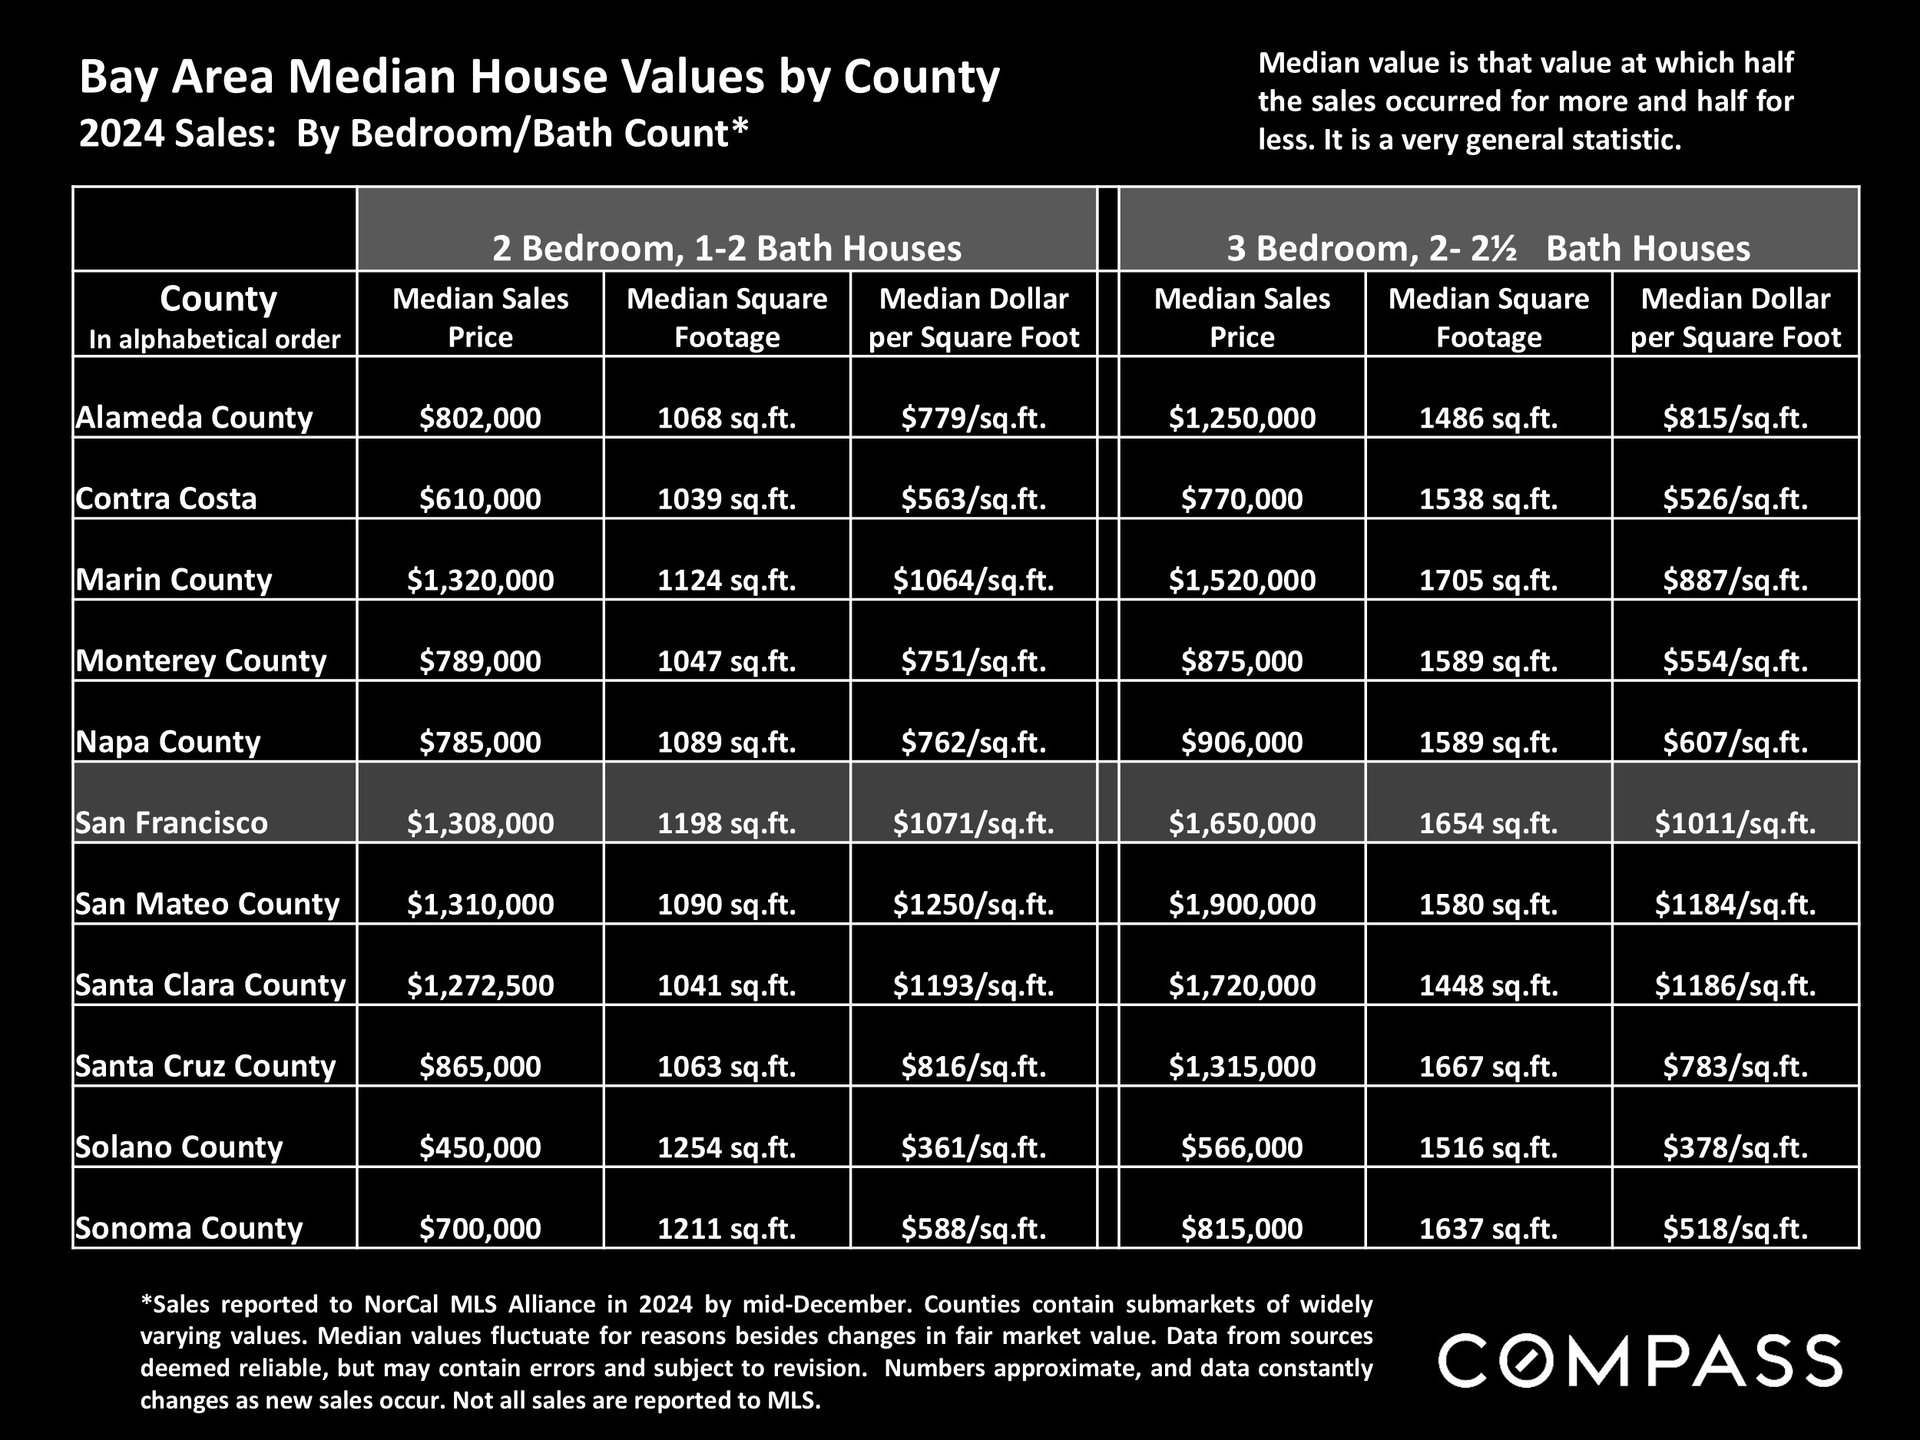
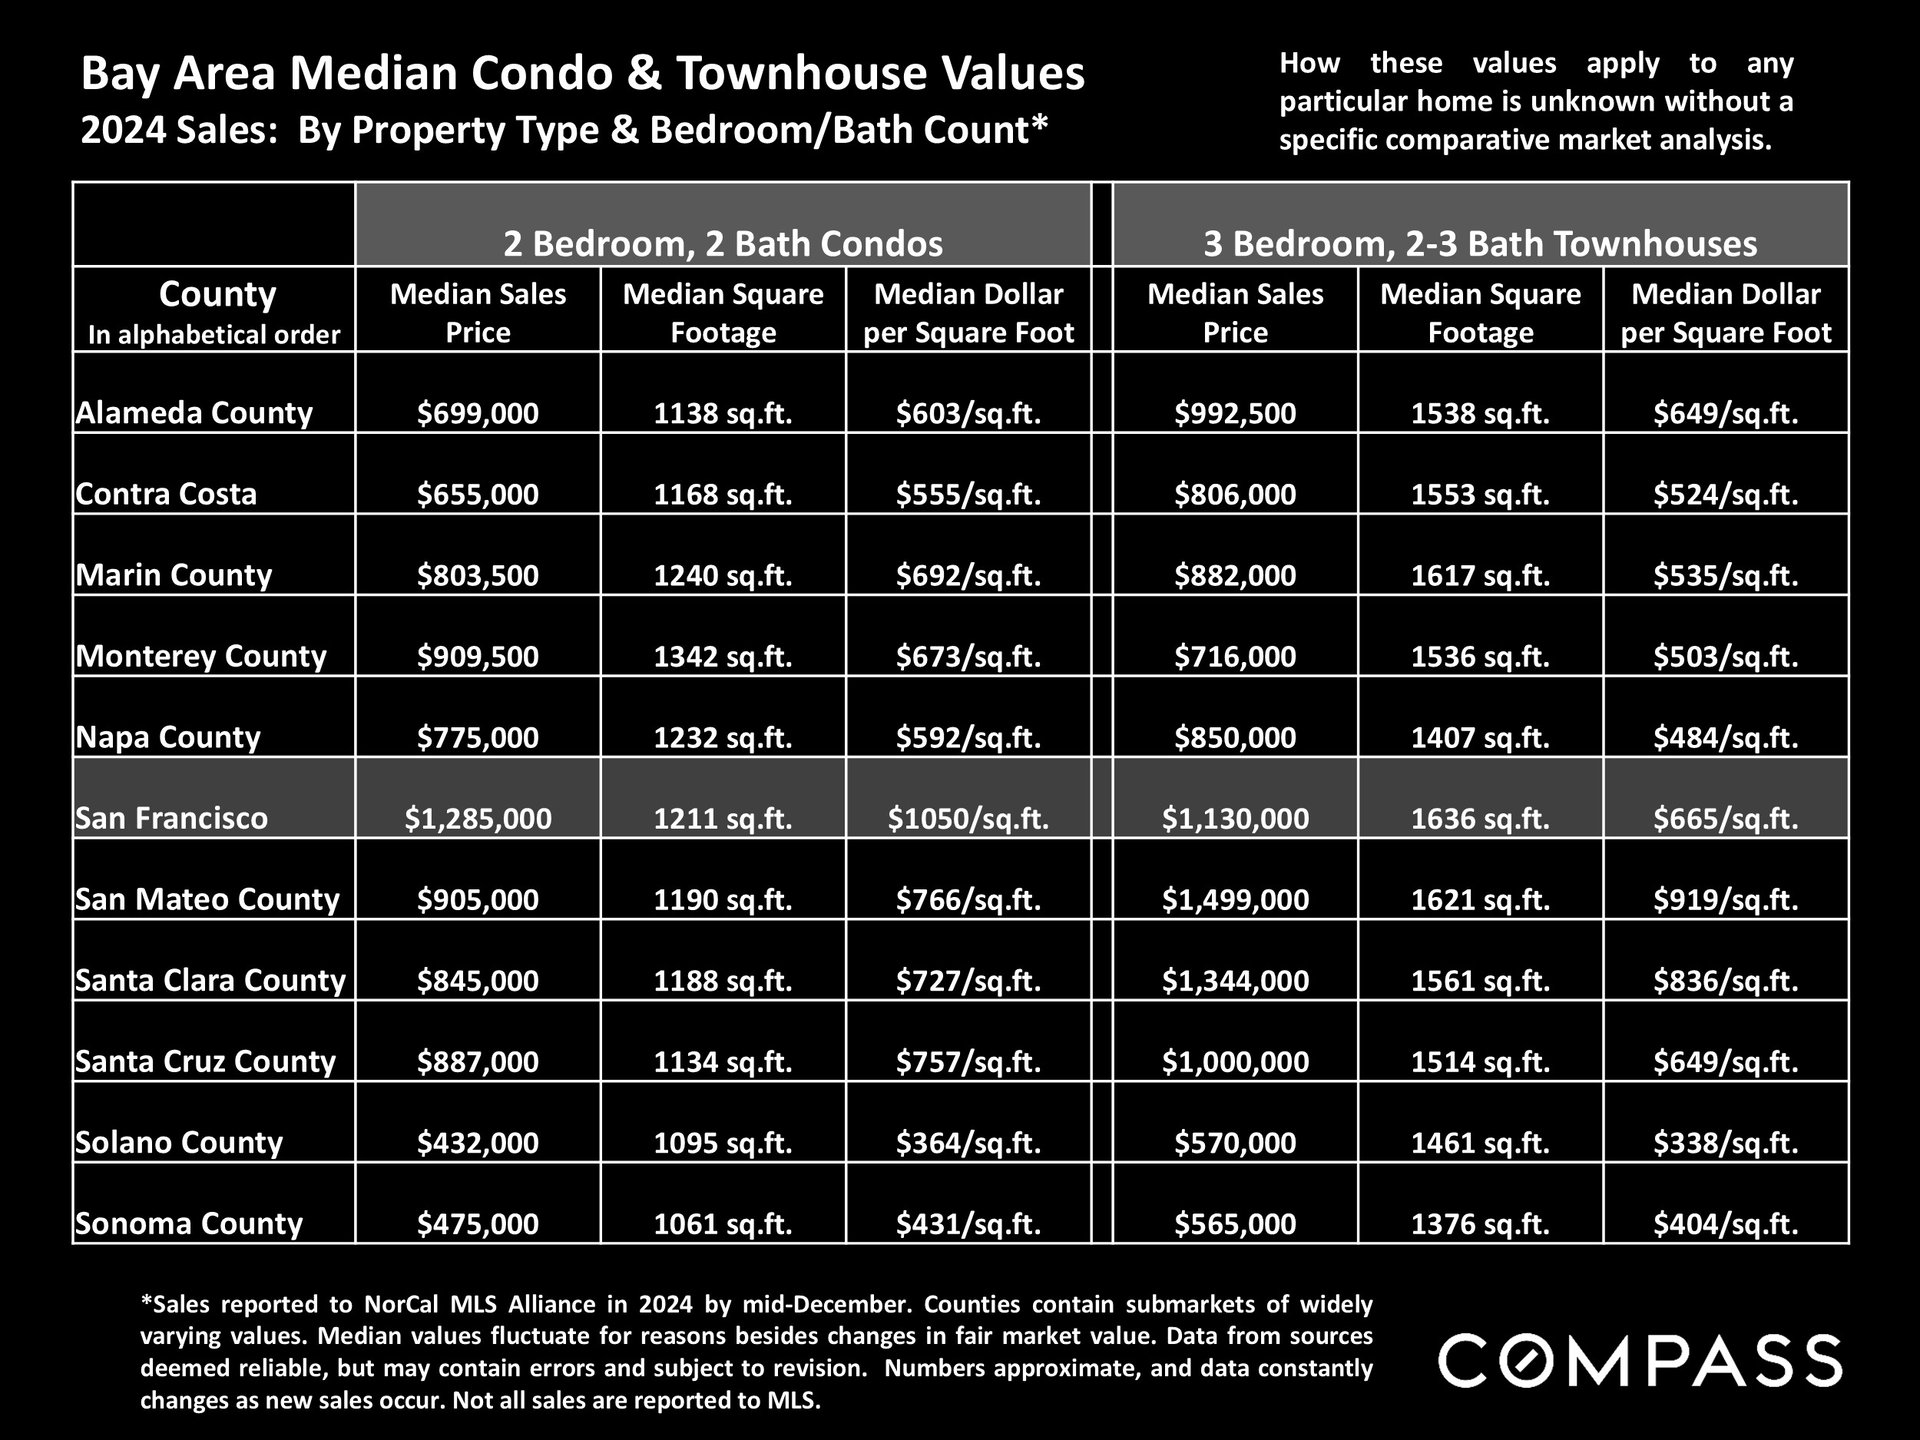
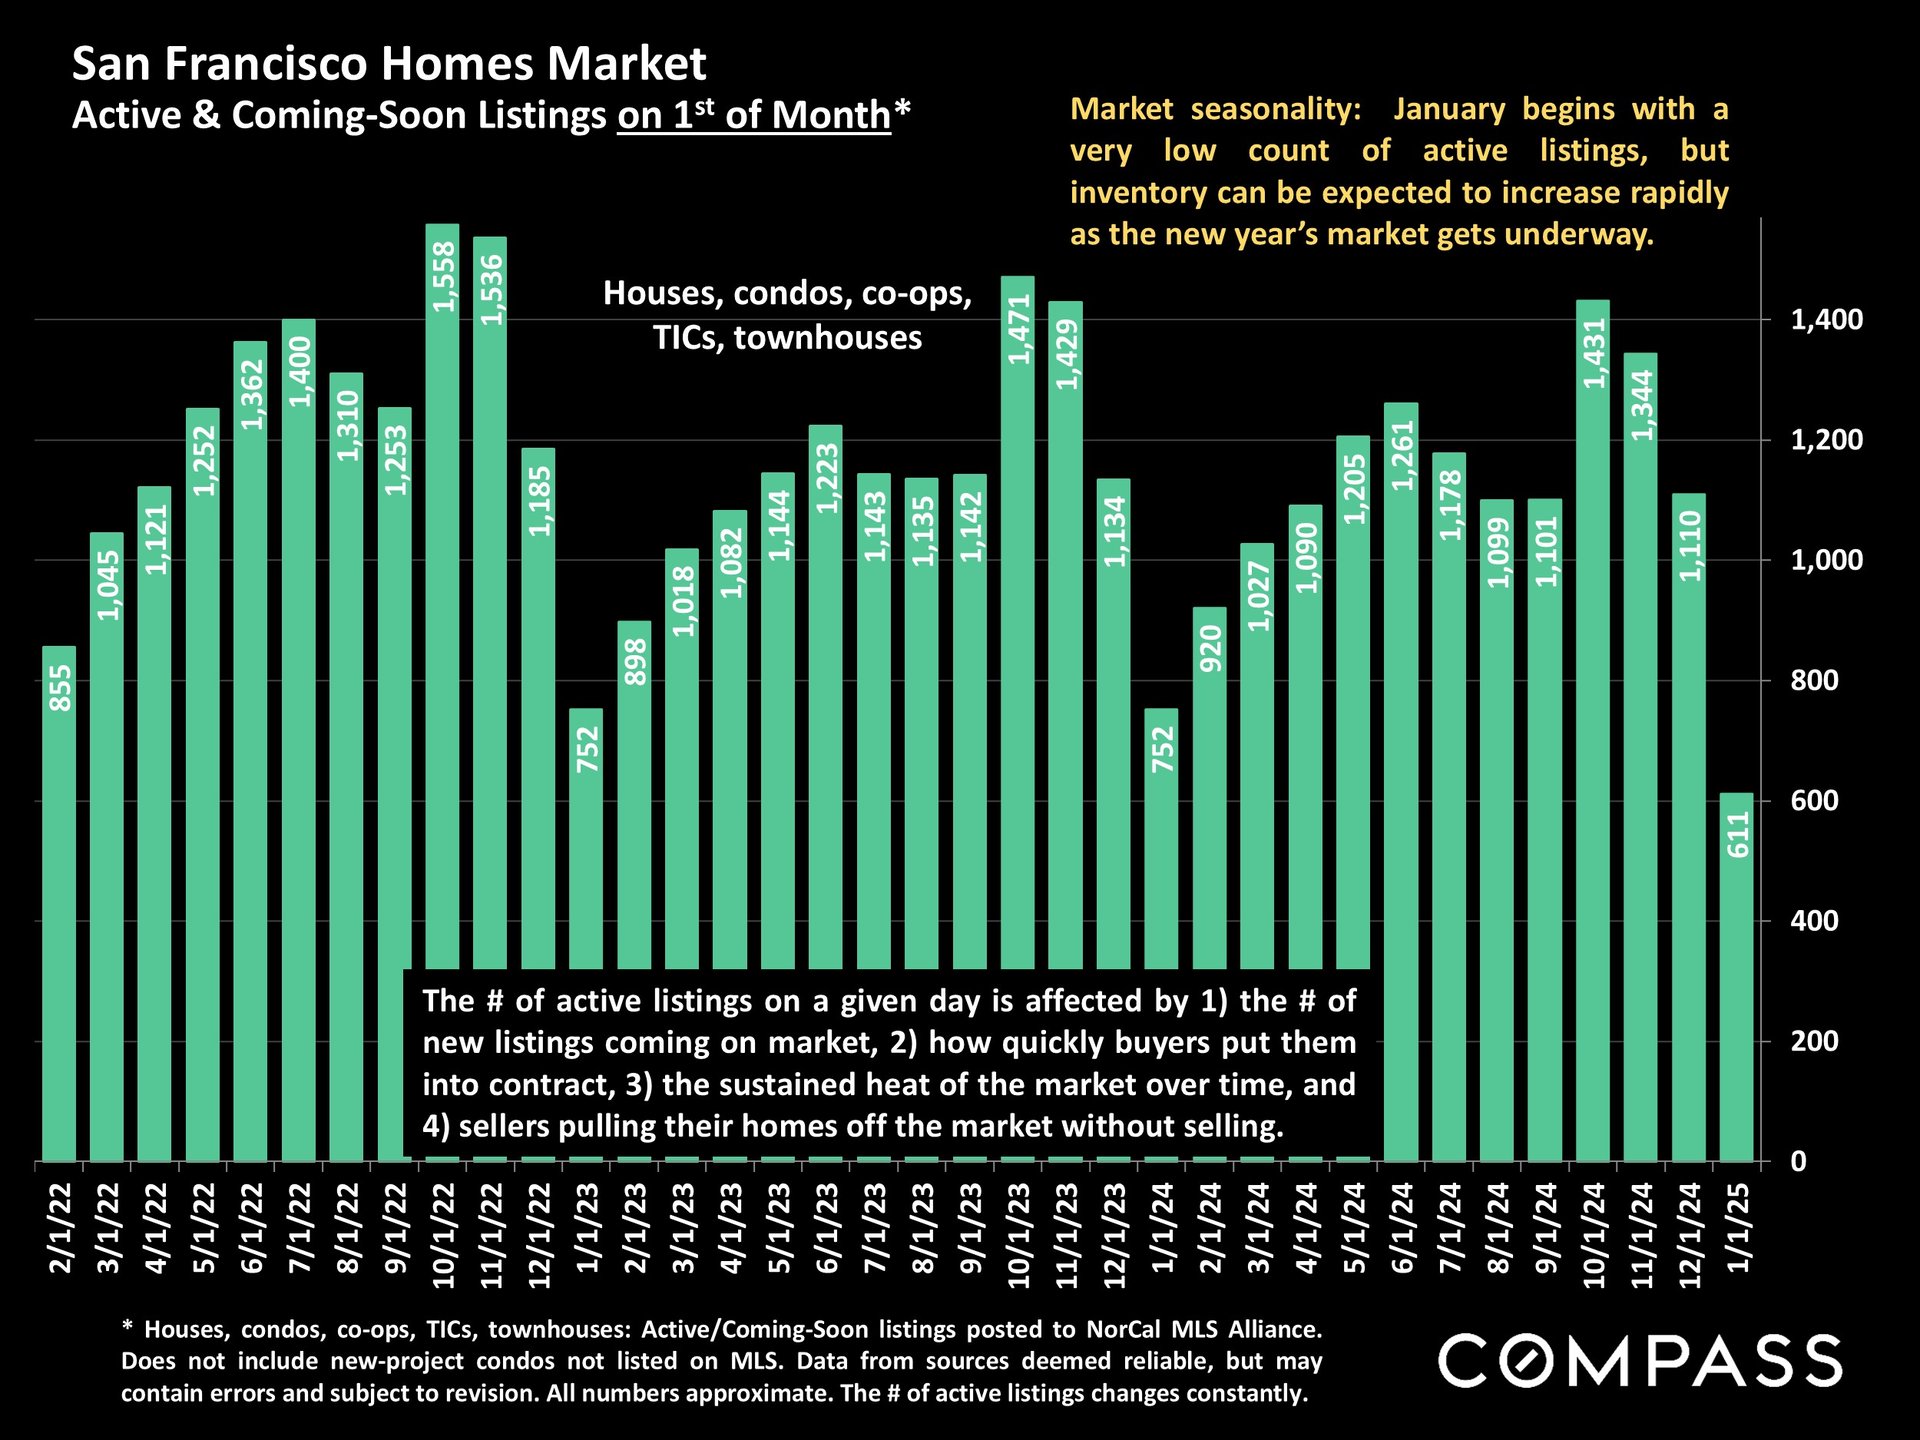
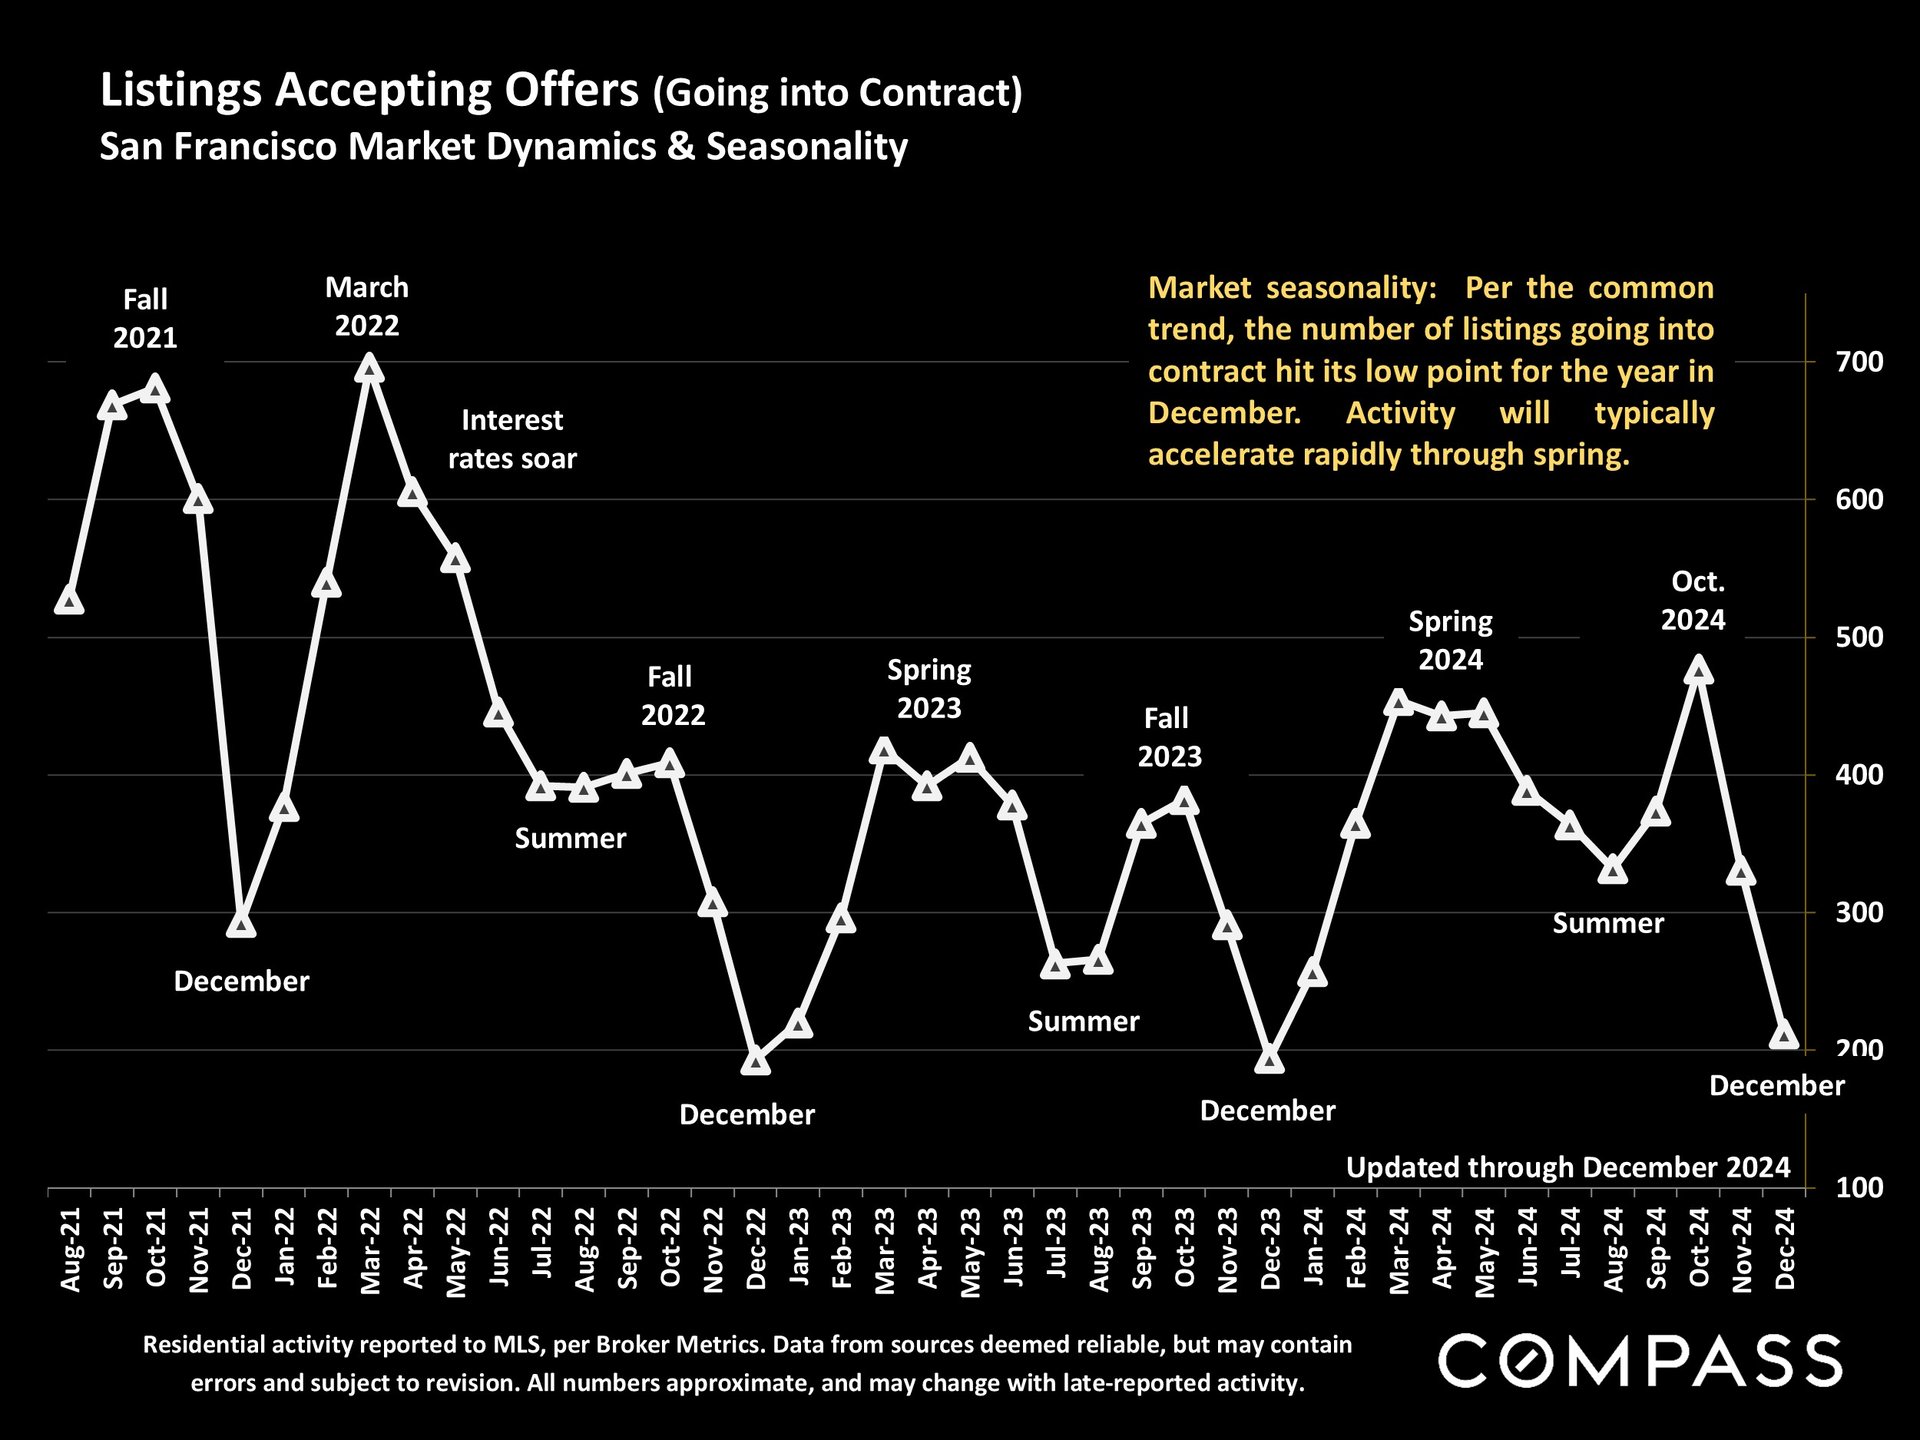
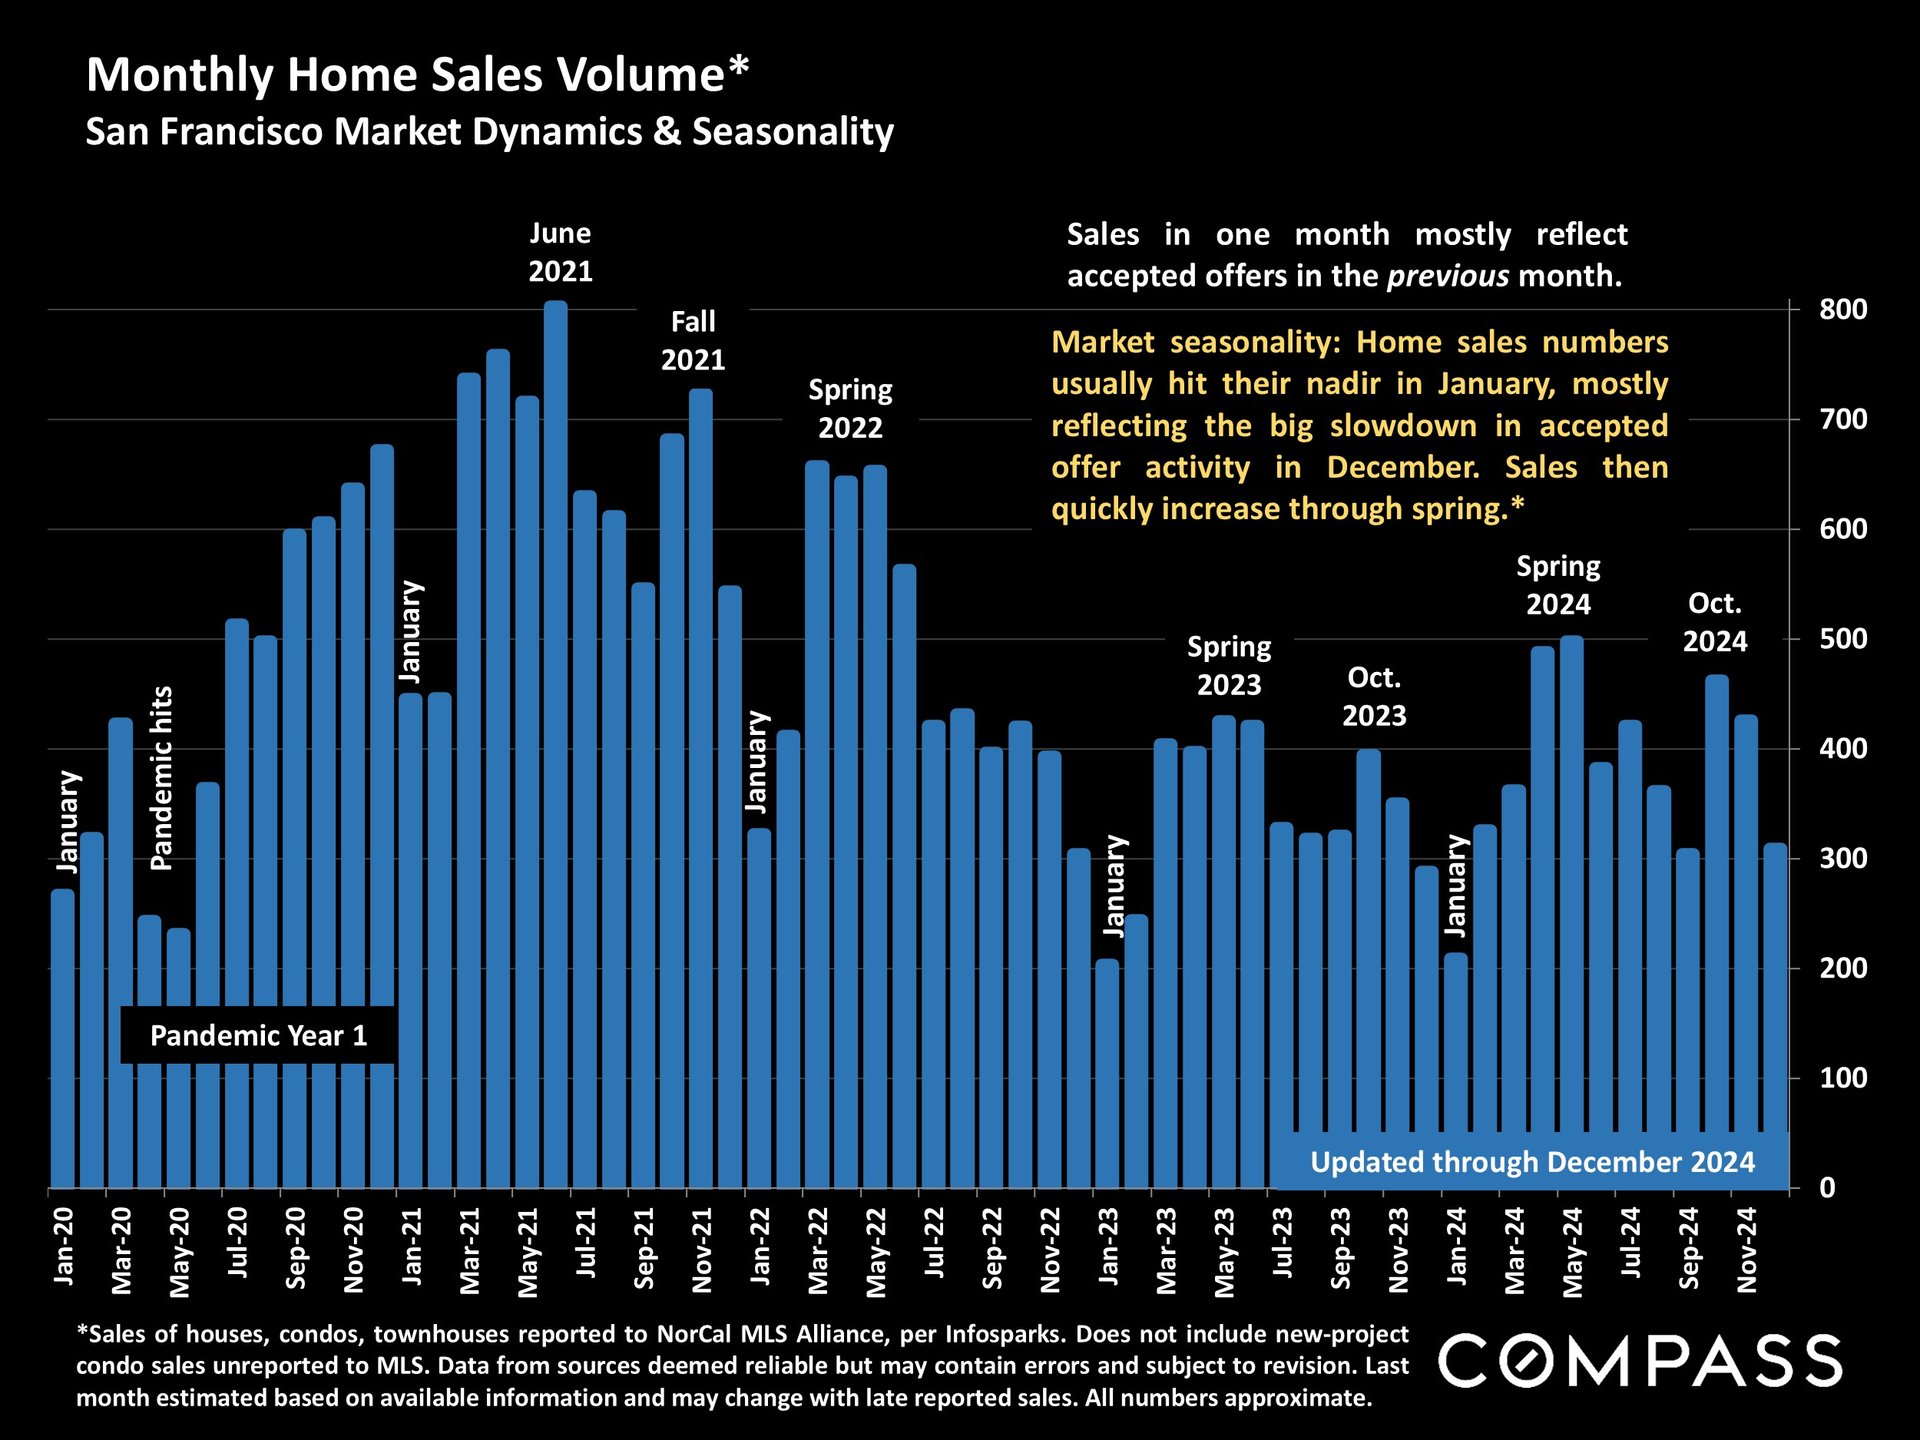
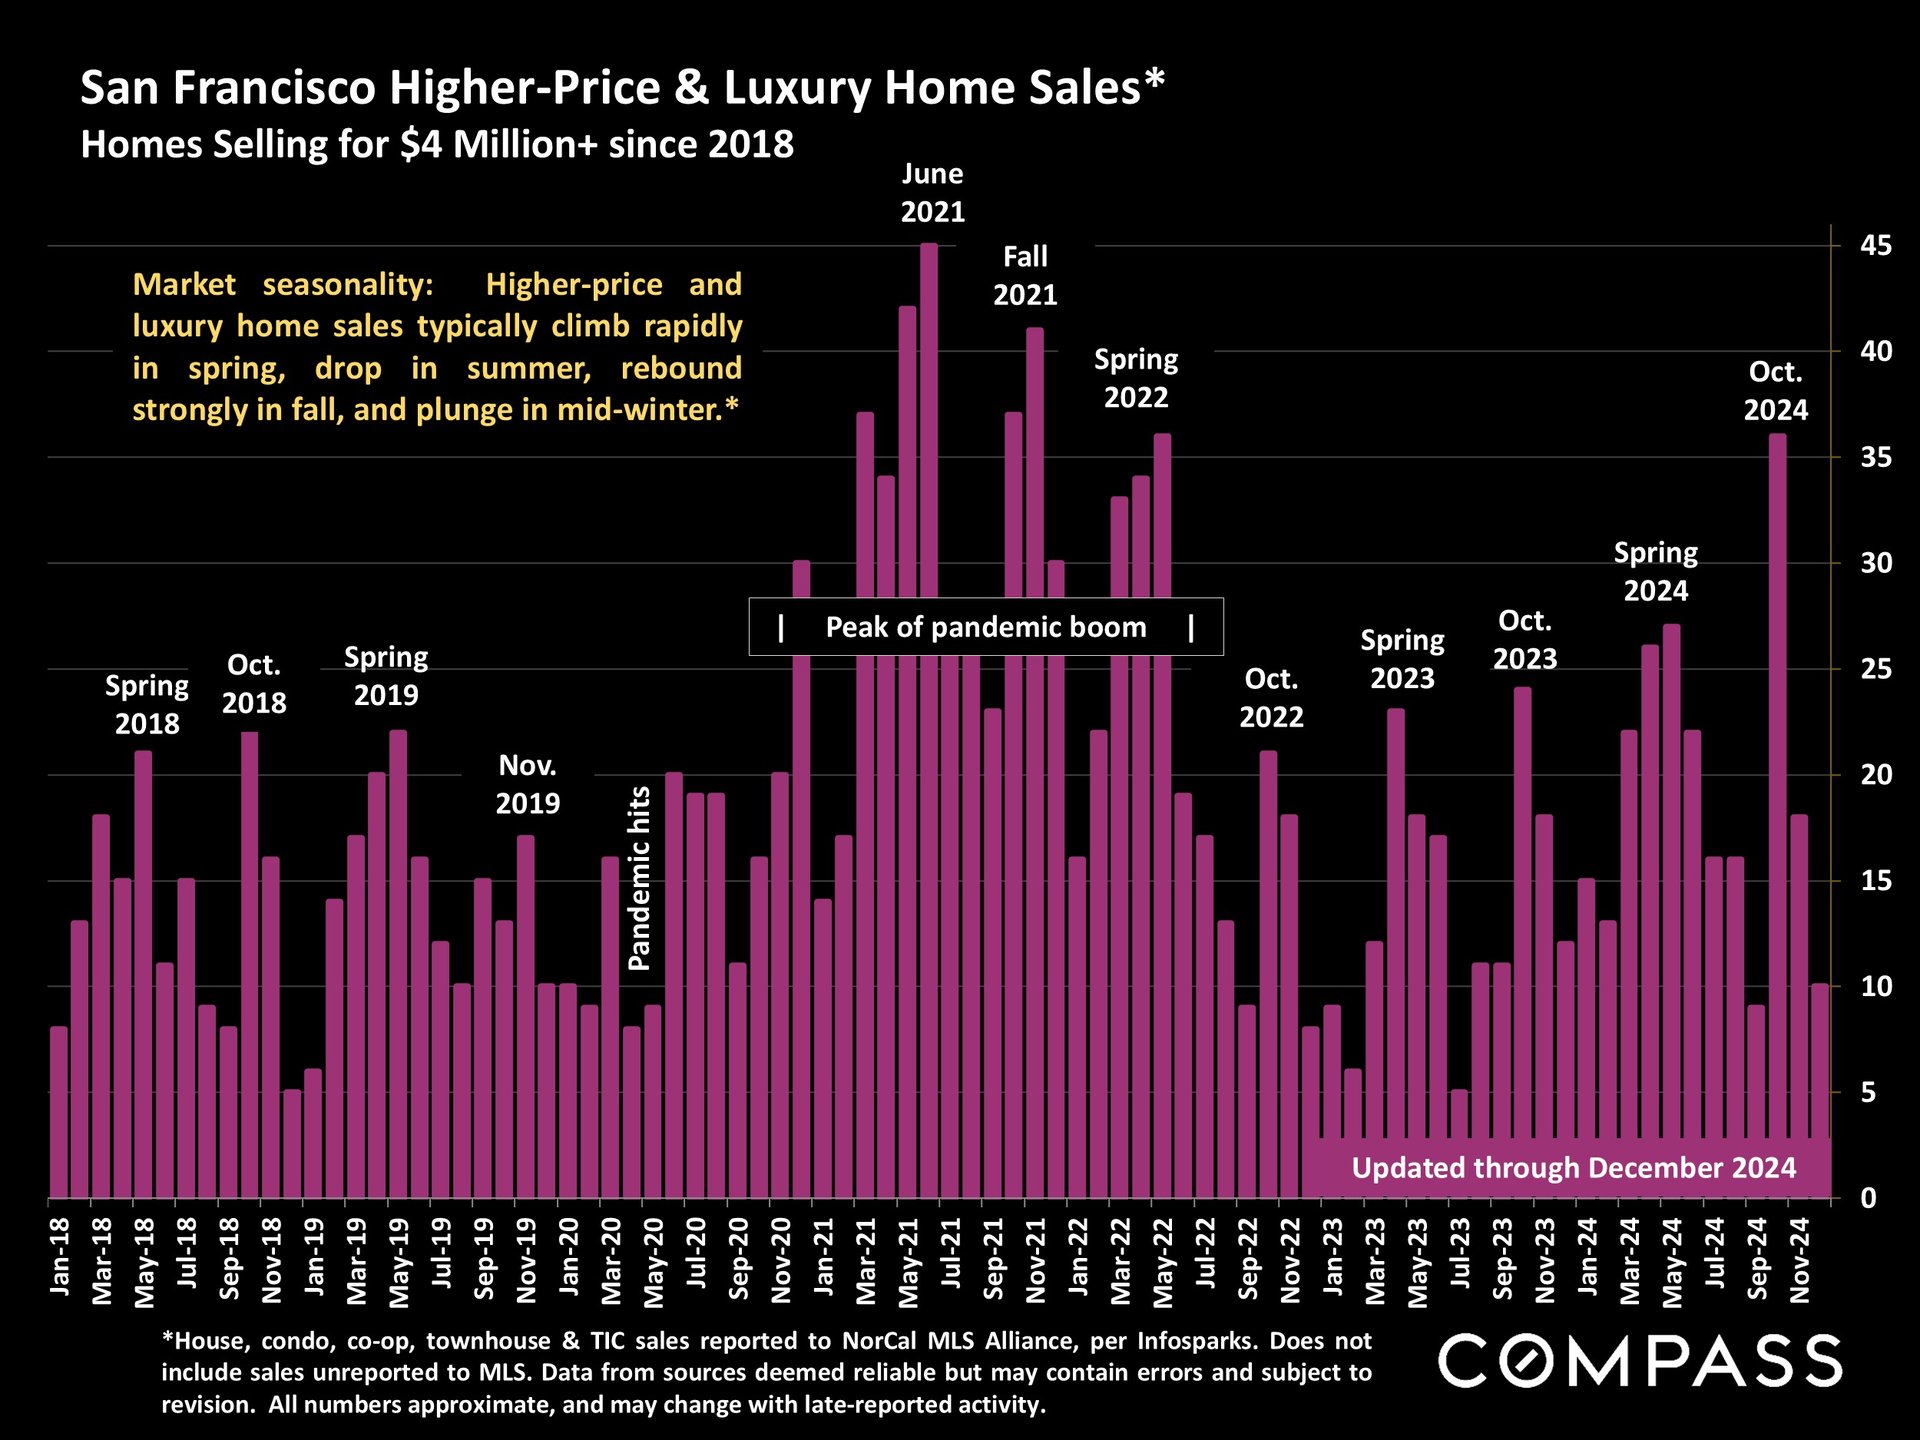
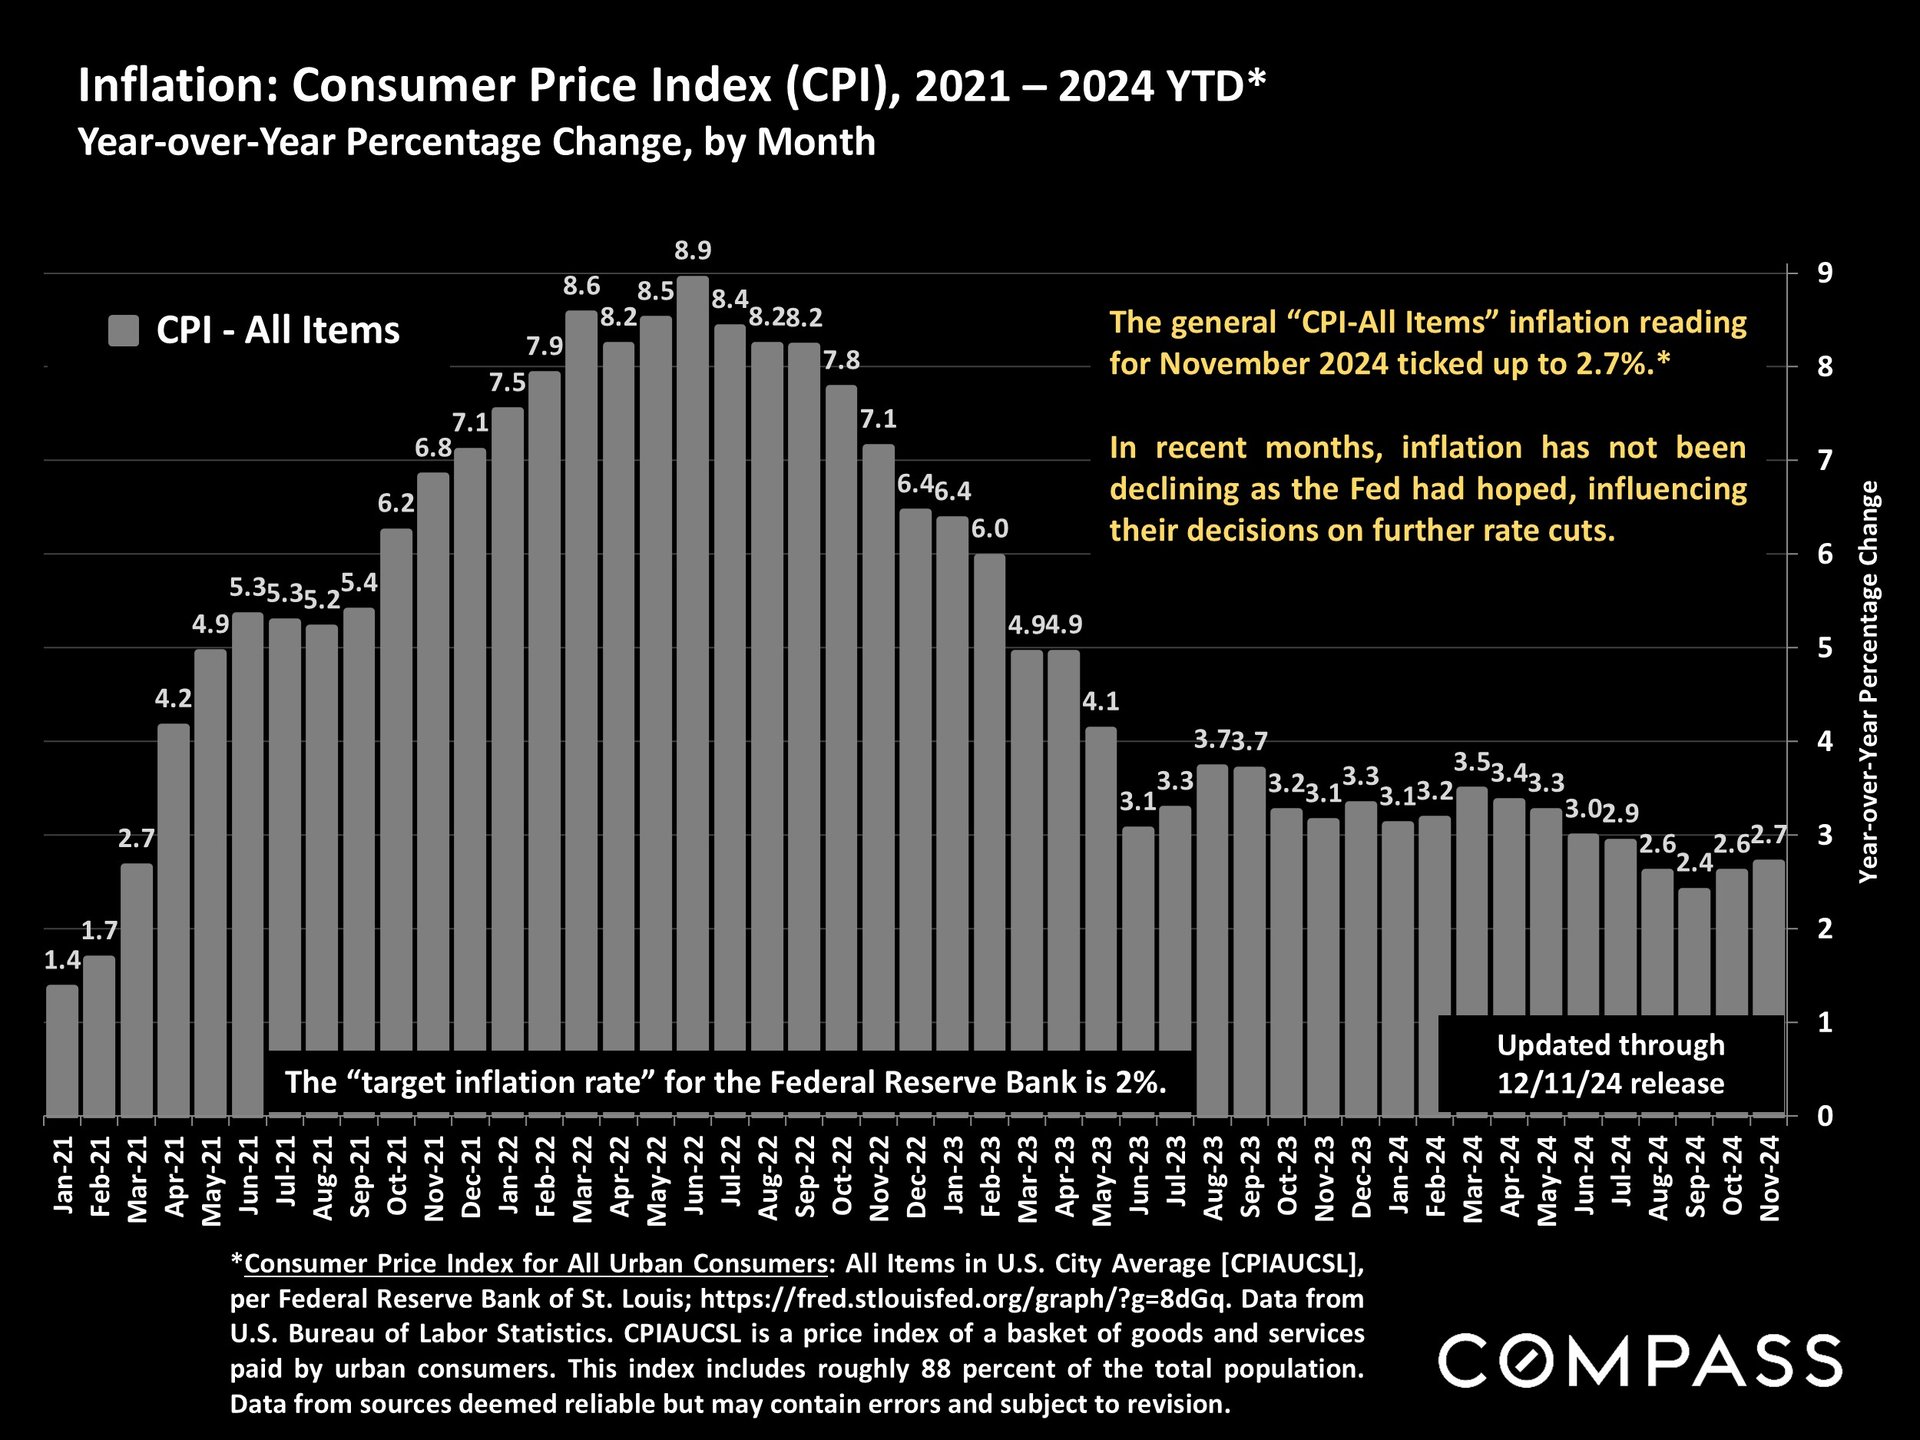
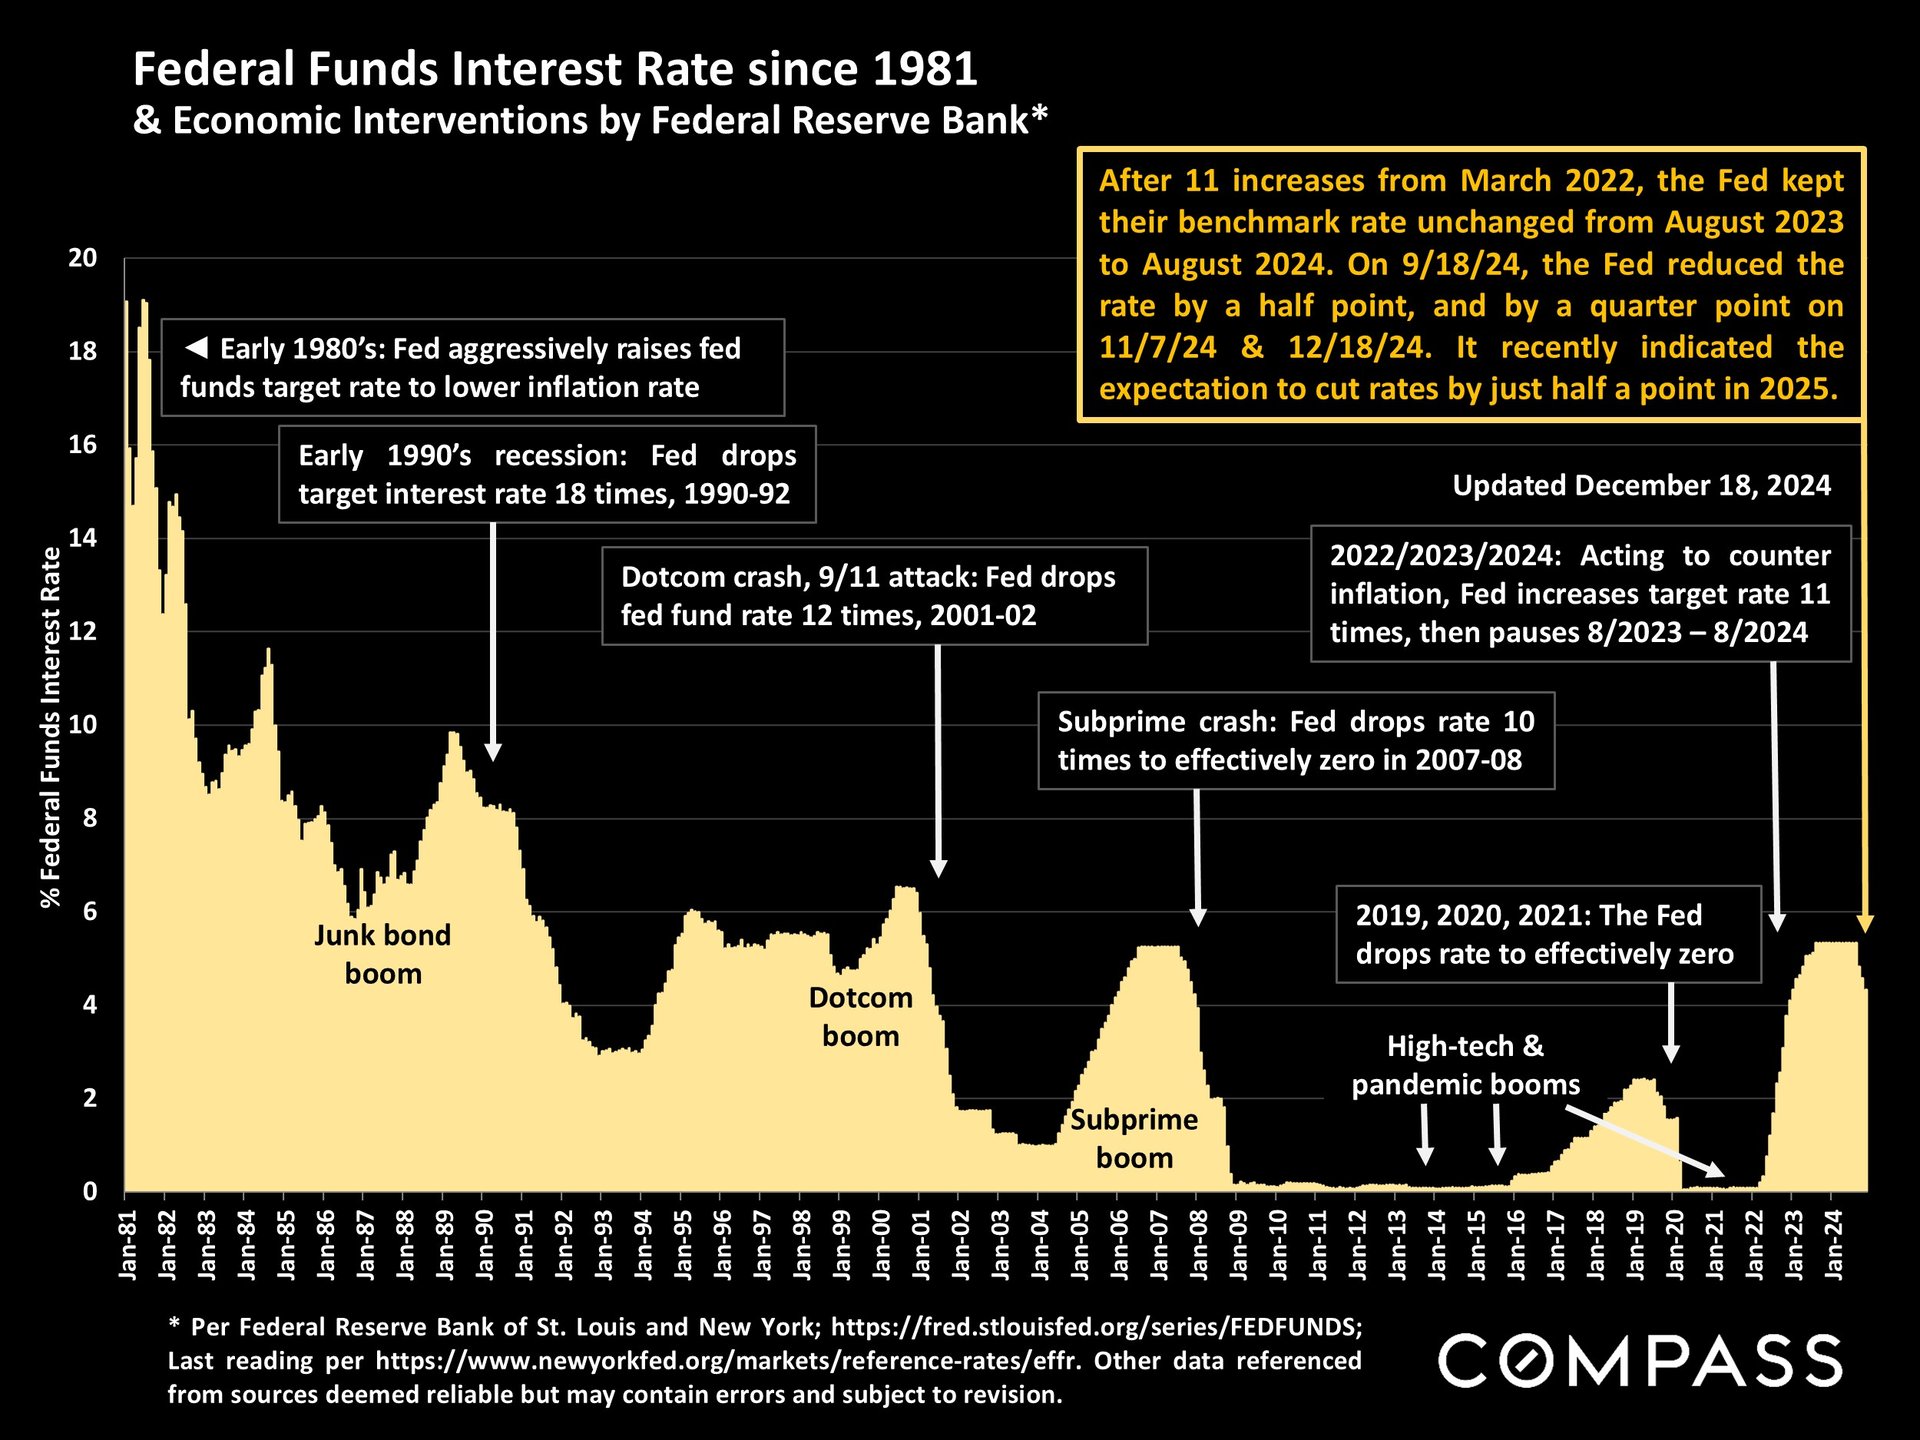
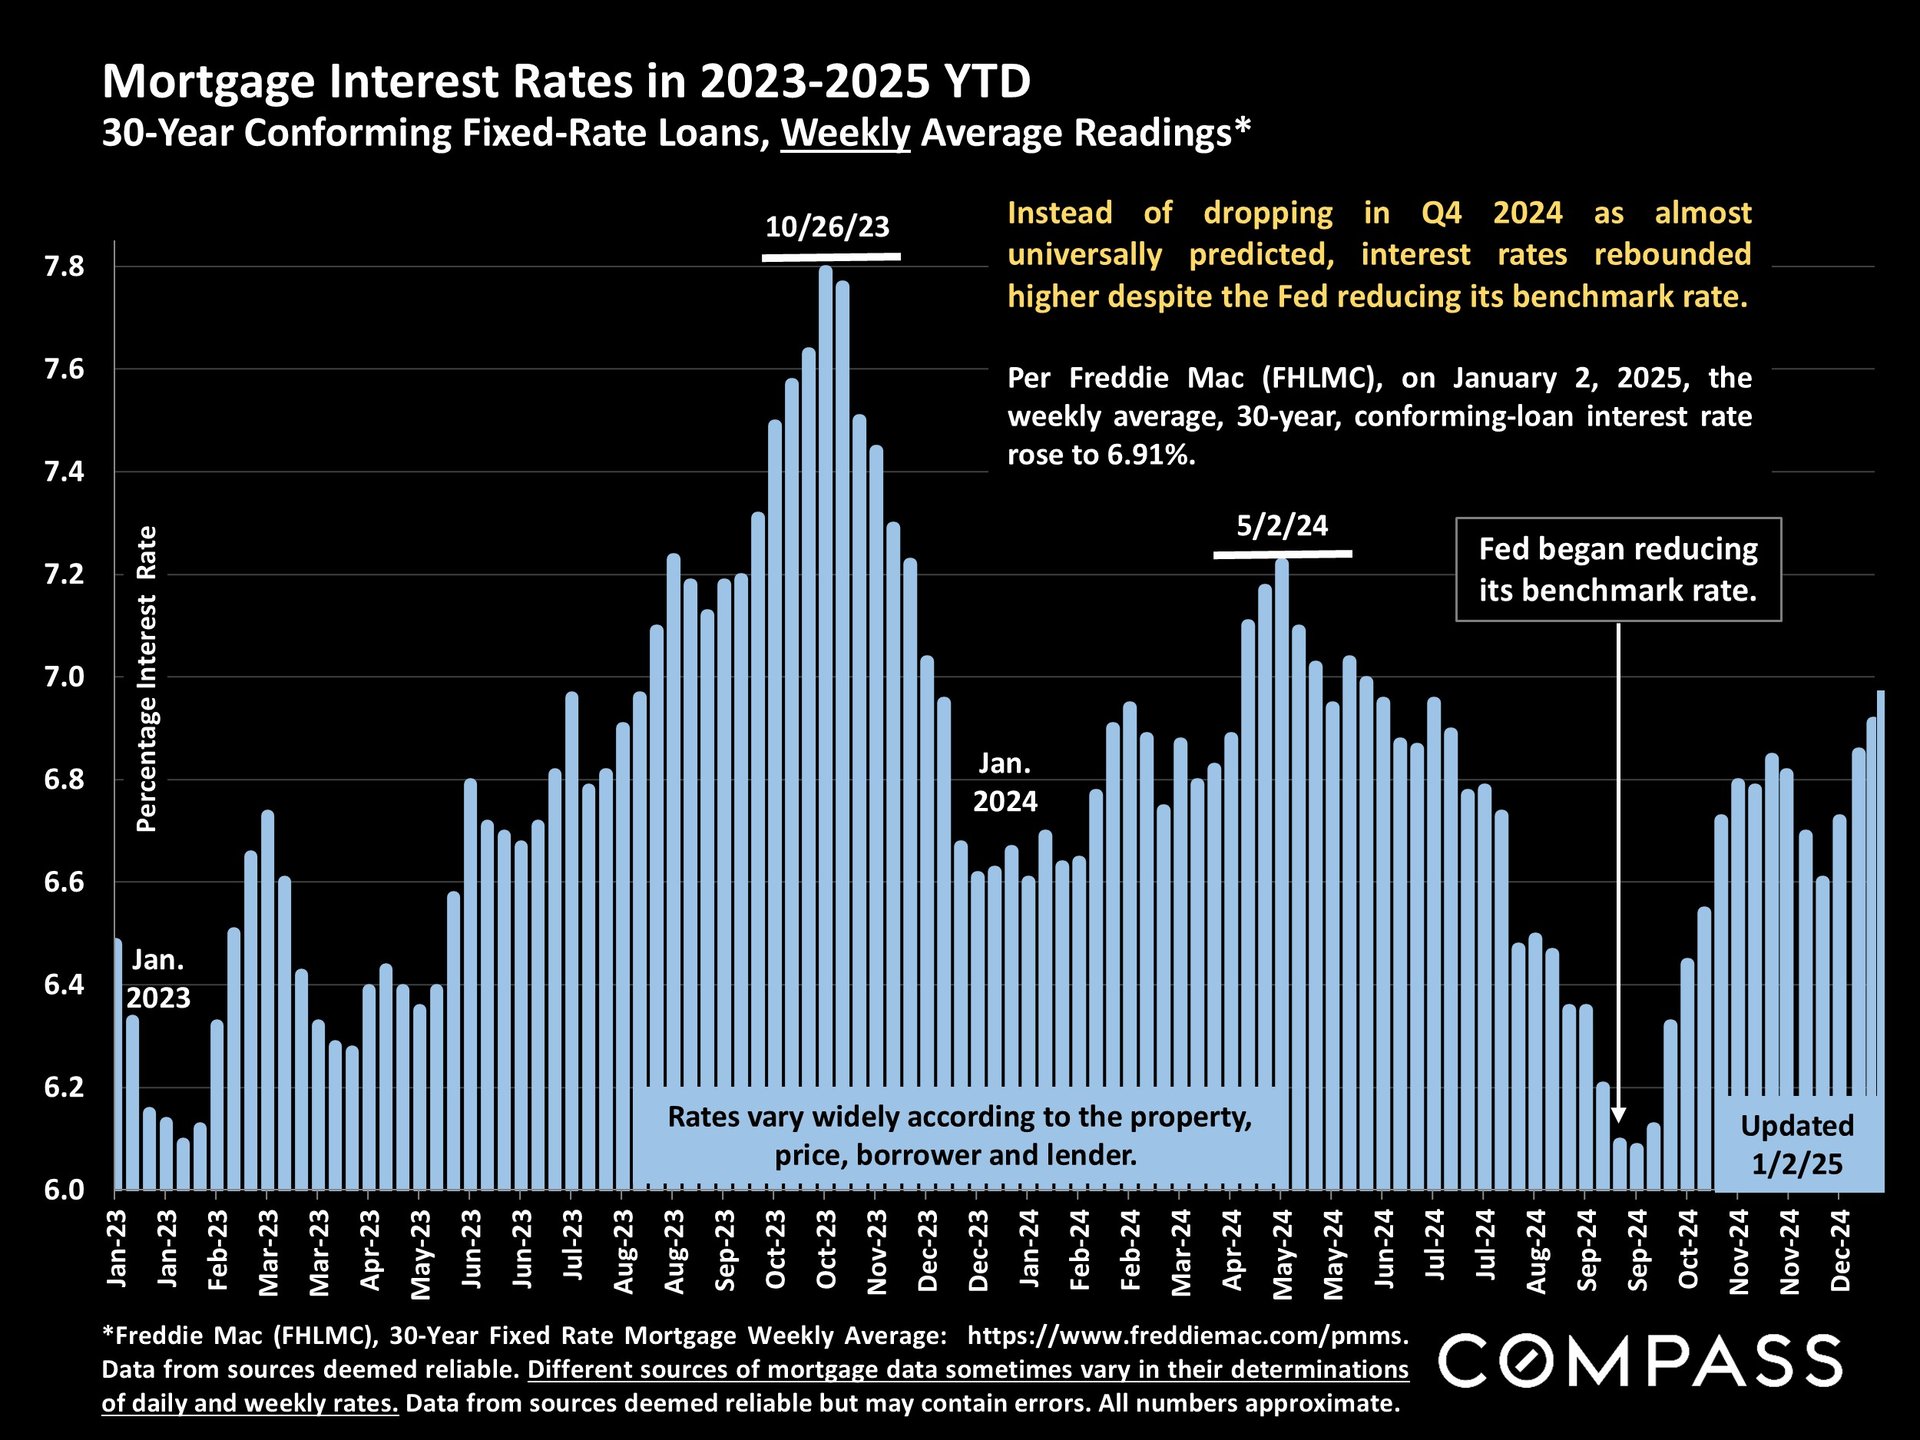
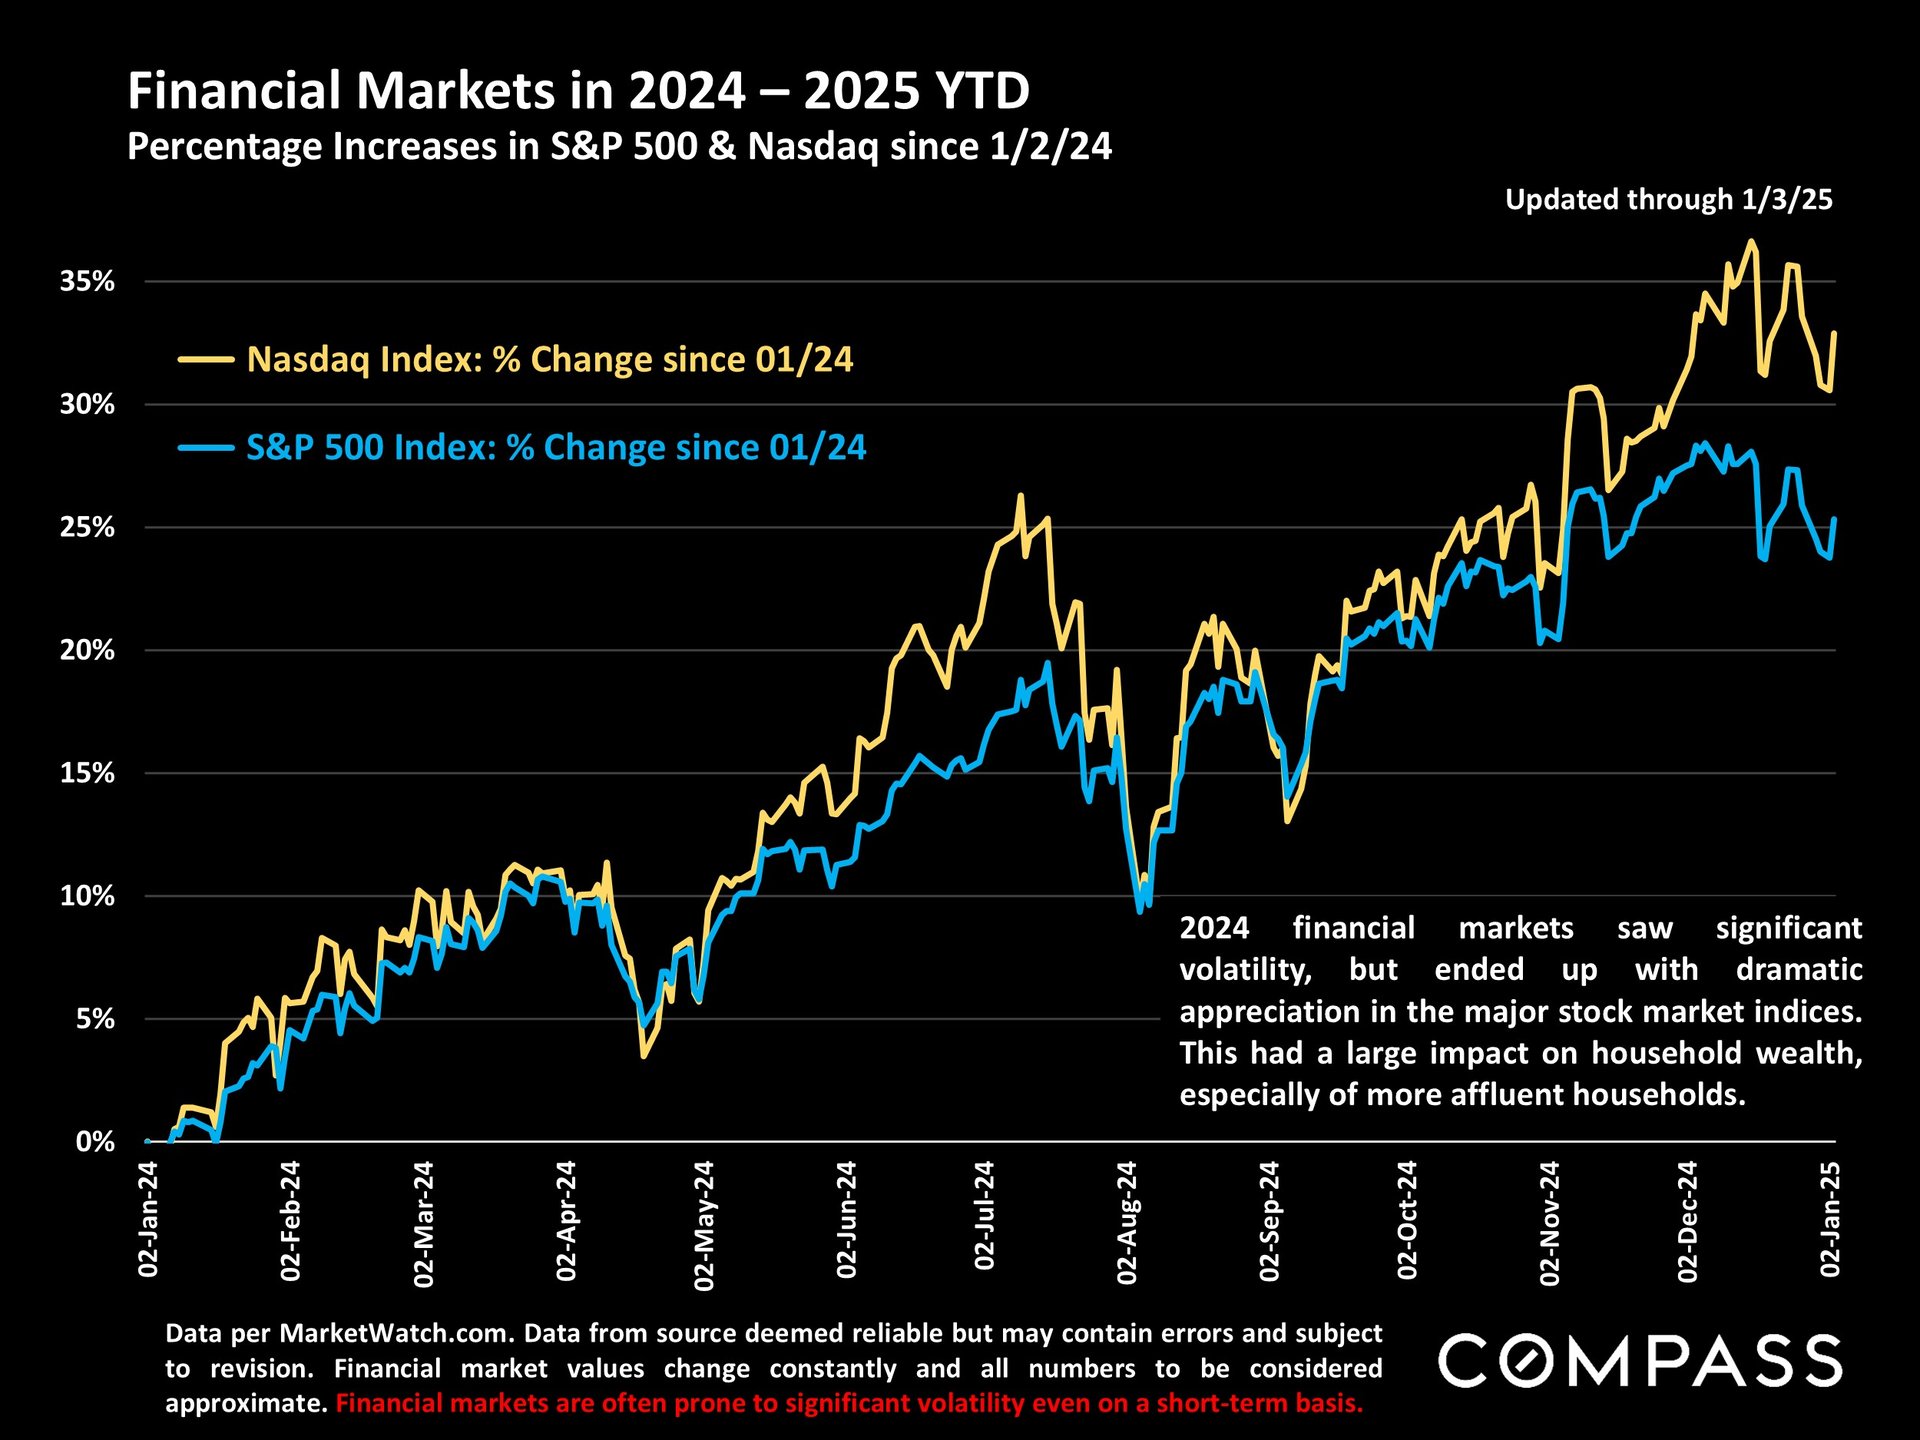
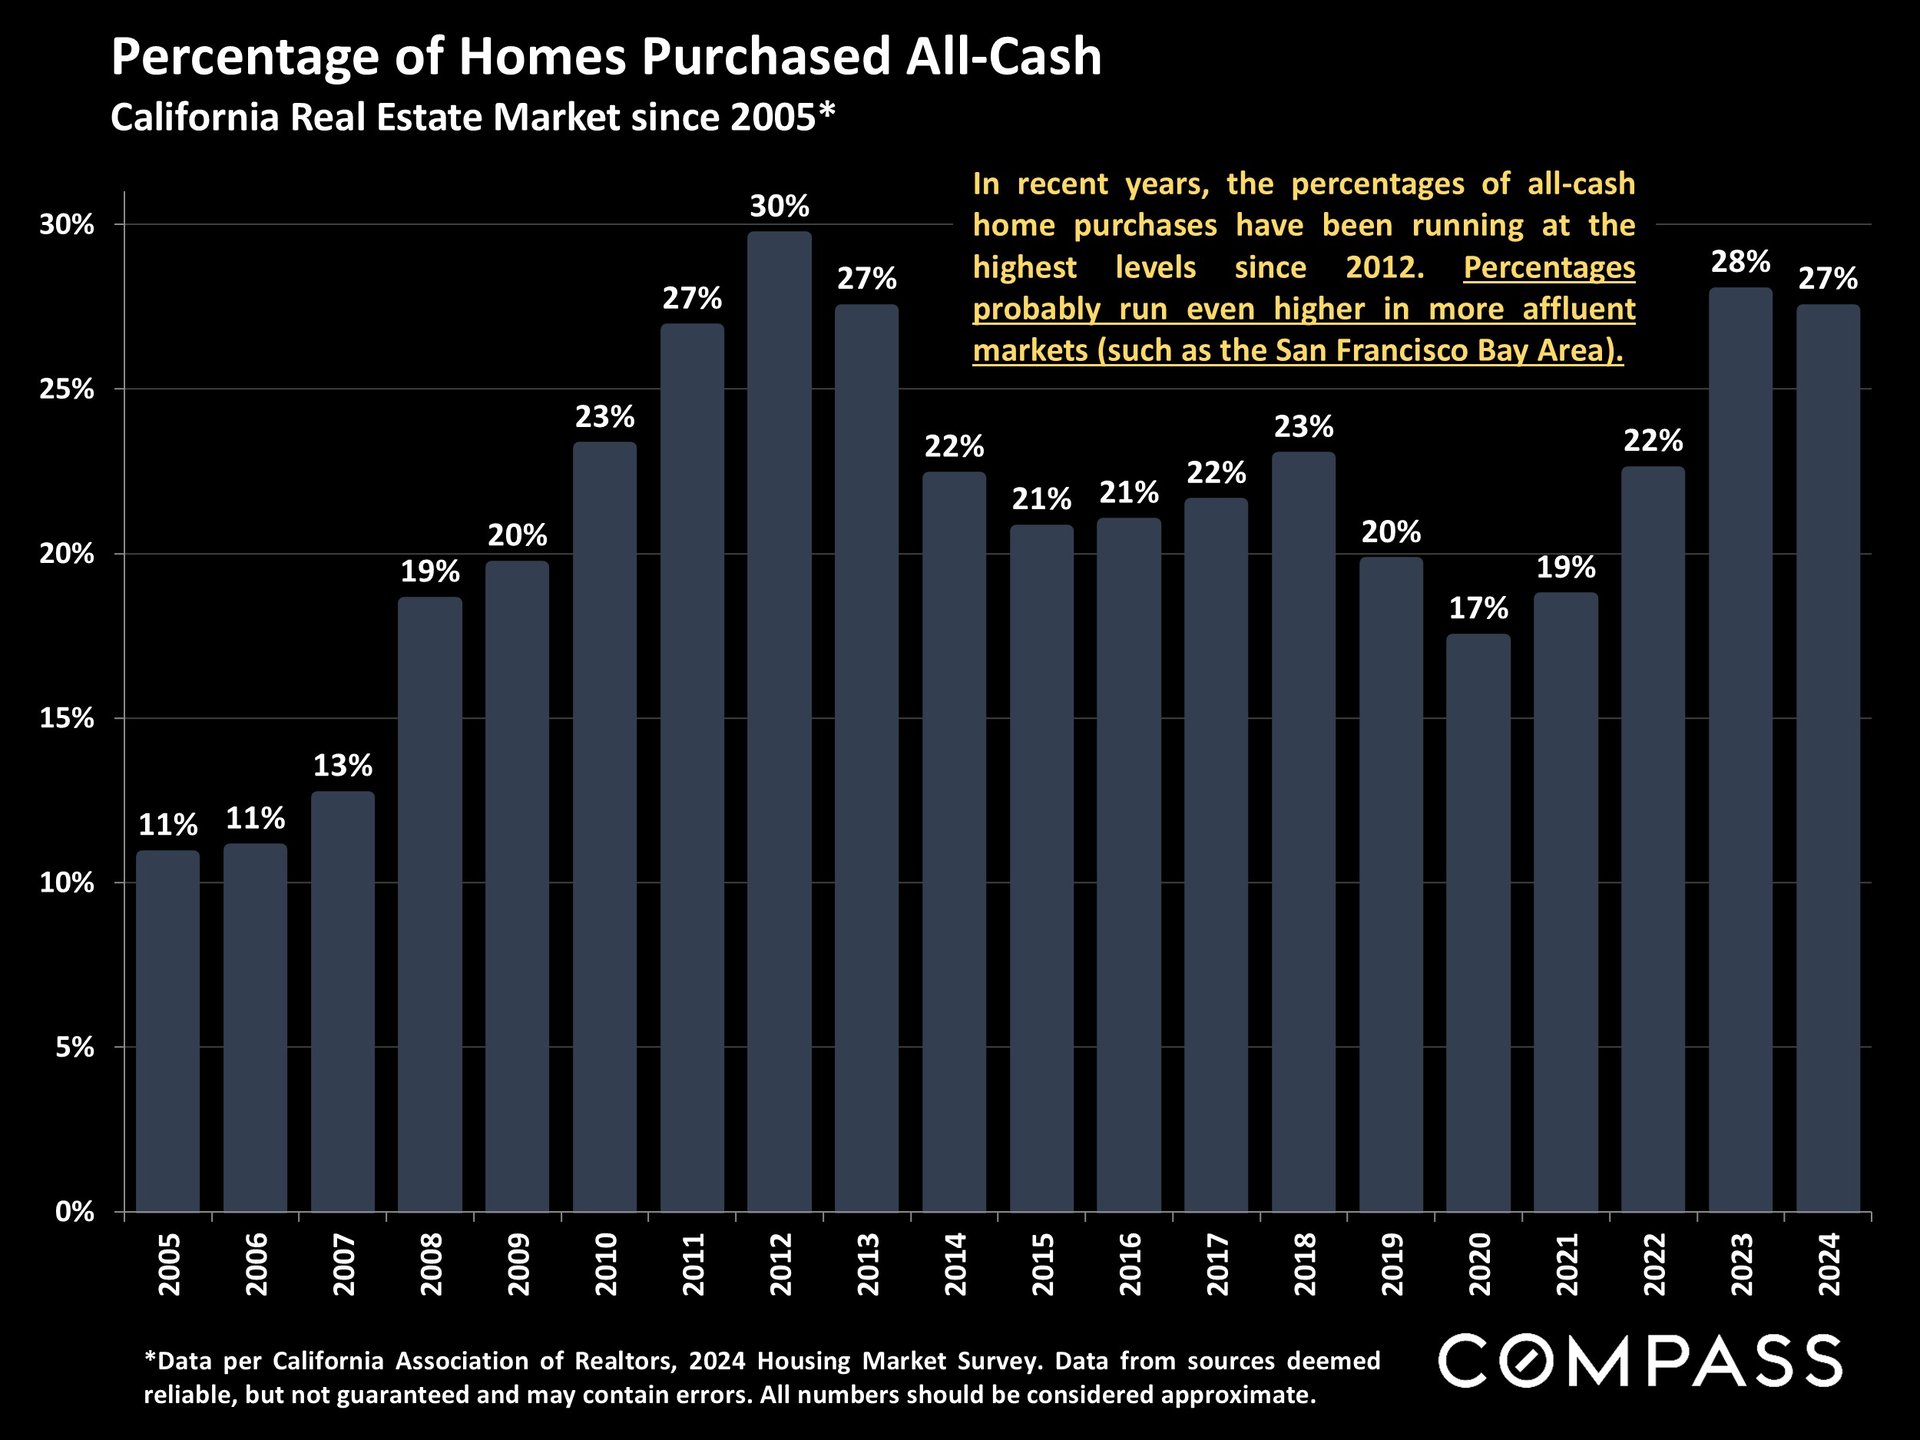
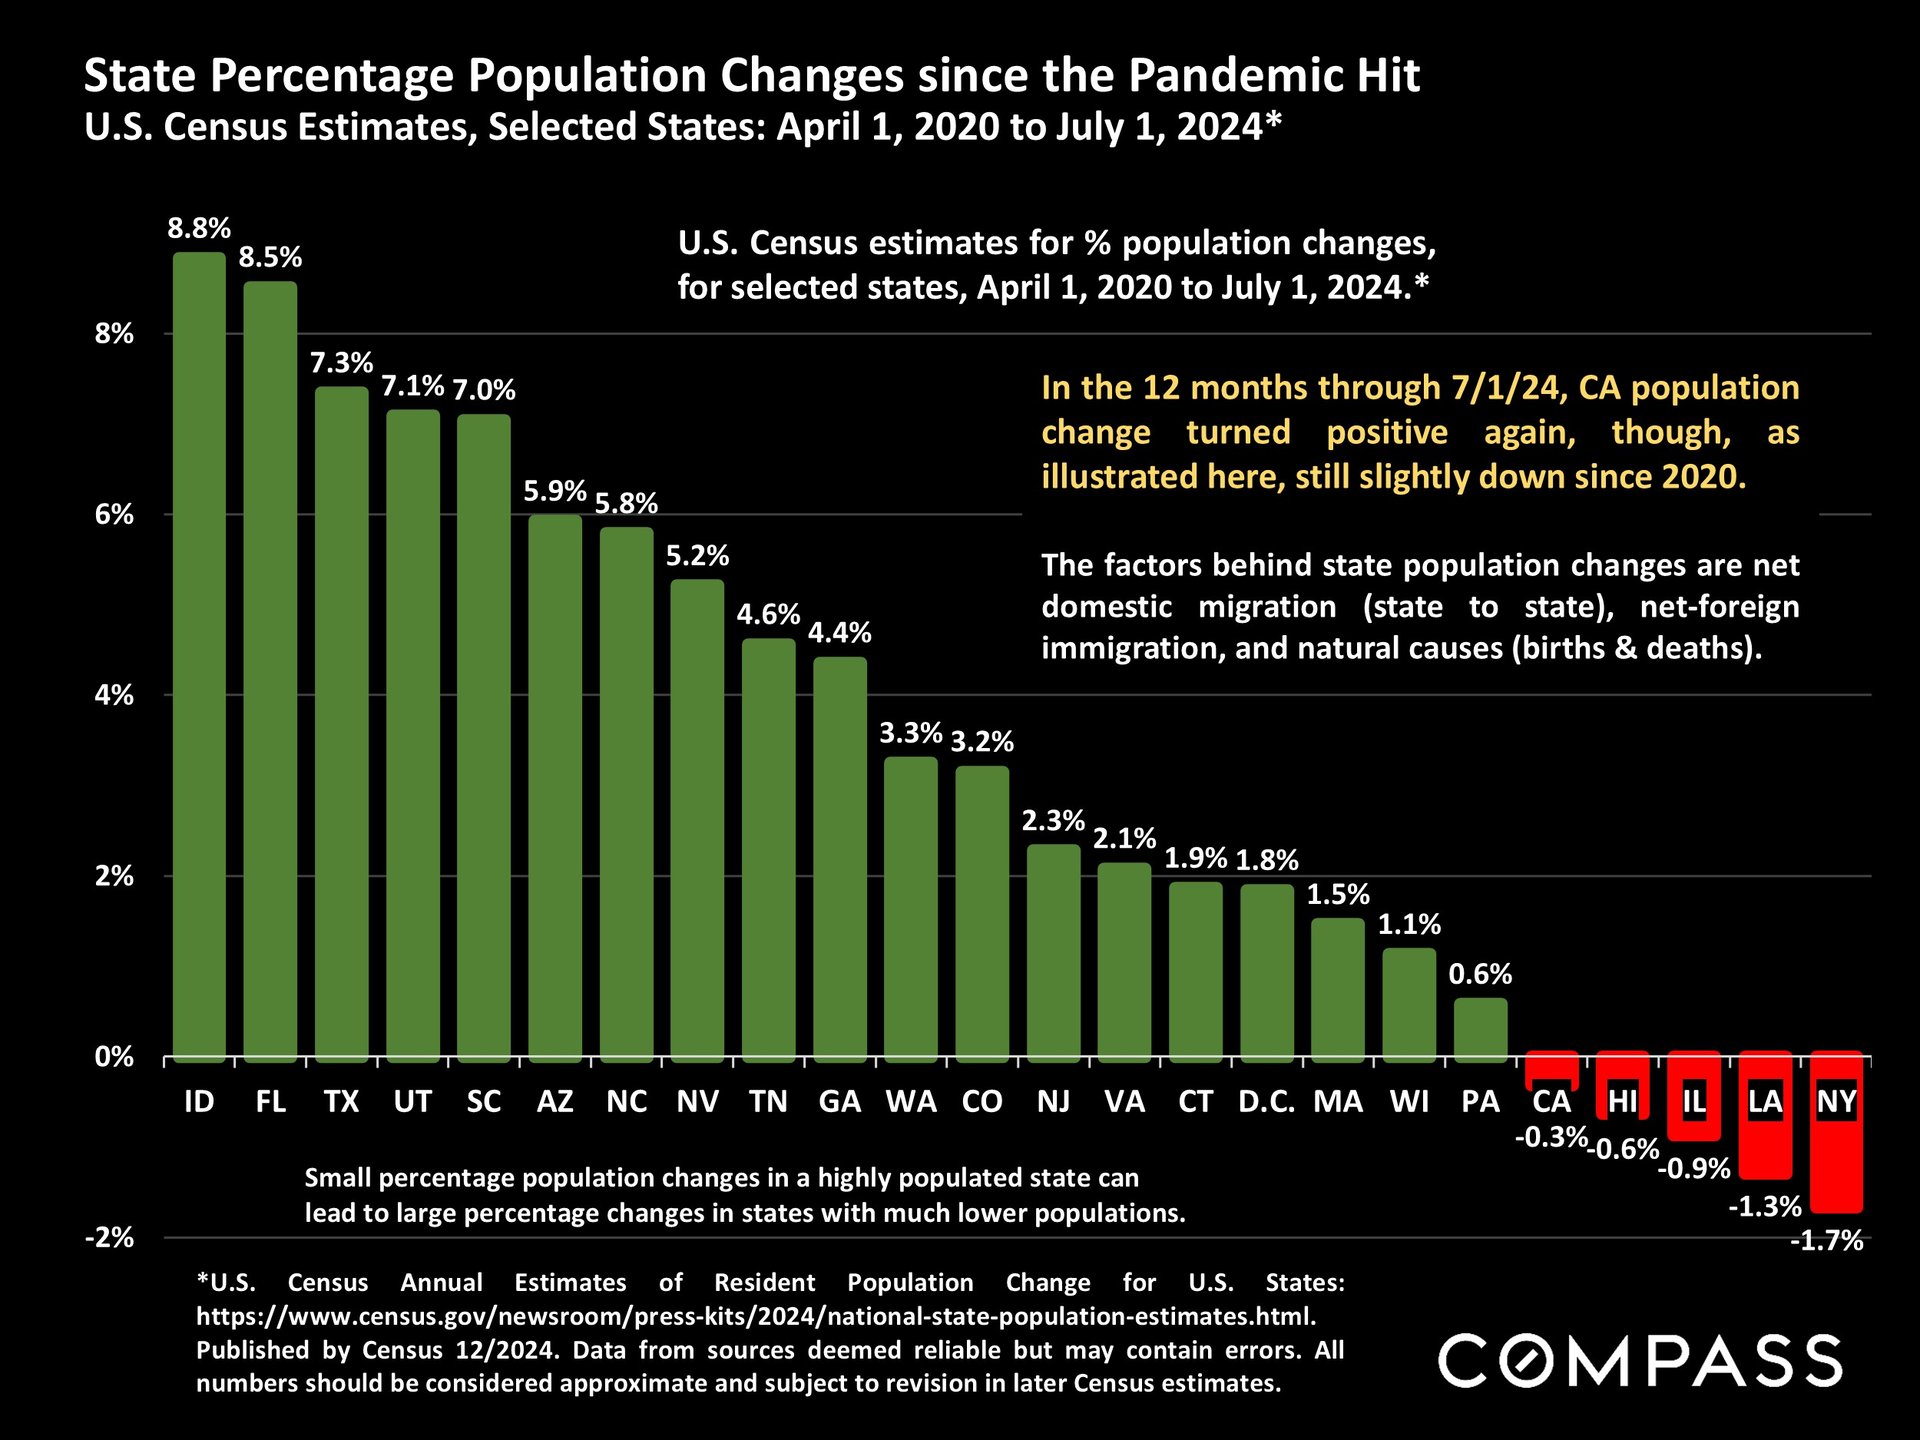
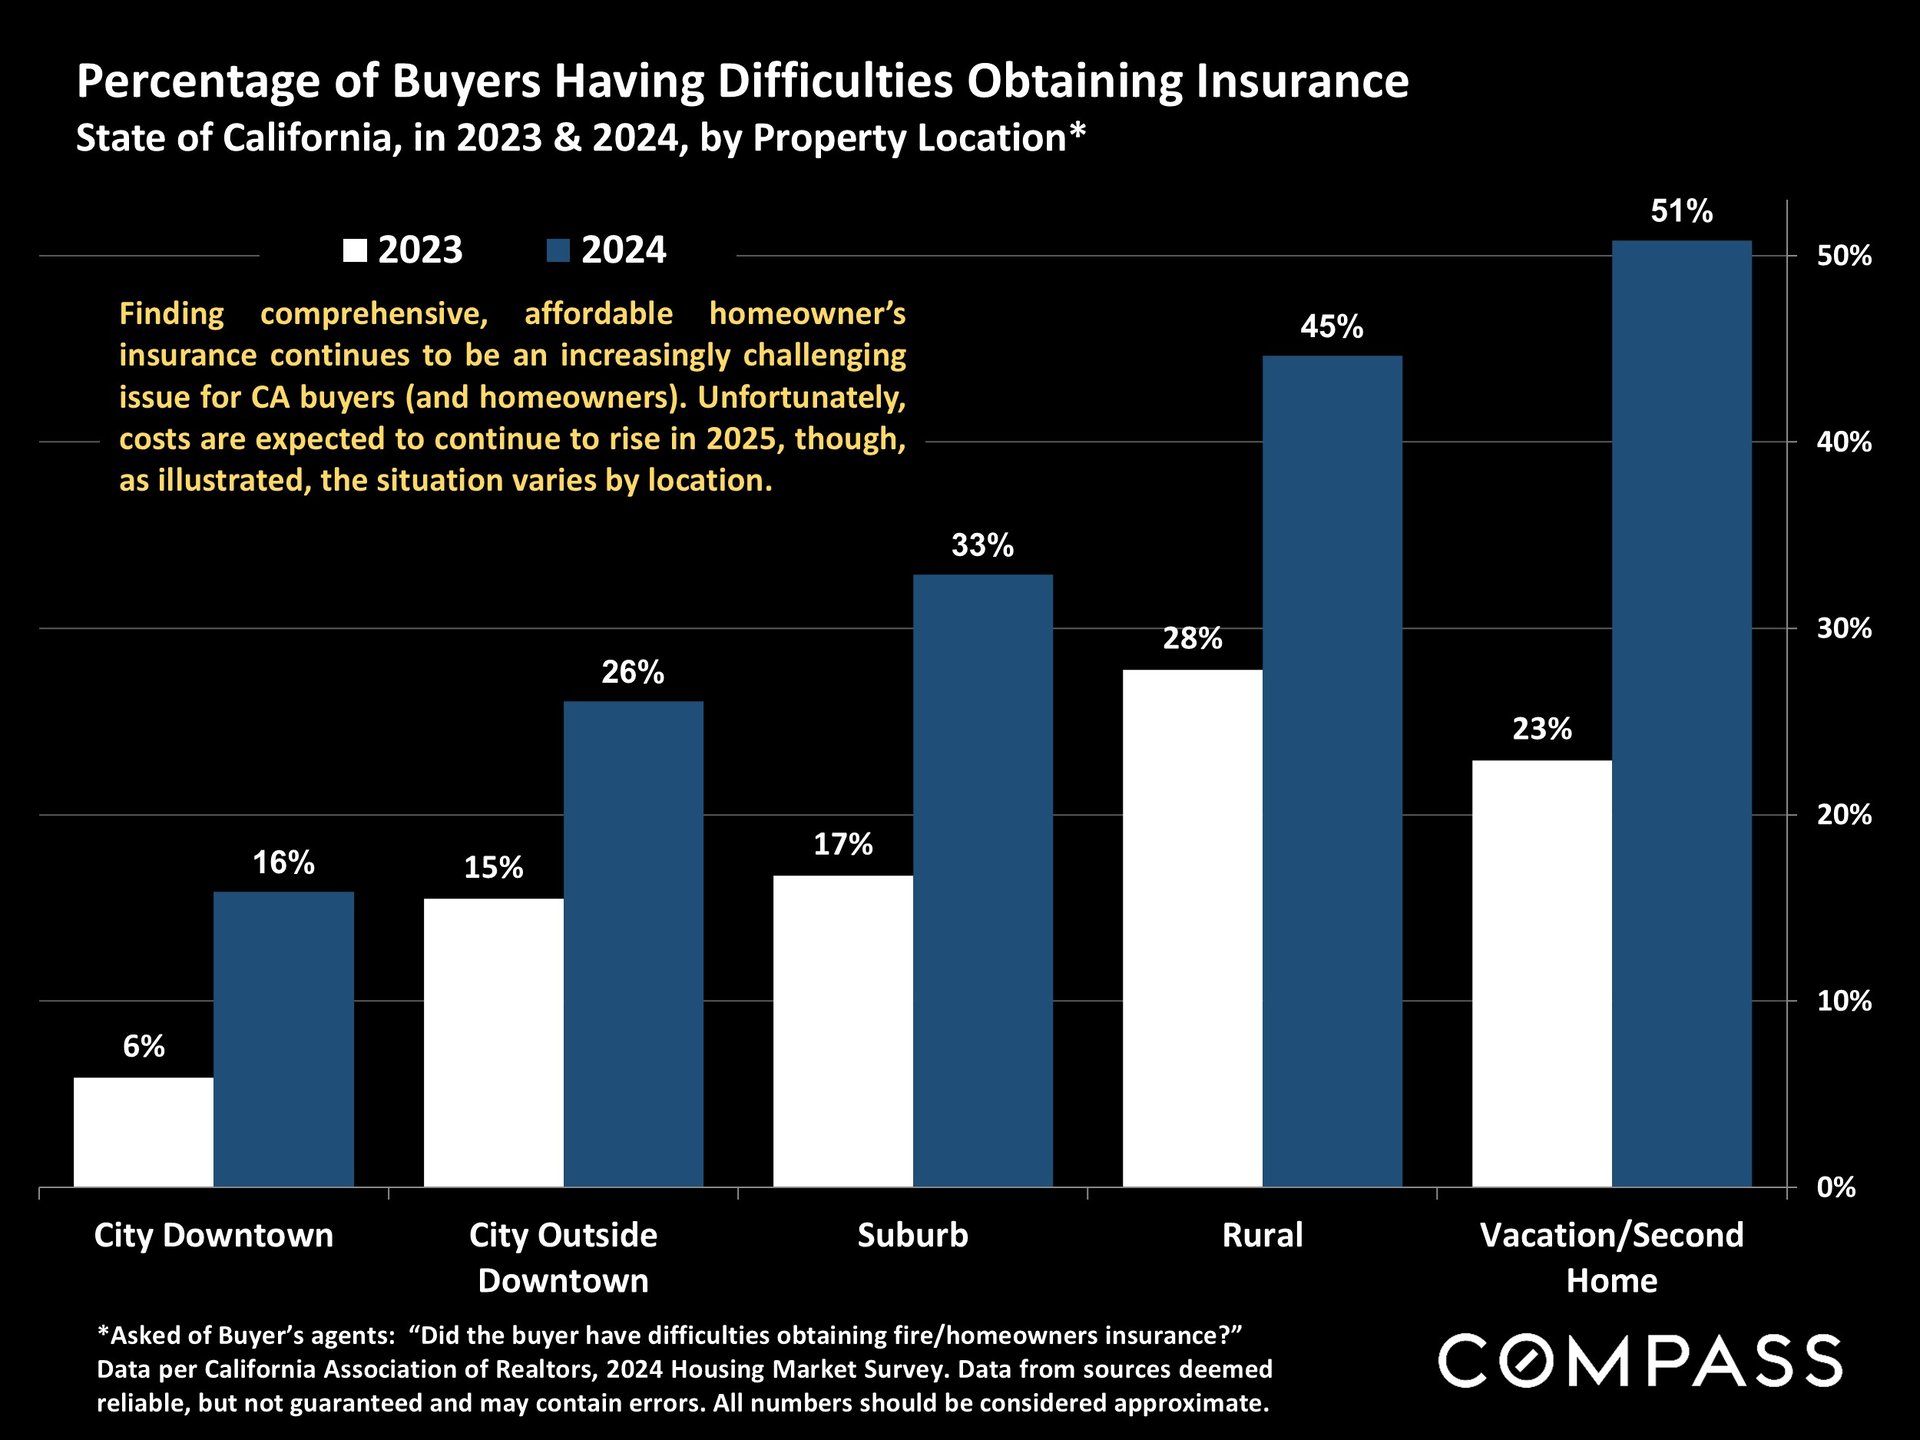
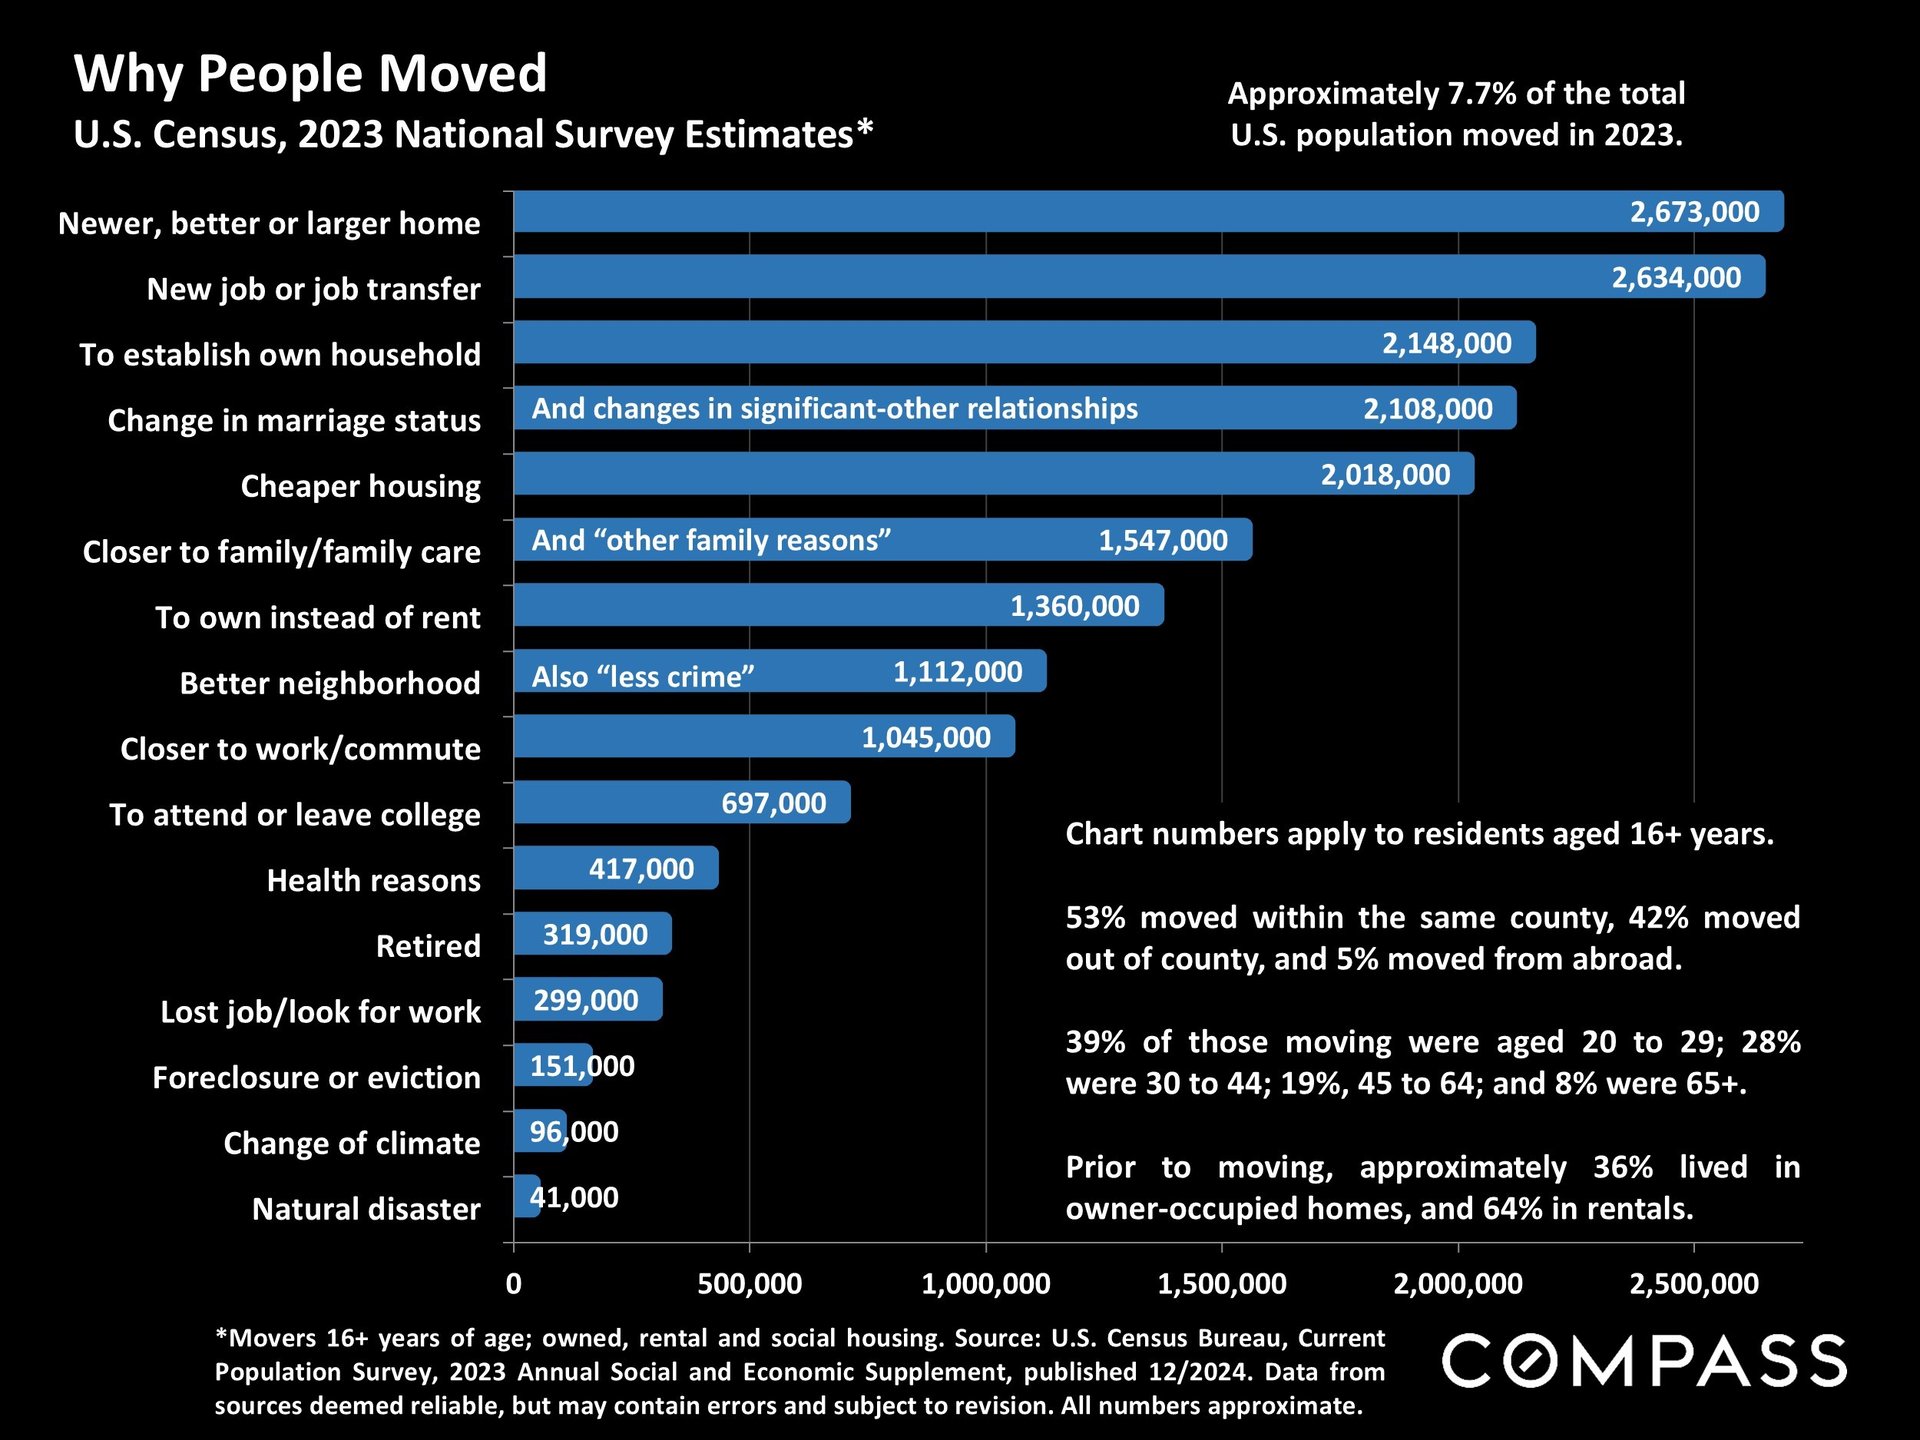
San Francisco real estate January 2025 report summarizing 2024 sales, economic trends, and seasonal market activity.Chart of San Francisco median house sale prices from 1993 to 2024, with green bars and historical market annotations.Bar chart of San Francisco annual median house price appreciation from 1990 to 2024, with historical market-period annotations.Chart of median San Francisco house prices by neighborhood, ranging from $913,000 in Bayview to $7 million in Presidio Heights.Chart of San Francisco median condo prices, 1993–2024, showing a 1% increase in 2024.Chart of San Francisco condo price appreciation from 1995 to 2024, with gold bars and annotations for major market events.Chart of median San Francisco condo prices by neighborhood, from $1.84 million in Cow Hollow to $600,000 in Van Ness/Civic Center.Bar chart comparing San Francisco median house and condo prices per square foot from 2005 to 2024.Chart of San Francisco annual new listings from 2005 to 2024, with historical market-period annotations.Chart of San Francisco annual home sales, highlighting the 2021 pandemic-market peak and 2023 low.Chart of San Francisco luxury home sales, 2005–2024, with $5 million-plus sales rebounding to 115 in 2024.Pie chart of 2024 San Francisco home sales by price segment, with property-type breakdown and Compass branding.Chart comparing San Francisco condo and house average days on market from 2005 to 2024; 2024 values are 57 and 29 days.Chart of San Francisco house and condo sales over list price, by year from 2005 to 2024.Chart of San Francisco house and condo sale prices versus list prices, annually from 2005 to 2024.Table comparing 2024 median home values by county and bedroom and bath count, with San Francisco highlighted.Bay Area 2024 median house values by county, comparing two-bedroom and three-bedroom homes.Bay Area 2024 condo and townhouse value table by county, with the San Francisco row highlighted.Bar chart of San Francisco active and coming-soon listings from February 2022 through January 2025.Chart of San Francisco listings going into contract, showing monthly activity from August 2021 through December 2024.Chart of San Francisco monthly home sales, January 2020–December 2024, showing seasonal peaks and January lows.Chart of San Francisco luxury home sales since 2018, highlighting the pandemic boom and seasonal sales patterns.Selected economic indicators: inflation, mortgage rates, stock markets, population change, and homeowner’s insurance.Bar chart of monthly U.S. CPI inflation, peaking at 8.9% in June 2022 and reaching 2.7% in November 2024.Chart of federal funds interest rates since 1981, annotated with economic events and Federal Reserve actions through 2024.Bar chart of 30-year mortgage rates from 2023 to January 2025, with a peak near 7.8% in October 2023.Chart comparing 2024 percentage gains in the Nasdaq and S&P 500, with Nasdaq ending higher.Bar chart of California all-cash home purchases, from 11% in 2005 to 27% in 2024, peaking at 30% in 2012.Bar chart of selected states’ population changes from 2020 to 2024, with Idaho highest and New York lowest.Chart of California buyers’ insurance difficulties by property location, showing higher percentages in 2024 than 2023.Bar chart of reasons people moved in 2023; a better or larger home and a new job lead.Real estate report notes explain statistics, home values, square-foot calculations, data limitations, and legal disclaimers.

Work With Us

We will help you understand the complex aspects of the transaction and share our expertise so that you can make the best decisions possible. We are experienced, market savvy, and energetic. With both of us working for our clients, you get twice the amount of attention and insight.