
The SF Team, Eva + James, Compass

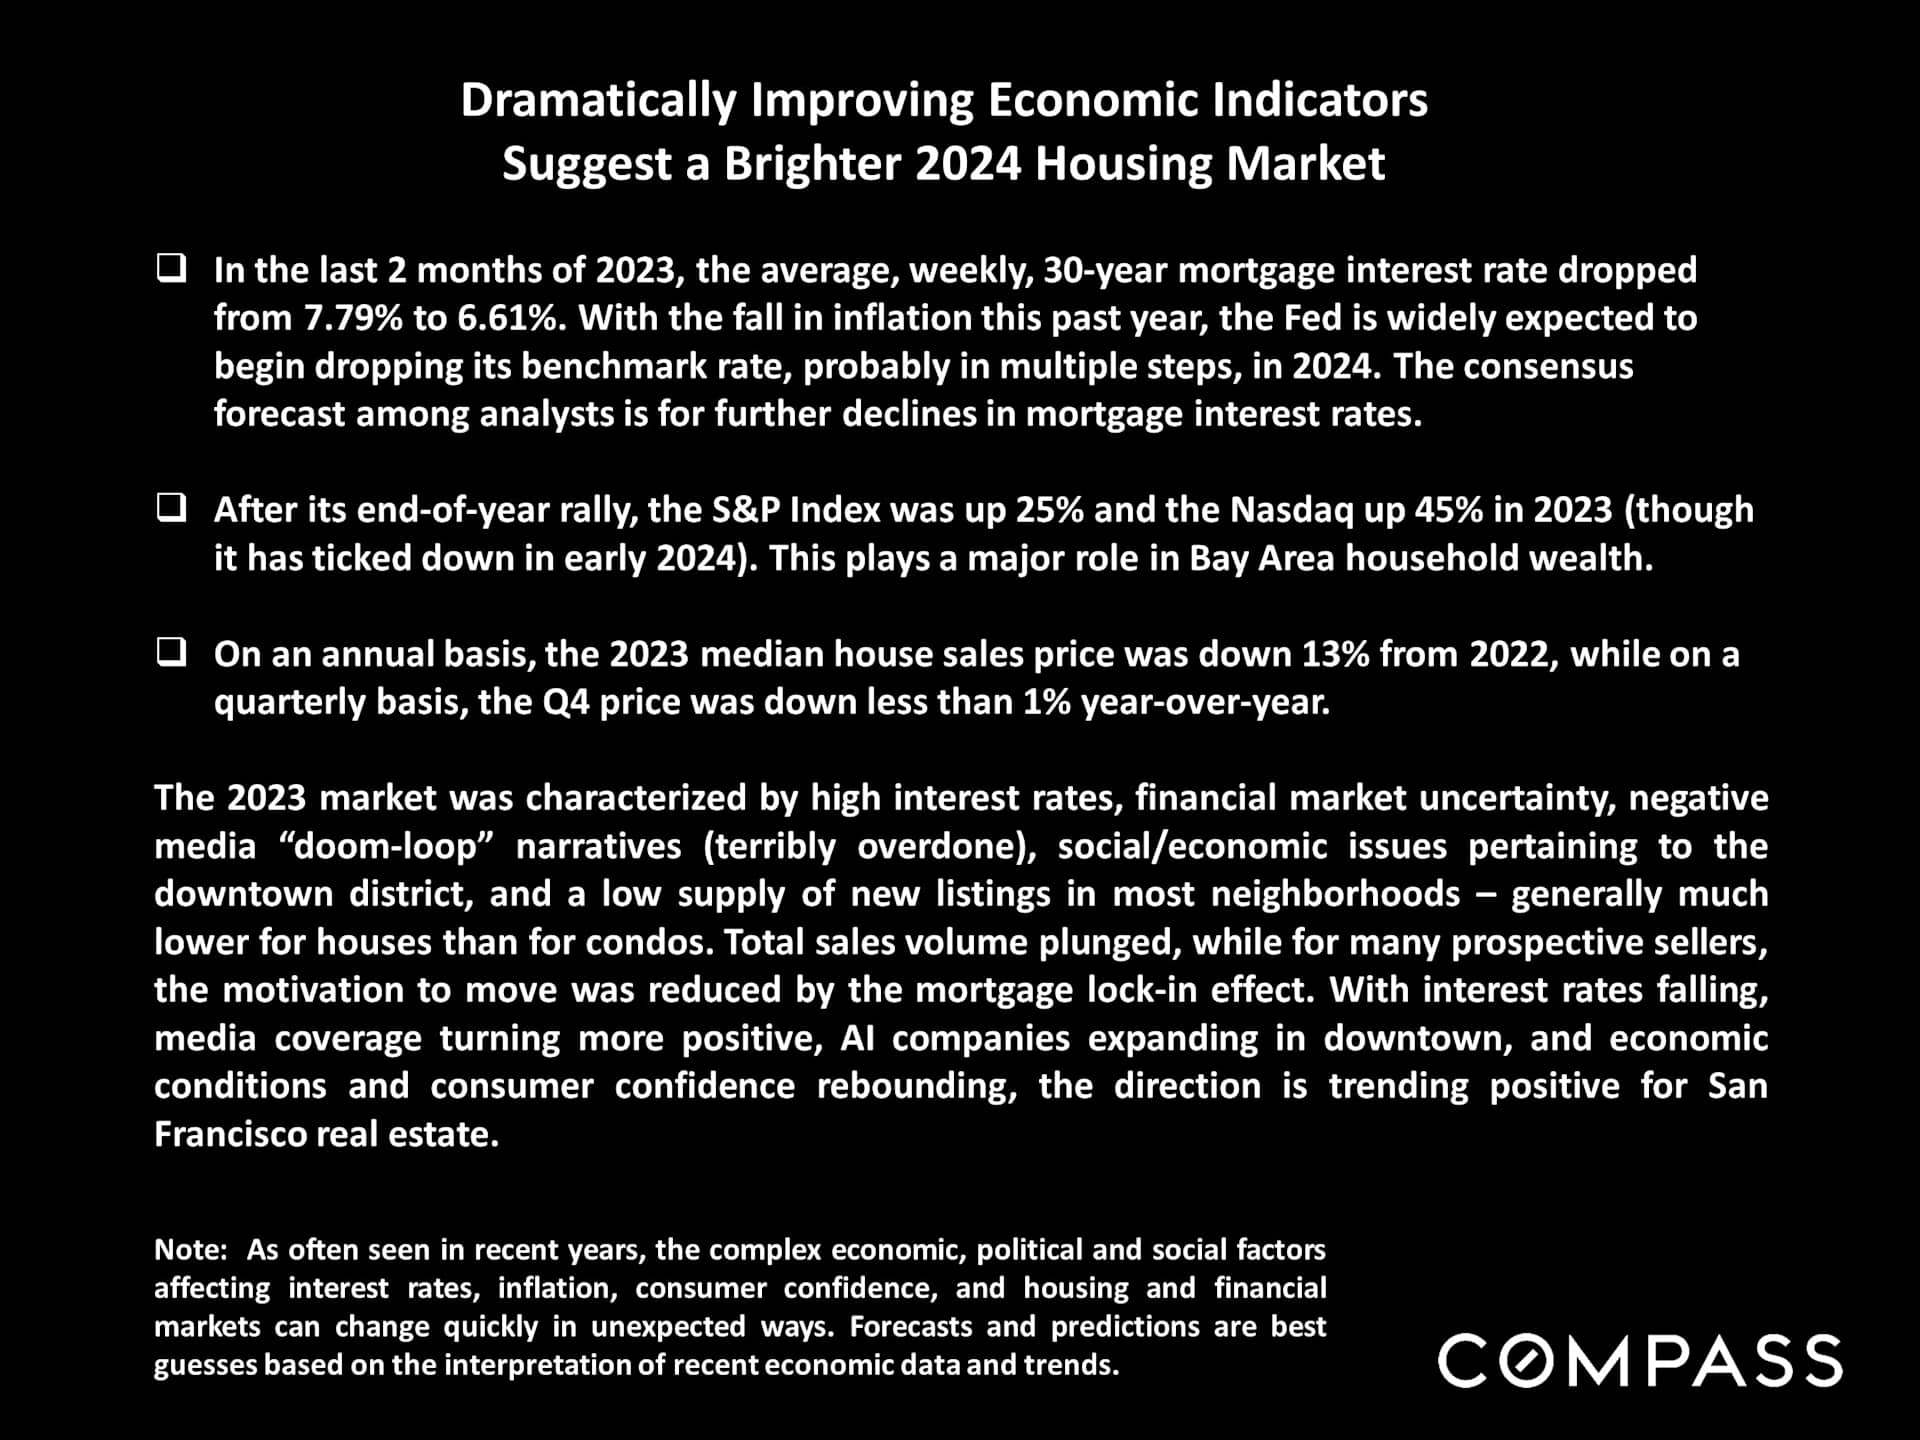
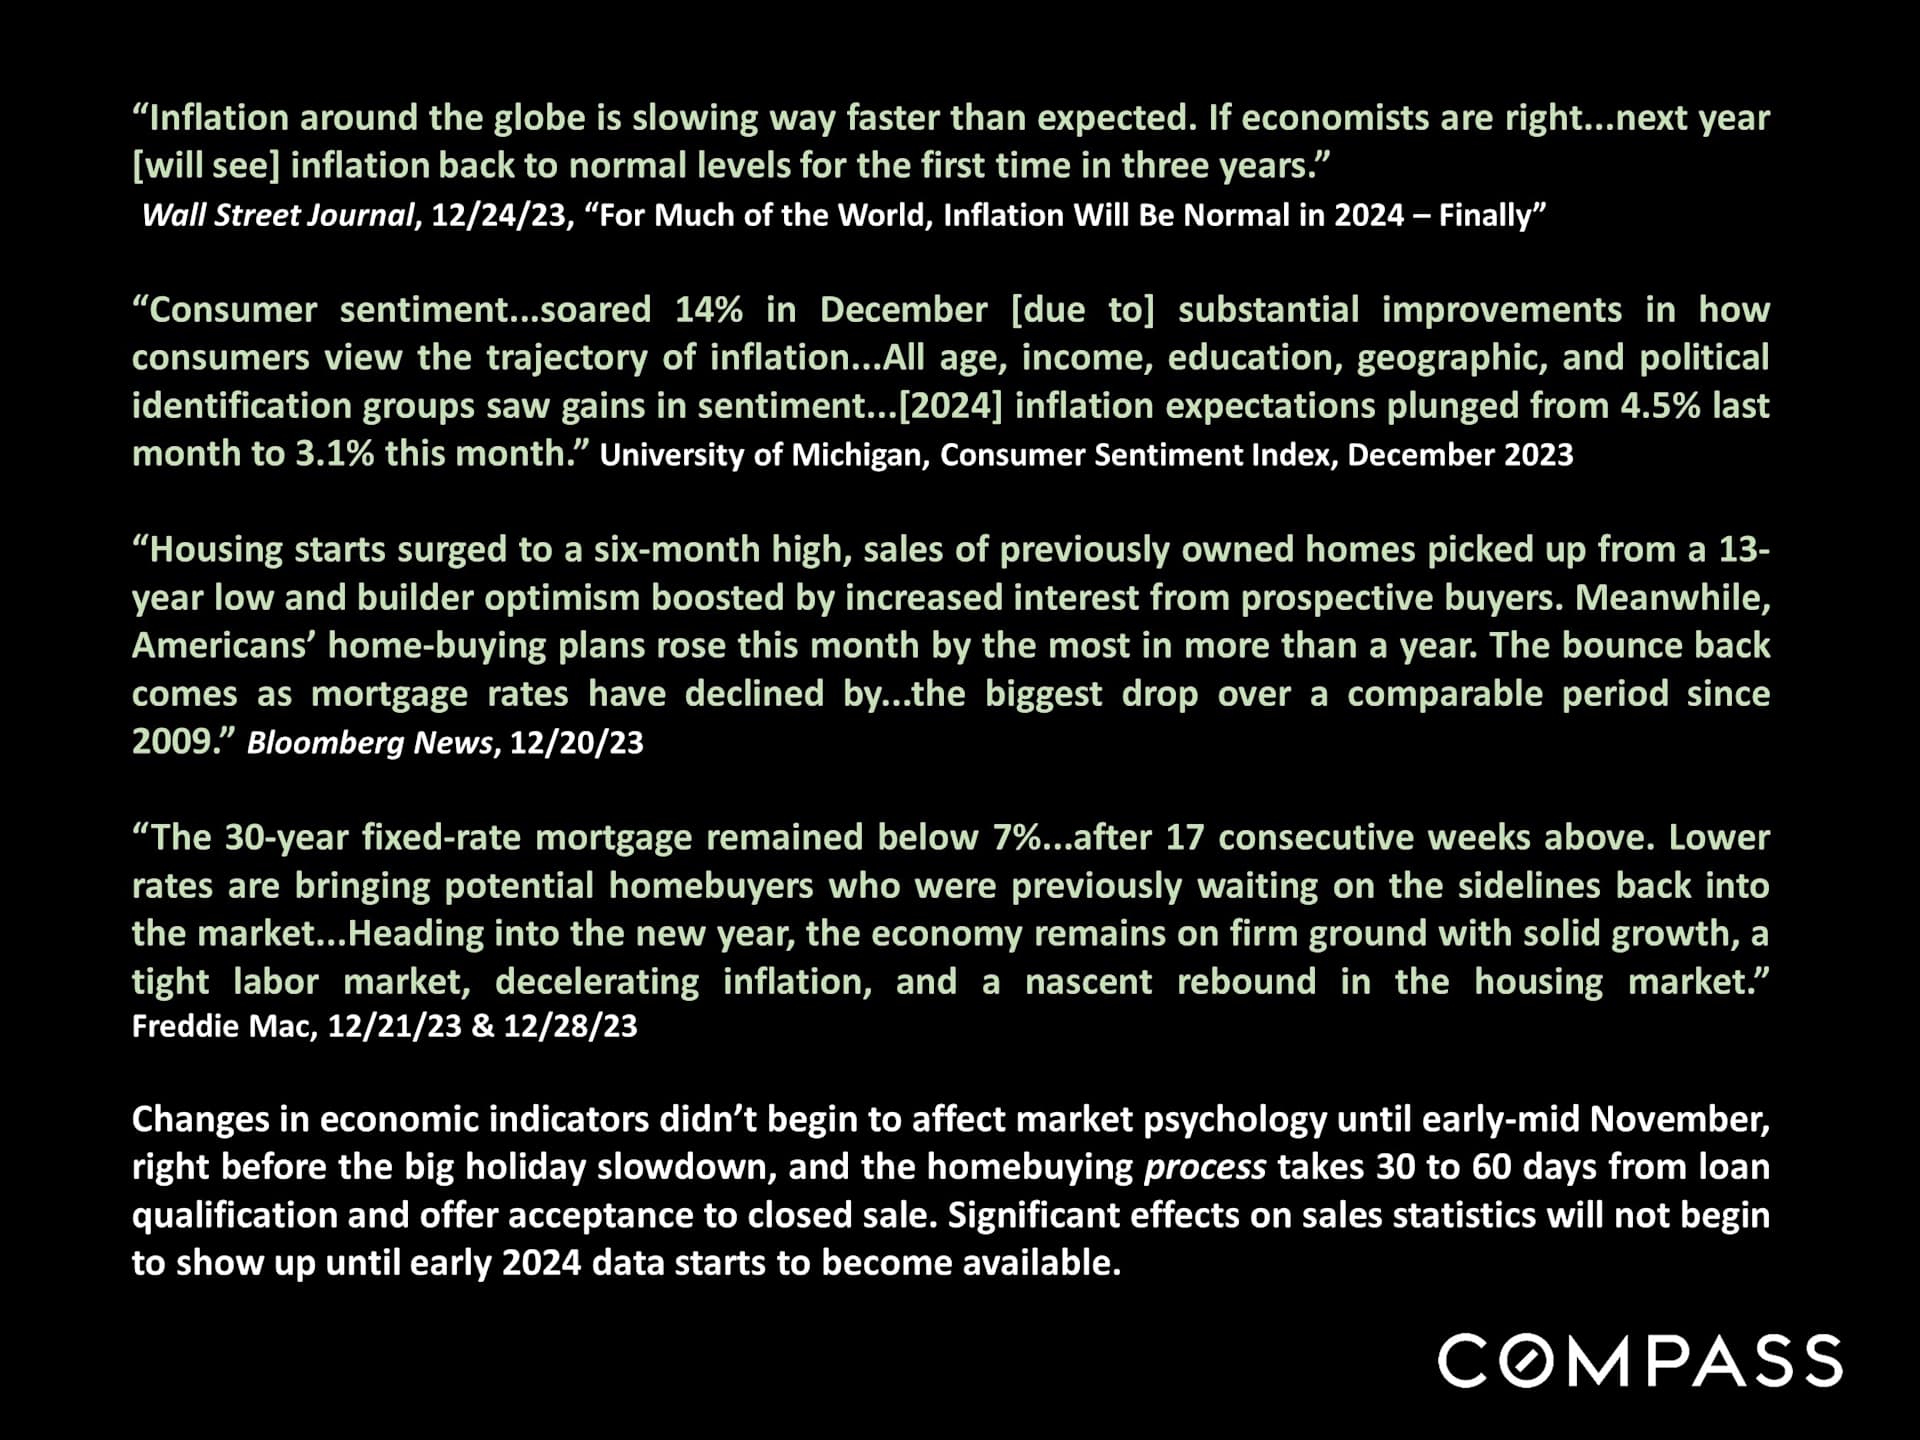
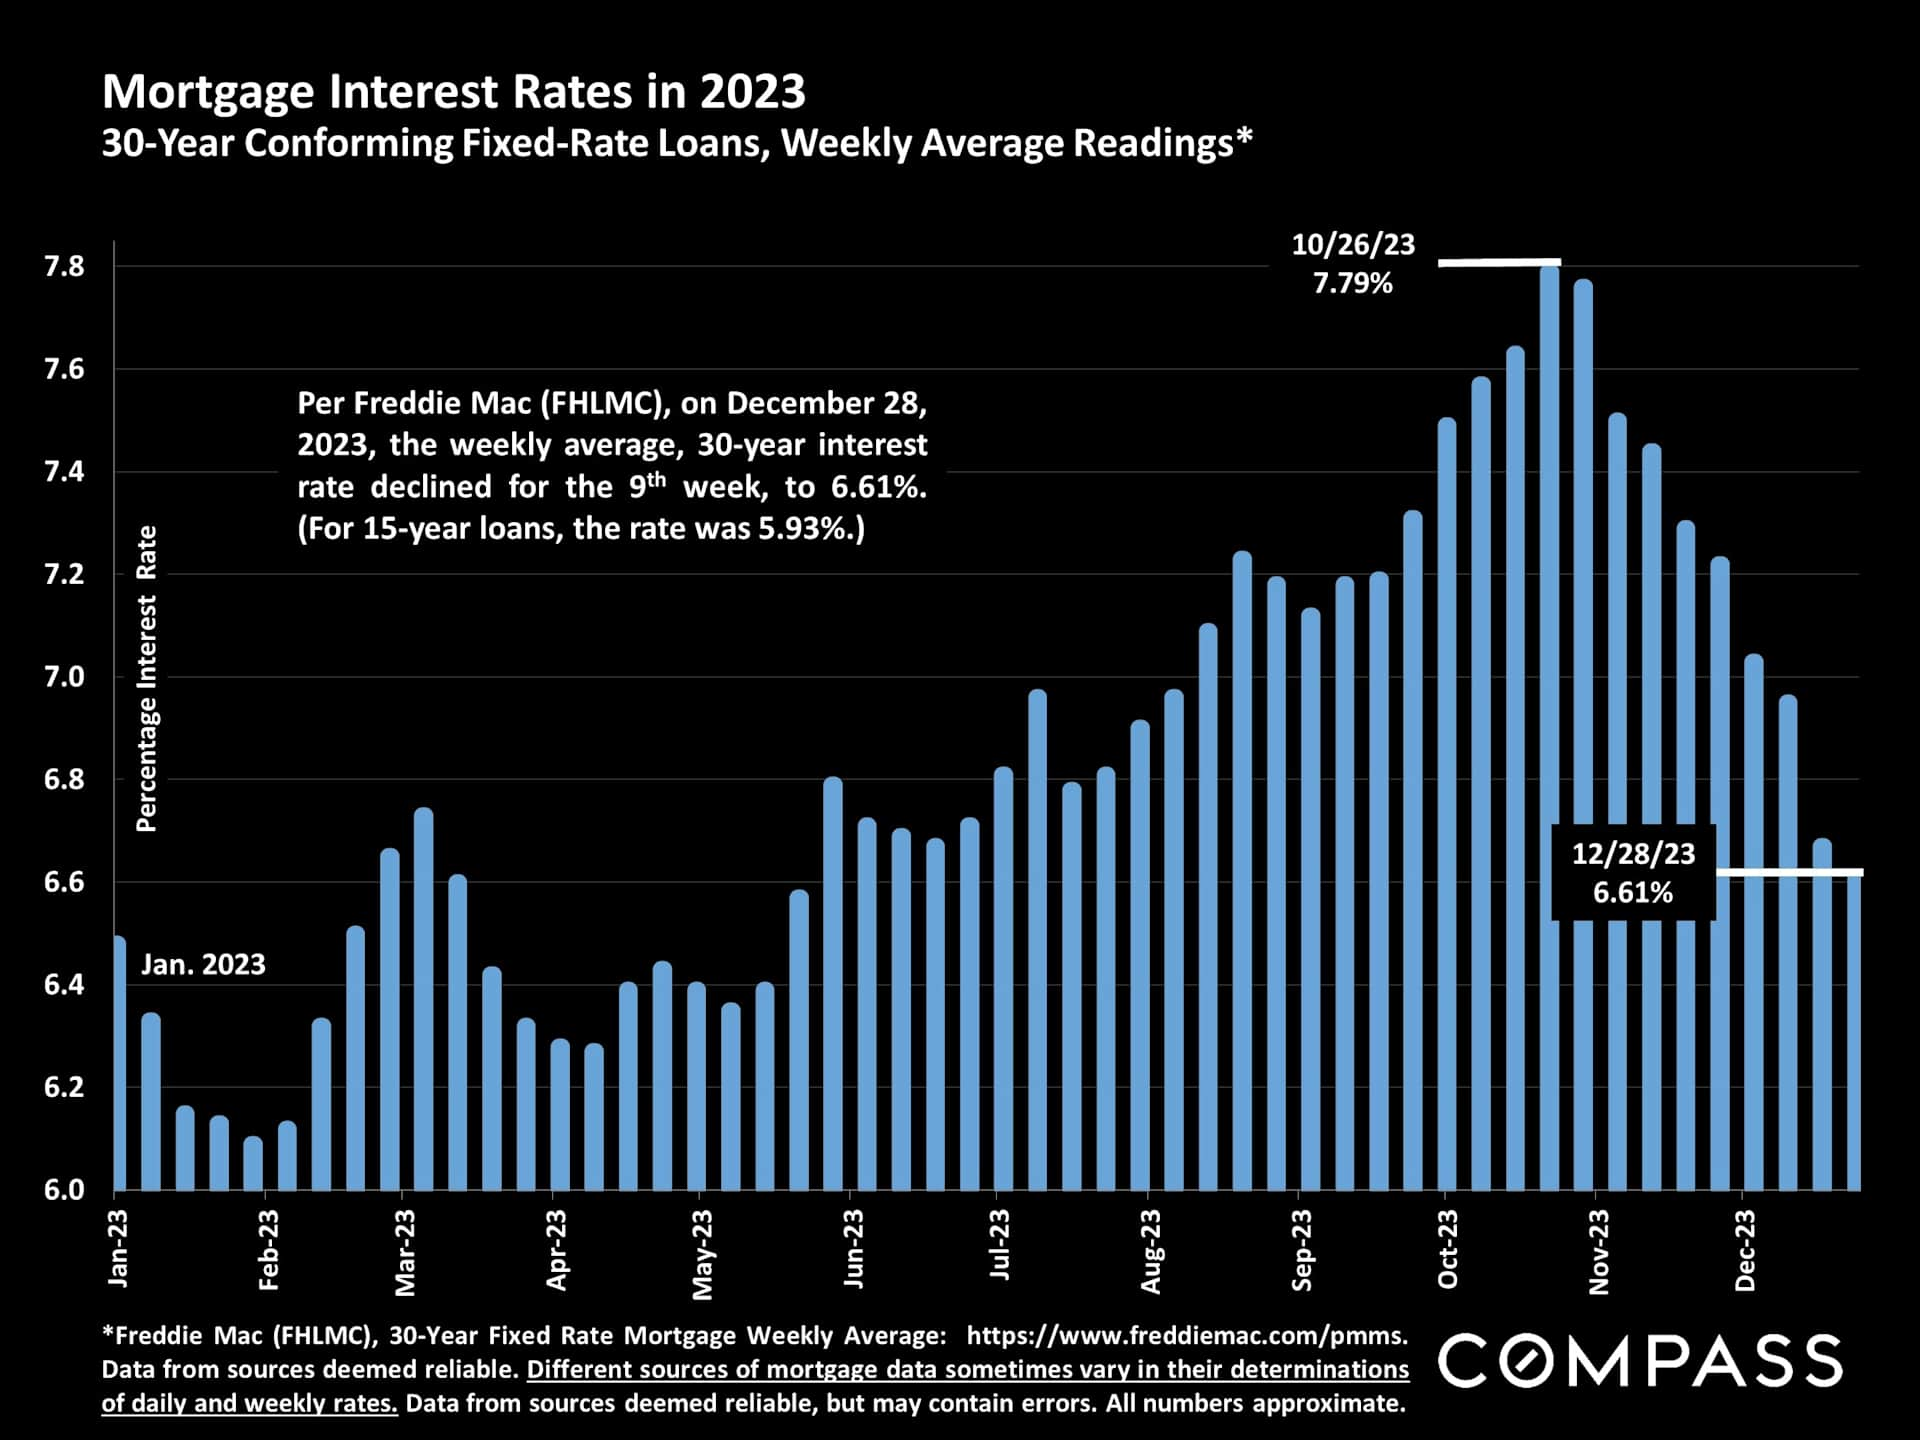
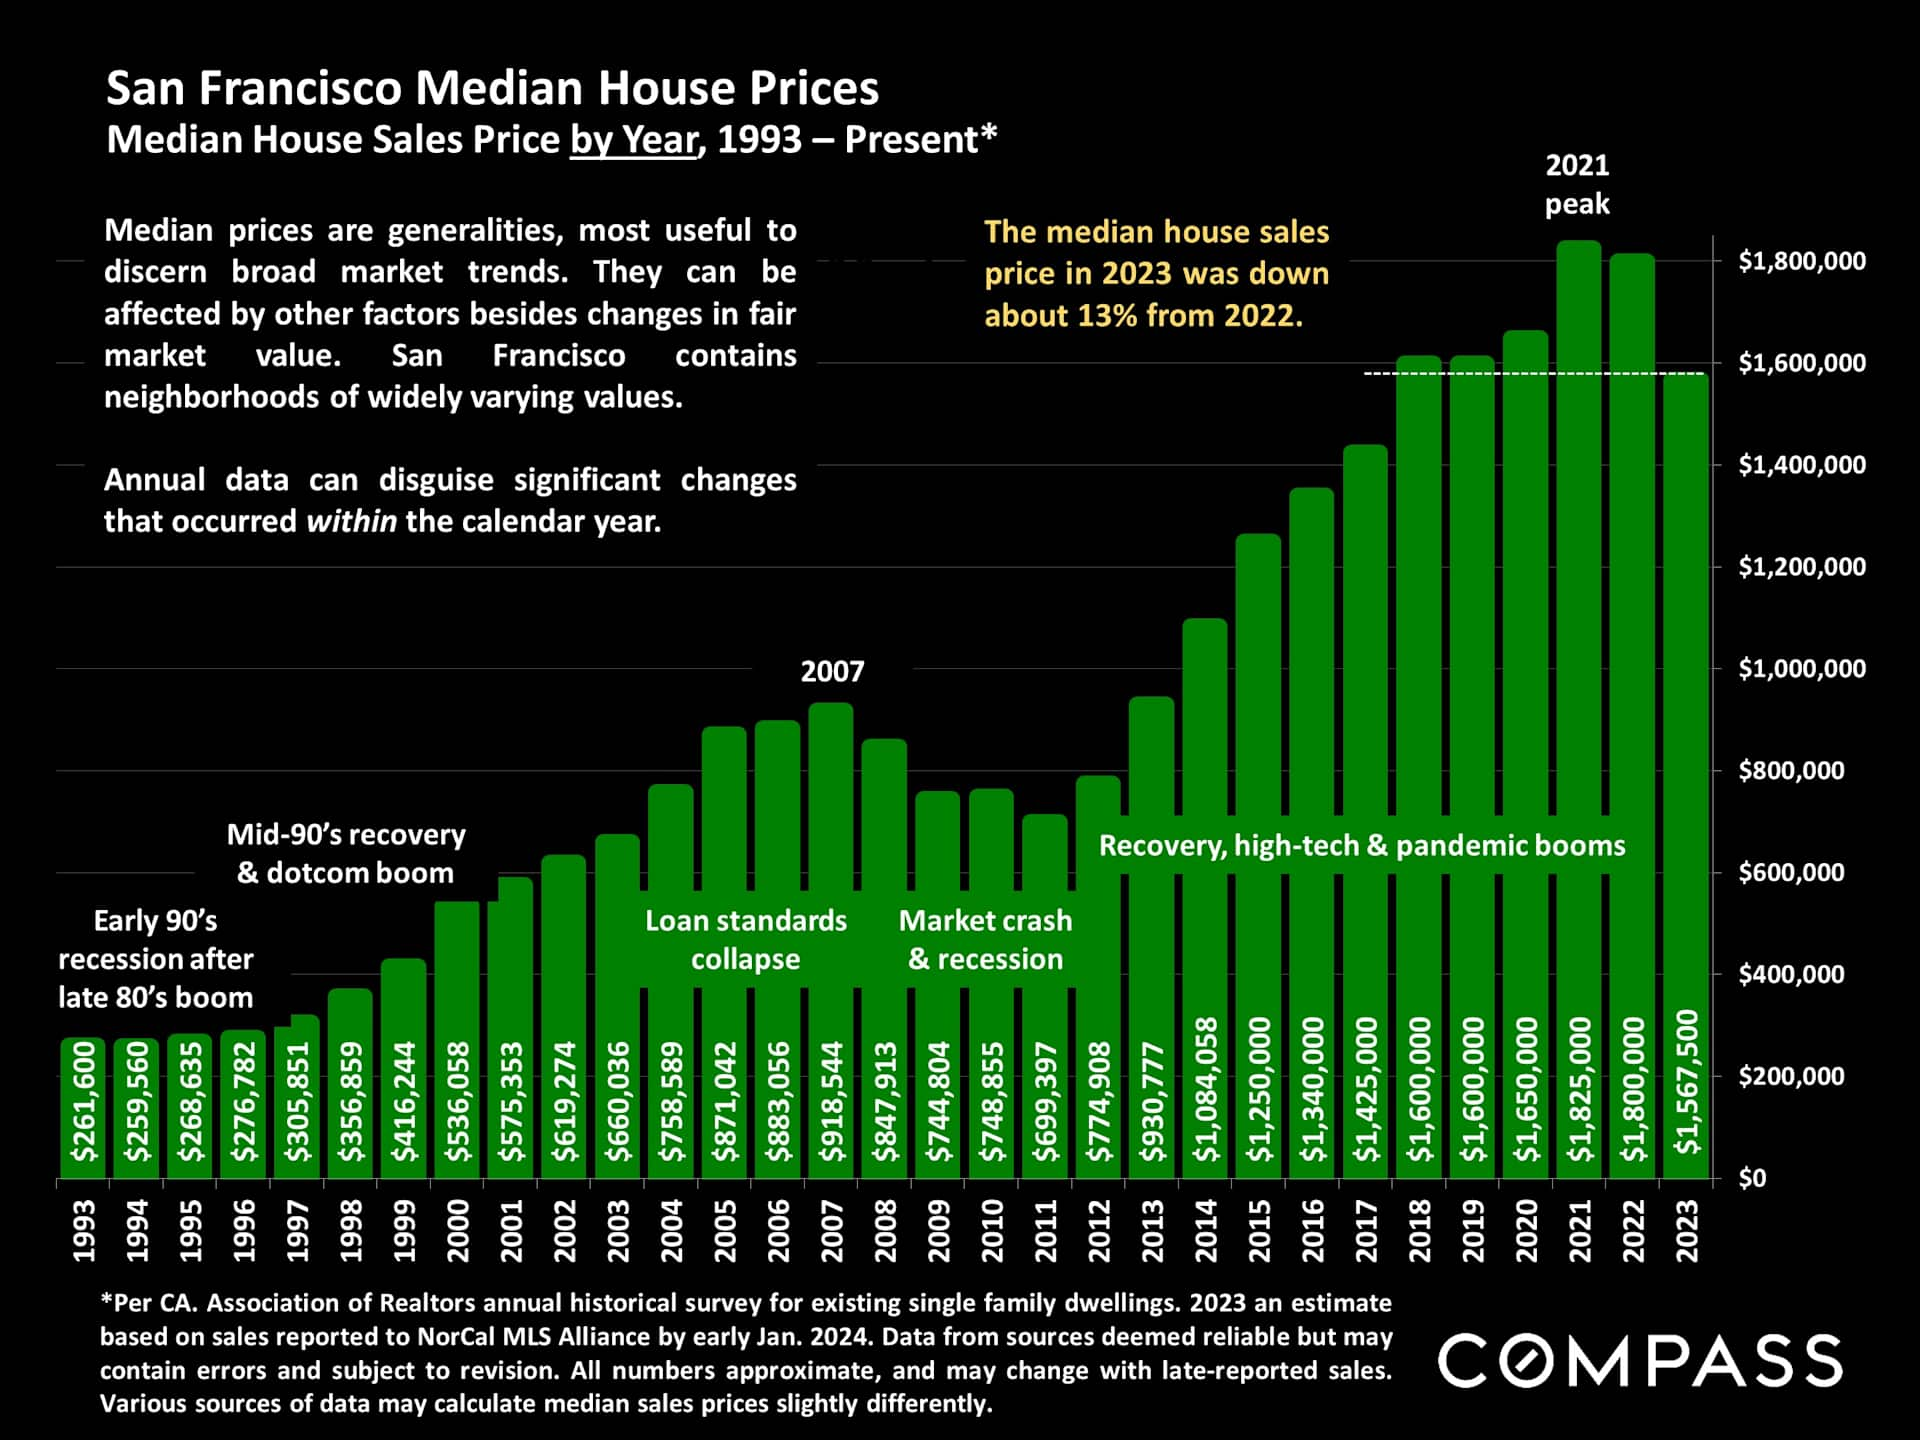
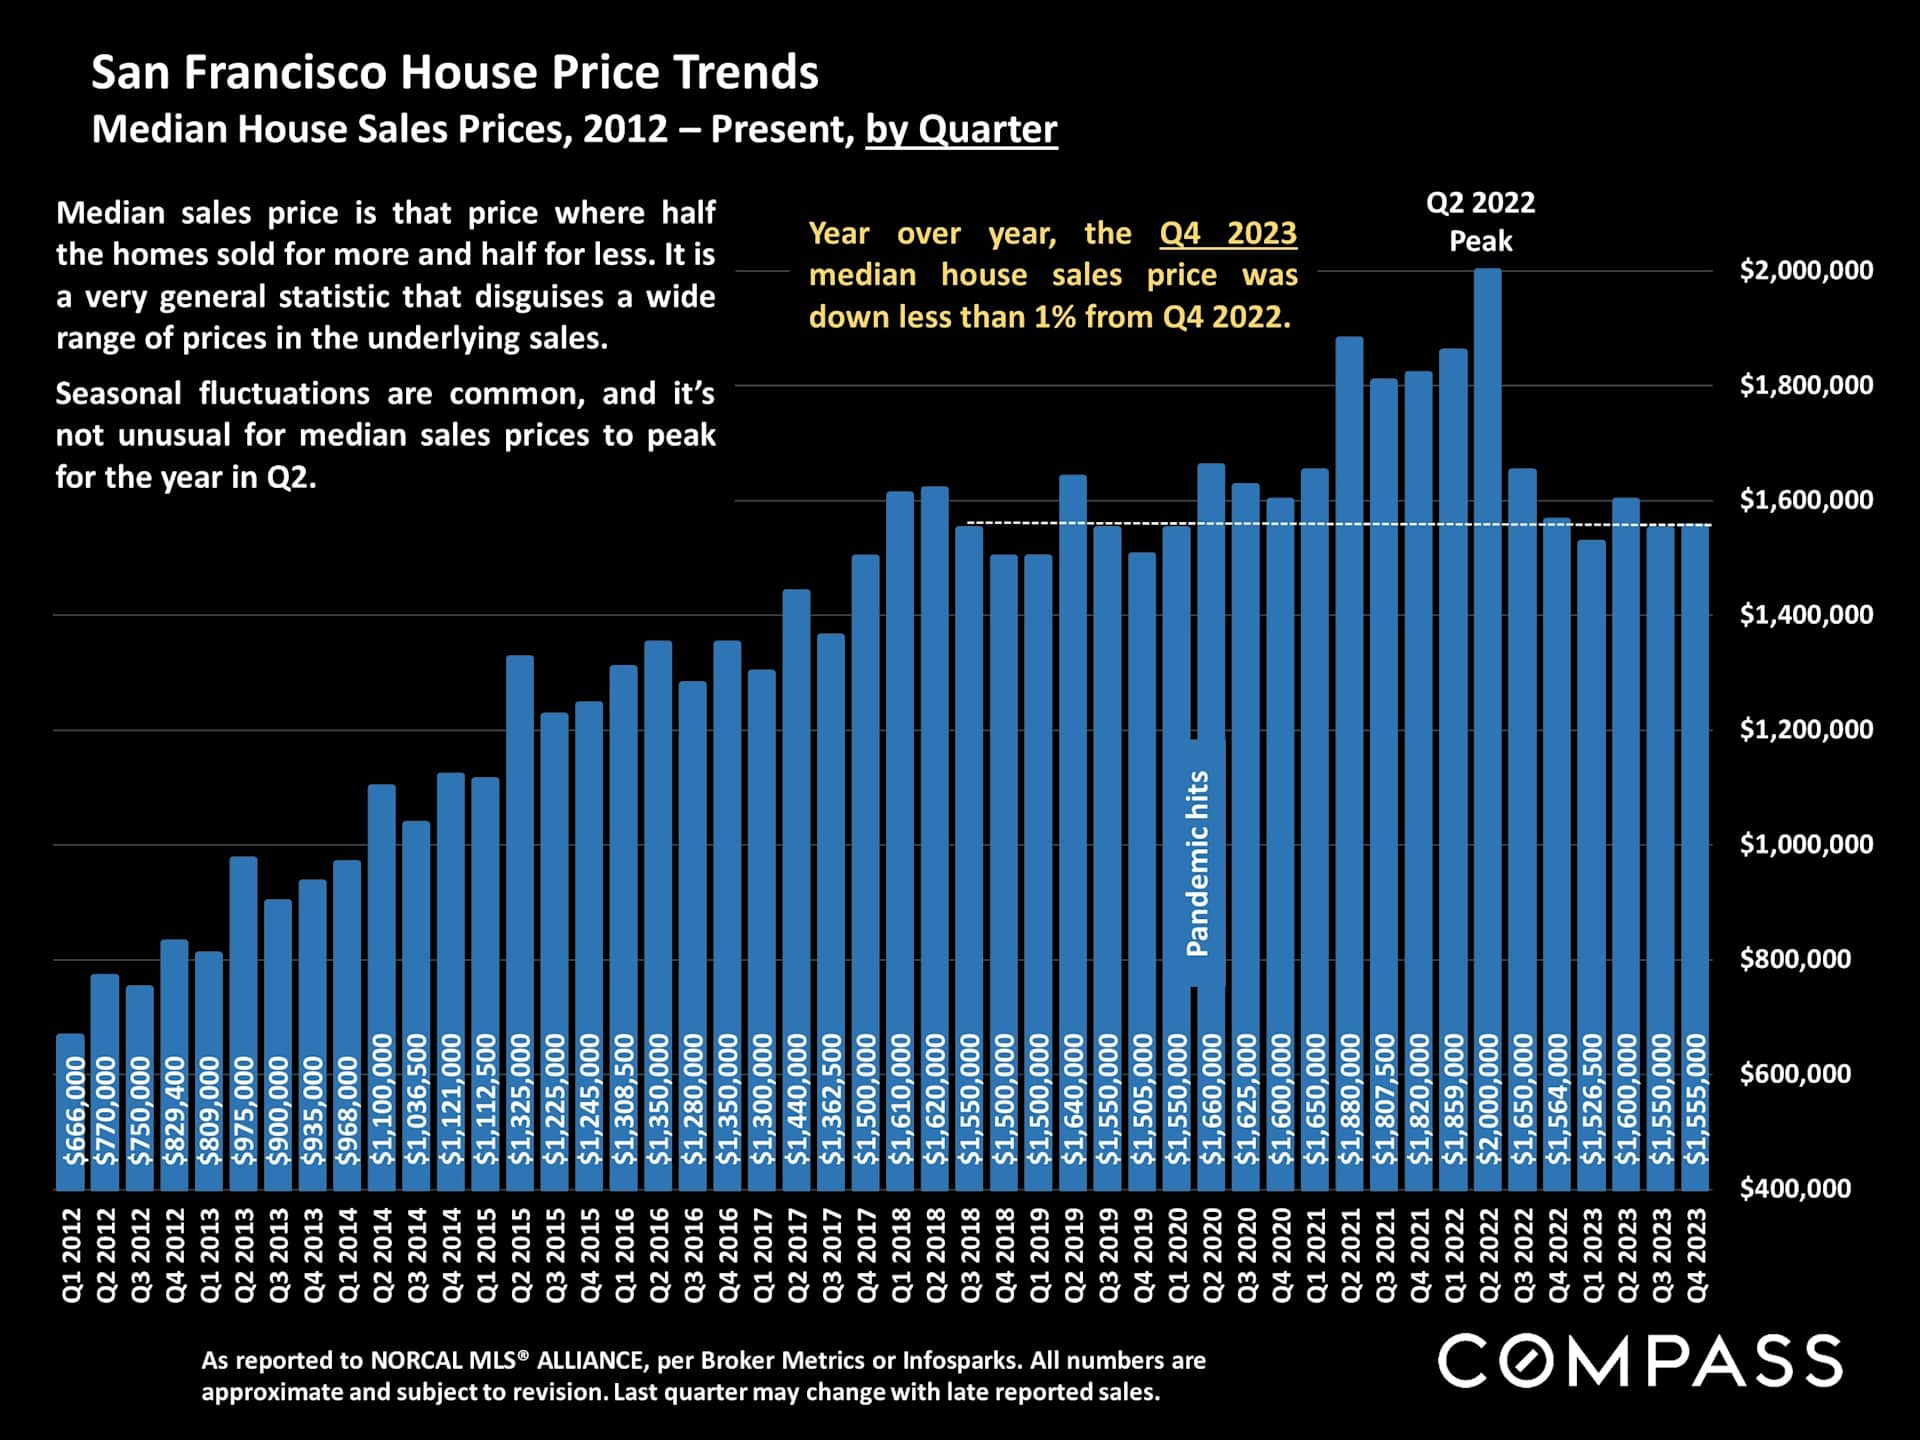
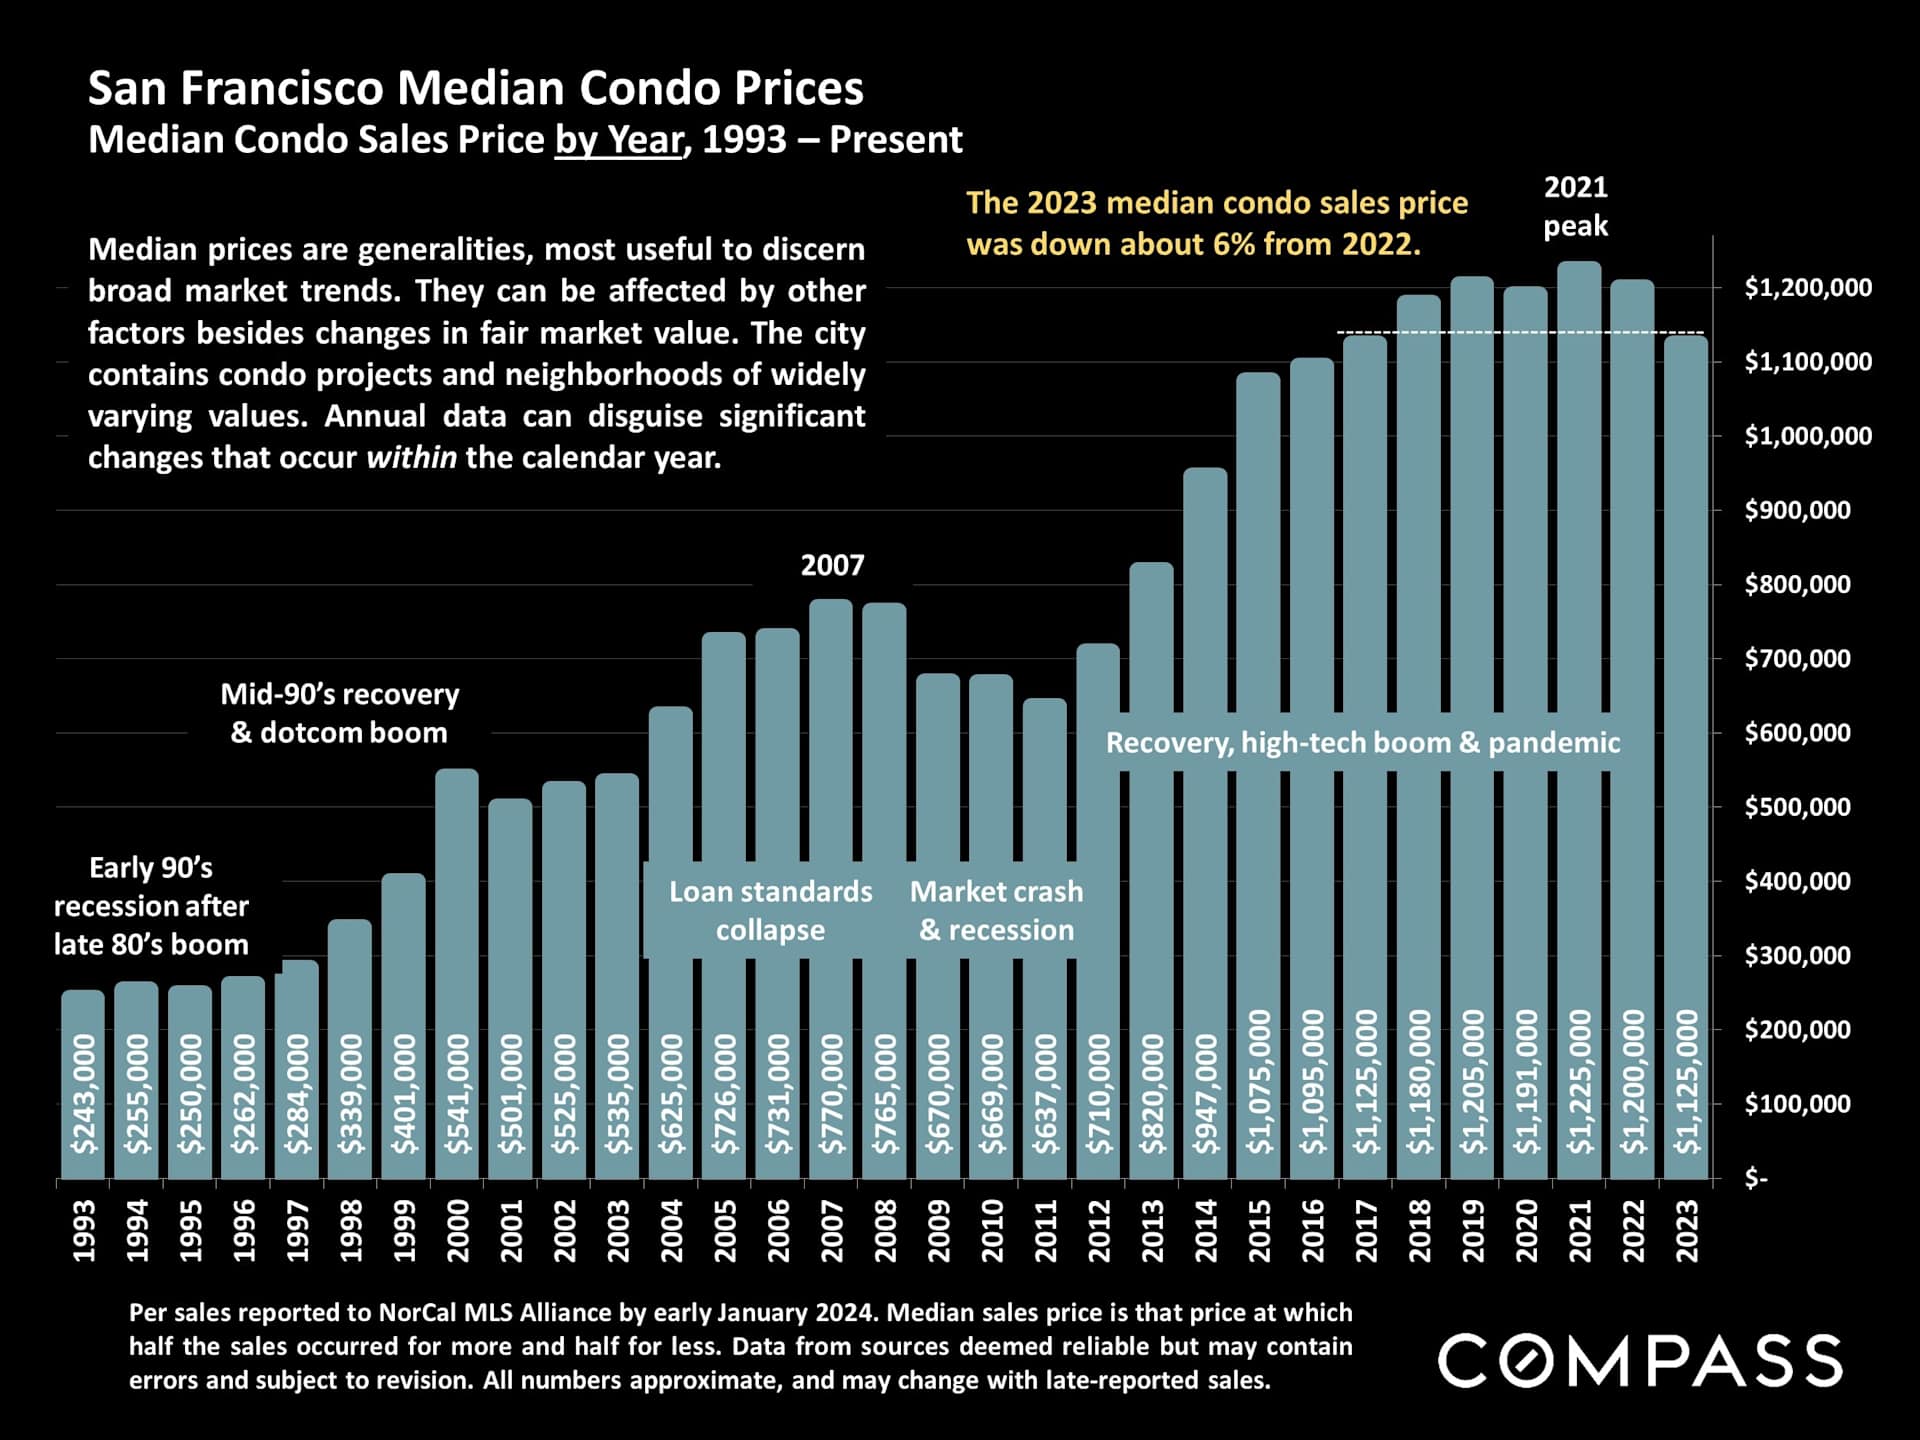
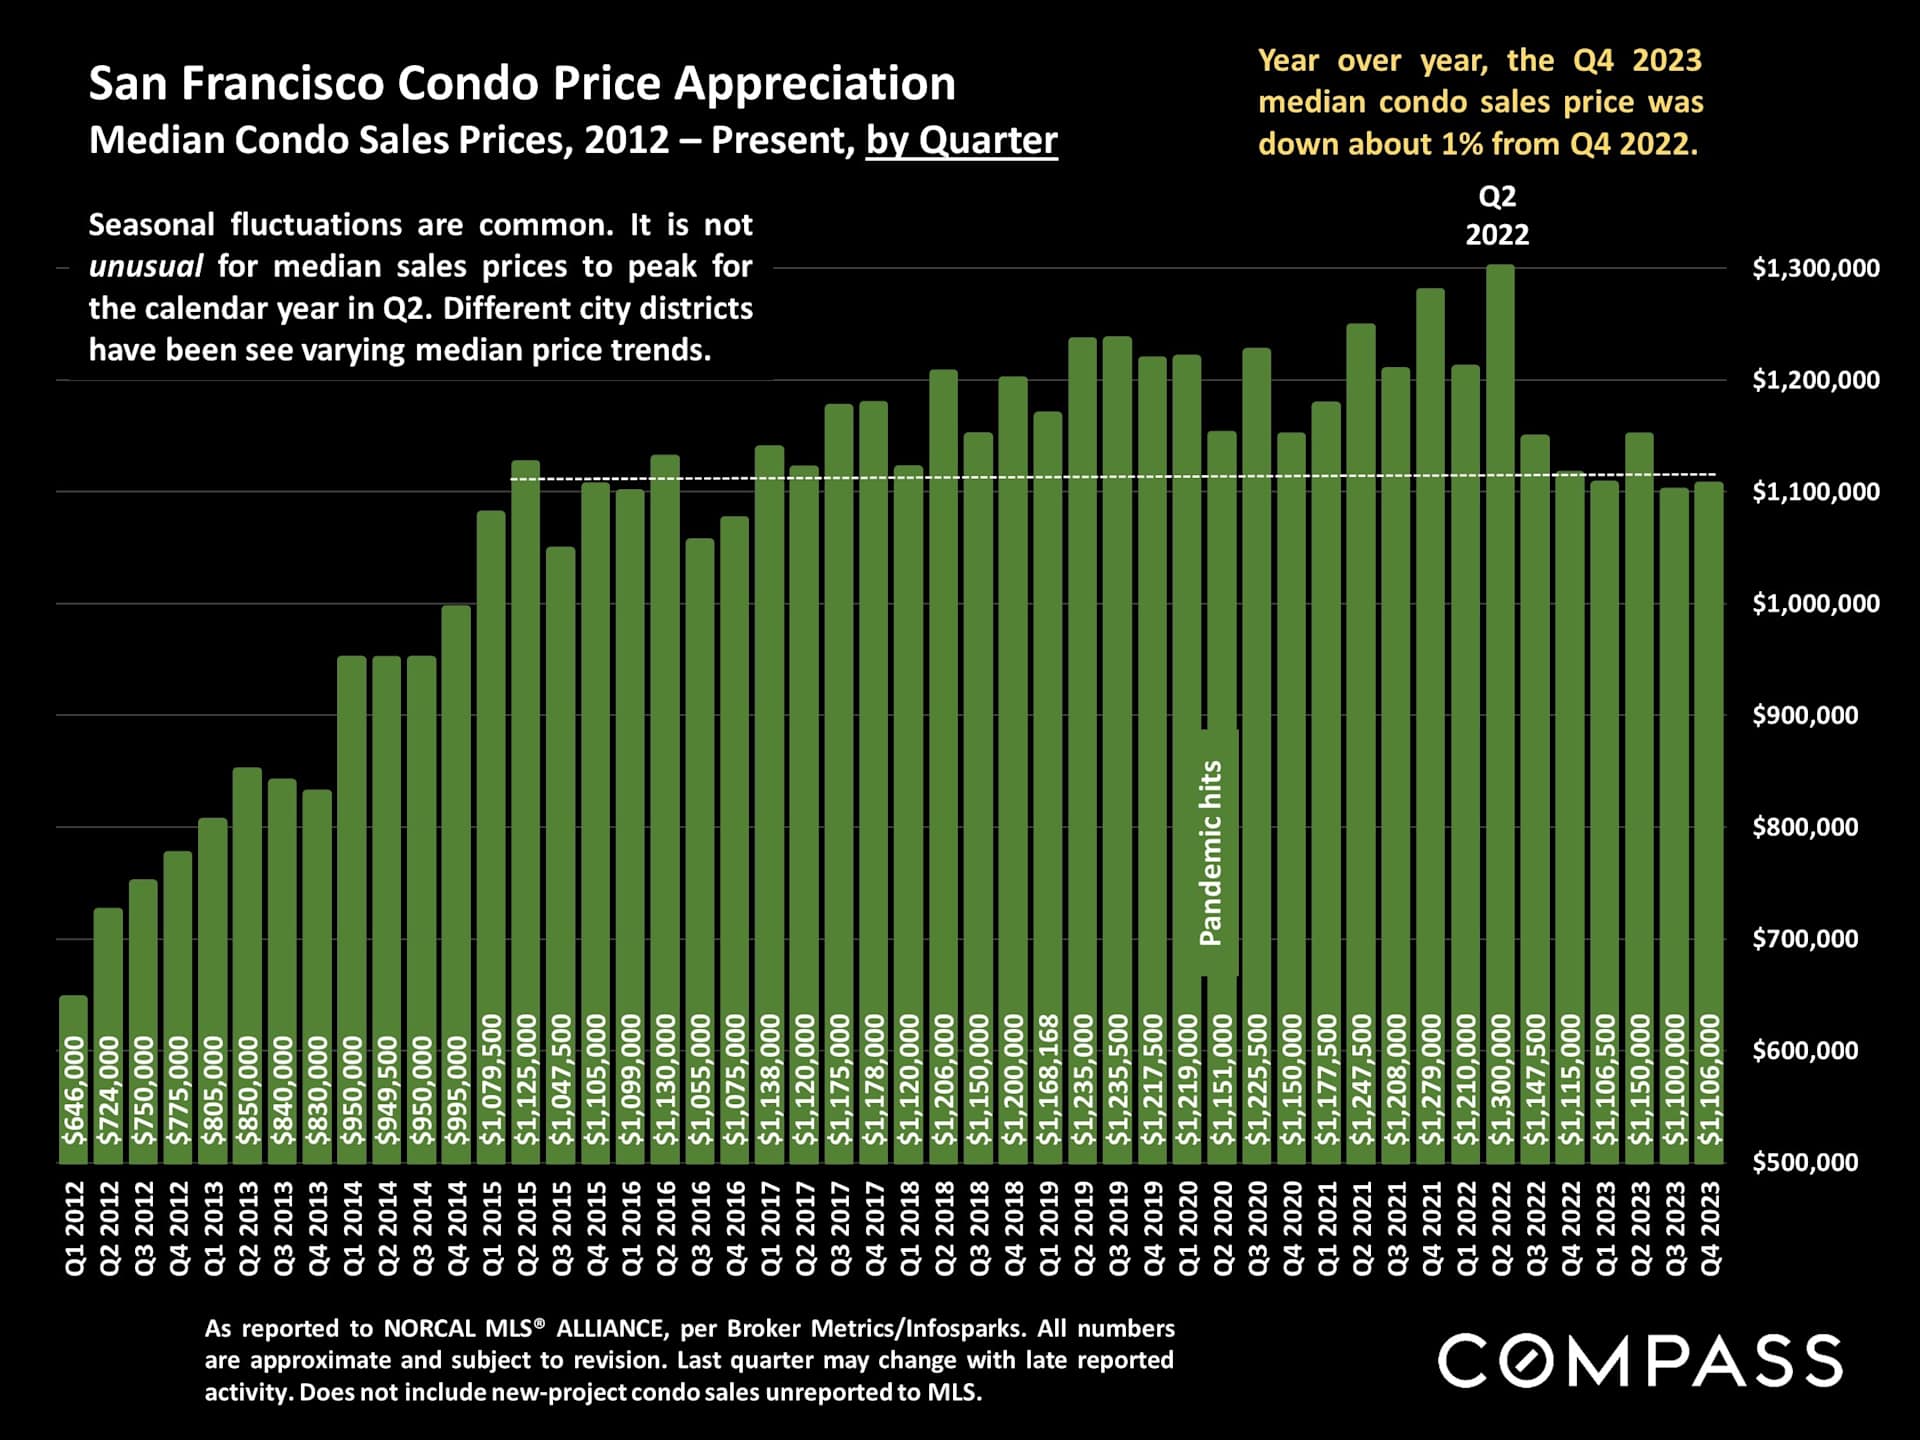
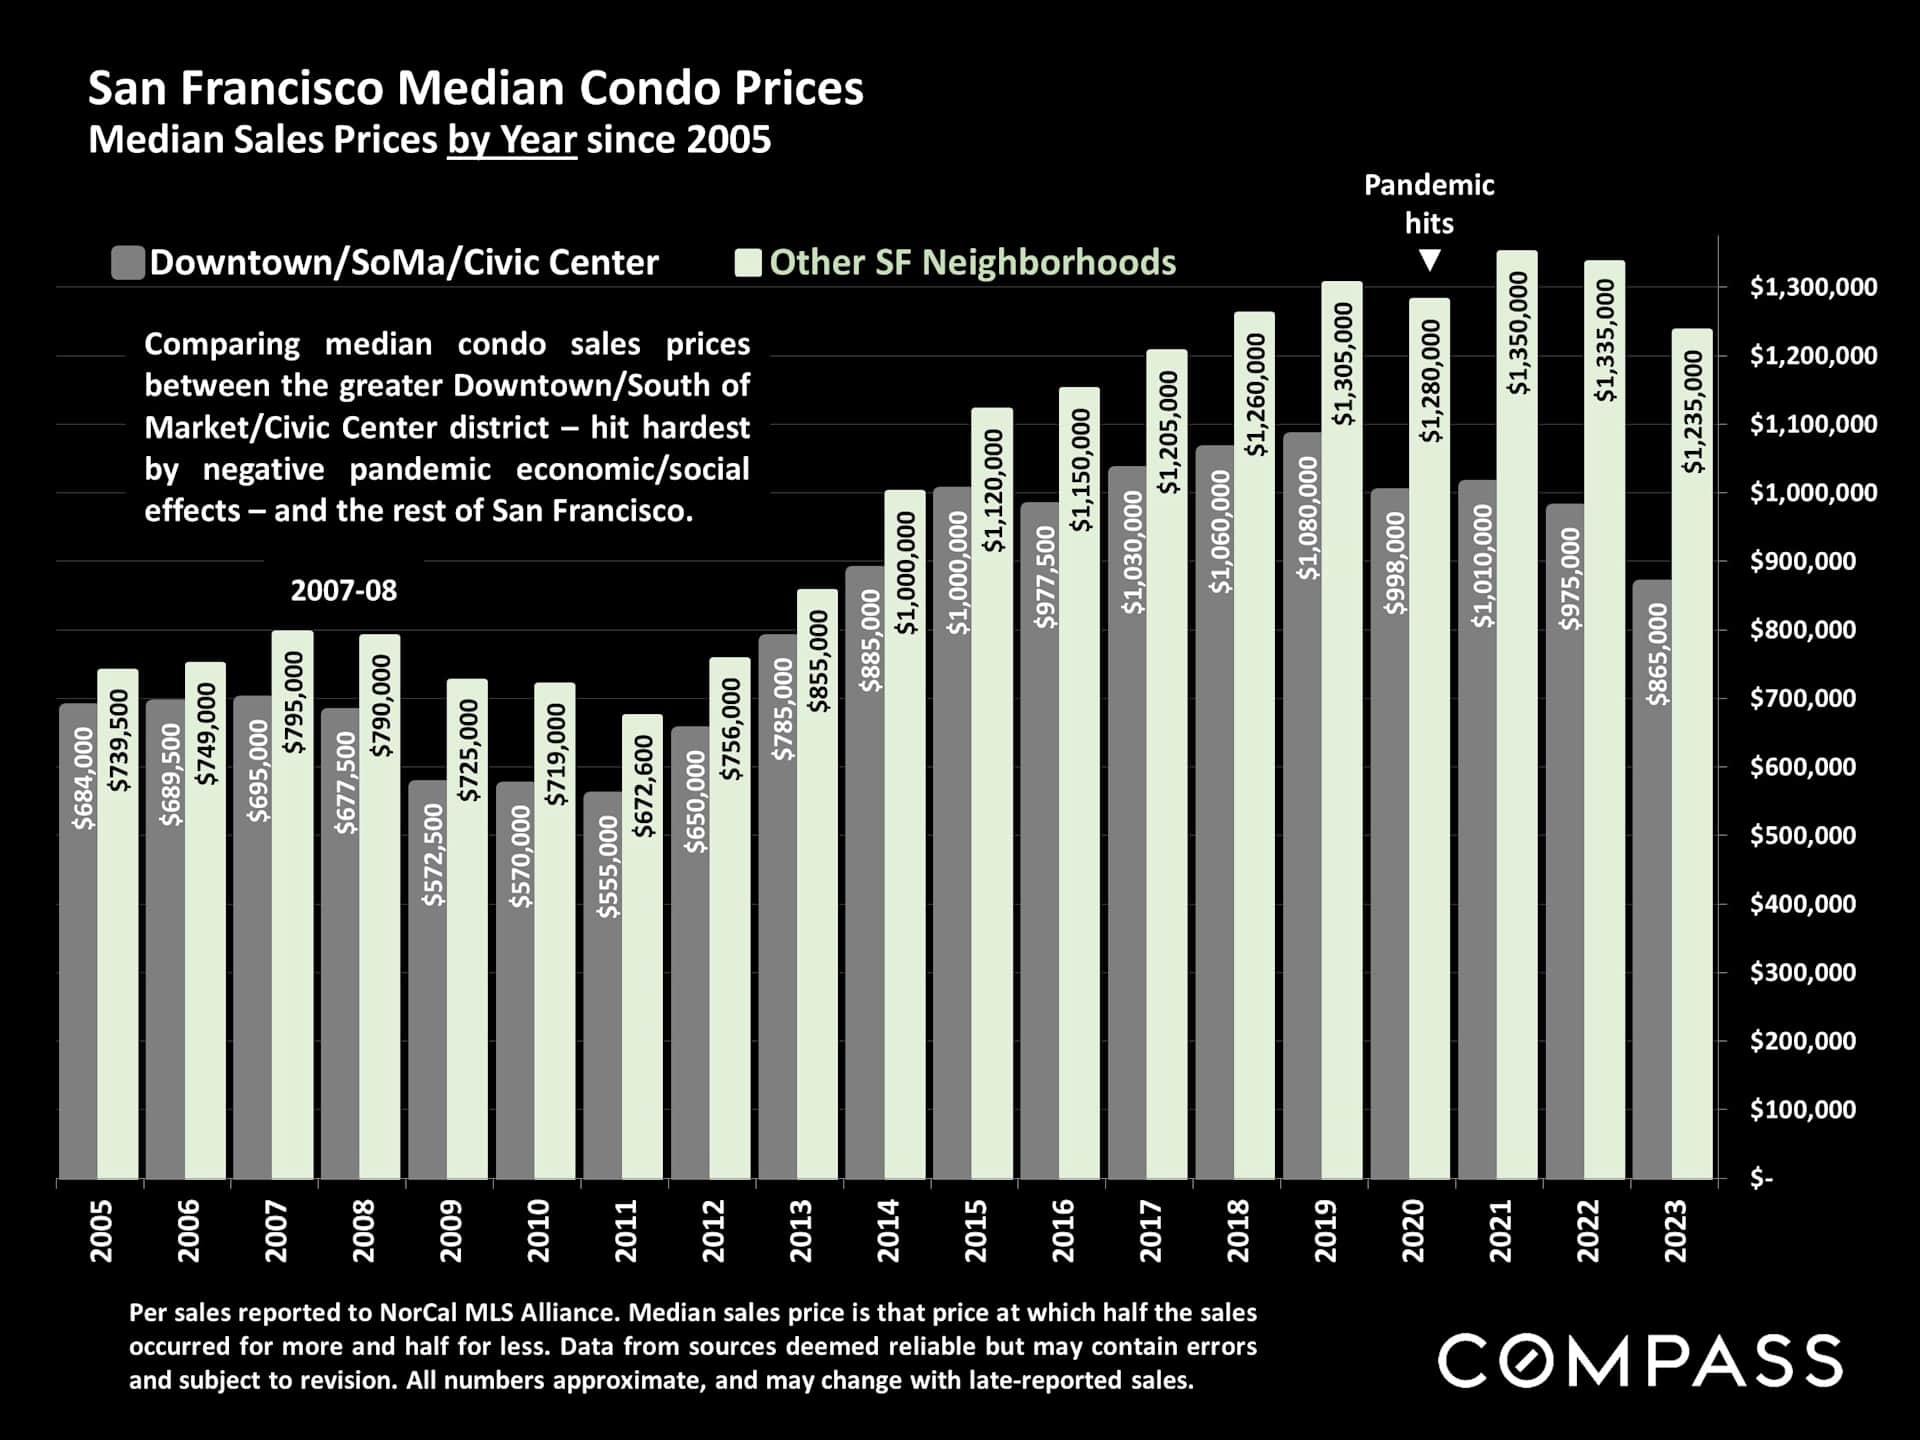
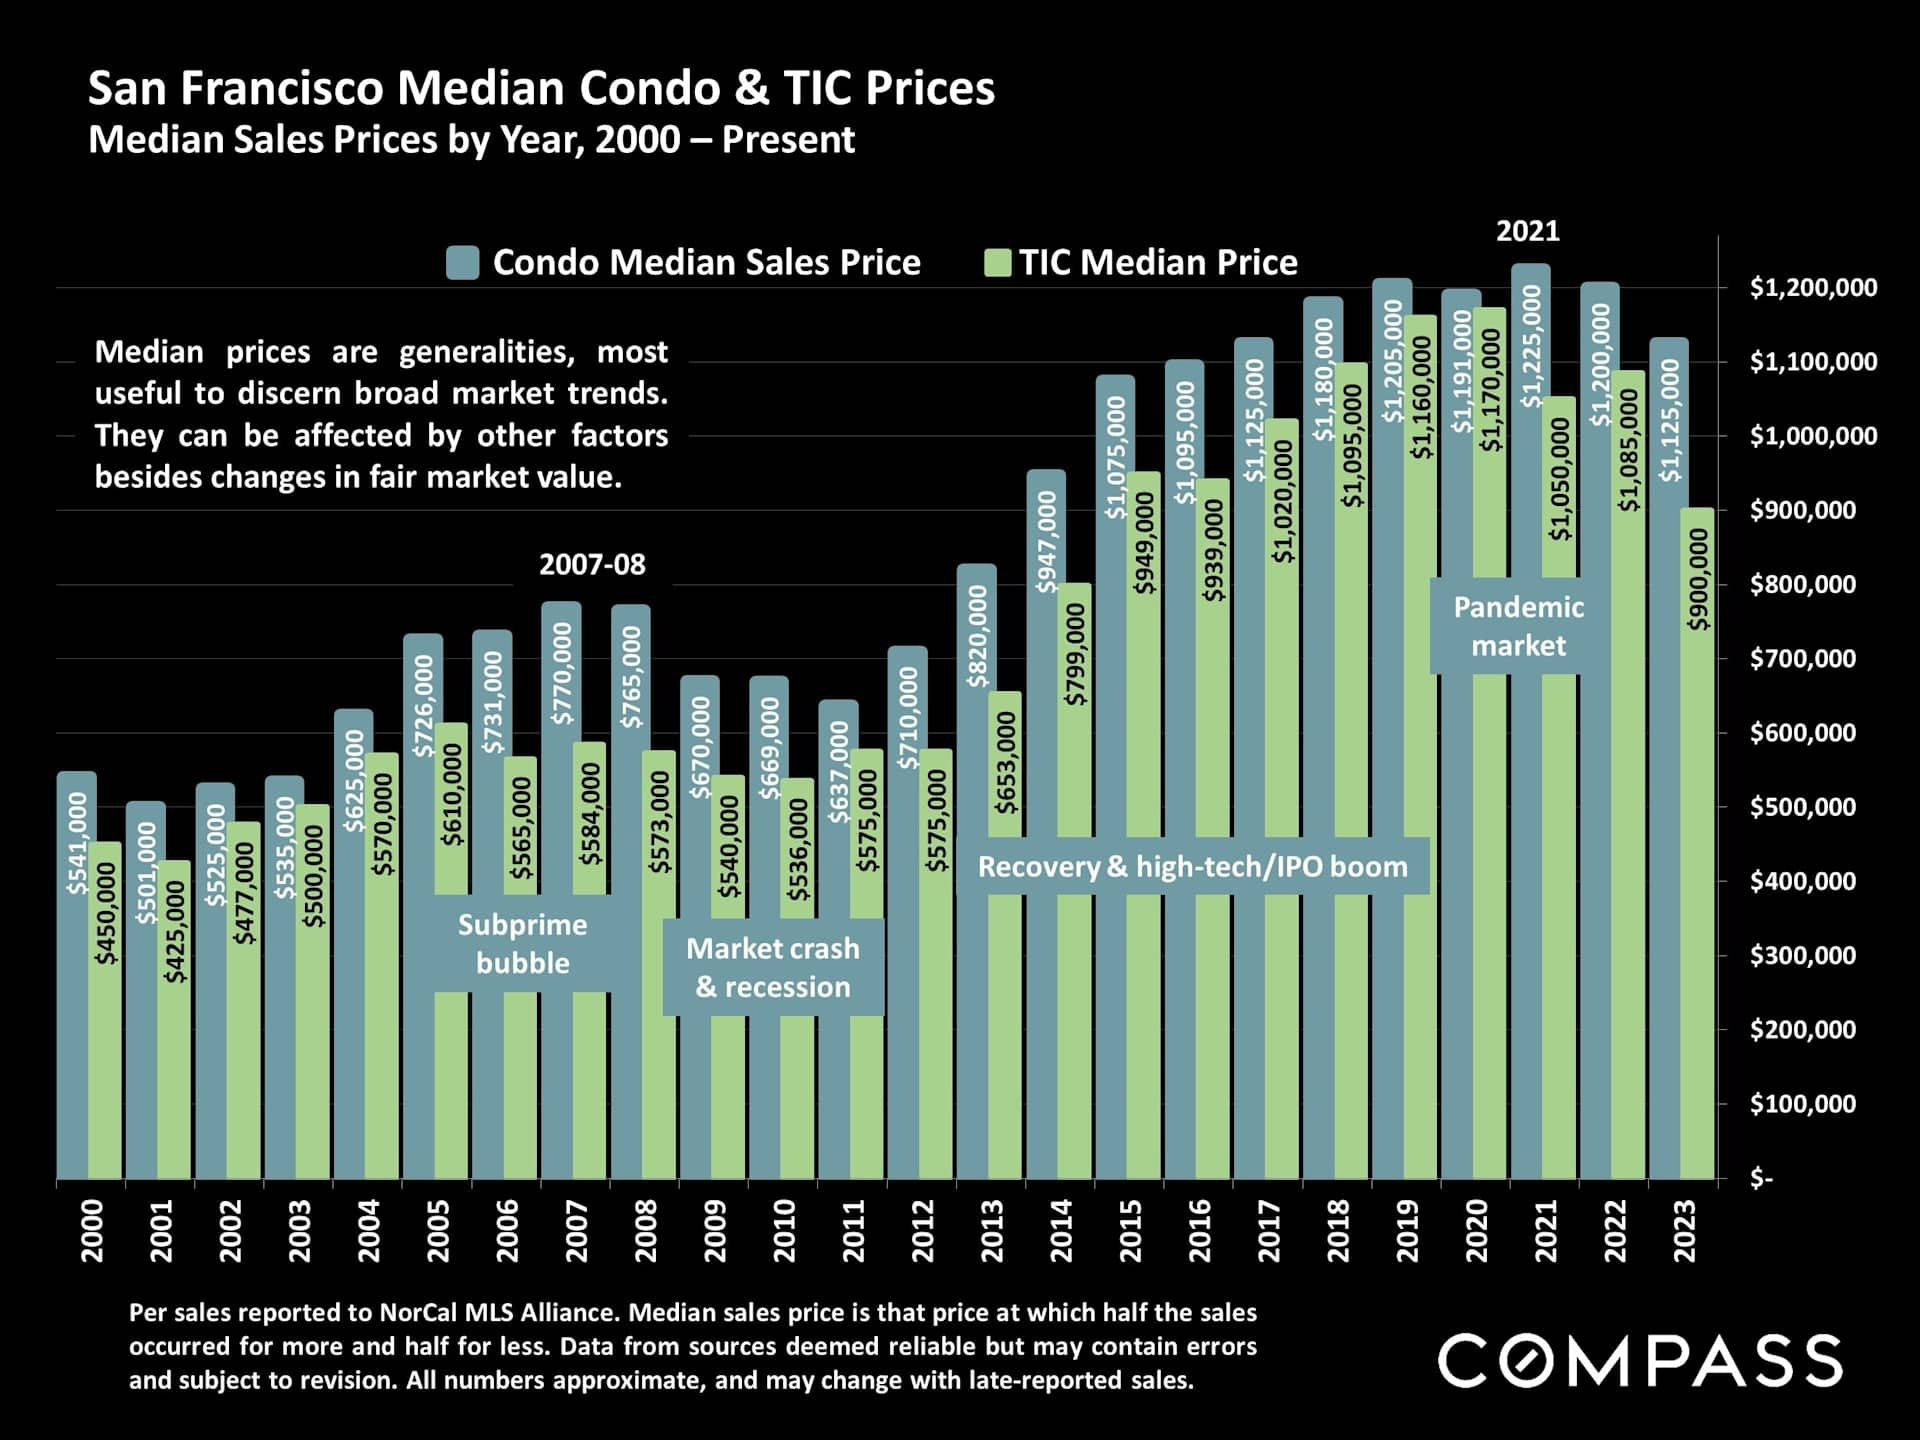
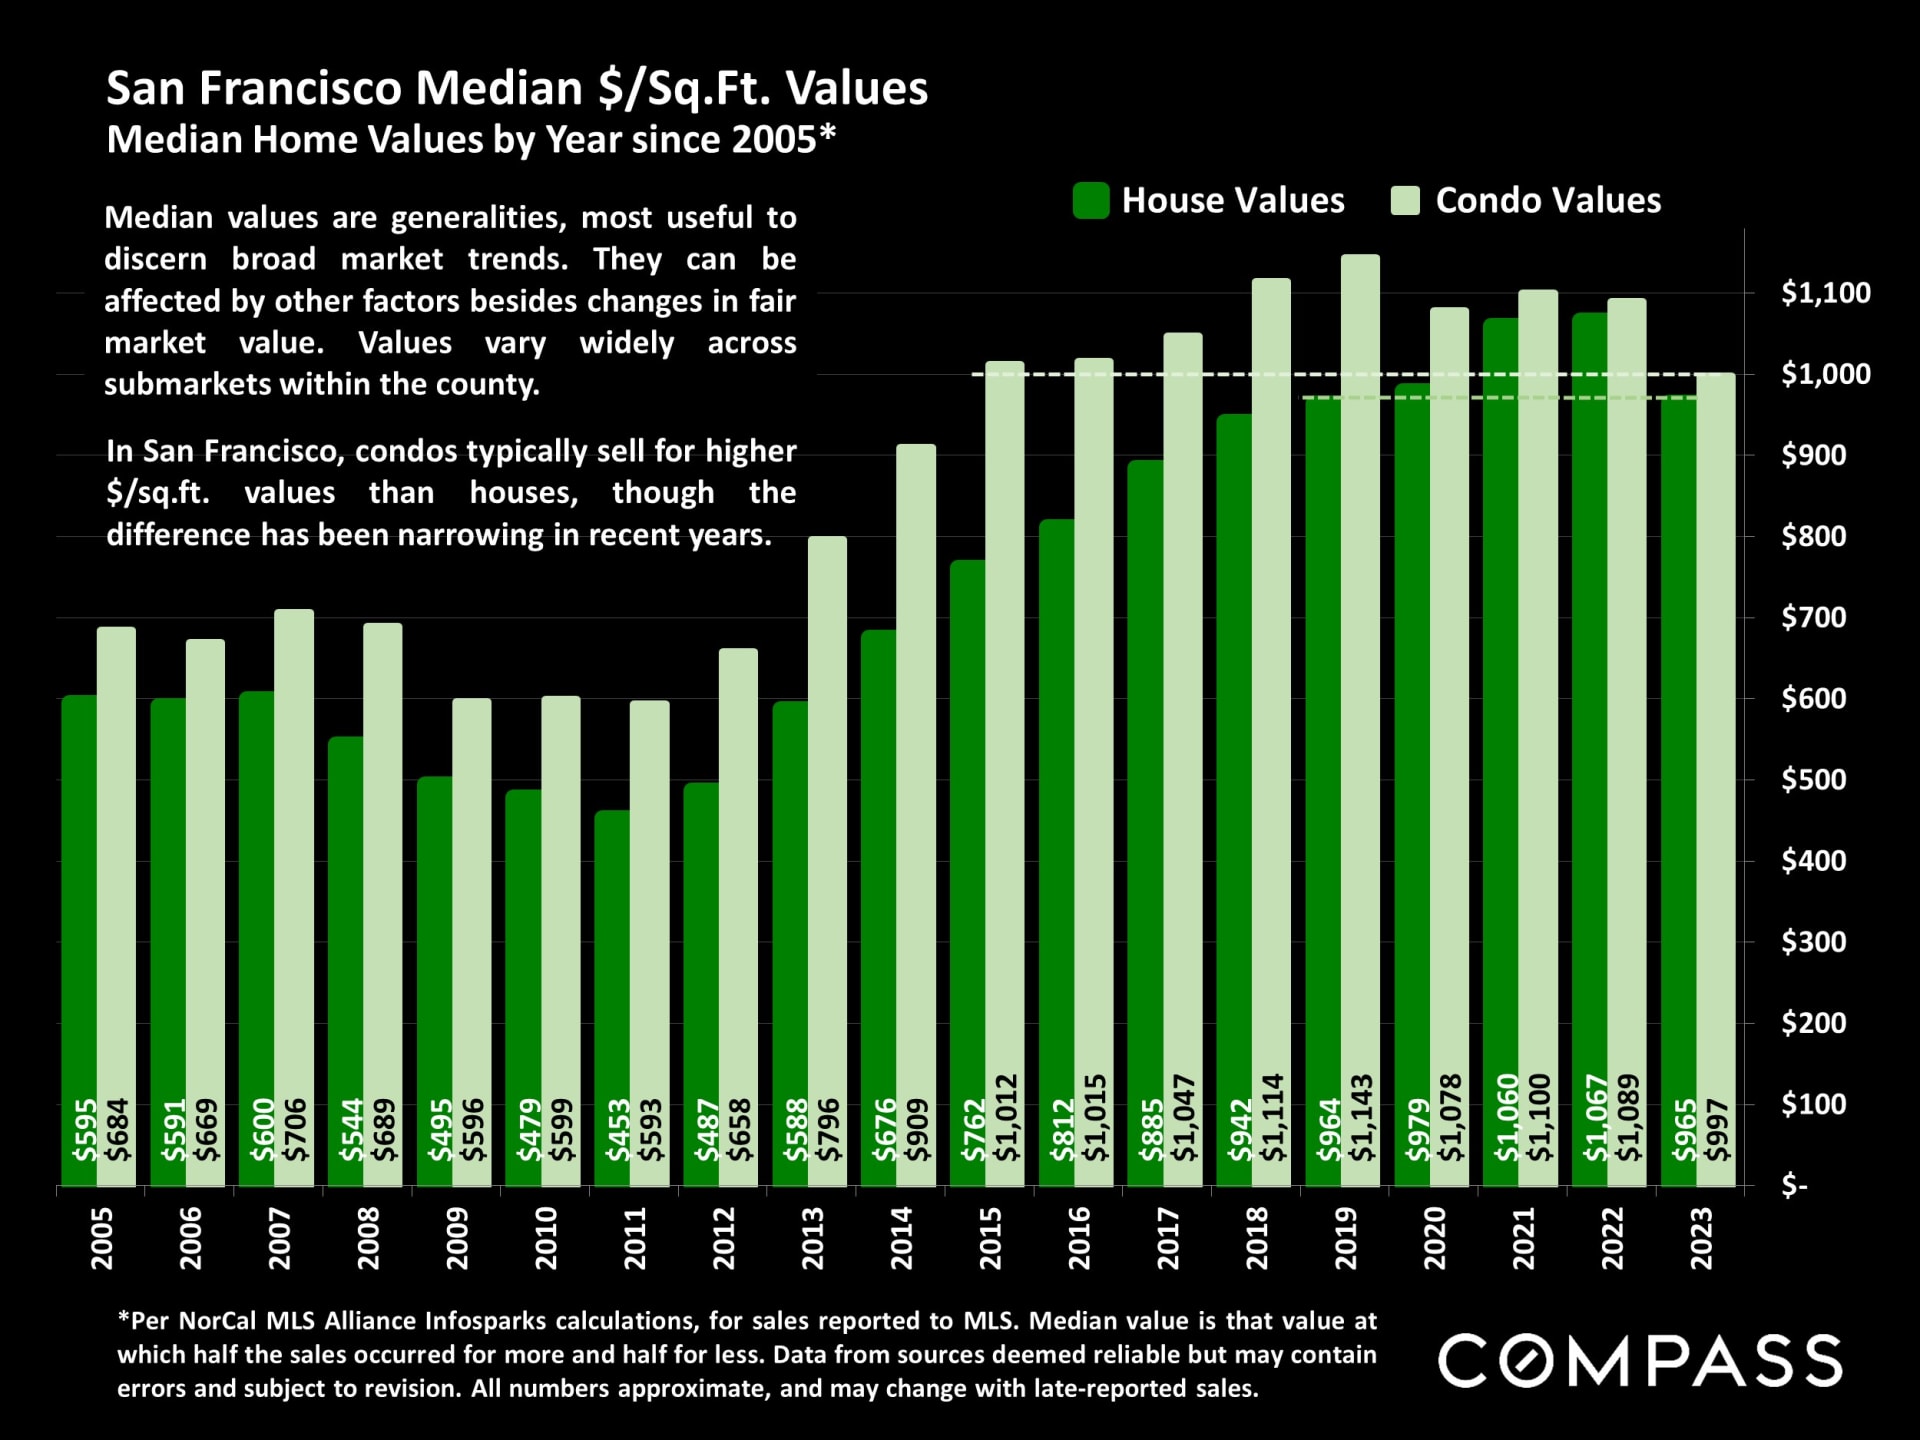
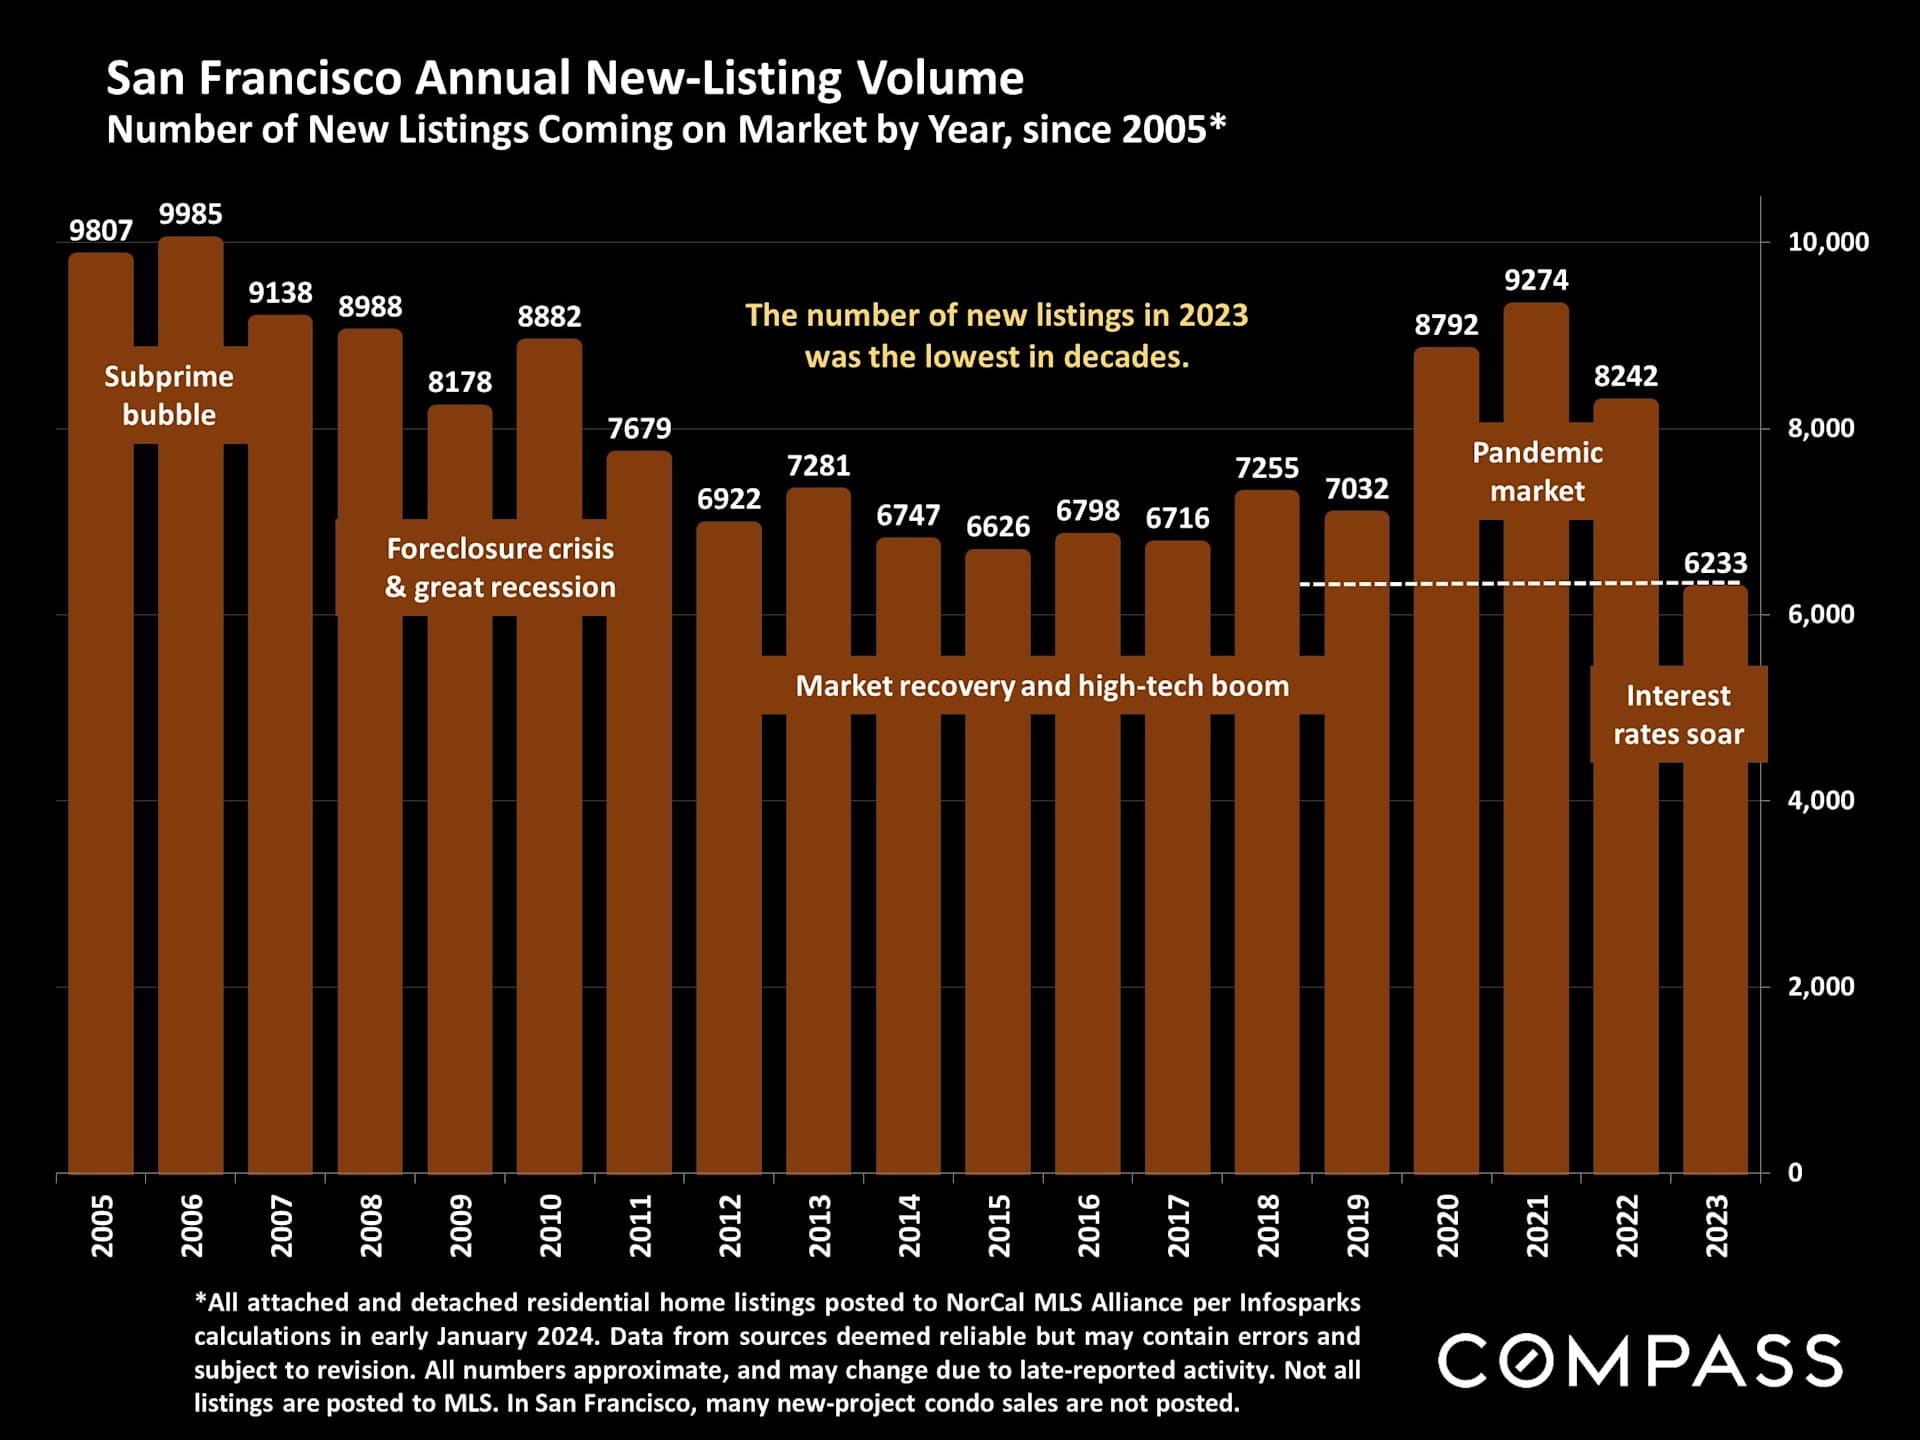
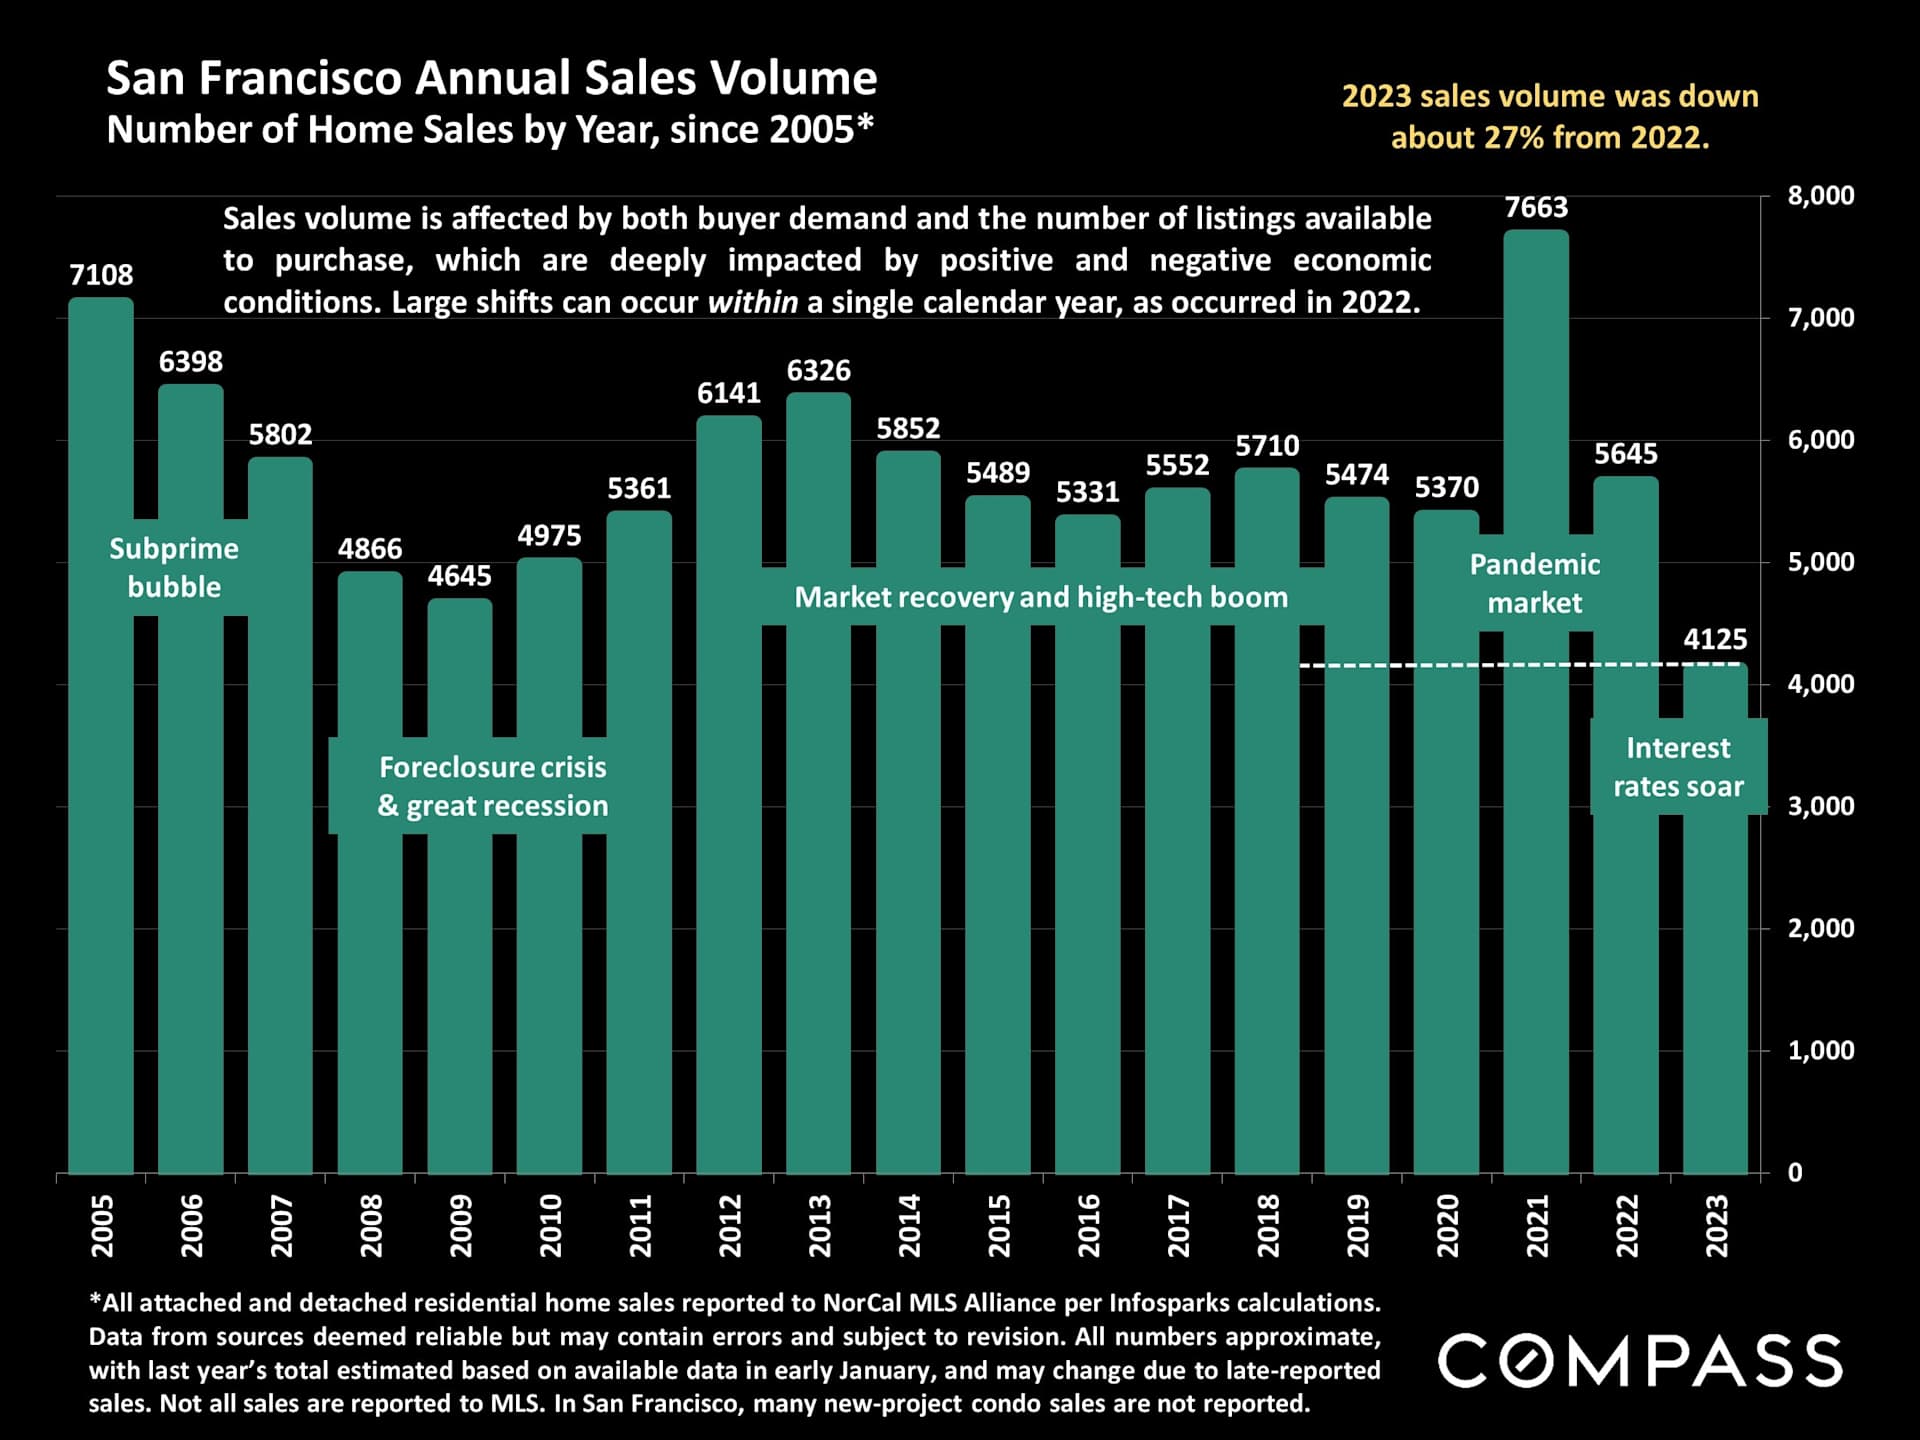
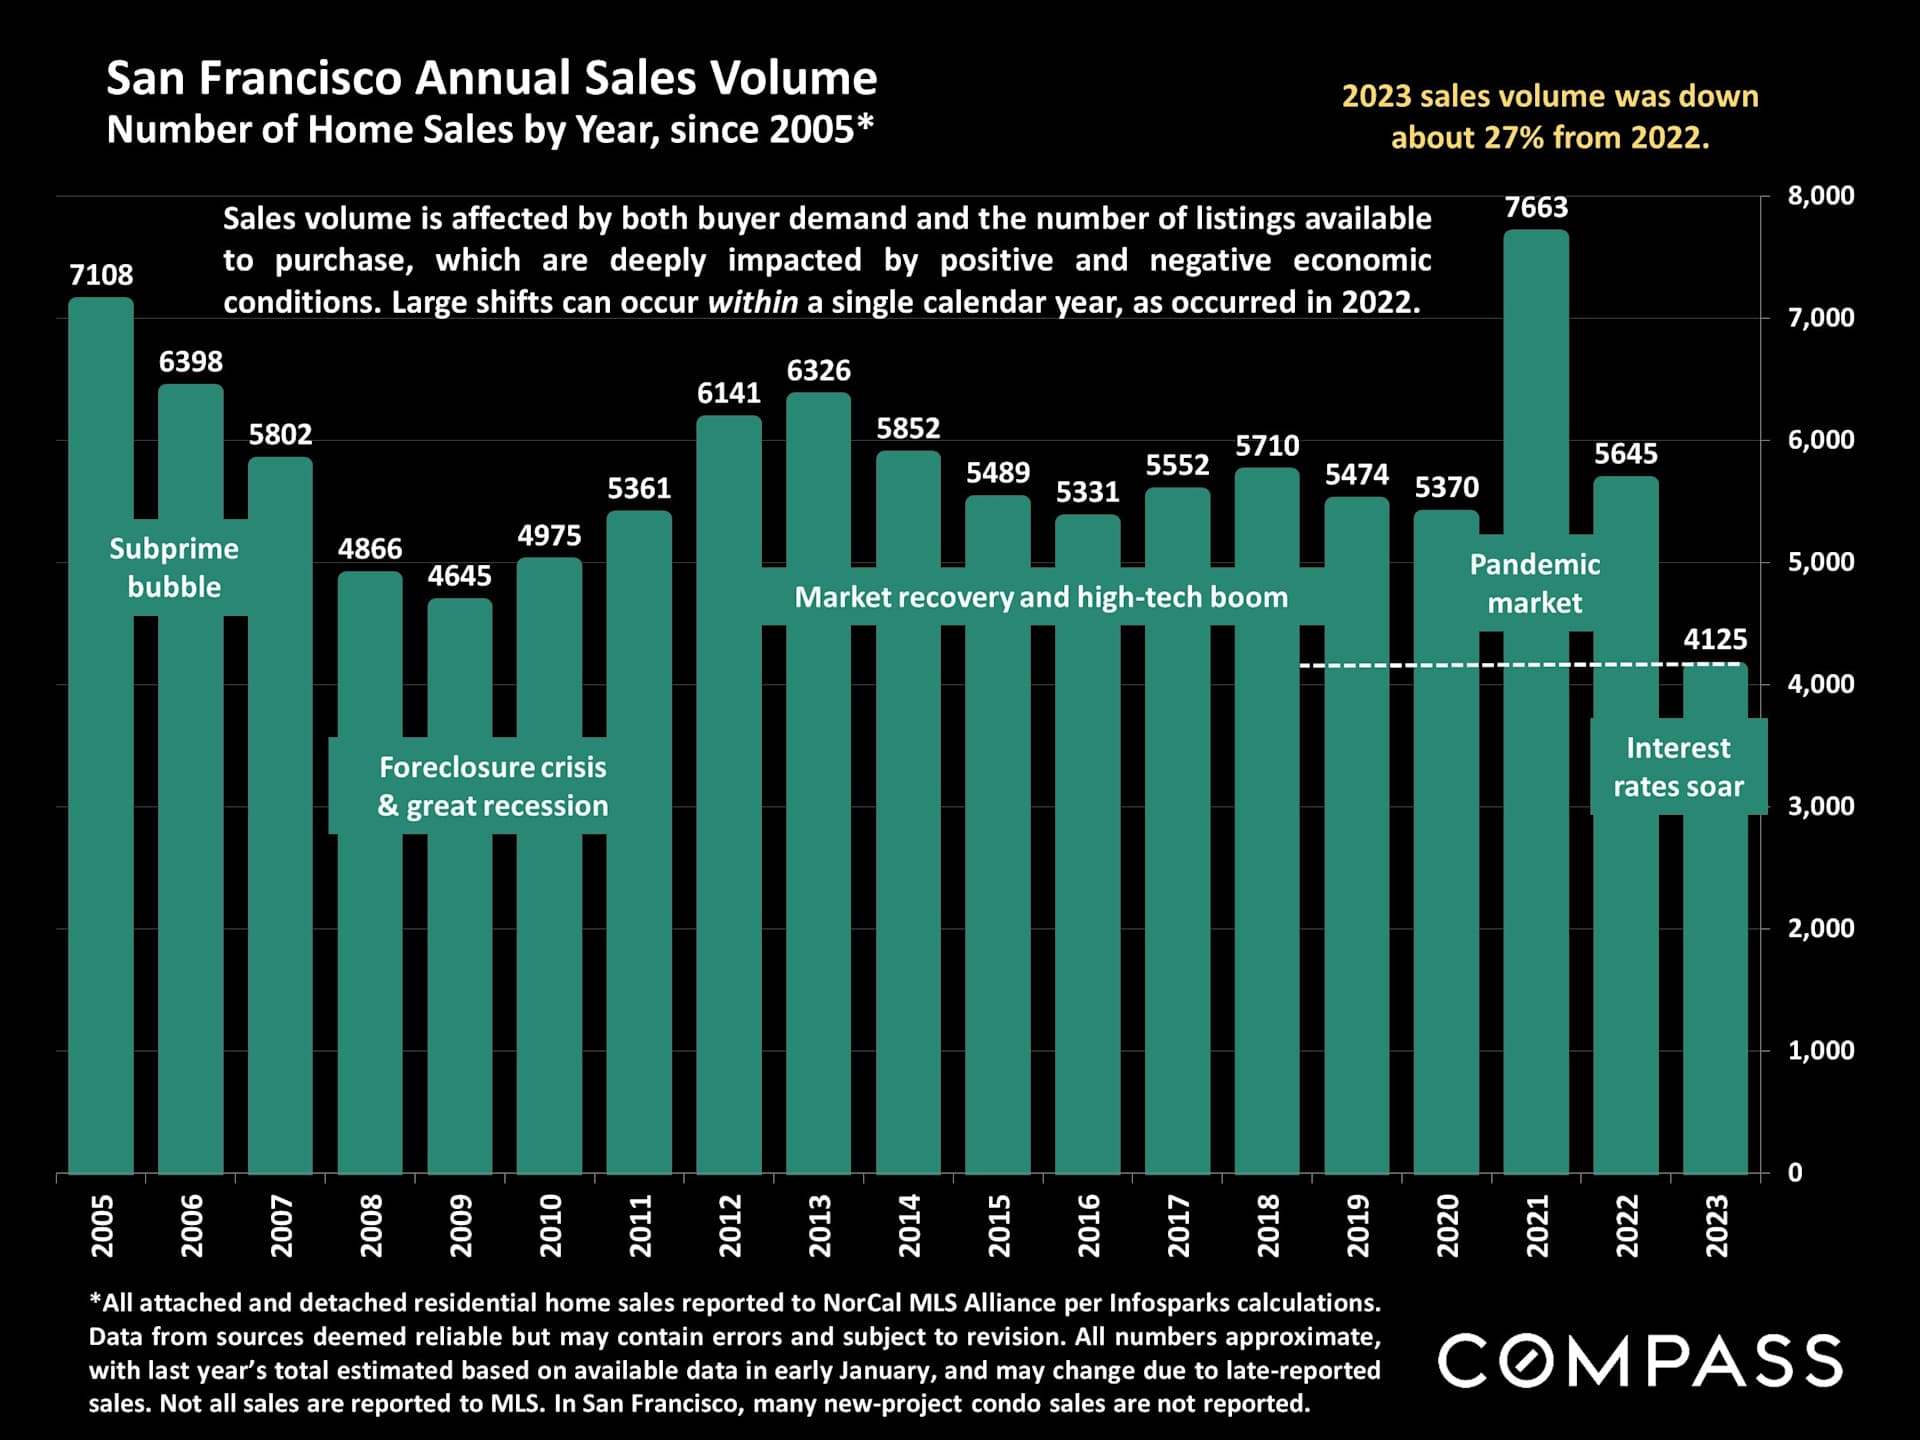
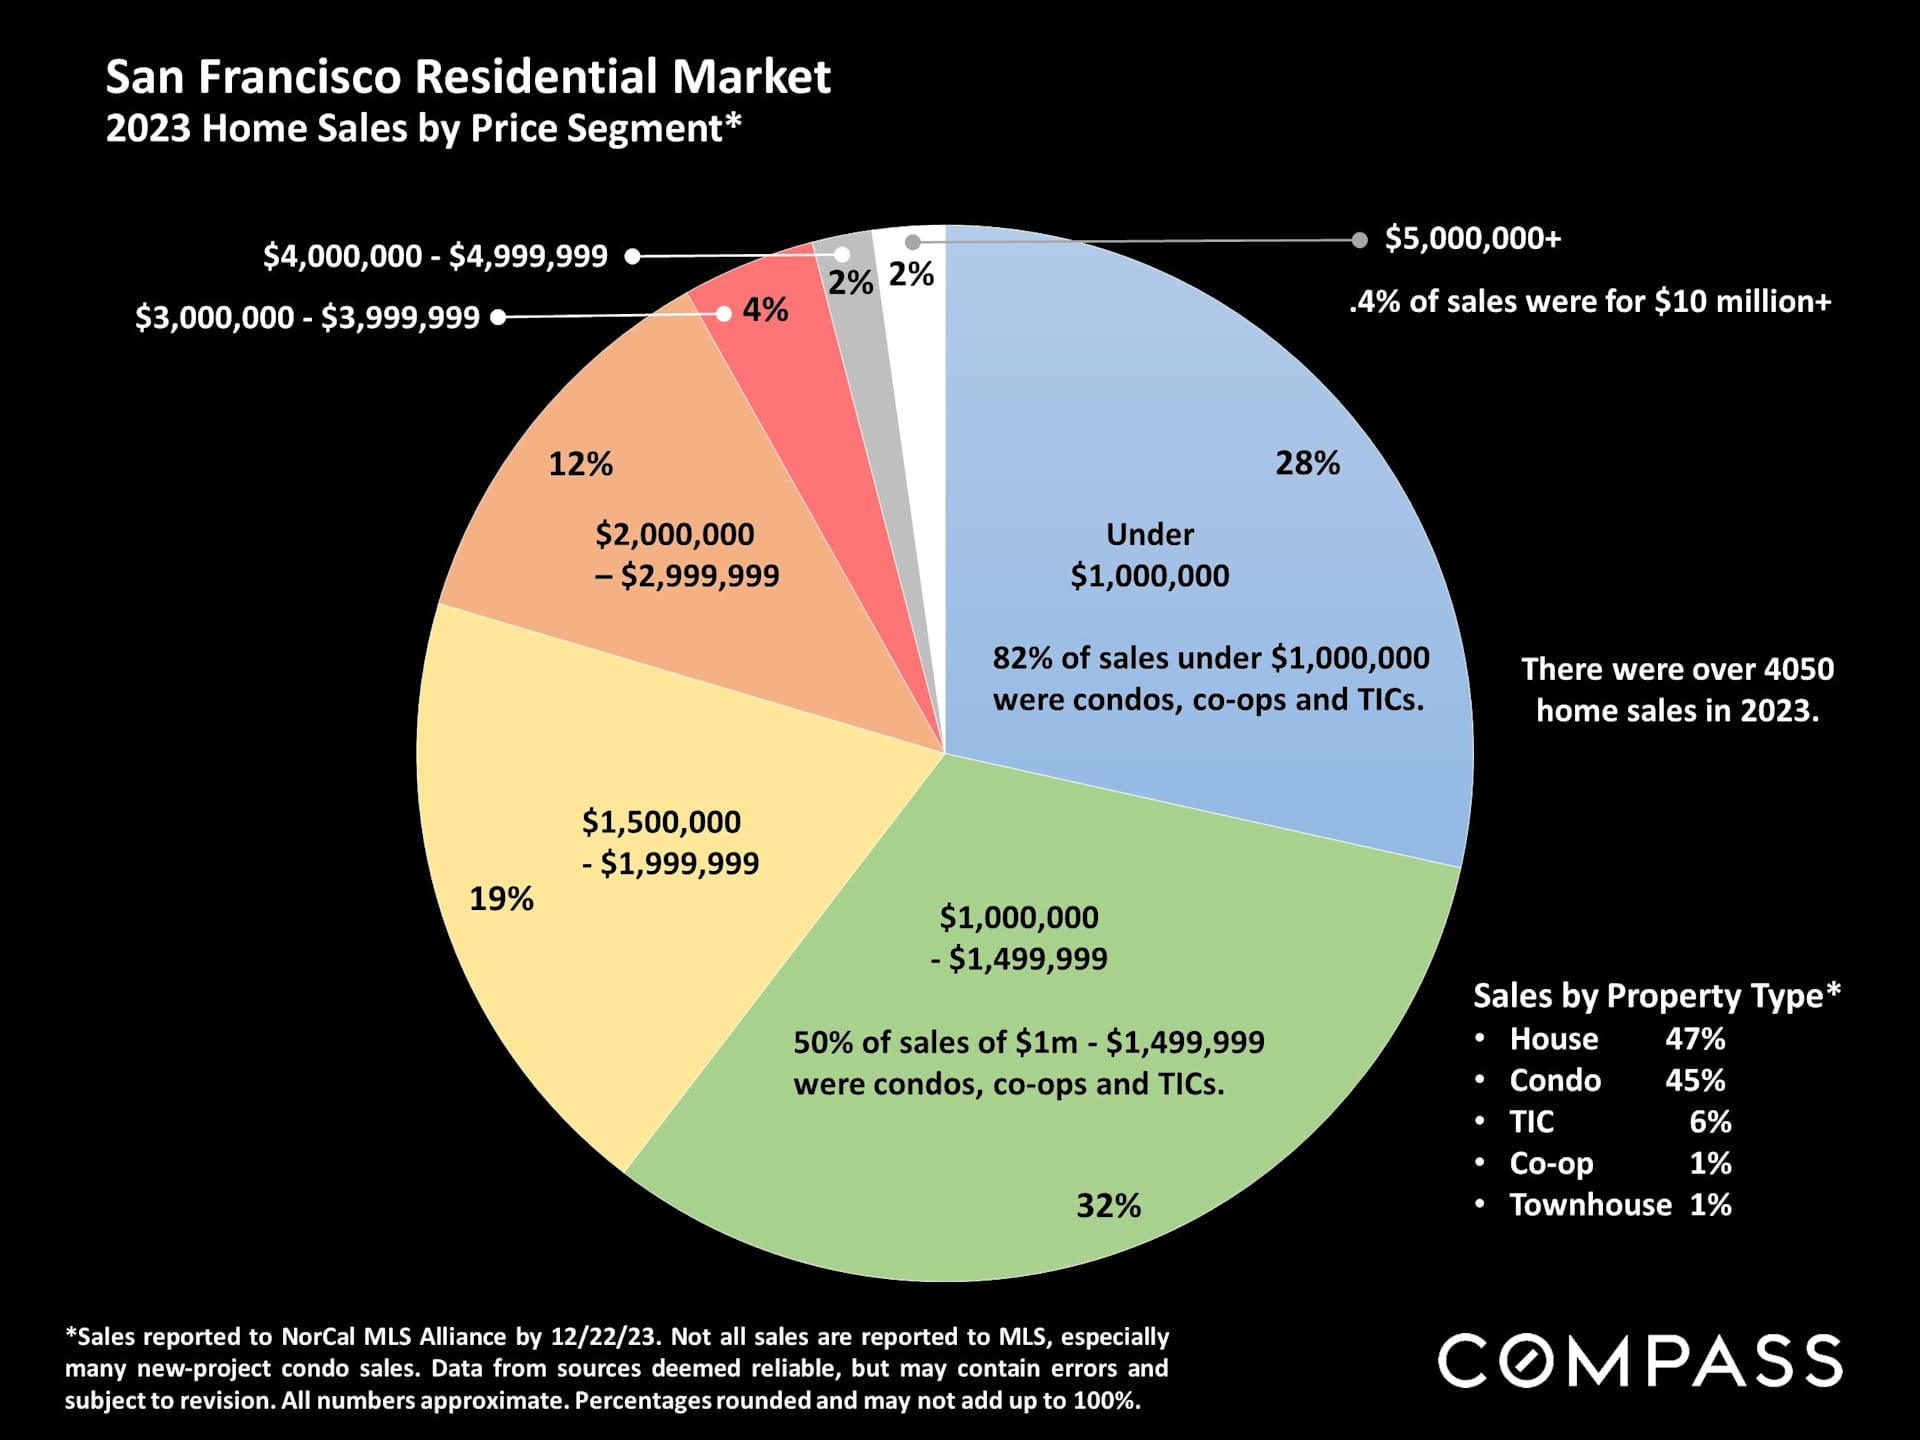
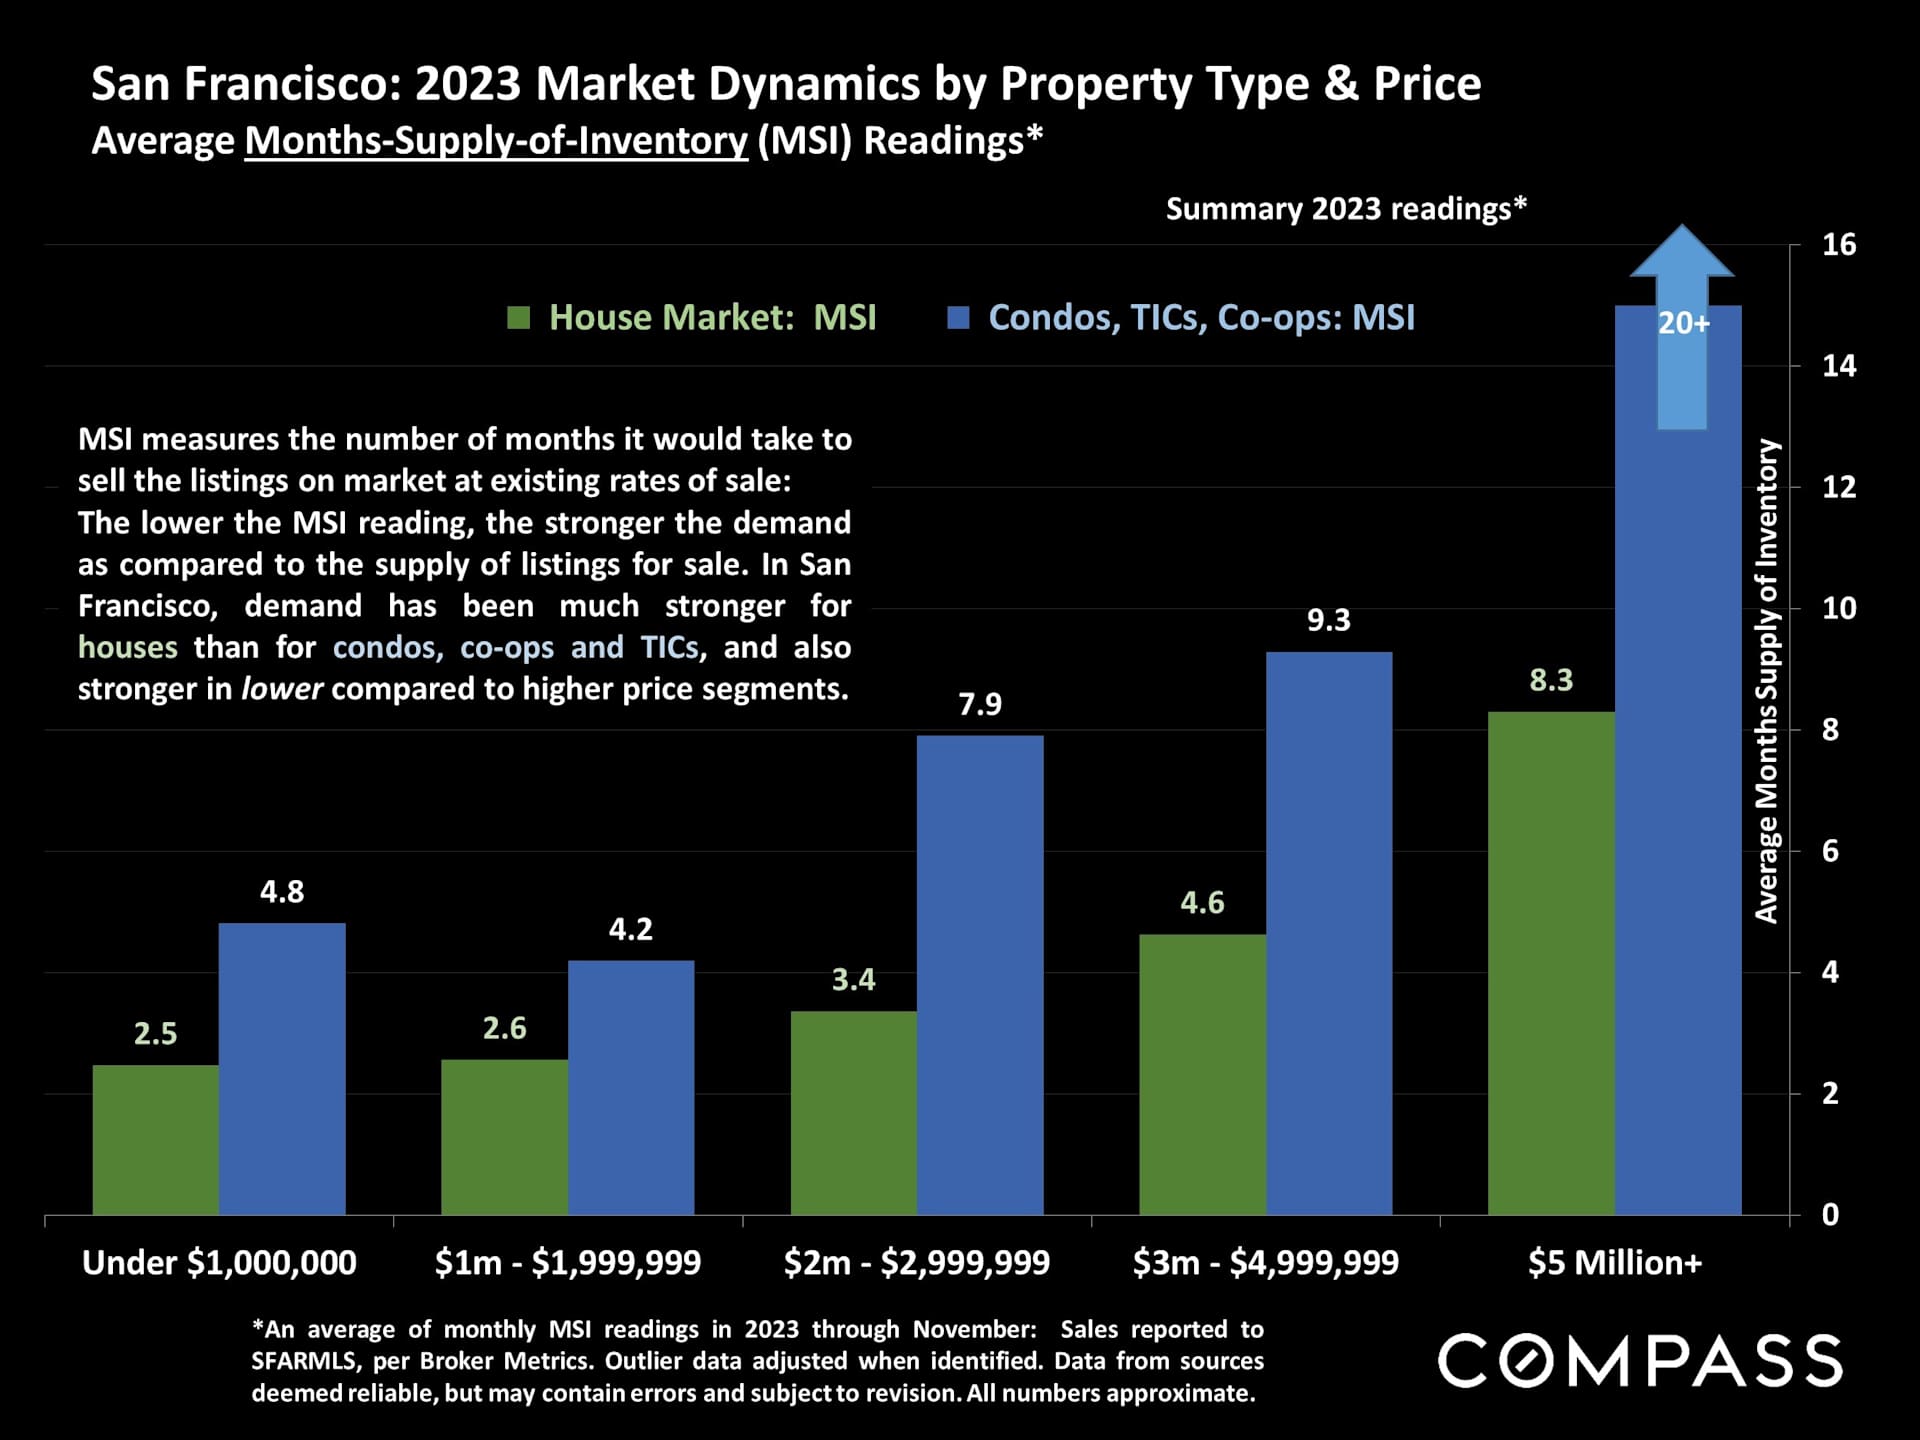
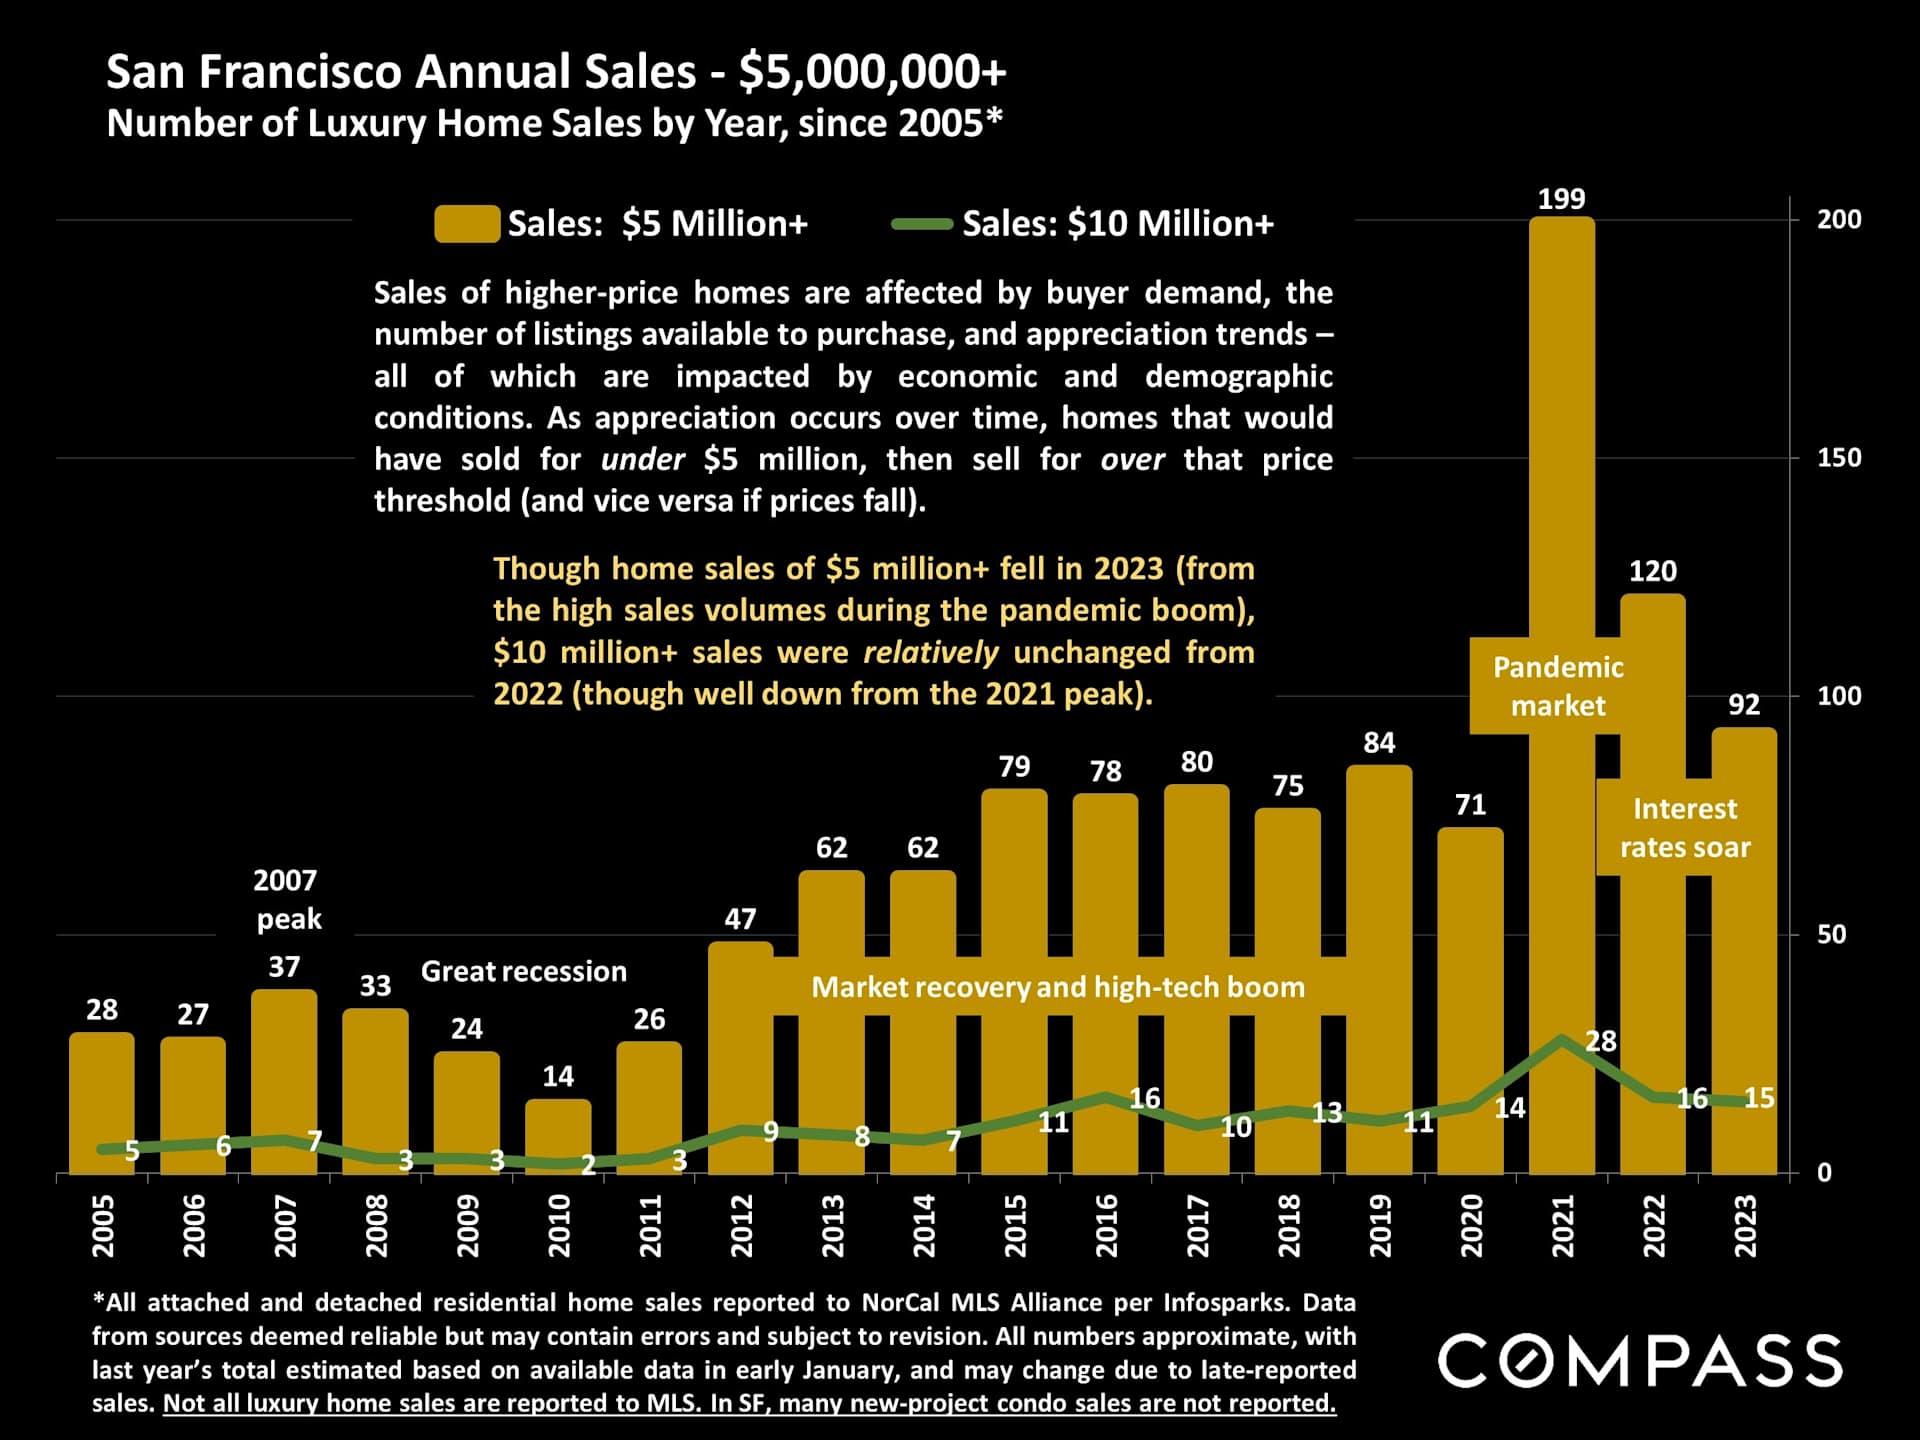
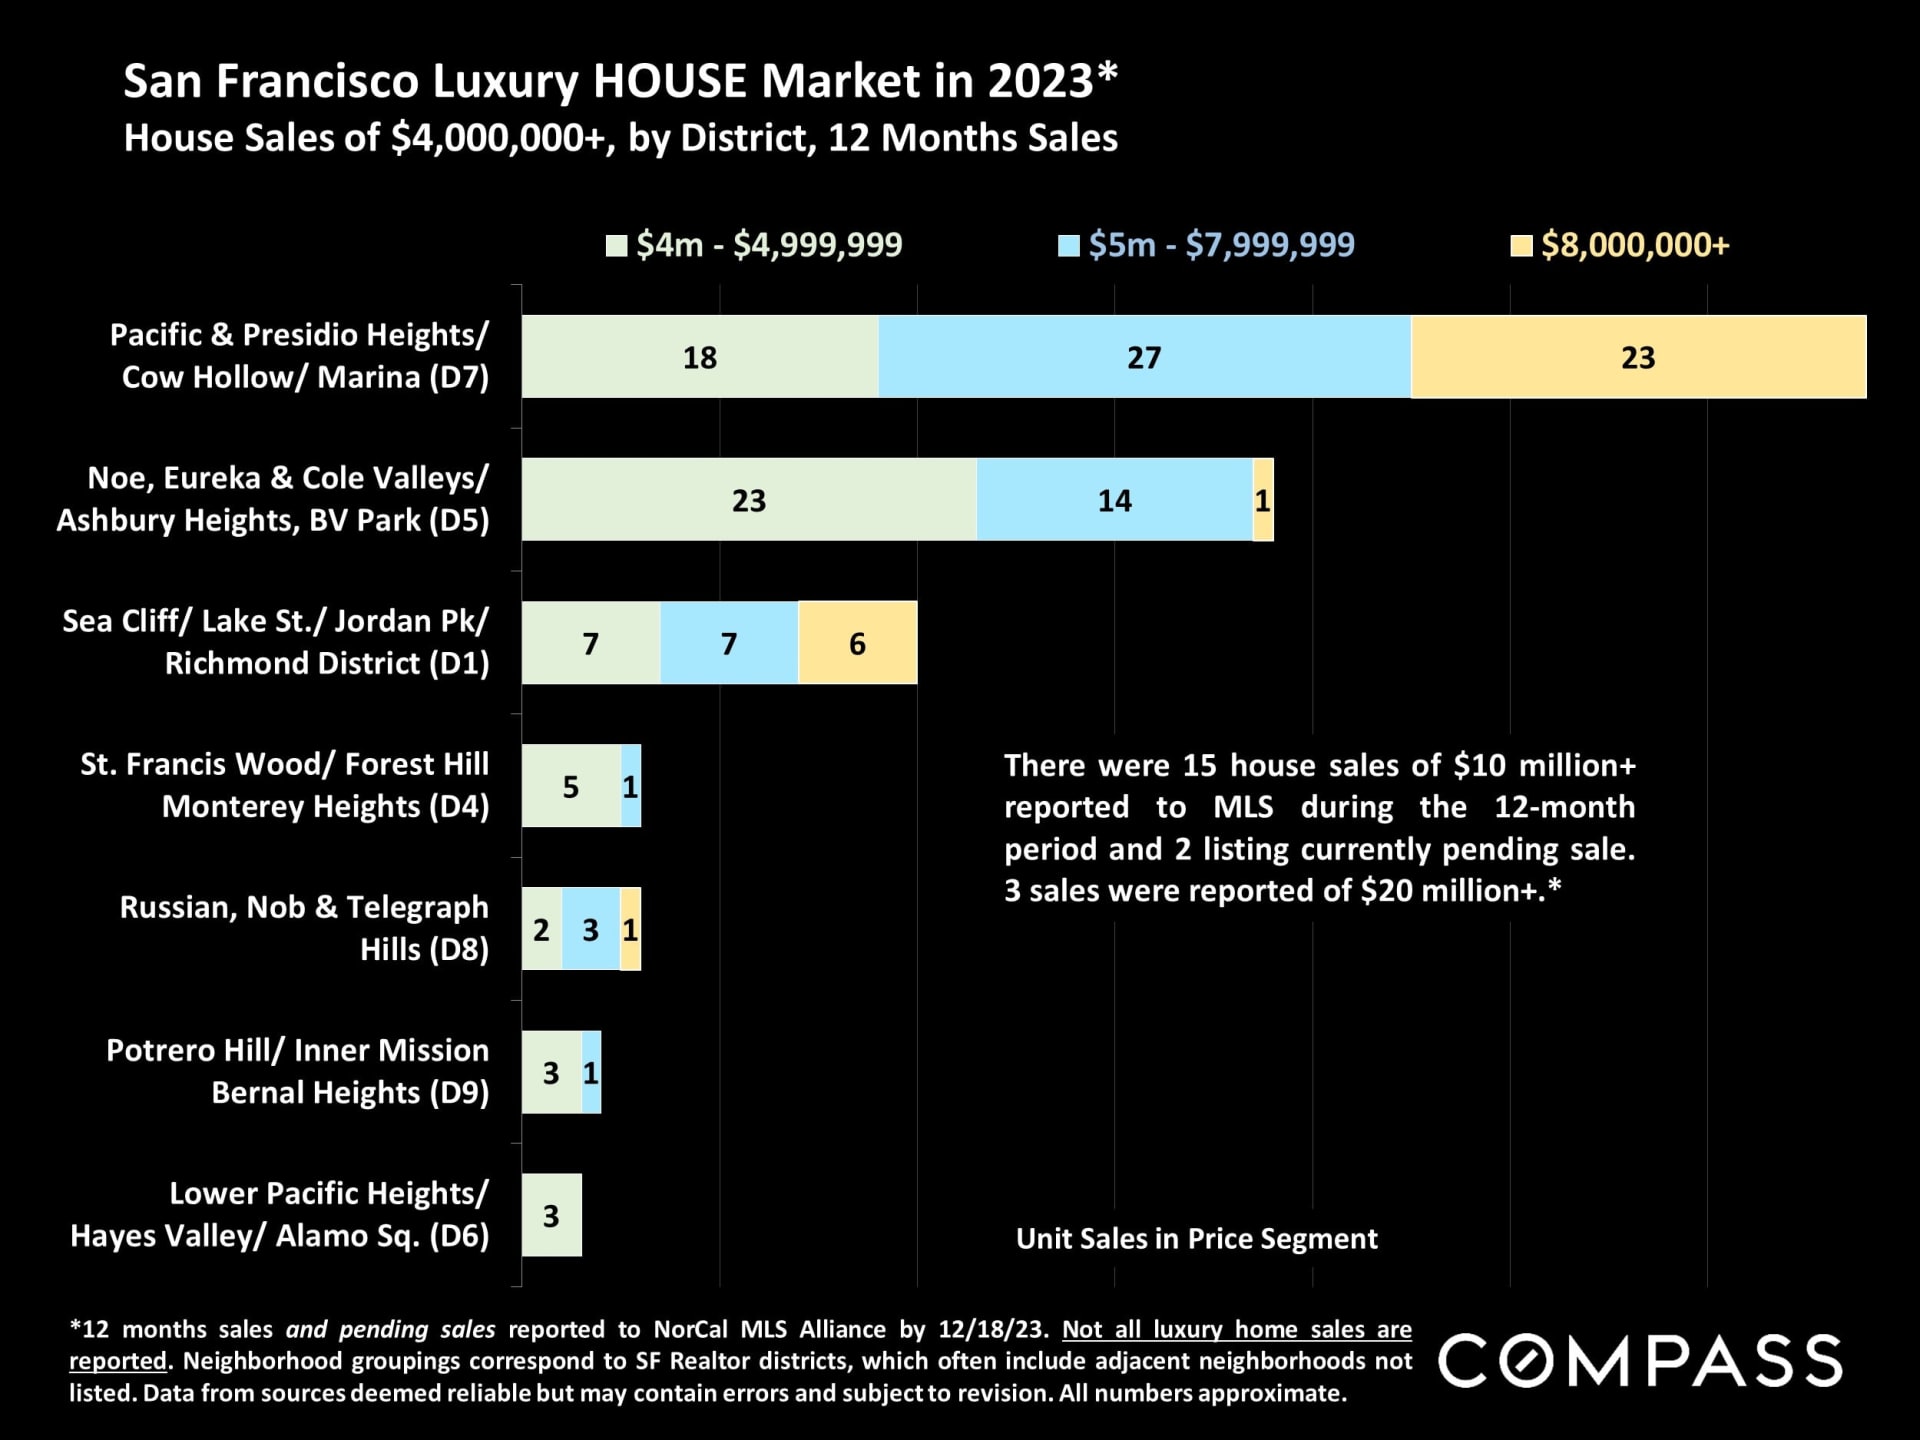
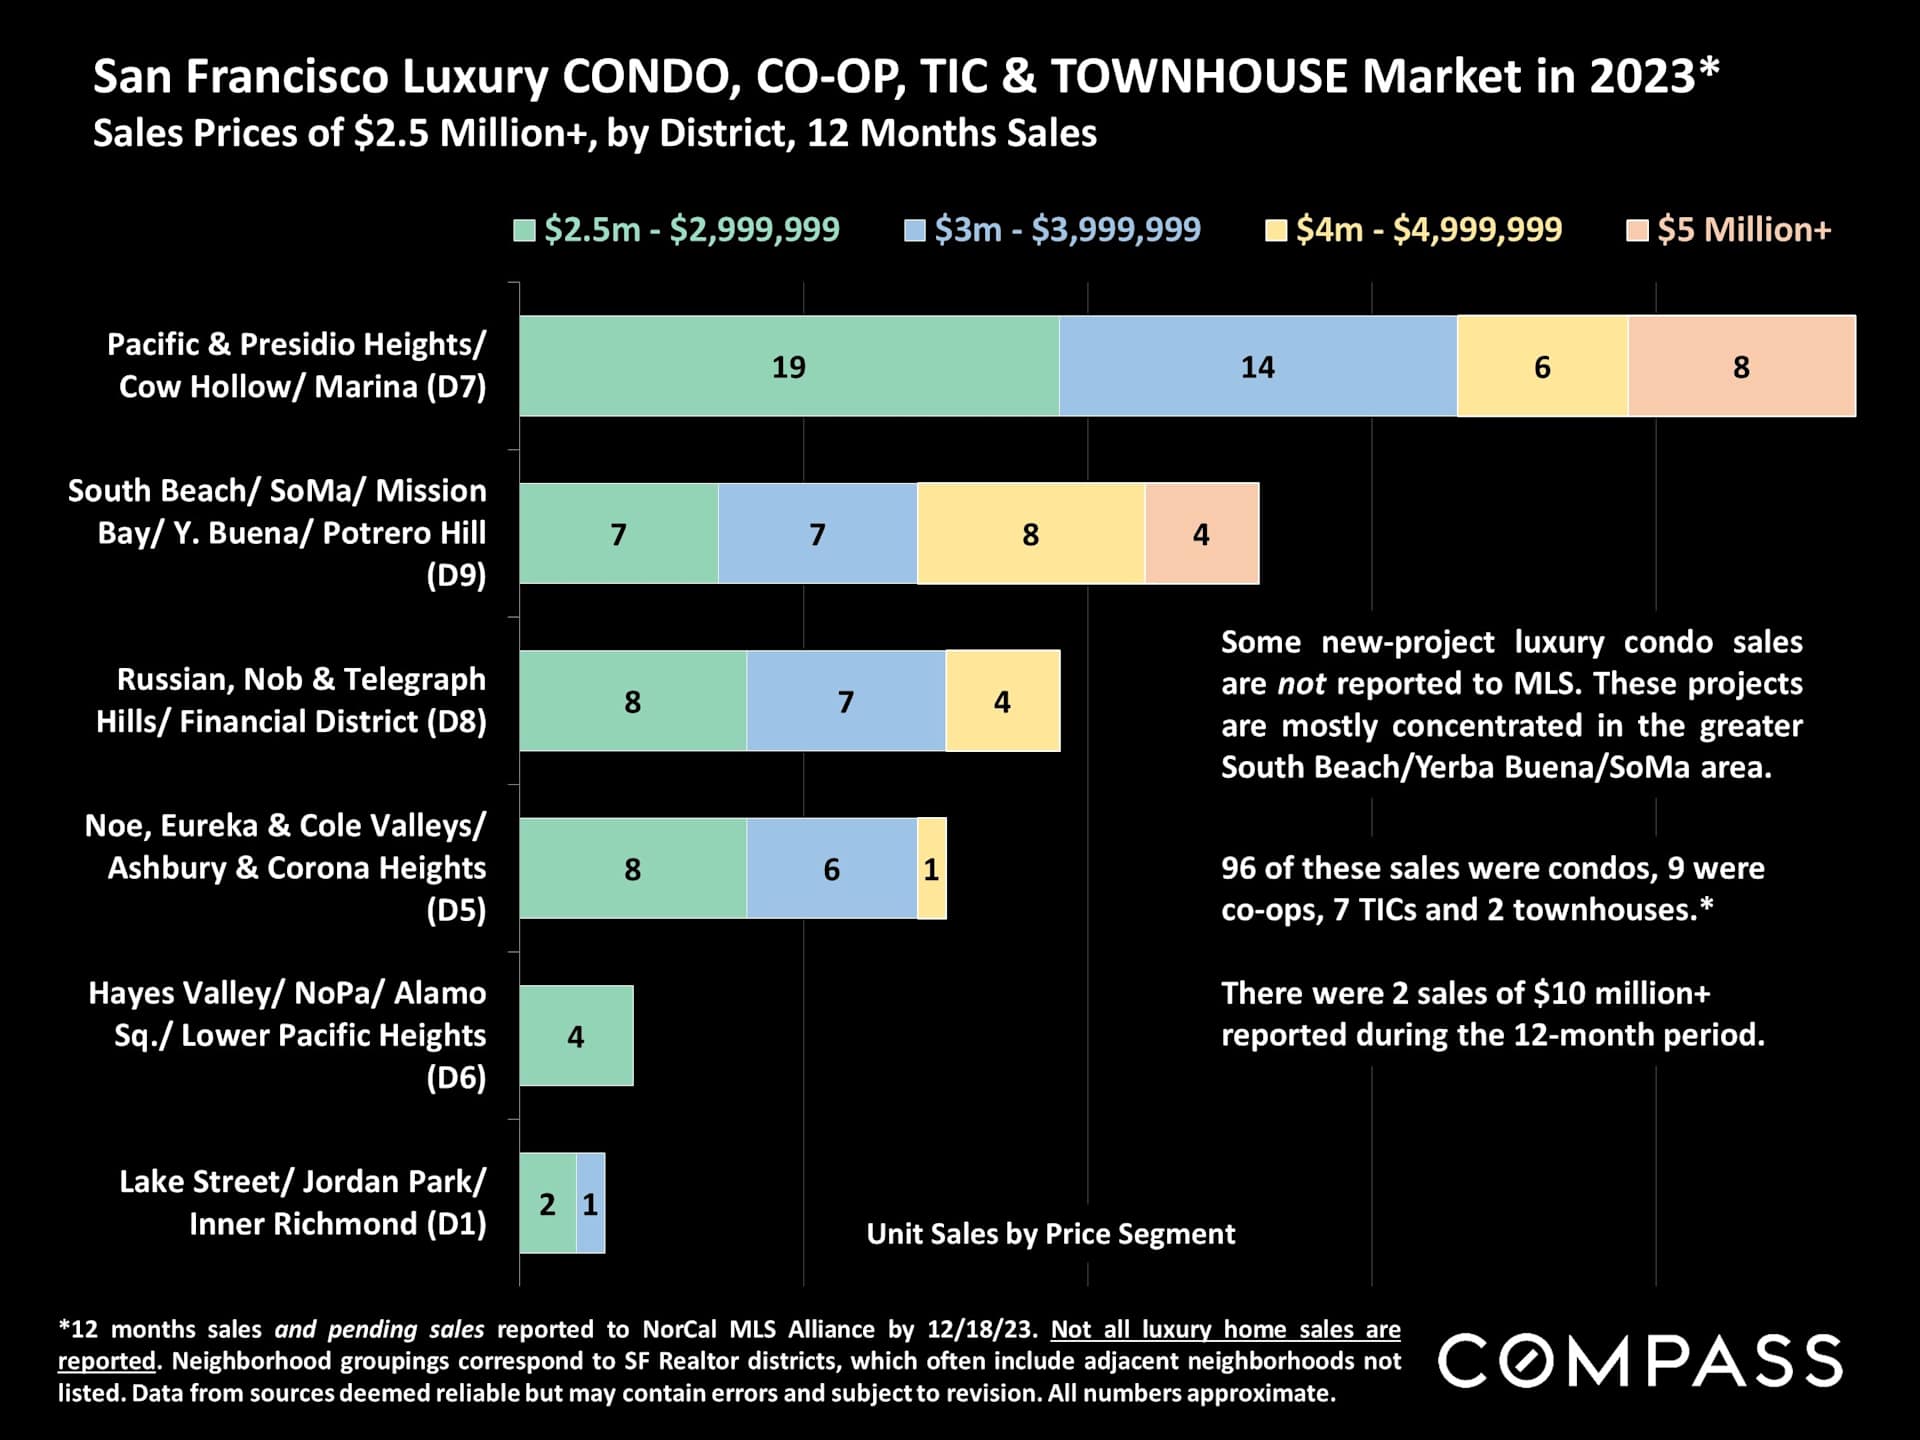
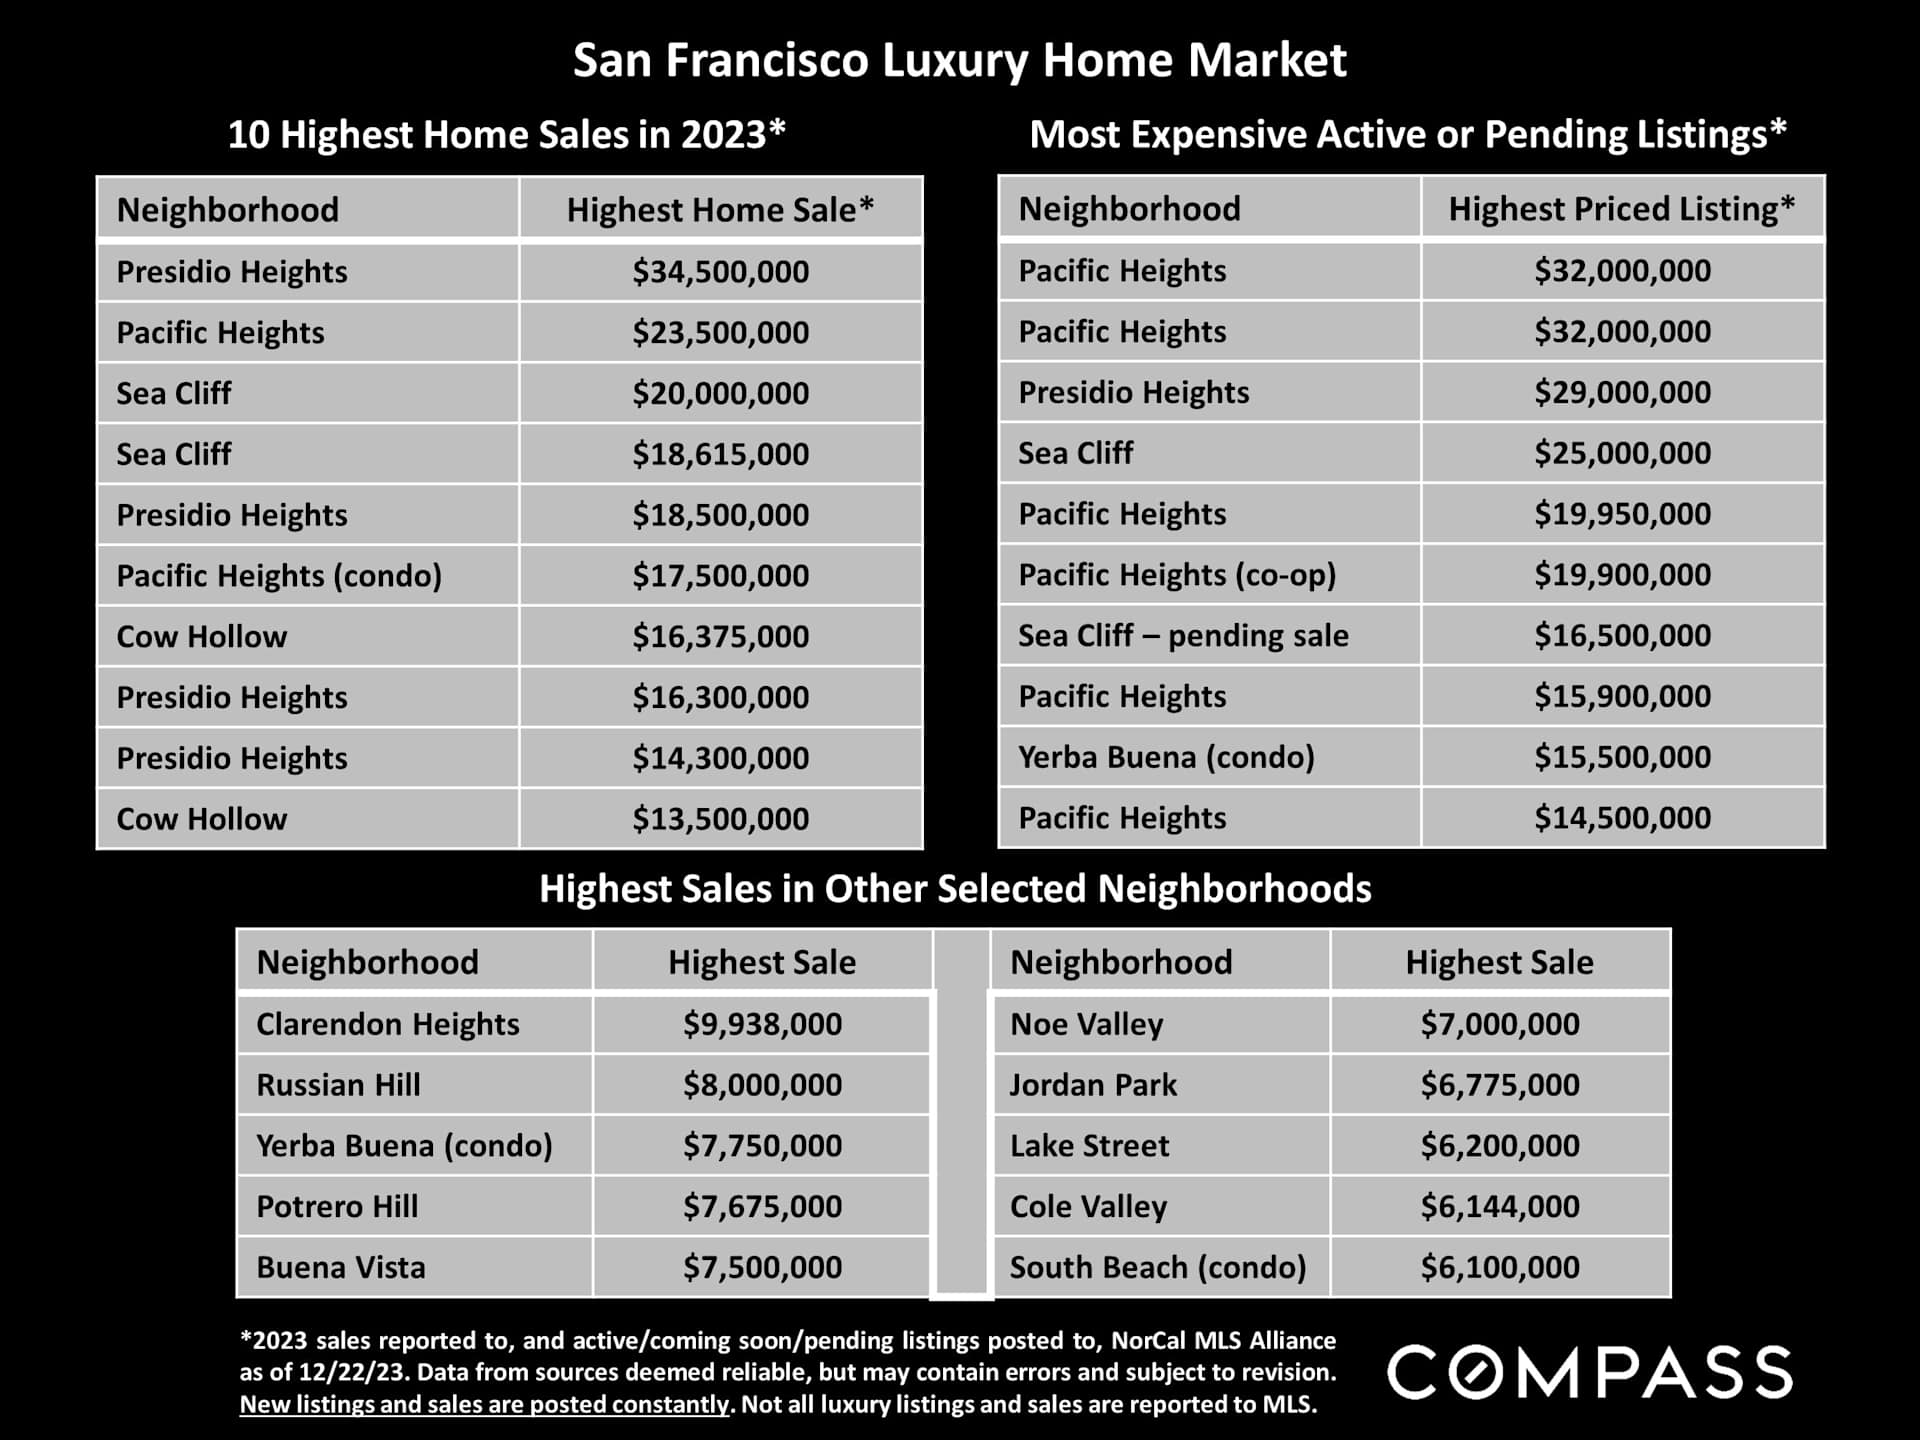
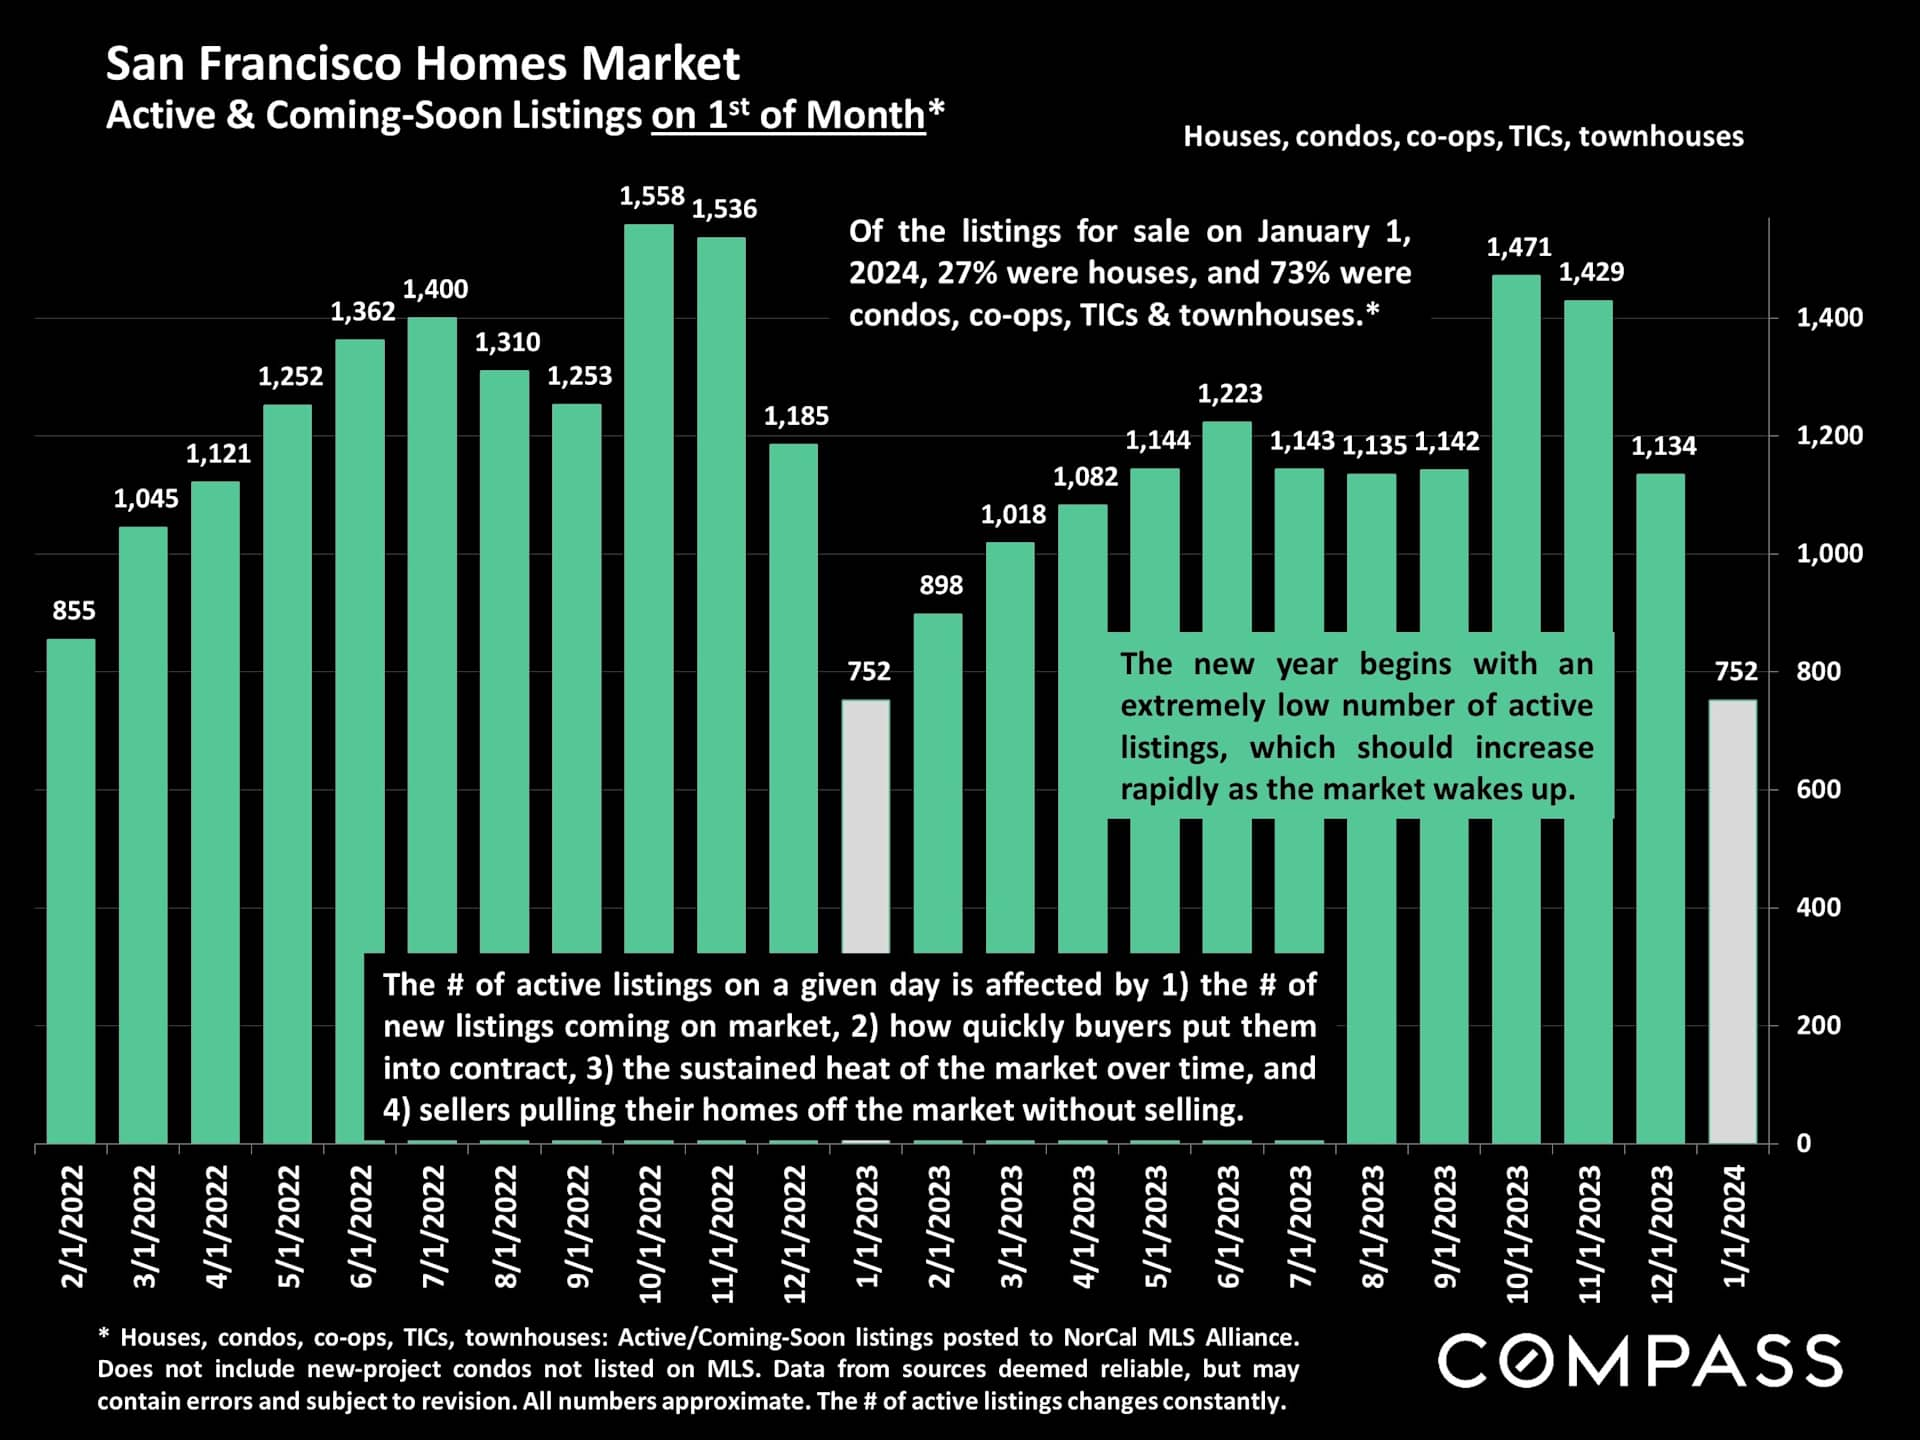
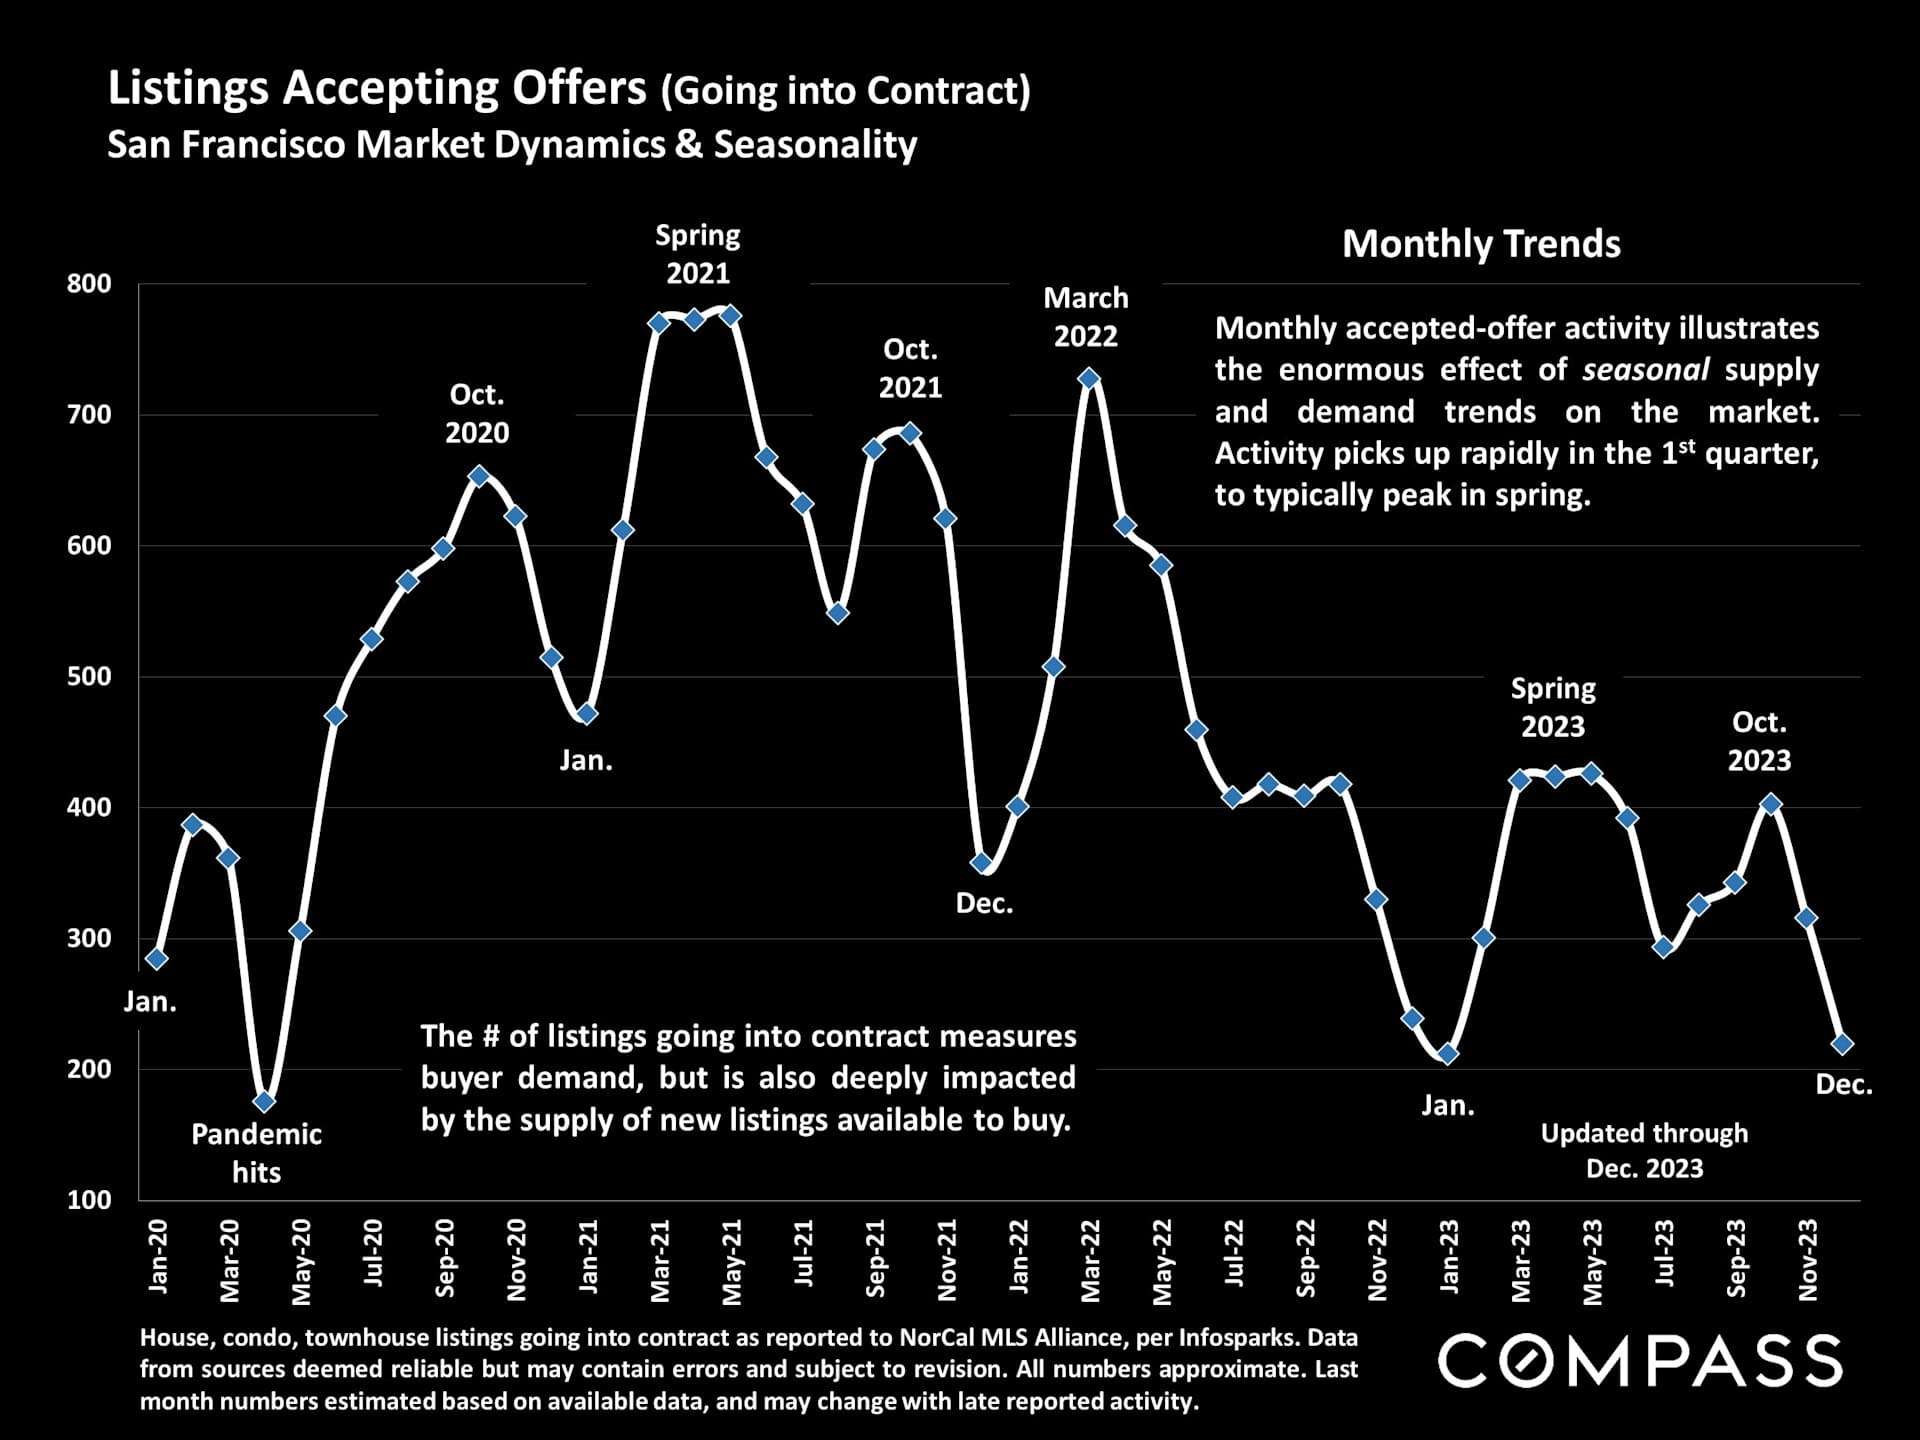
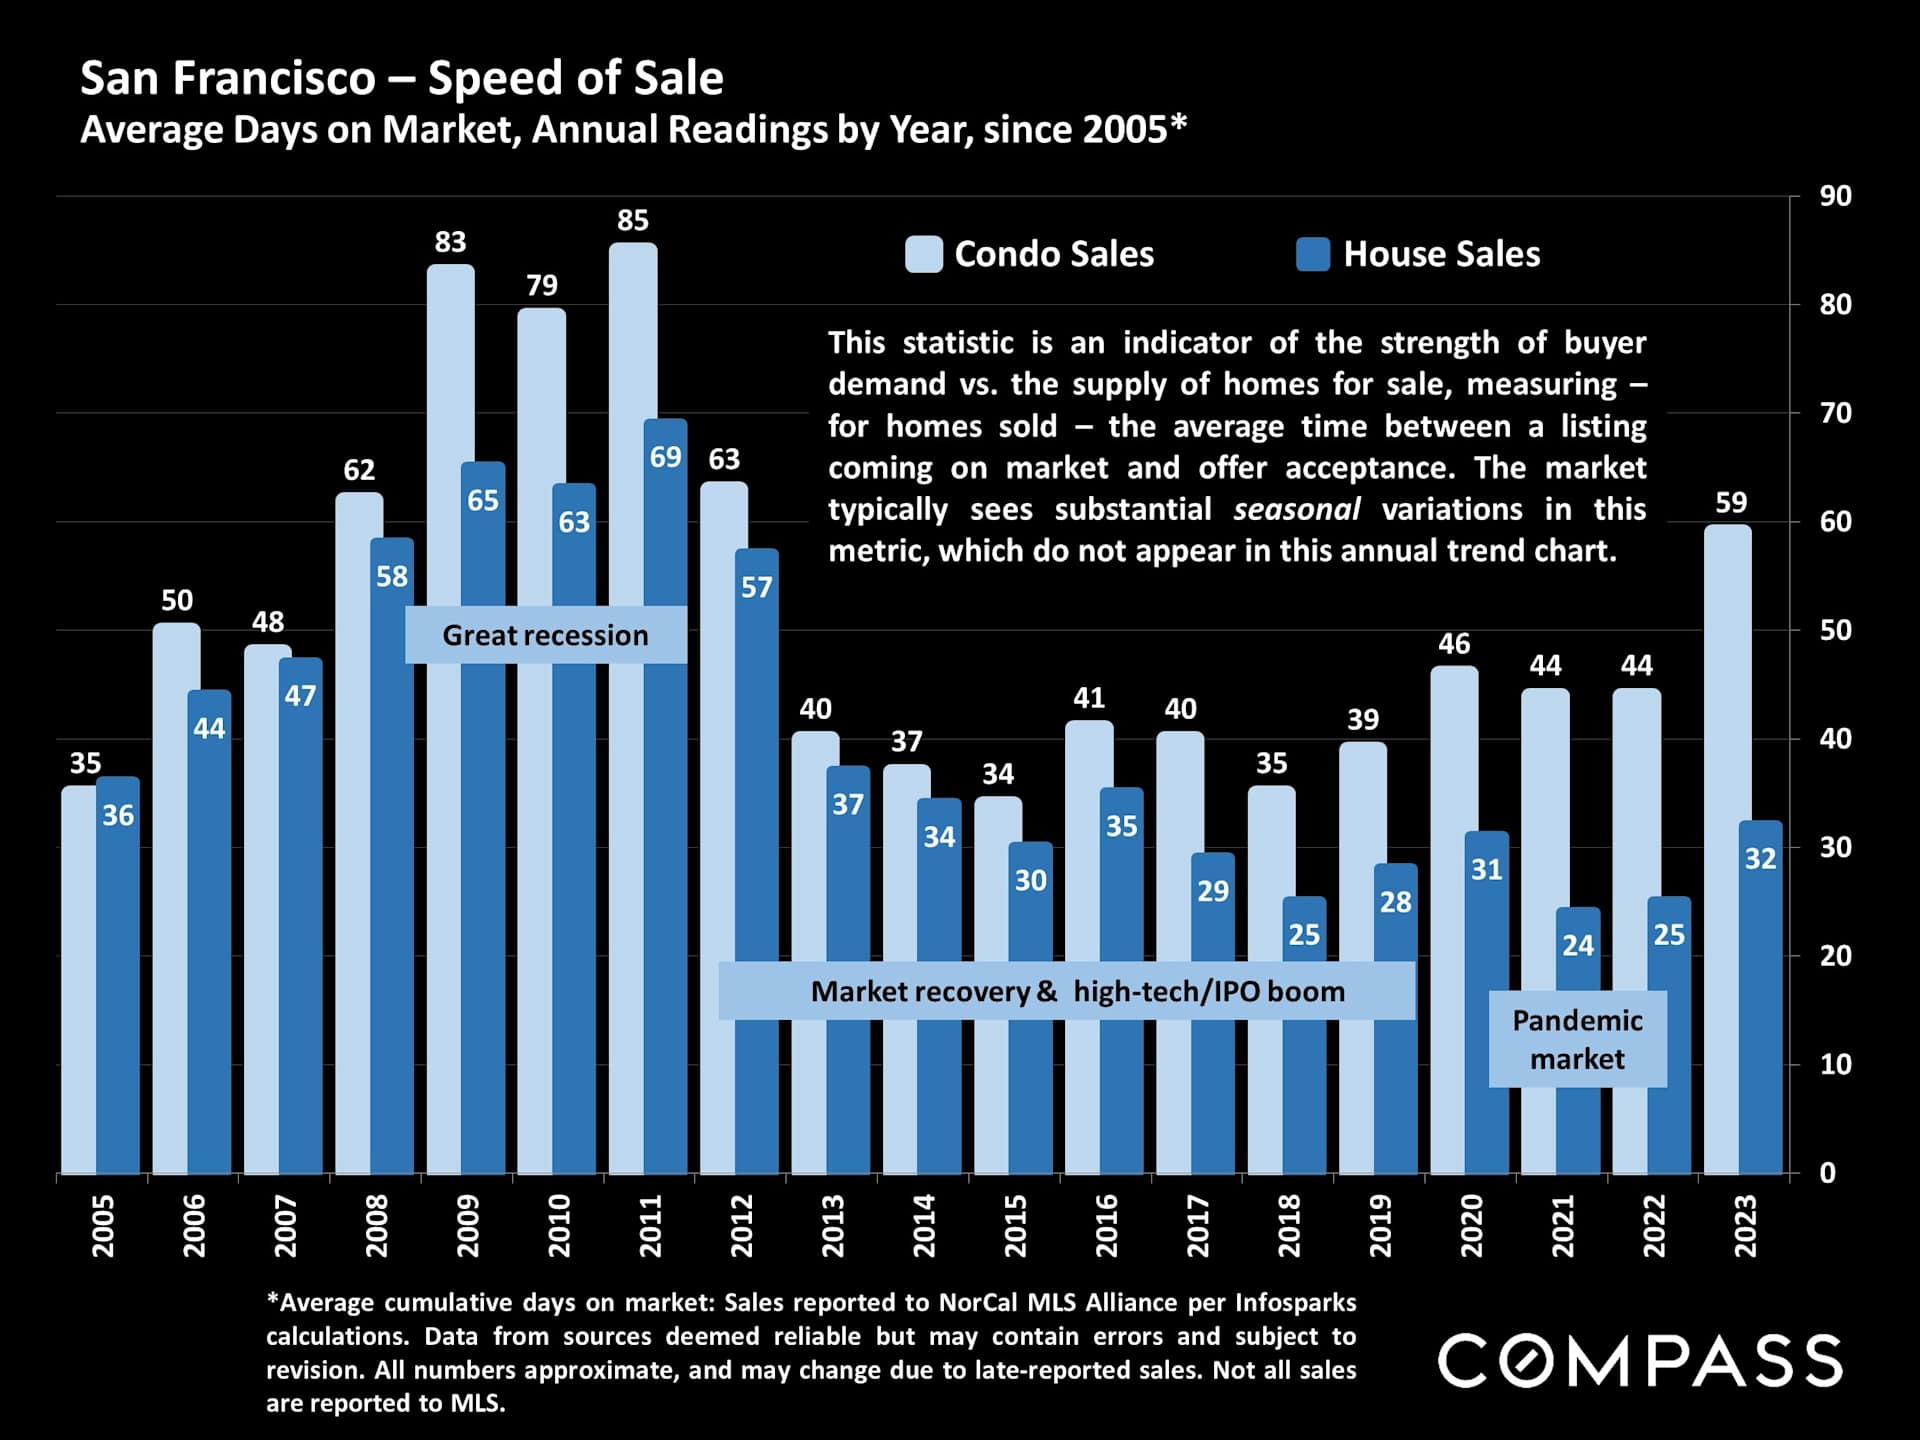
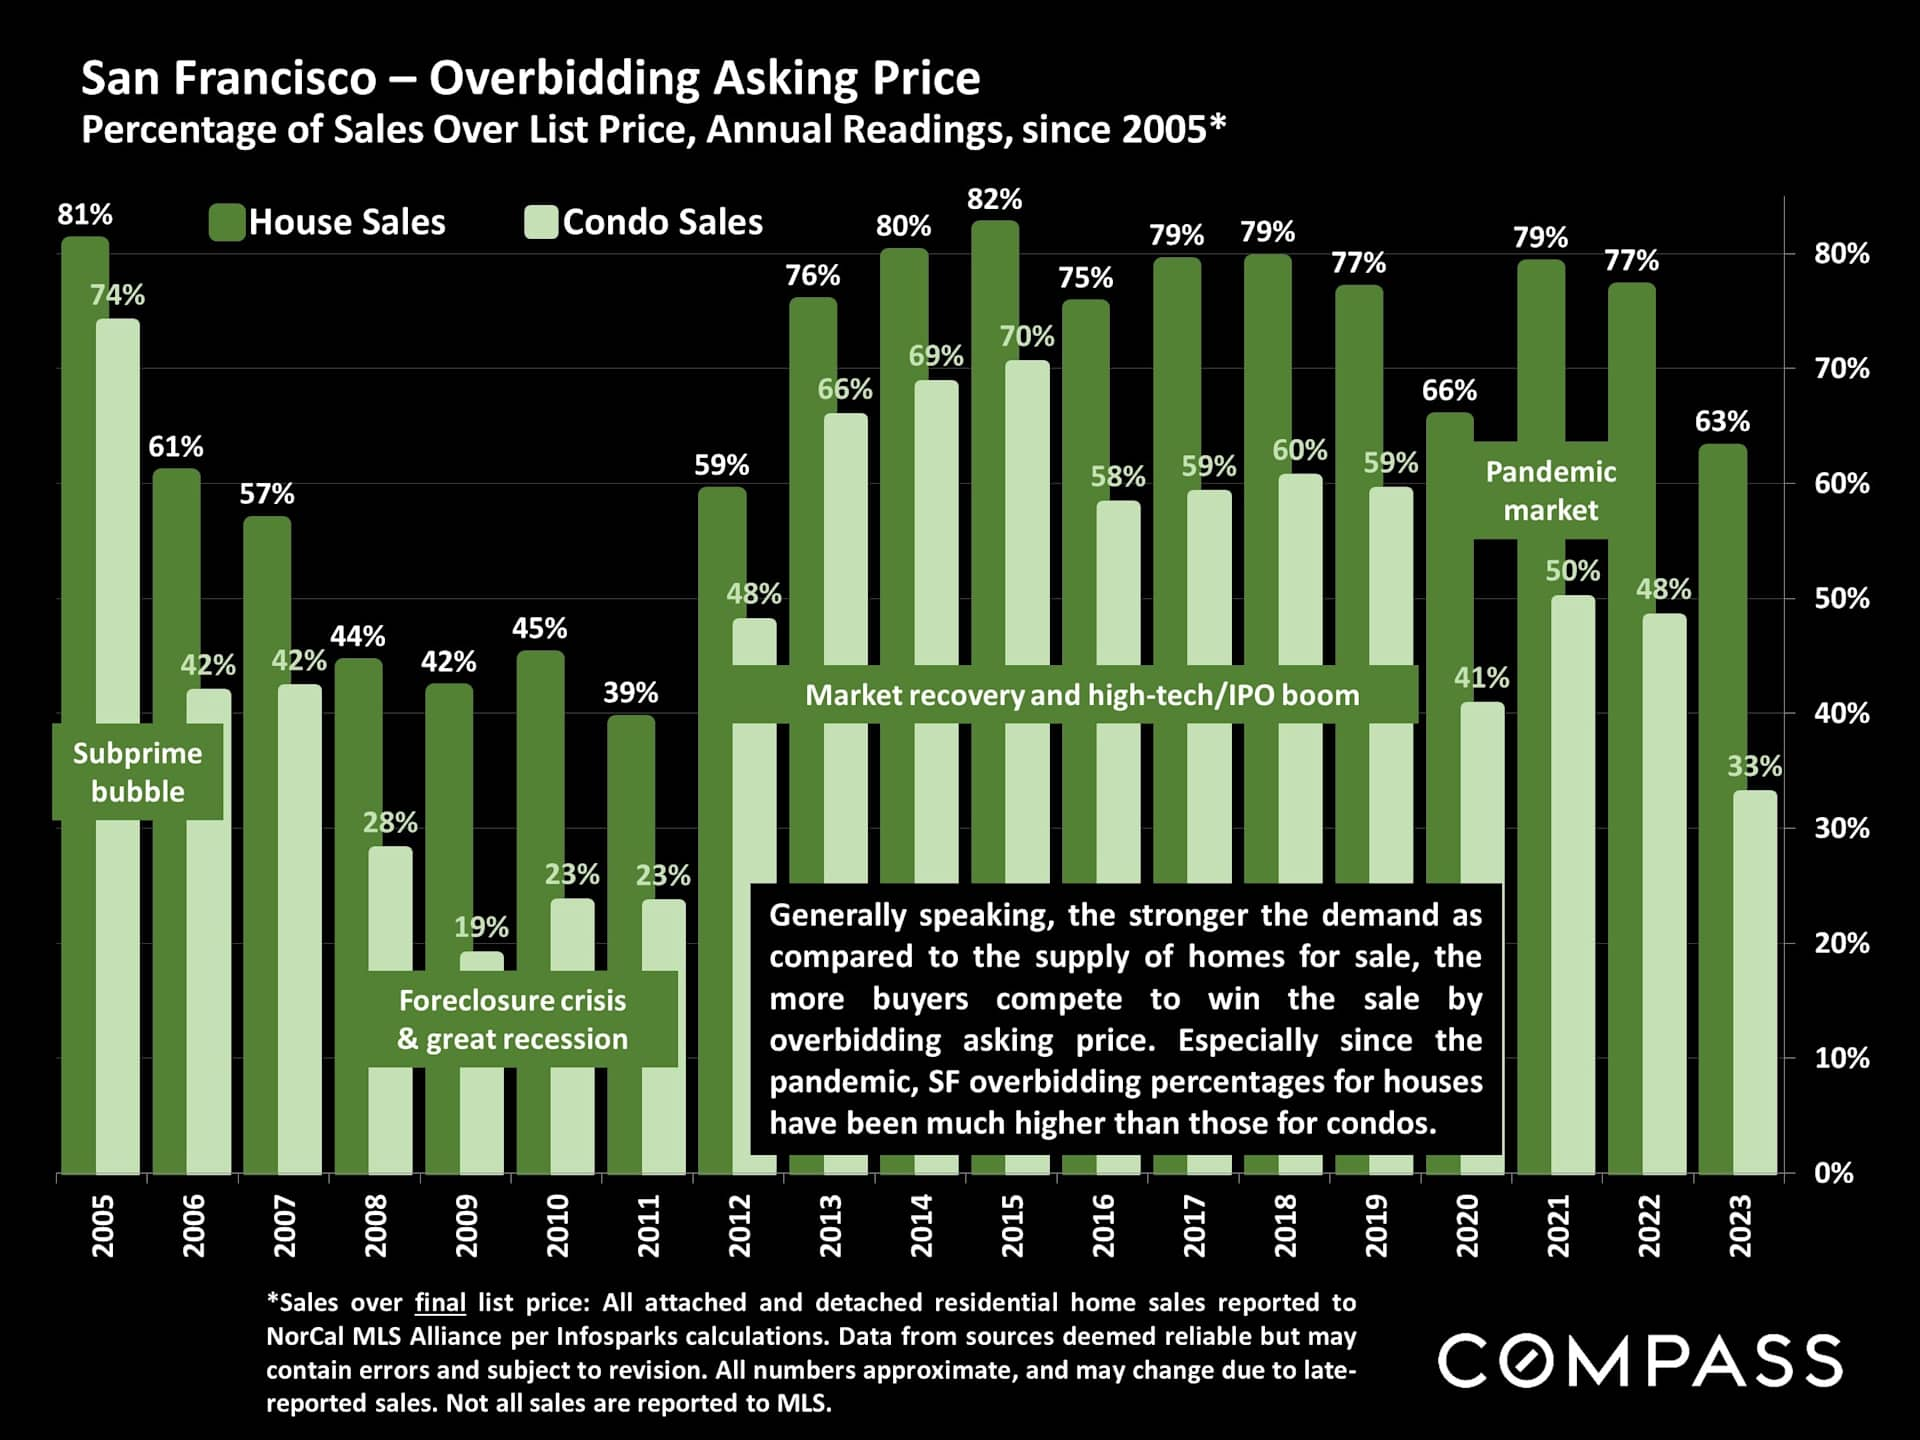
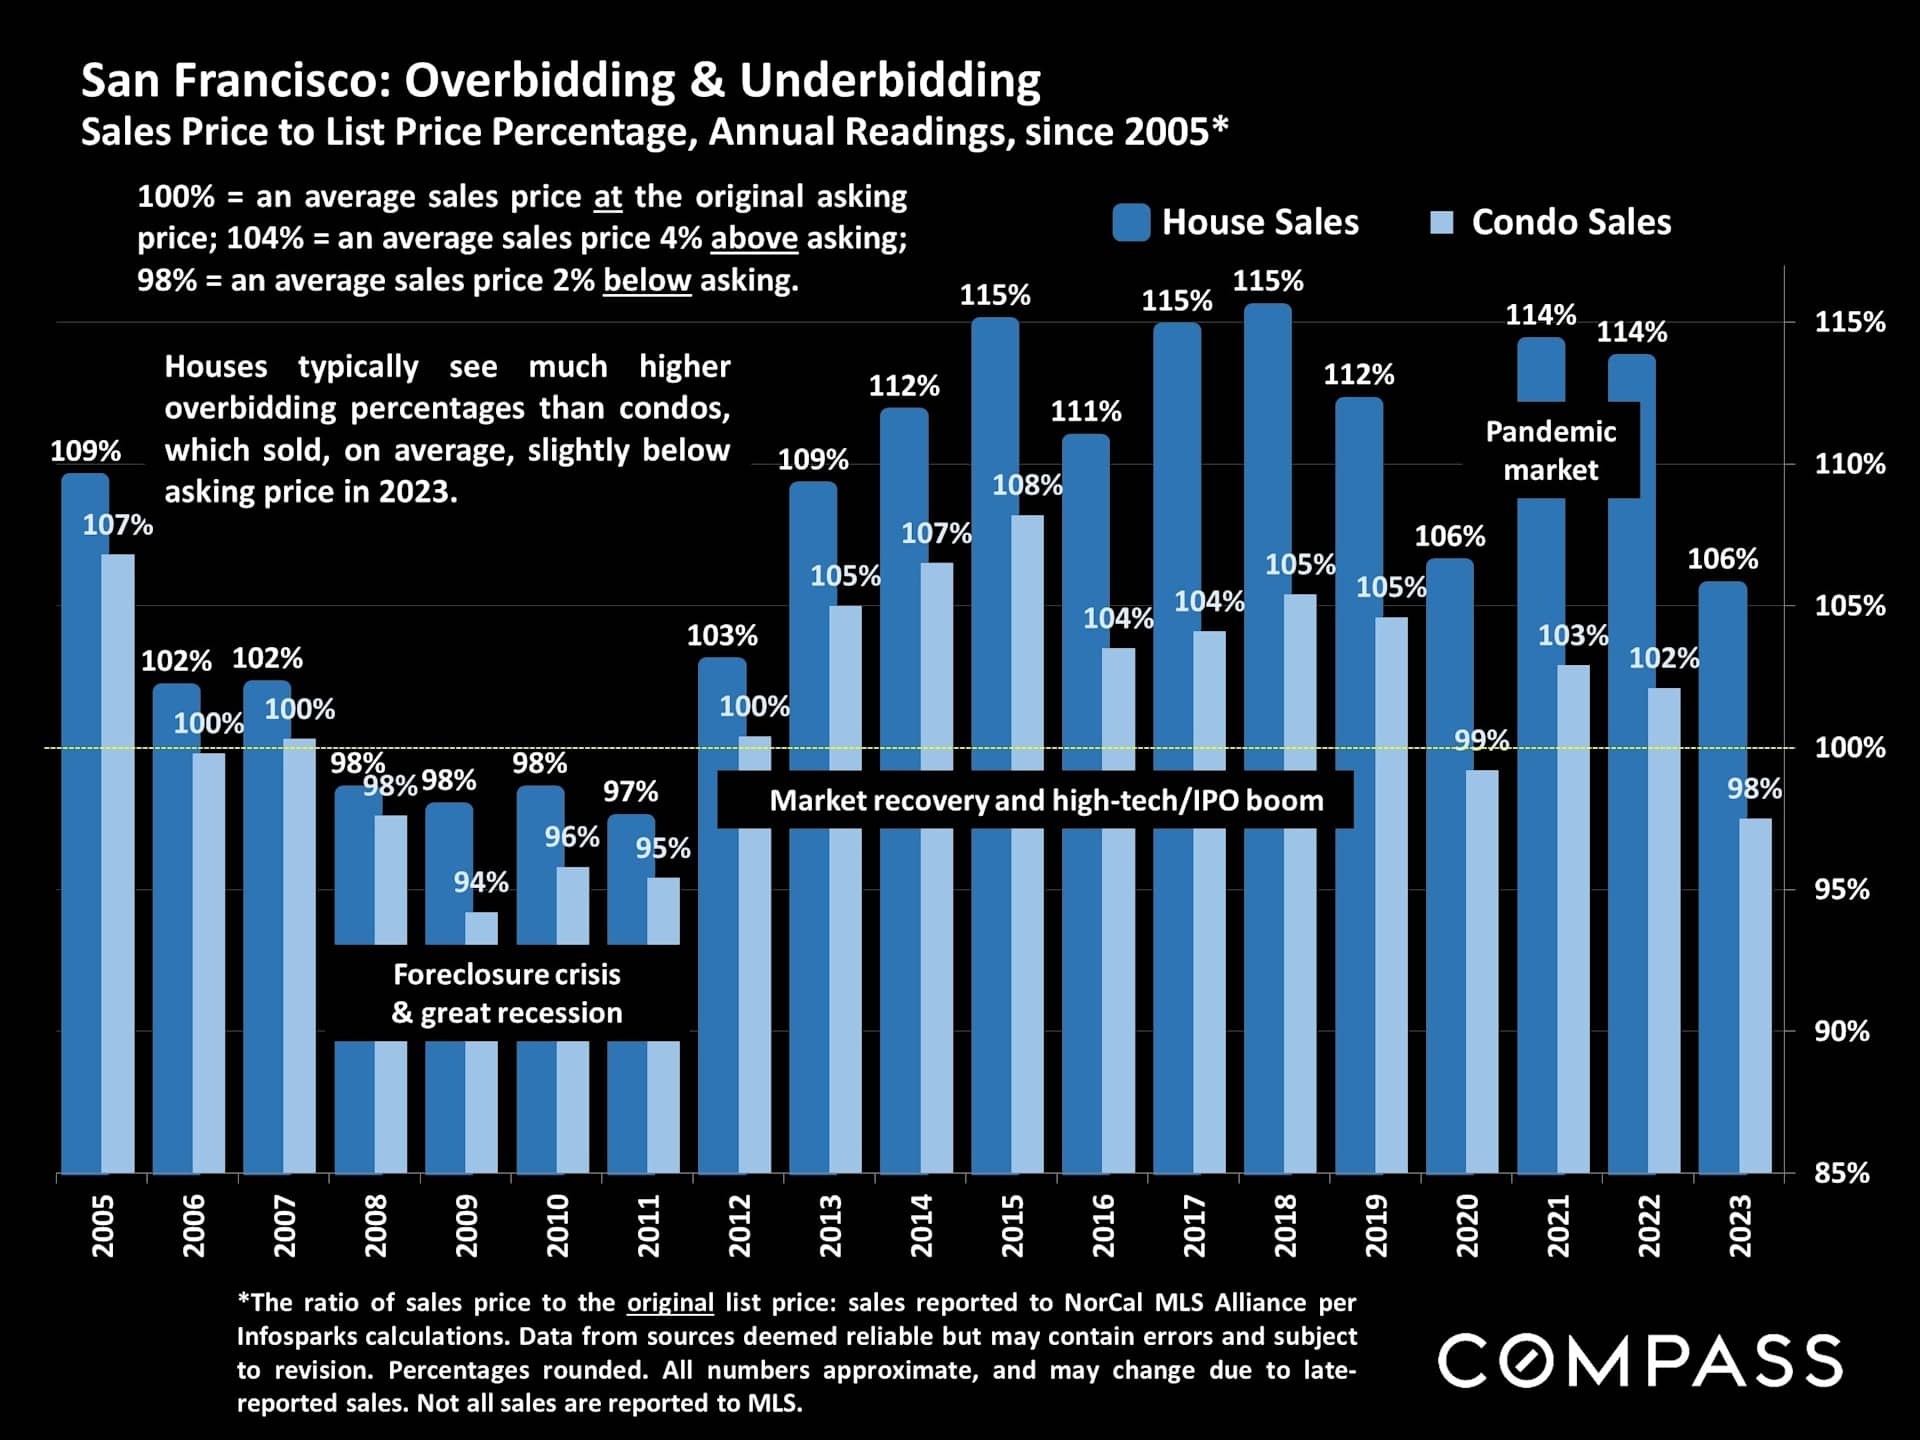
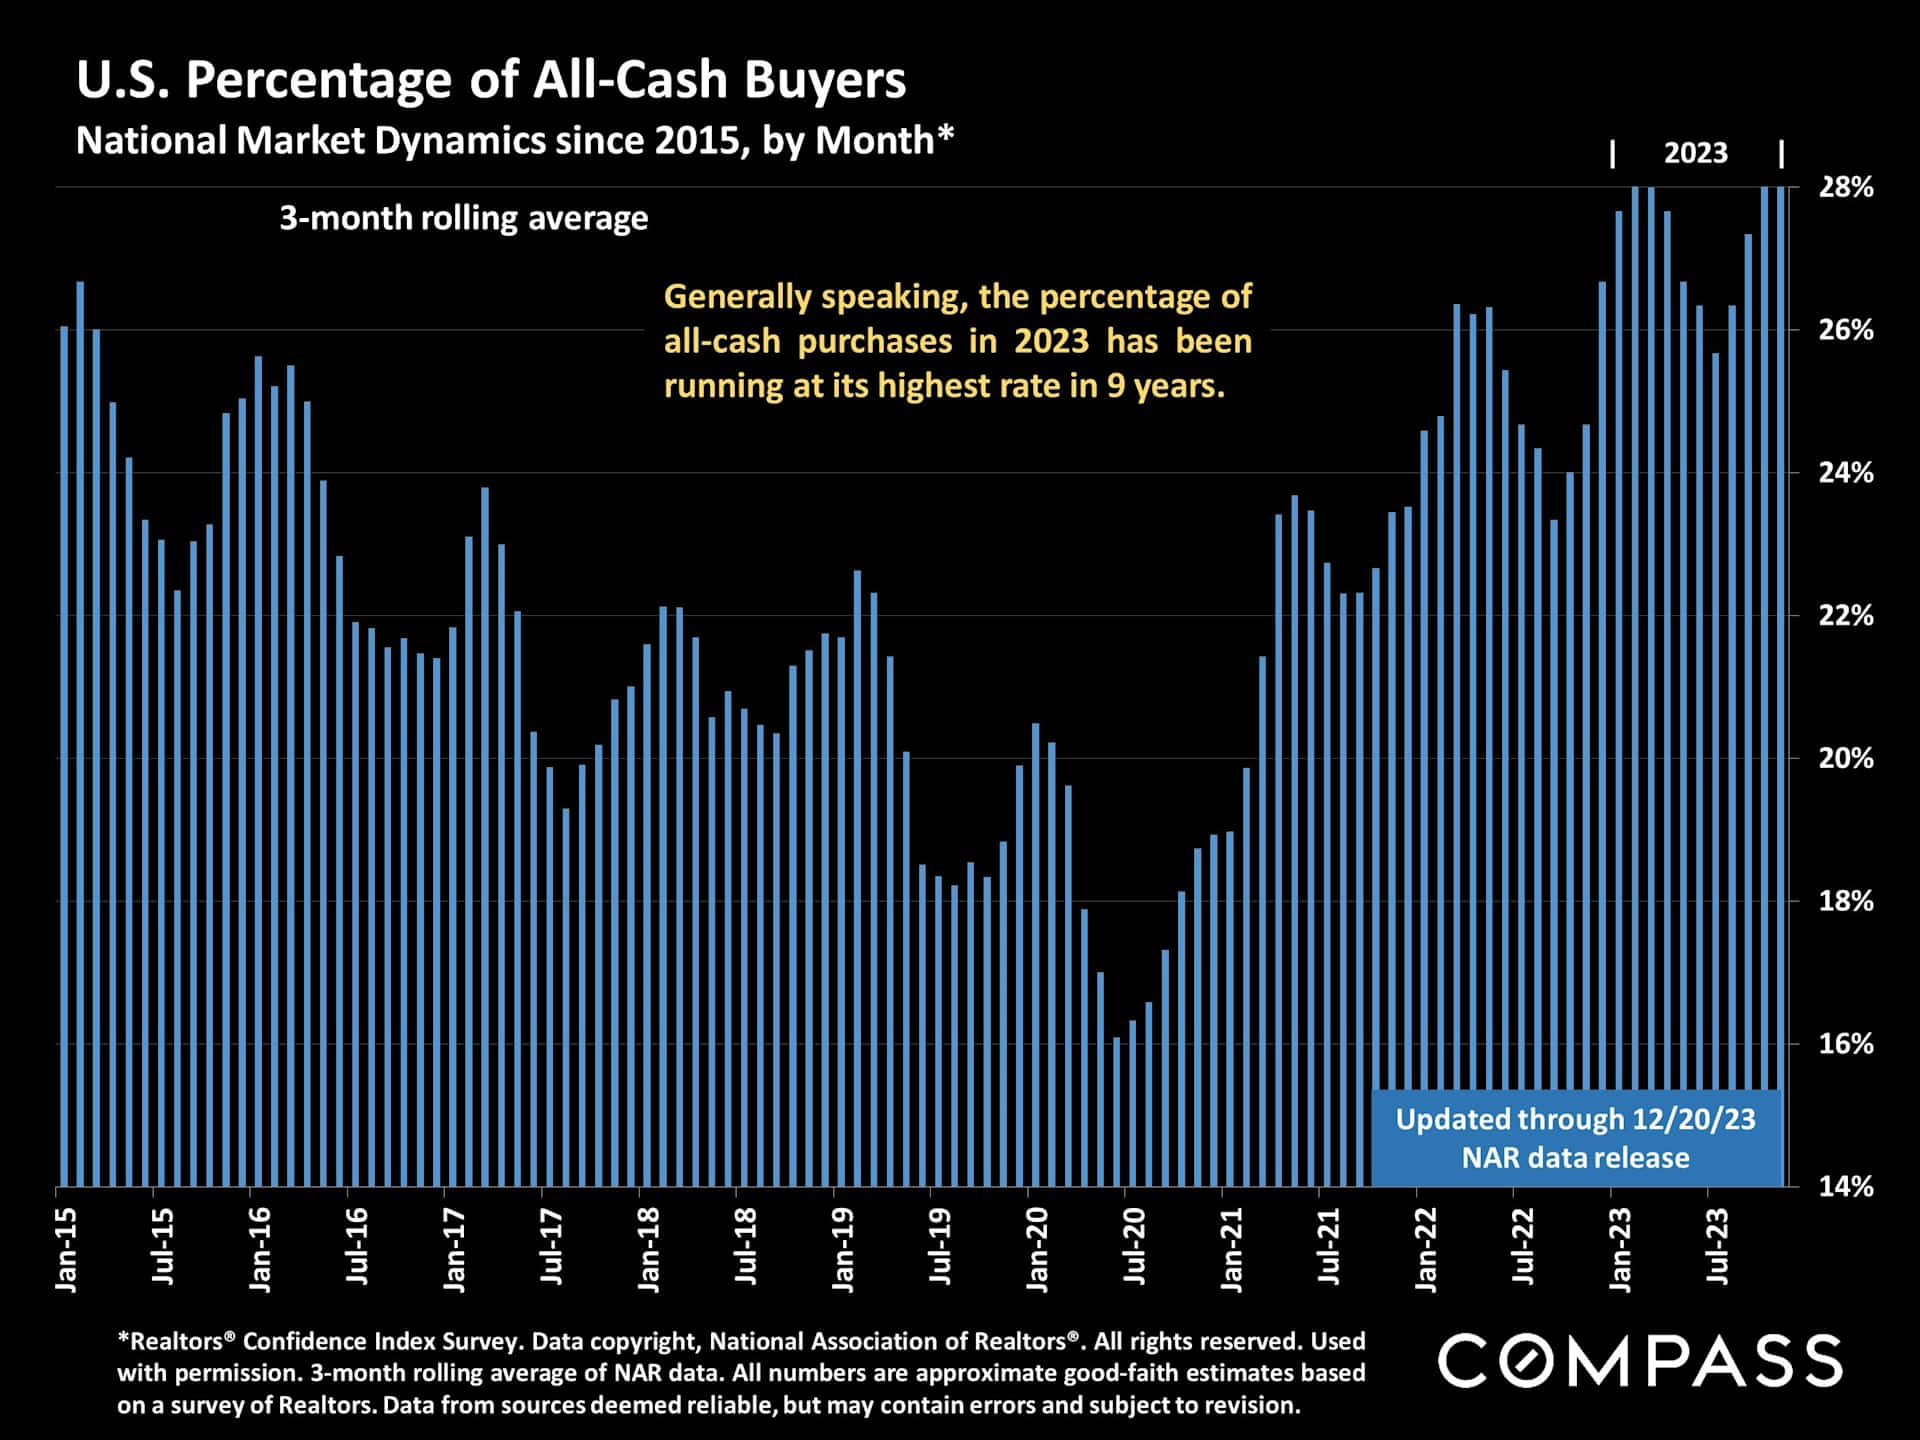
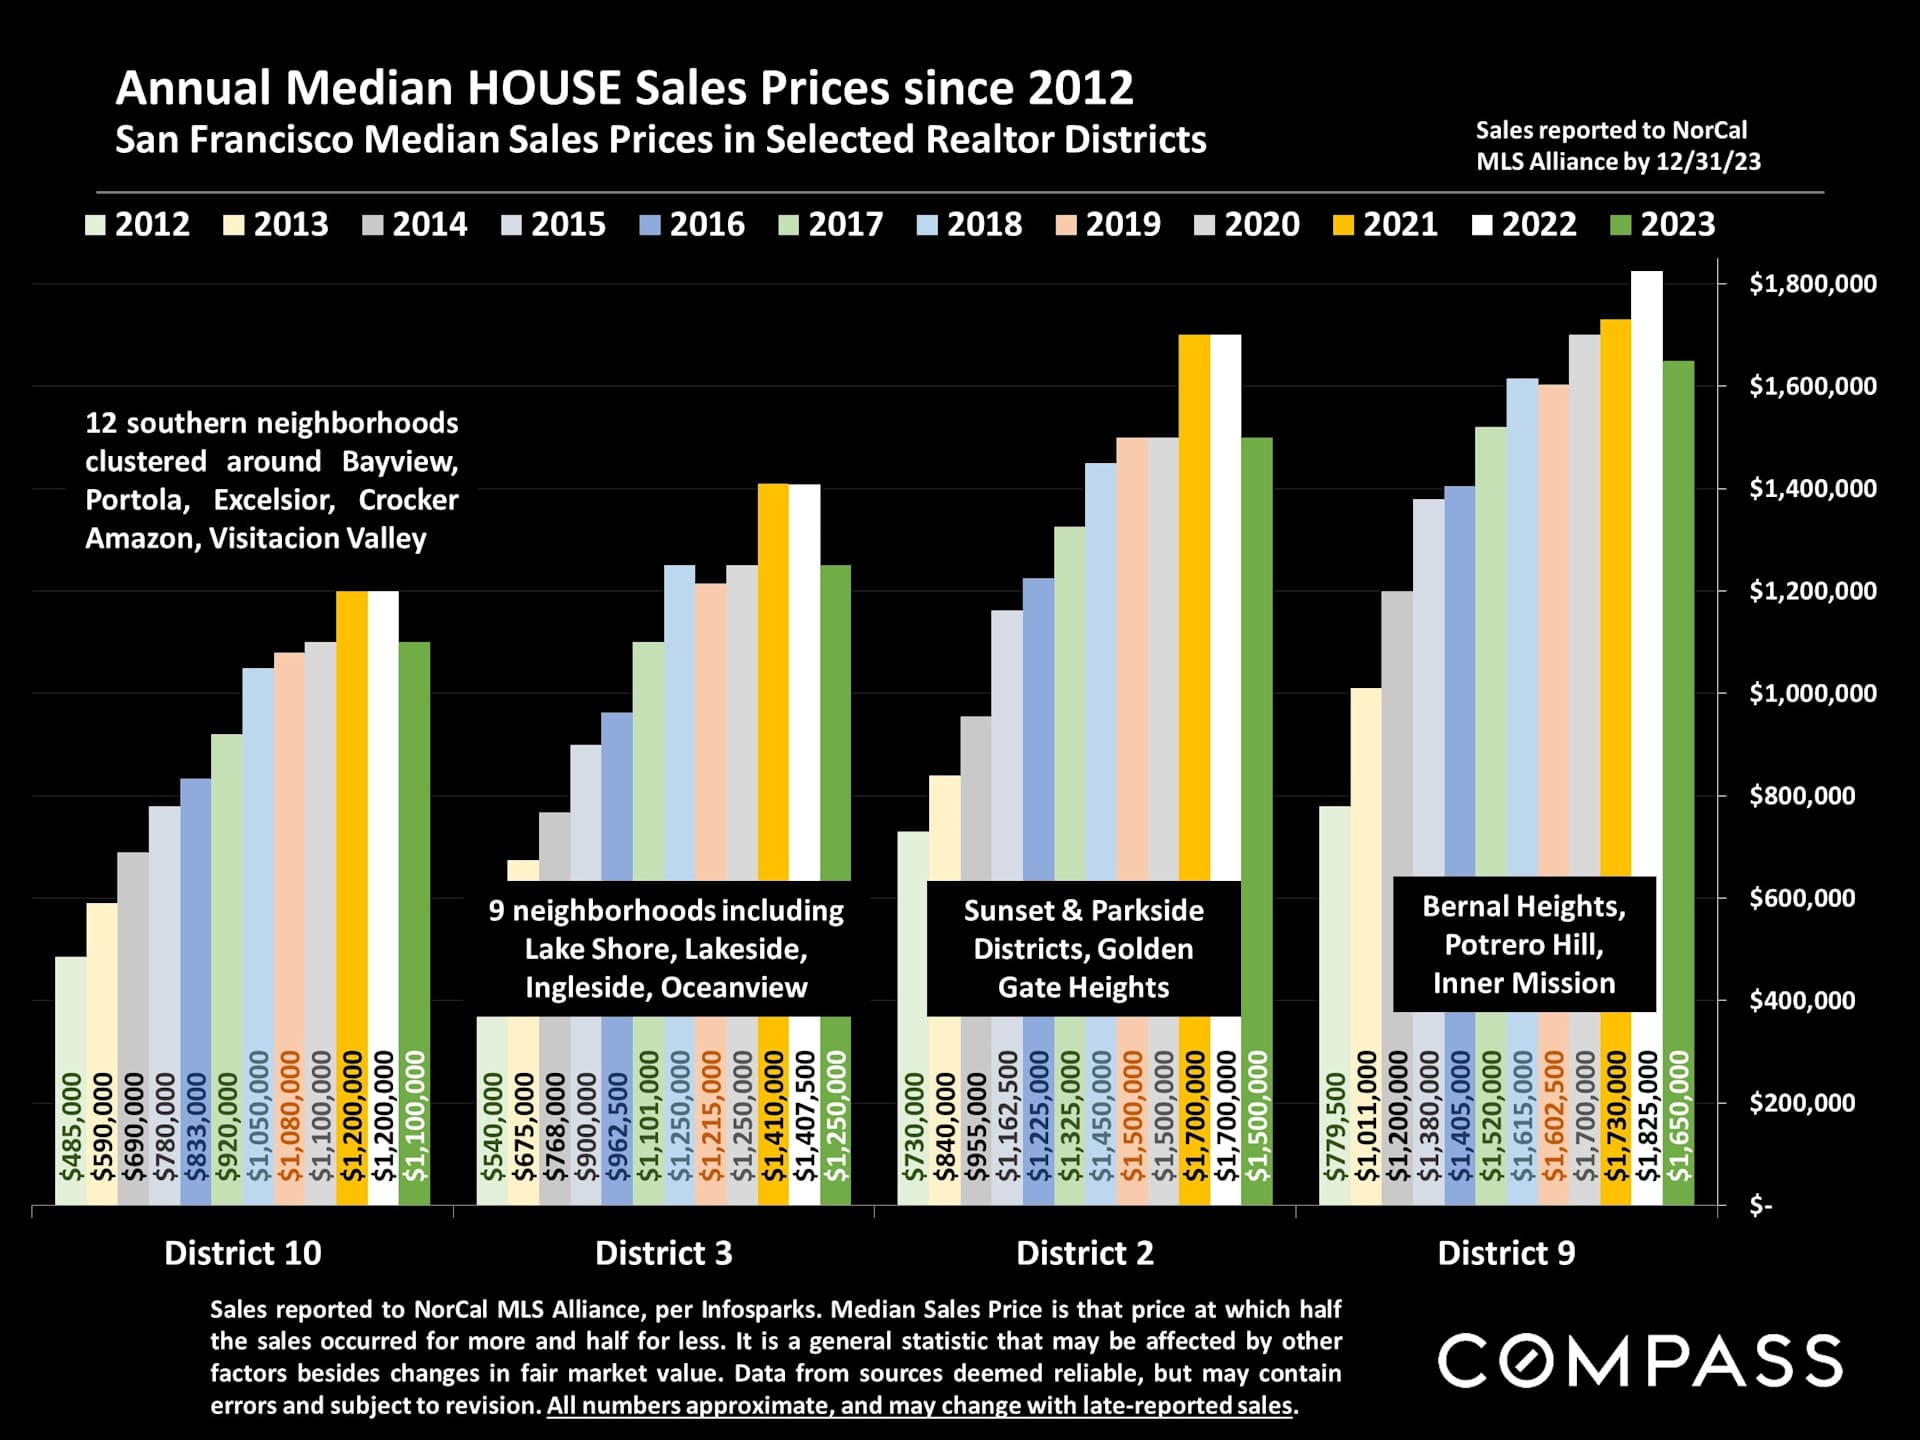
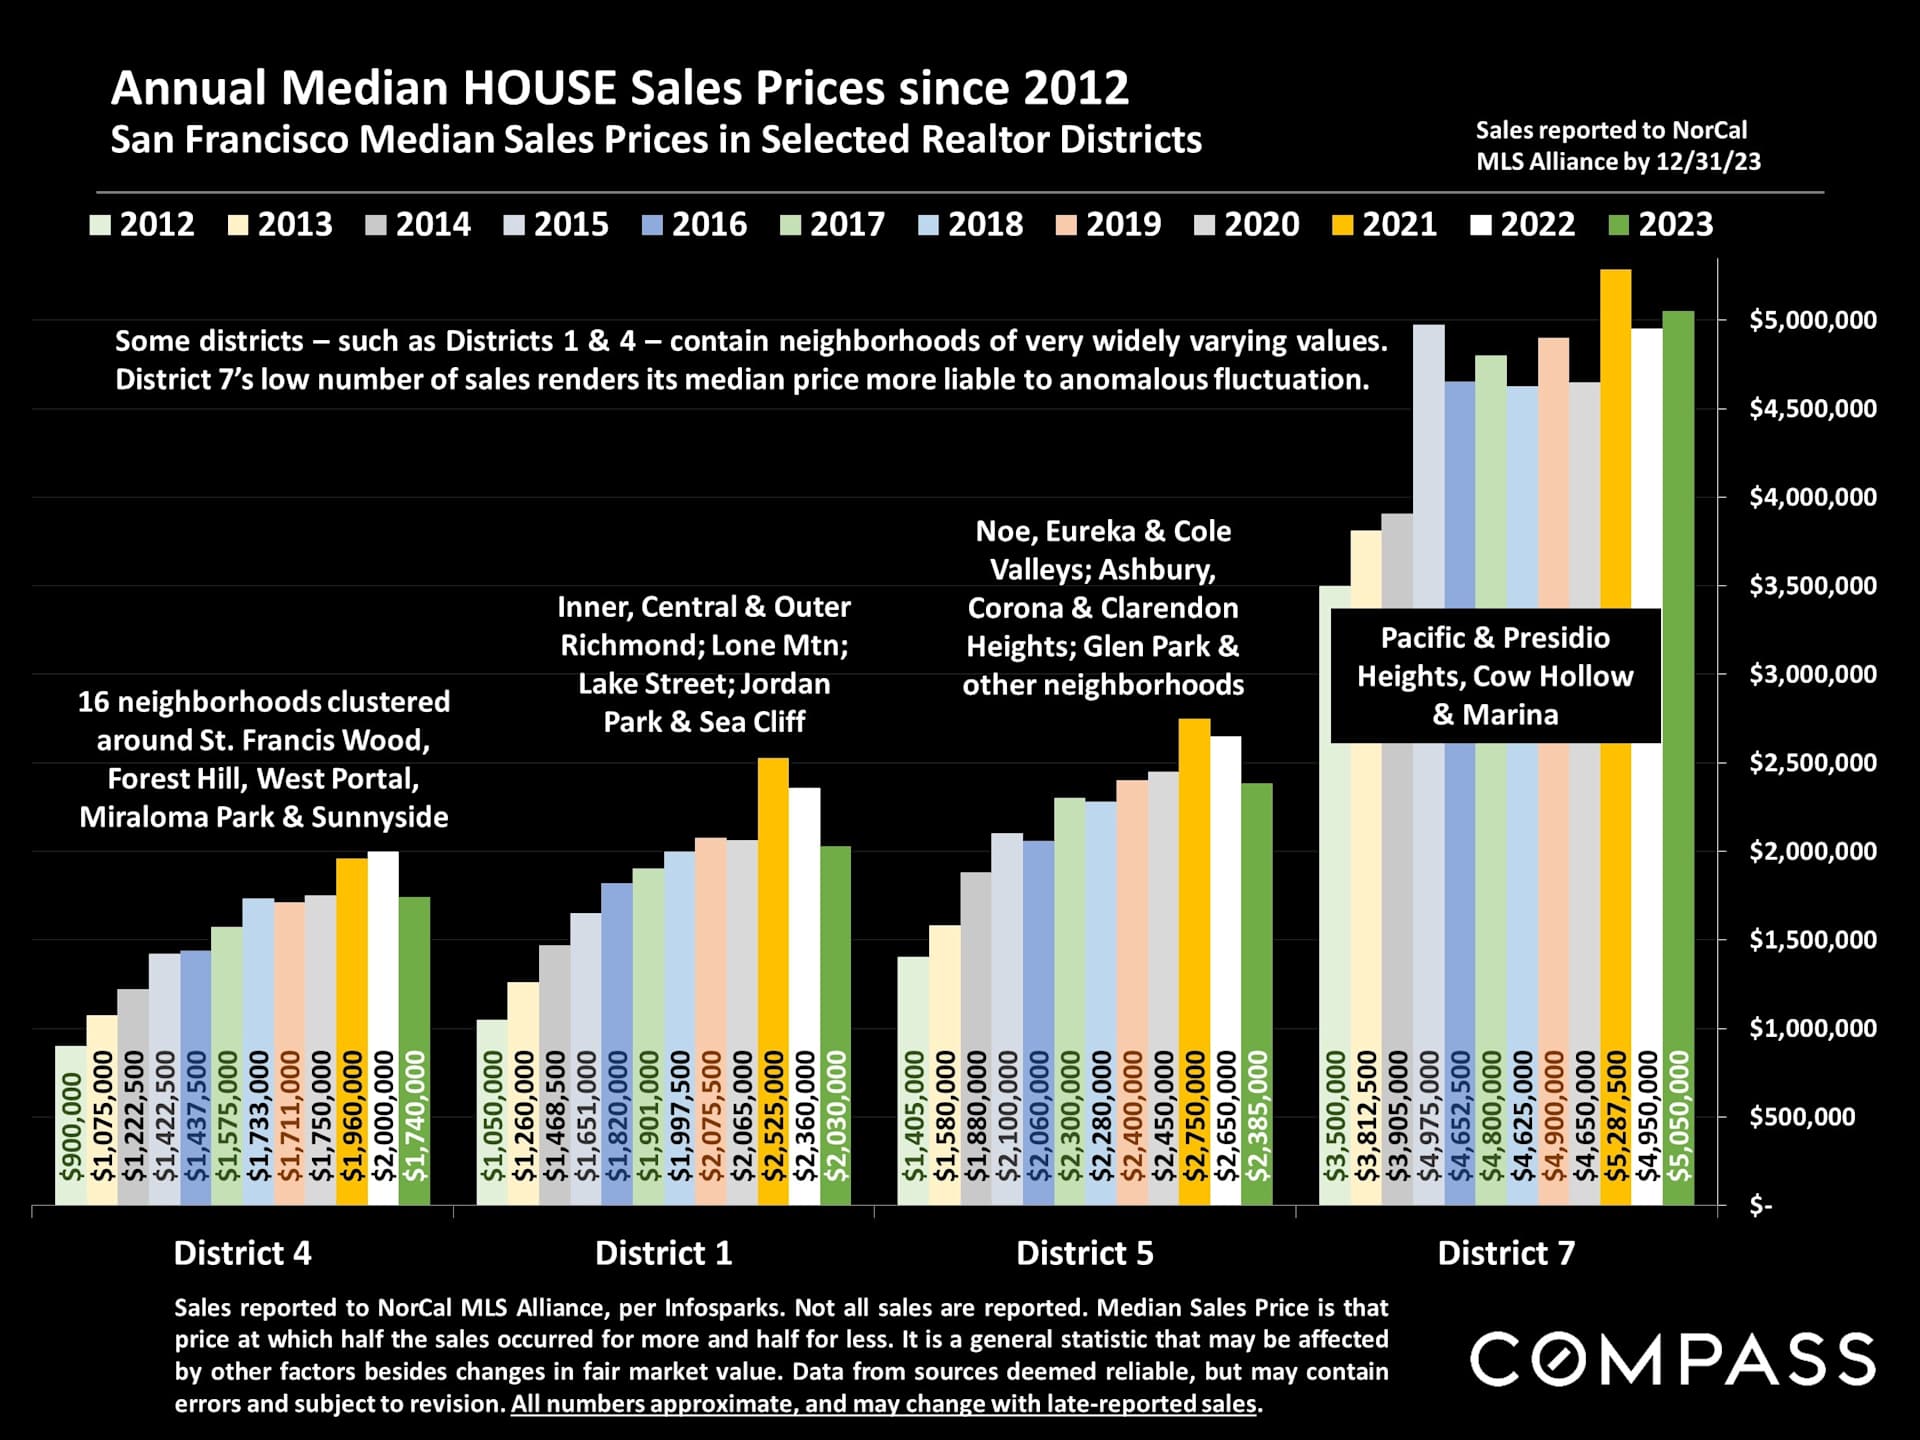
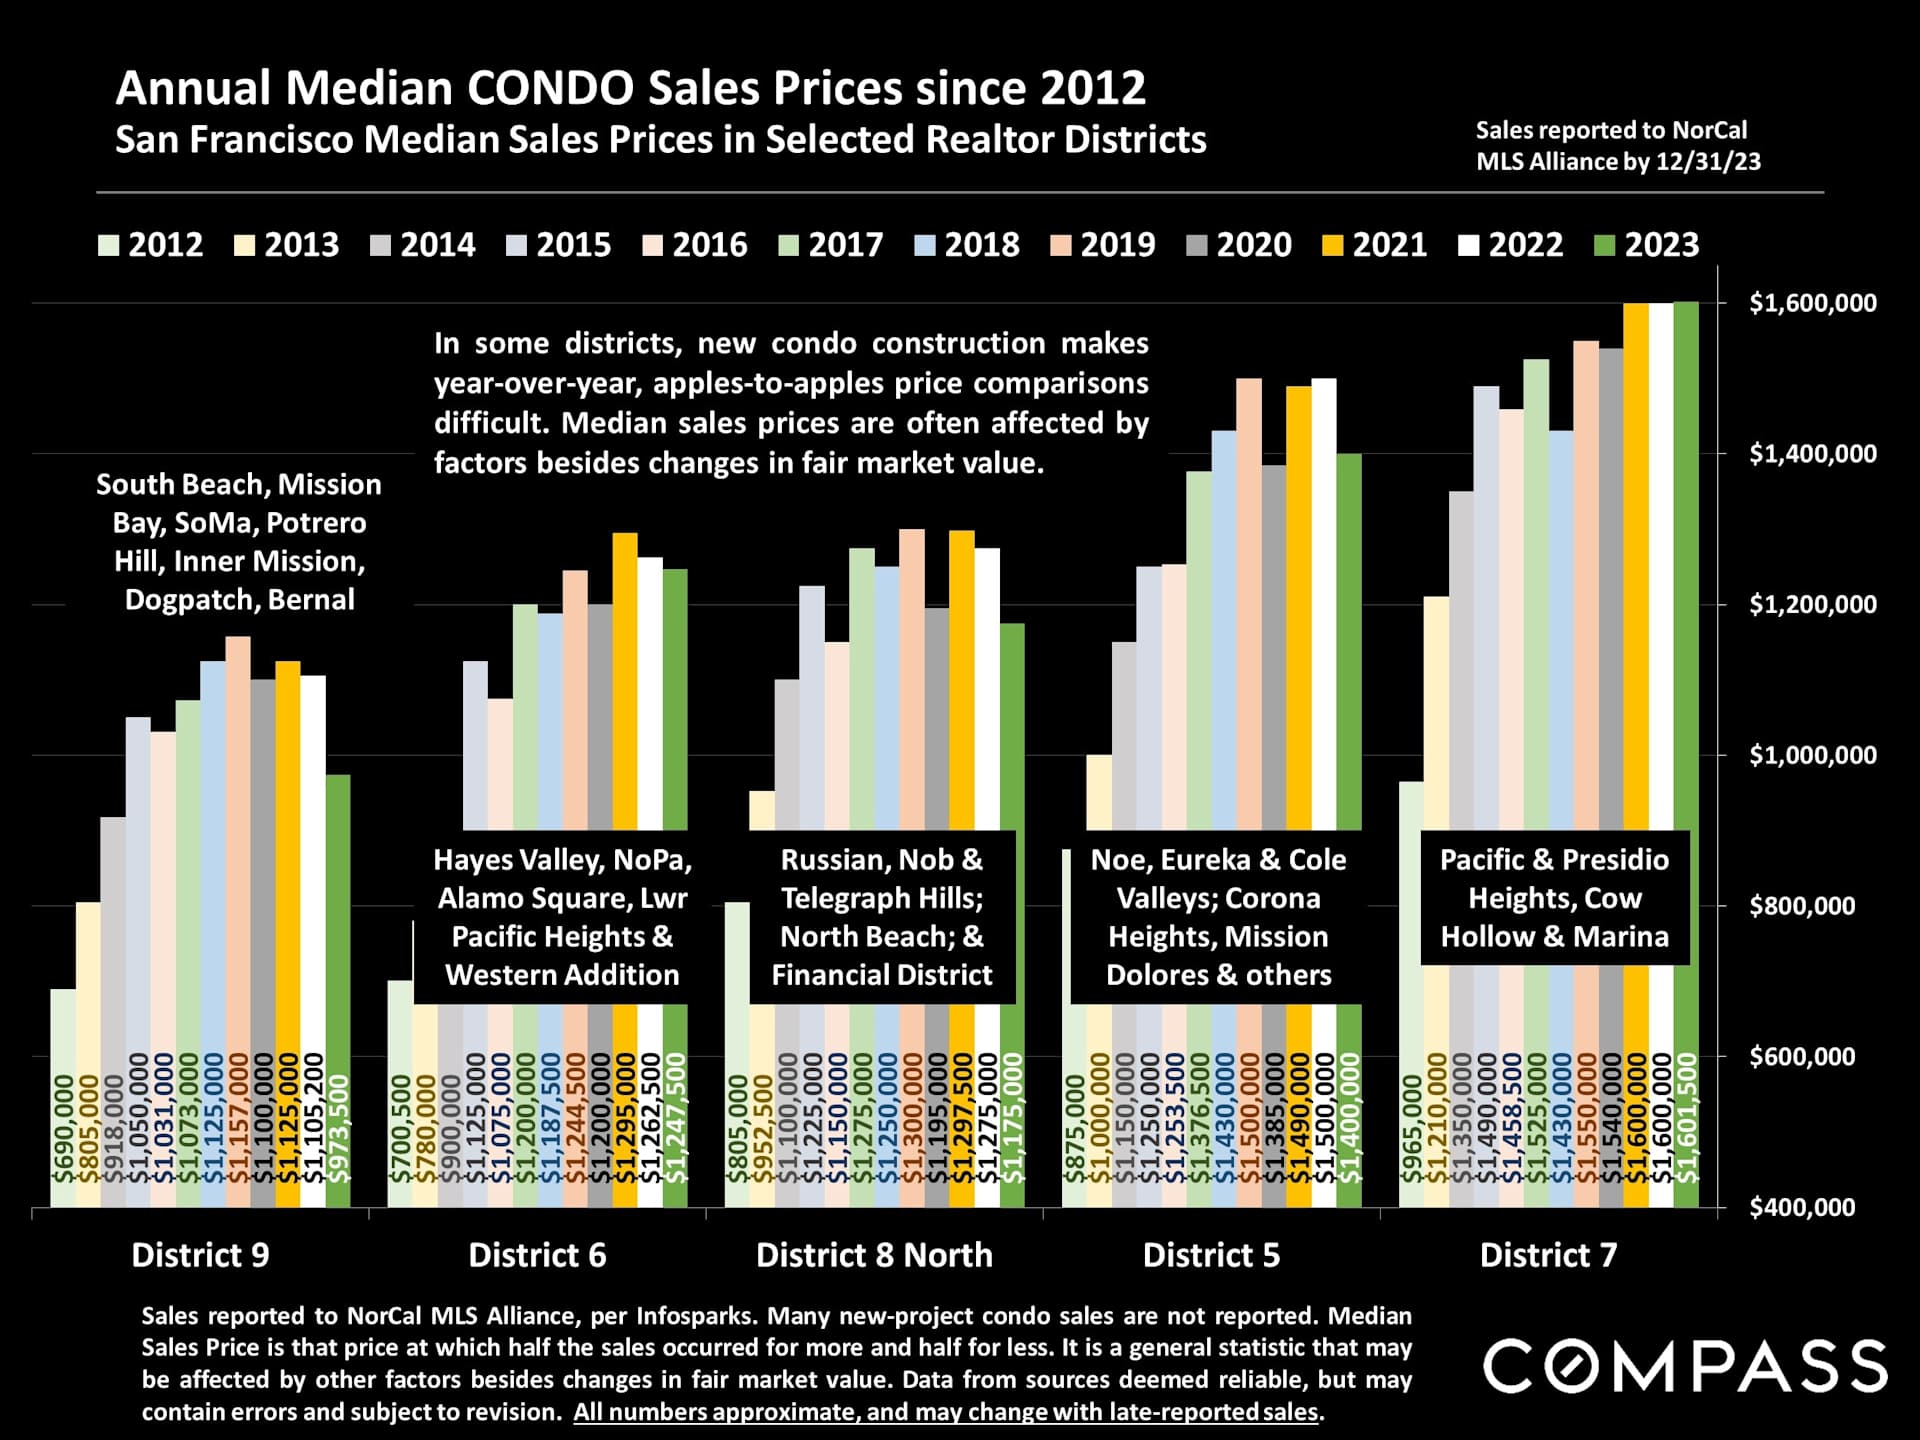
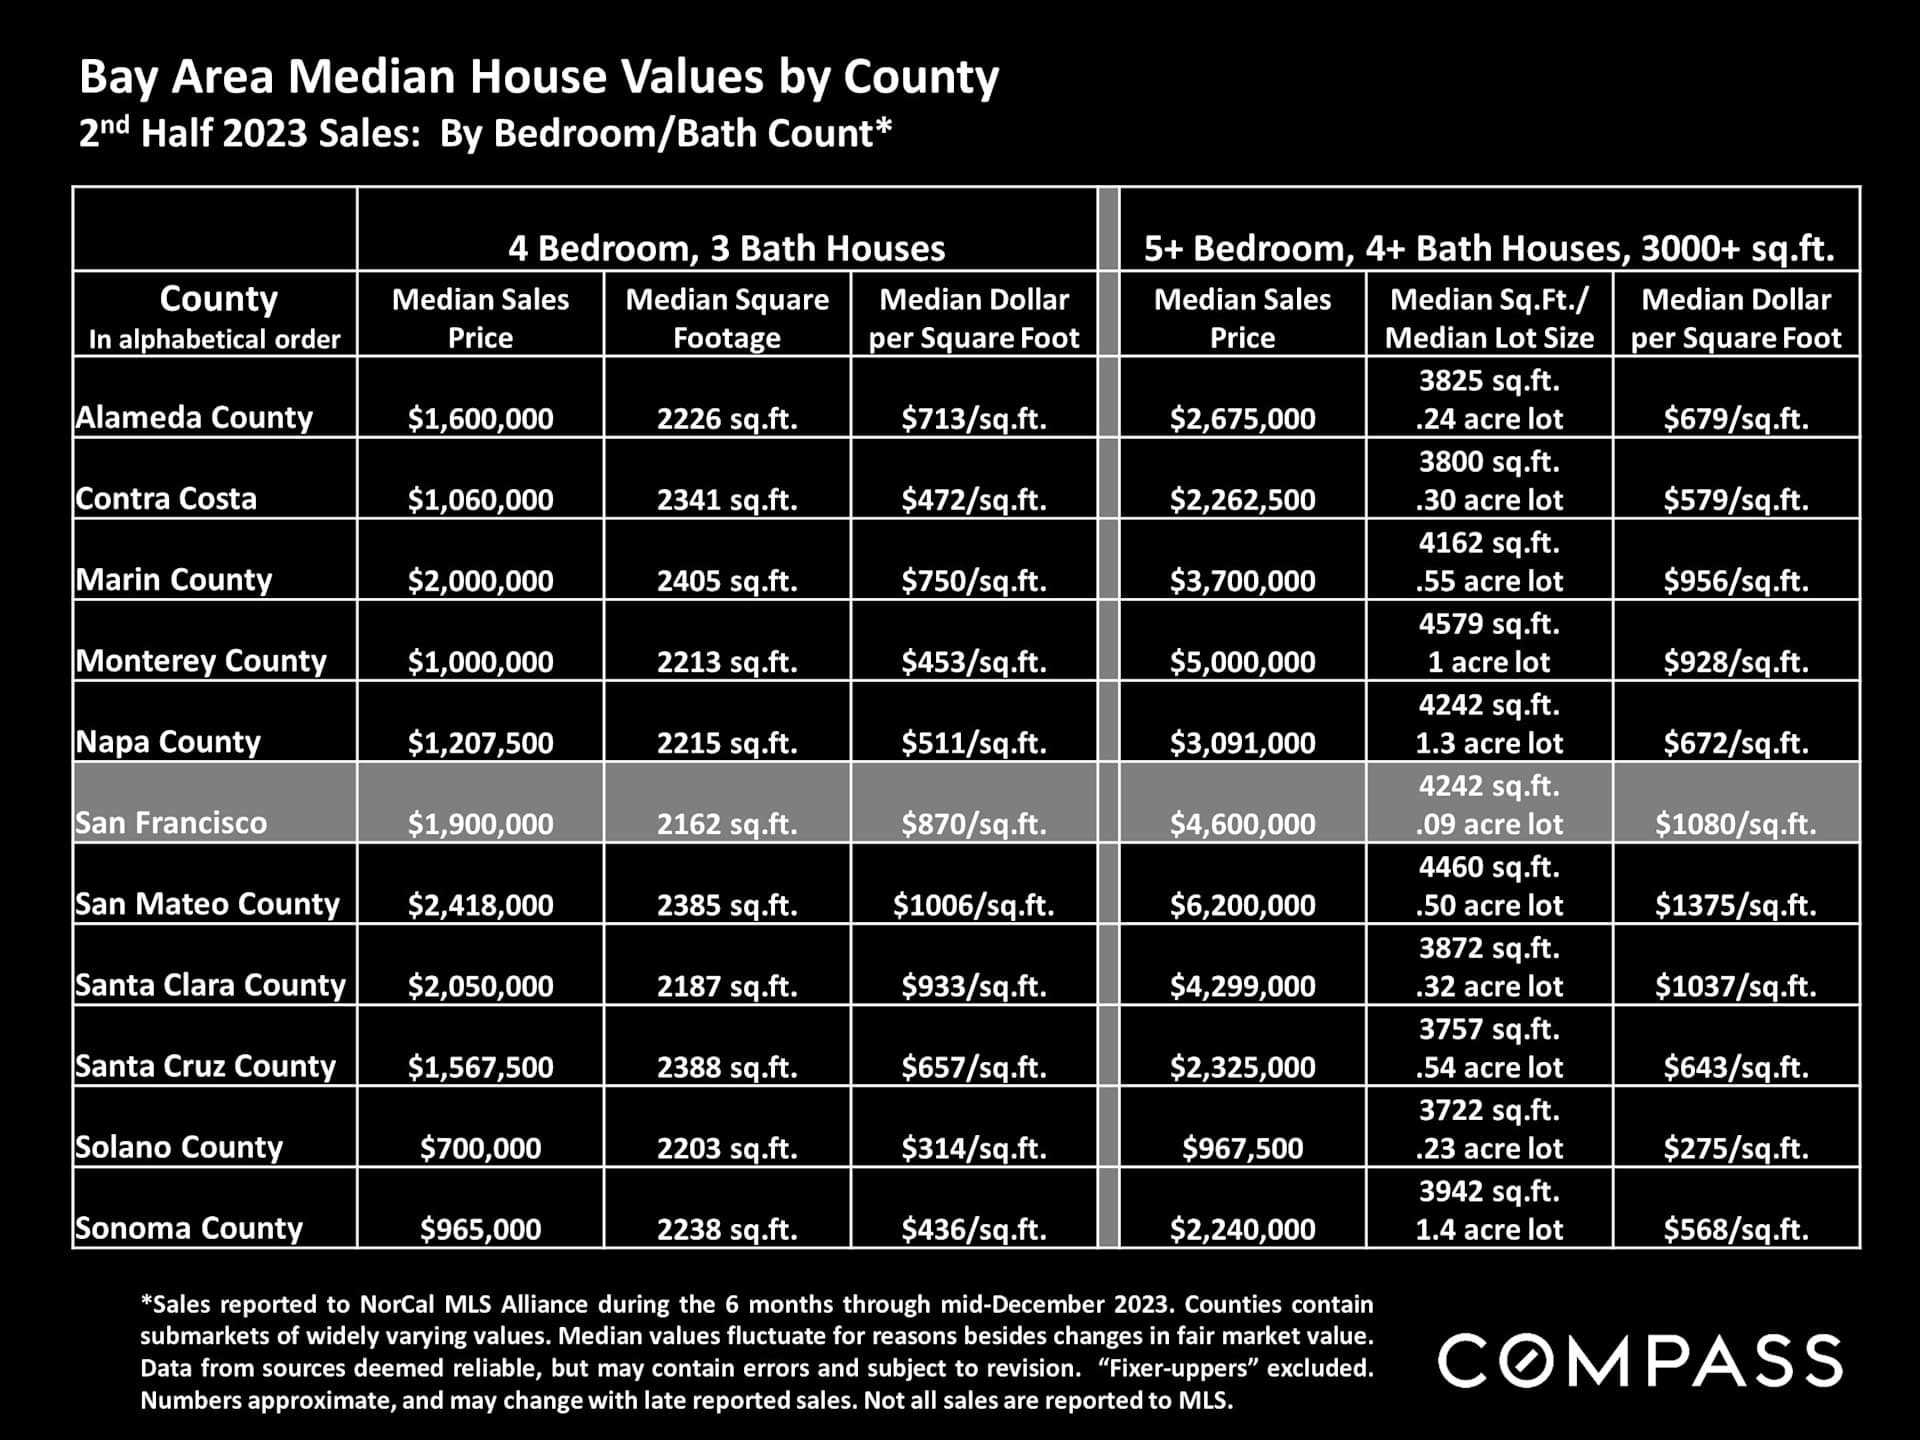
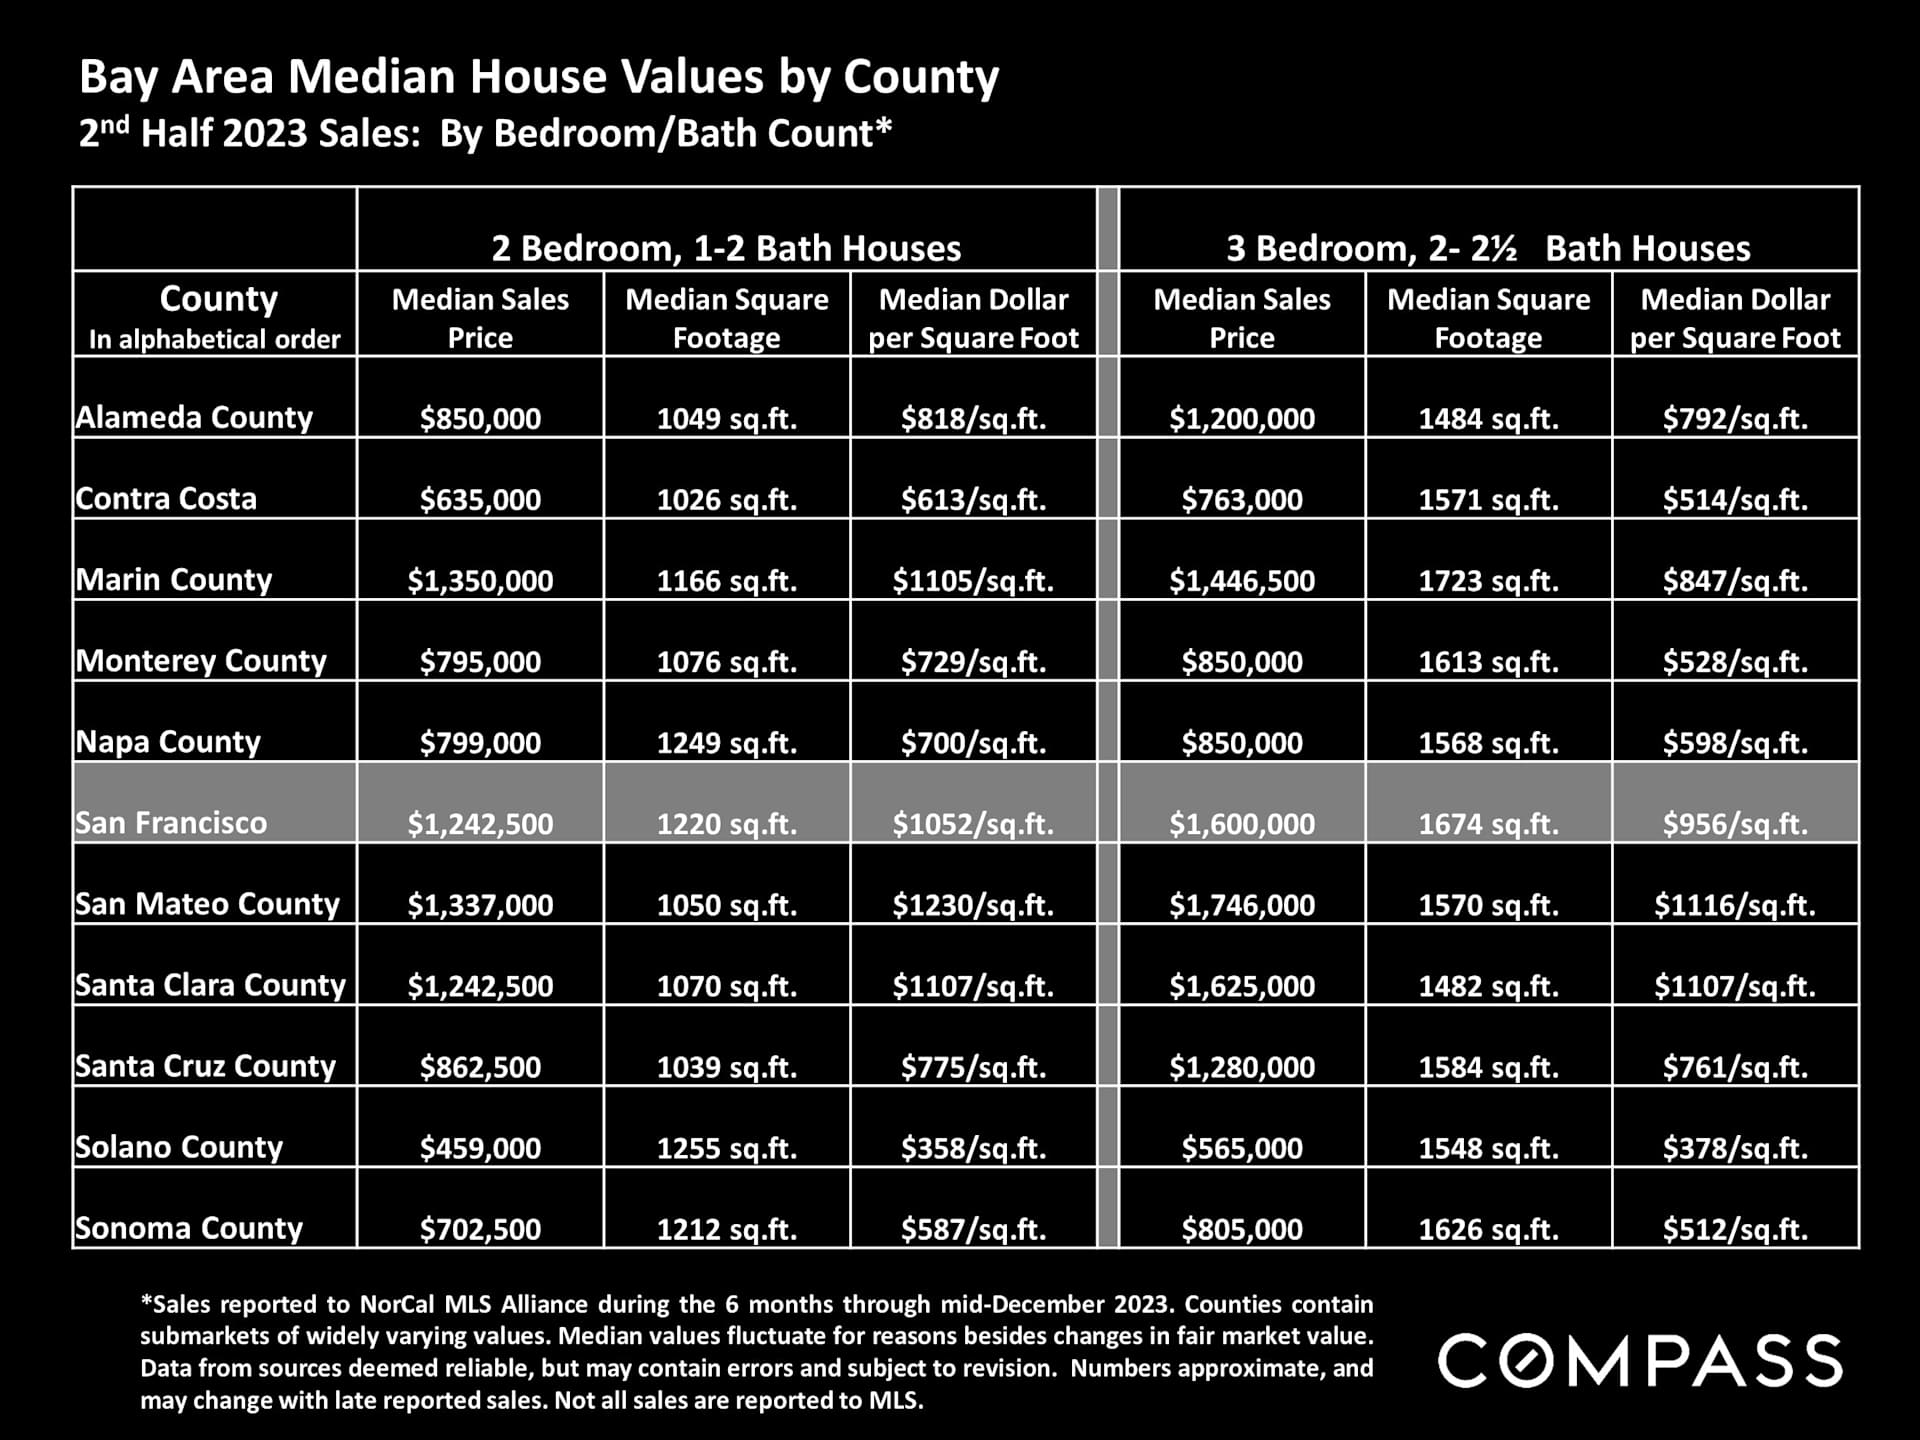
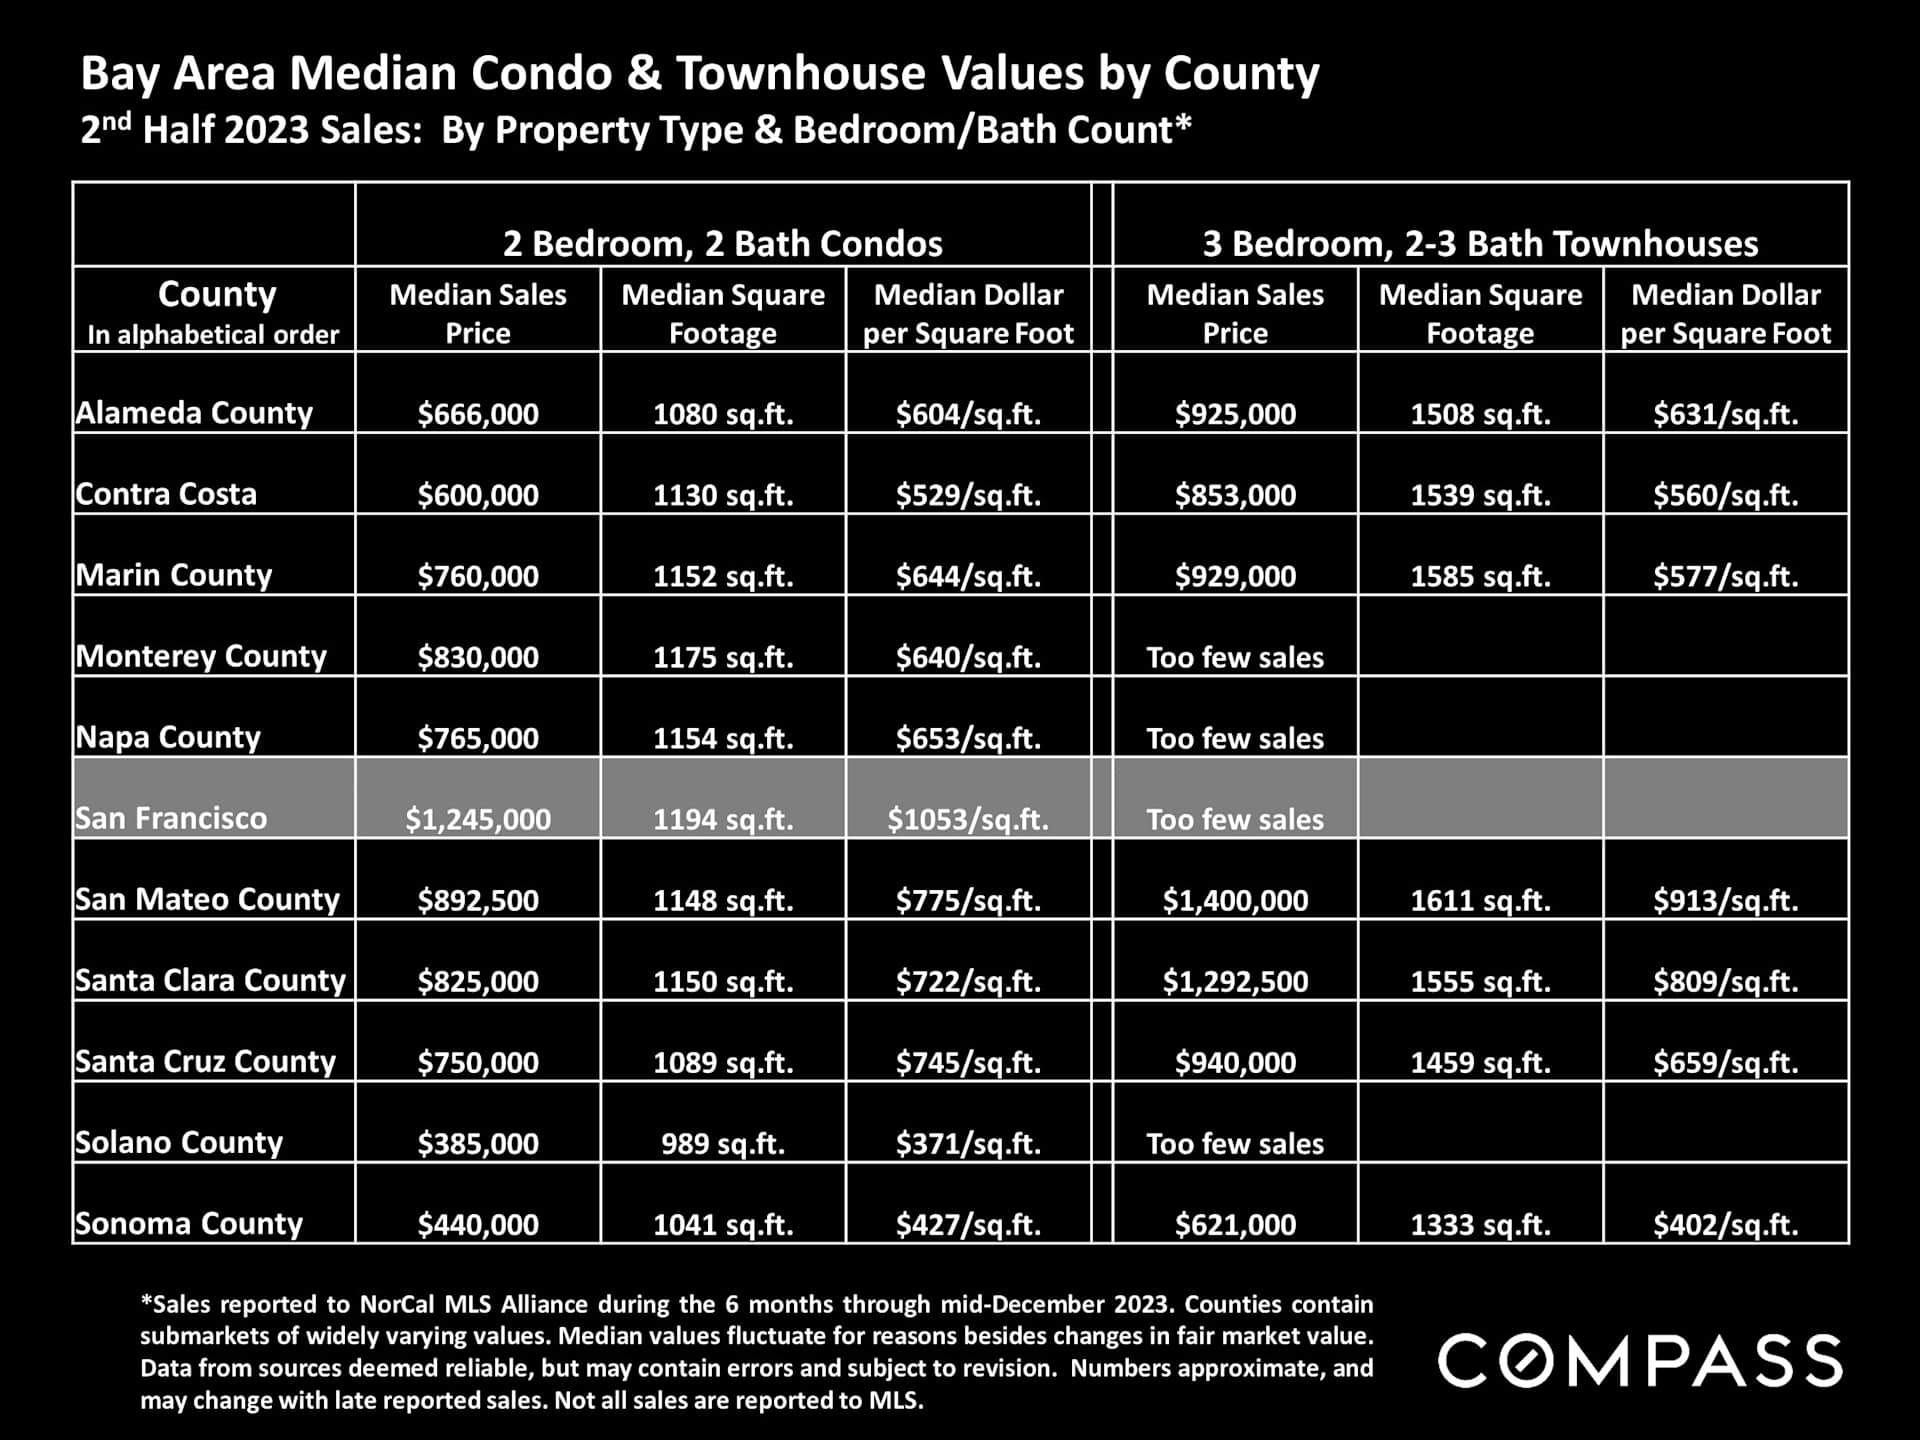
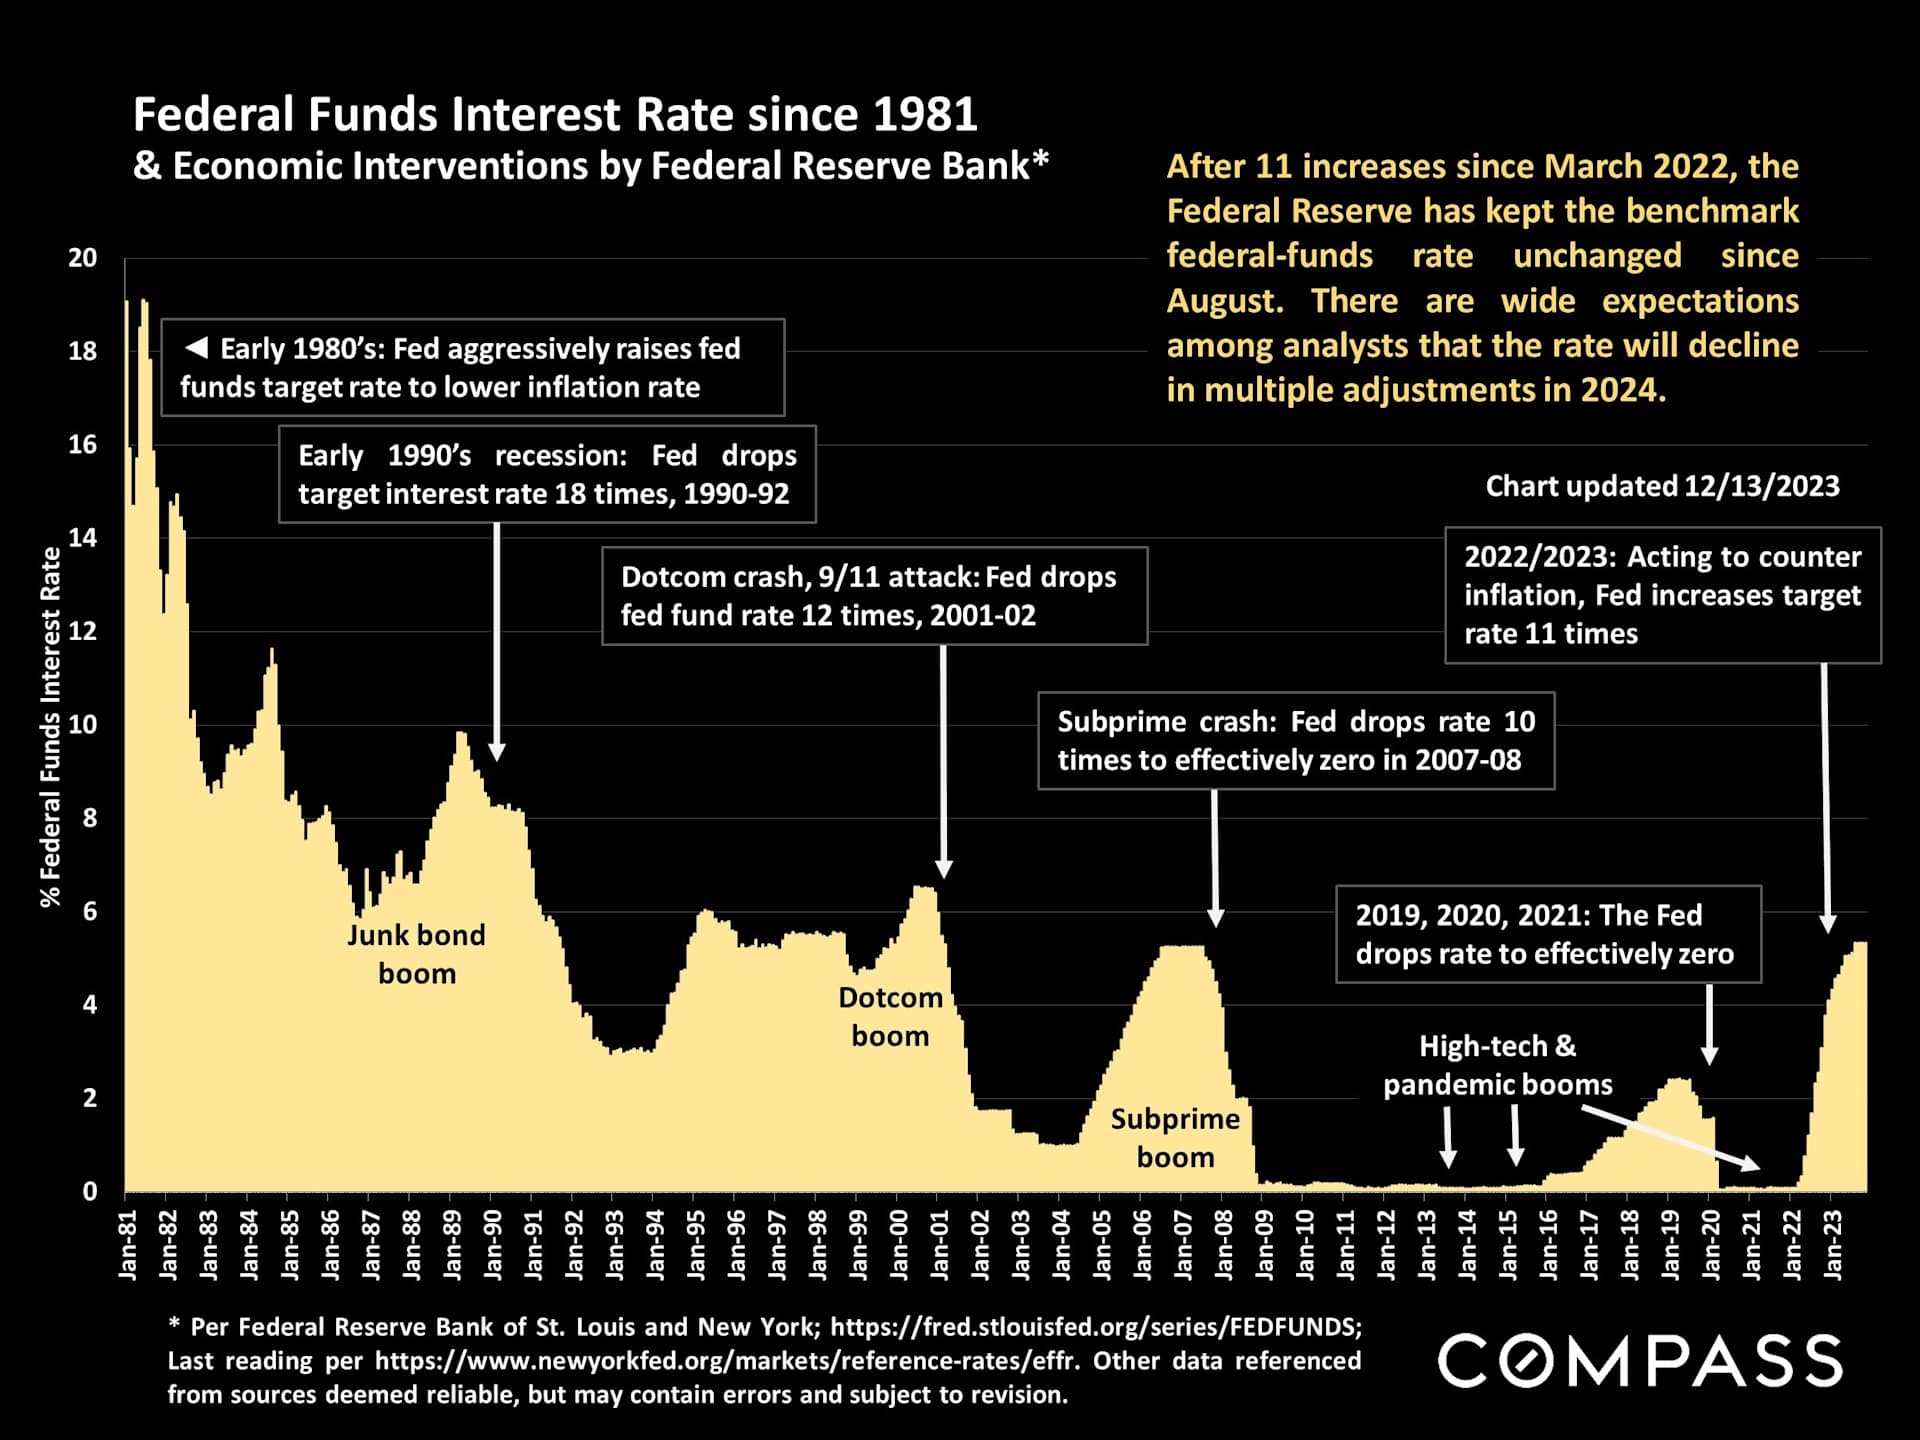
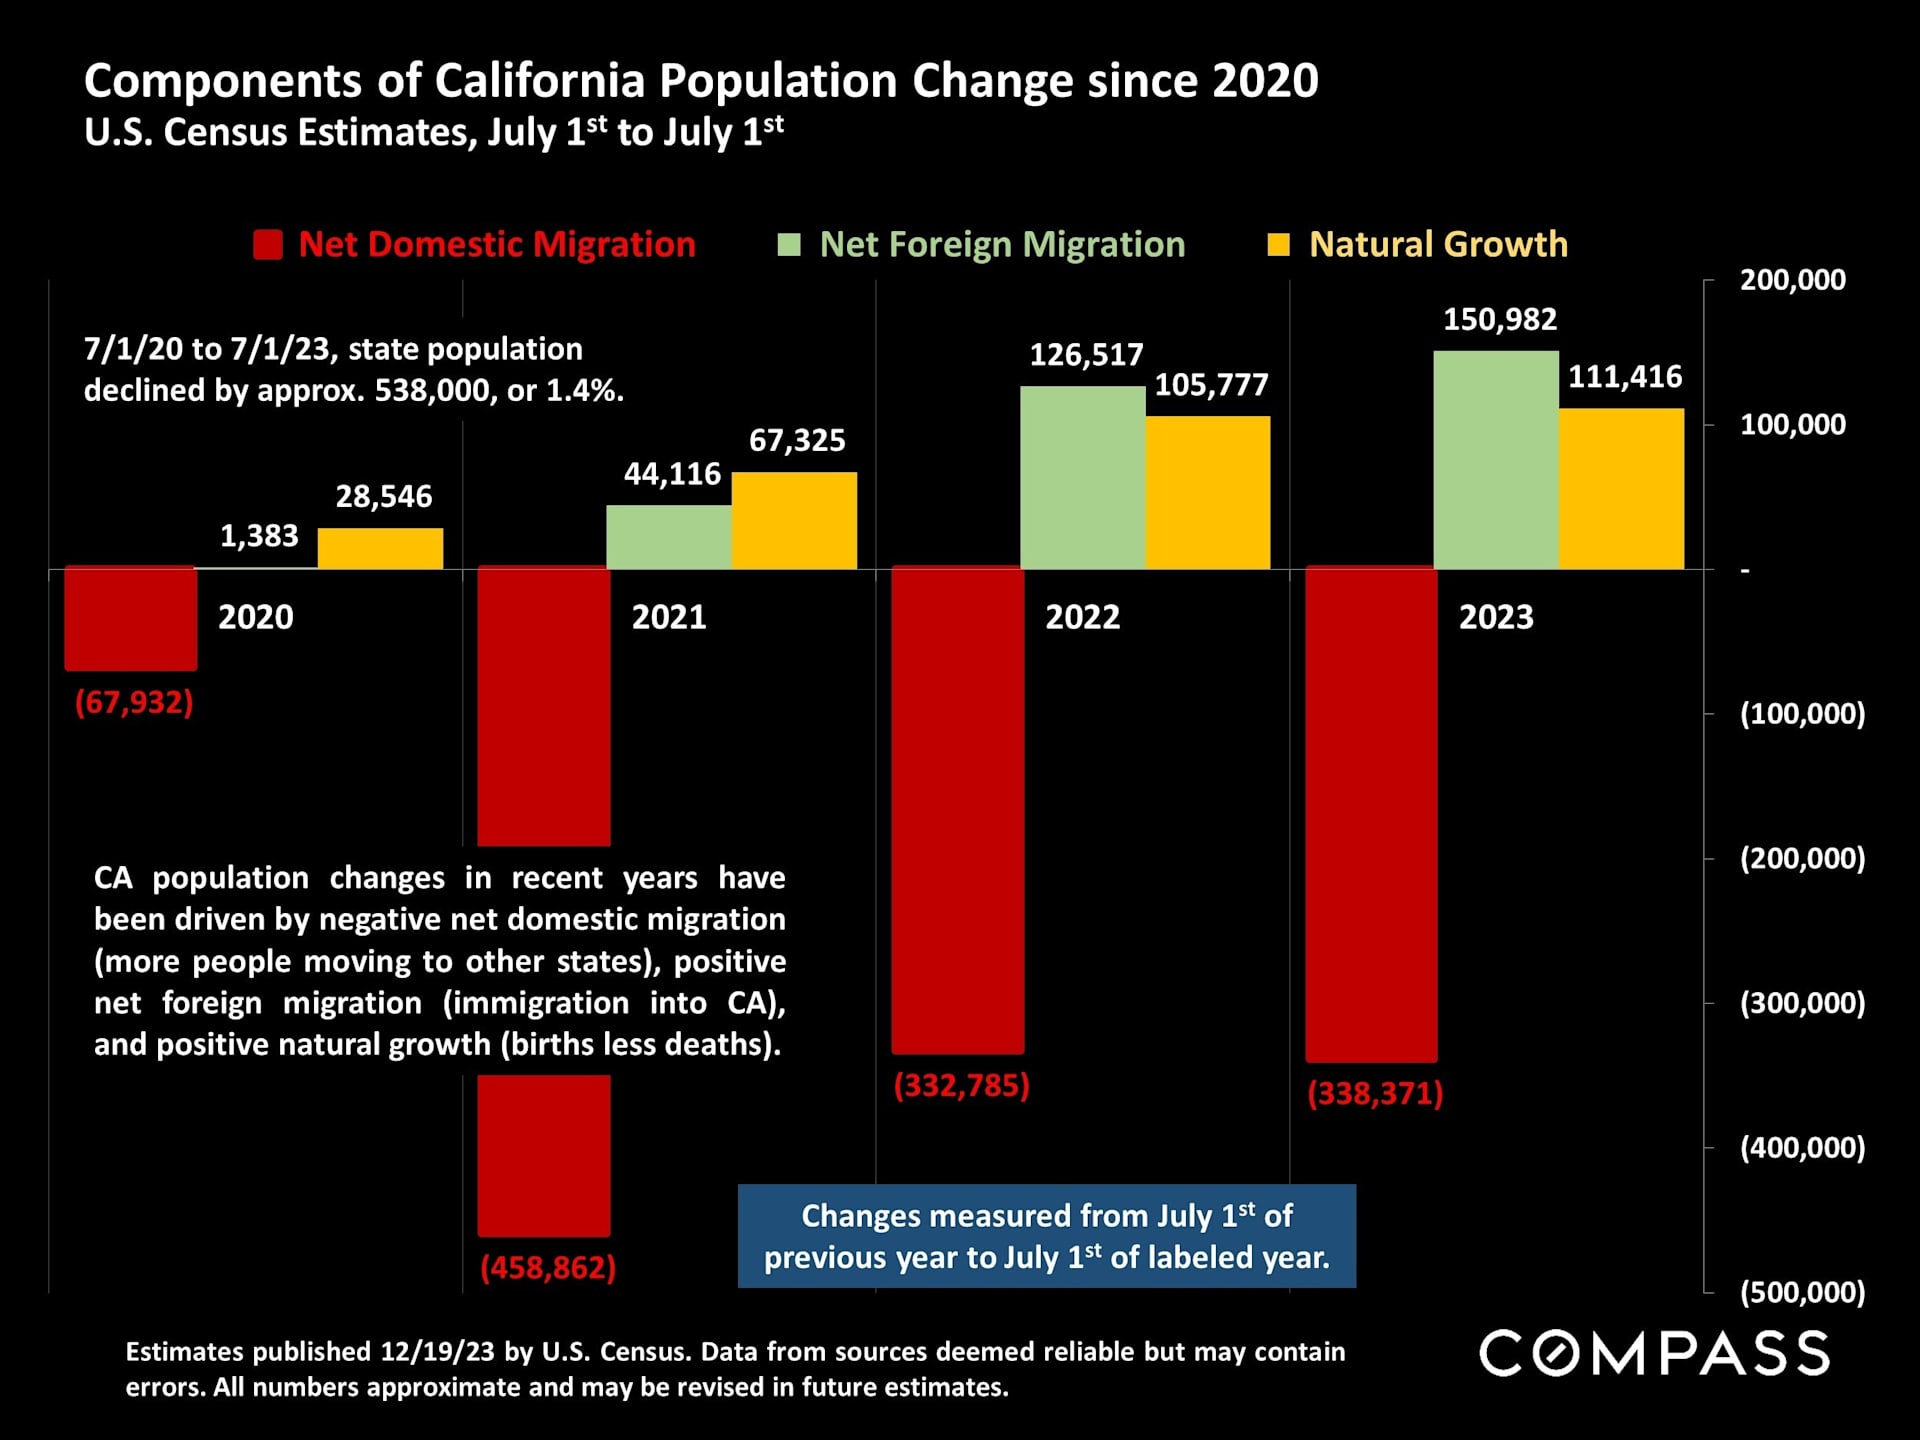
Economic indicators and San Francisco housing market outlook for 2024, with mortgage-rate, stock-market, and home-price statistics.Economic and housing-market quotes describe falling inflation and mortgage rates, improving sentiment, and a nascent housing rebound.2023 mortgage-rate chart: 30-year rates peaked at 7.79% in October and fell to 6.61% by December.San Francisco median house prices chart, with green annual bars showing a 2021 peak and decline through 2023.San Francisco quarterly median house prices, 2012–2023, peaking at $2 million in Q2 2022.Chart of San Francisco median condo prices, rising to a $1.225 million peak in 2021 before declining through 2023.Chart of San Francisco condo prices by quarter, 2012–2023, peaking in 2022 before declining.Bar chart comparing San Francisco condo prices by neighborhood from 2005 to 2023, with pandemic and 2007–08 annotations.Chart of San Francisco condo and TIC median prices from 2000 to 2023, with market-event annotations.San Francisco median home values per square foot, with yearly house and condo prices from 2005 to 2023.Bar chart of San Francisco annual new listings from 2005 to 2023, with 2023 at 6,233 listings.Bar chart of San Francisco annual home sales from 2005–2023, showing 4,125 sales in 2023, down 27% from 2022.Chart of San Francisco home sales by year, highlighting the 2021 peak and 27% decline in 2023.San Francisco 2023 home sales by price segment, with a pie chart and property-type breakdown.San Francisco 2023 inventory-supply chart compares house and condo readings across five price ranges.Chart comparing San Francisco sales of homes over $5 million and $10 million annually from 2005 to 2023.Chart of 2023 San Francisco luxury home sales by district and price segment; D7 leads with 68 sales.Chart of 2023 San Francisco luxury condo, co-op, TIC, and townhouse sales by district and price segment.San Francisco luxury home market tables showing top sales and active or pending listing prices by neighborhood.Bar chart of San Francisco active and coming-soon listings, showing 752 listings on January 1, 2024.Chart of San Francisco listings going into contract, showing monthly trends from 2020 through 2023.Chart comparing annual average days on market for San Francisco condo and house sales, 2005–2023.Bar chart comparing San Francisco house and condo sales above list price from 2005 to 2023.Bar chart comparing San Francisco house and condo sale prices to list prices from 2005 to 2023.Chart of U.S. all-cash home buyers, with the share rising to nearly 28% in 2023.Bar chart comparing annual median home sale prices from 2012 to 2023 in four San Francisco districts.Chart comparing annual median home sale prices from 2012 to 2023 in four San Francisco districts.Bar chart comparing annual median condo sale prices across five San Francisco districts from 2012 to 2023.Table comparing Bay Area median home values by county, with the San Francisco row highlighted.Table comparing second-half 2023 median prices, square footage, and price per square foot by county and house size.Bay Area condo and townhouse value chart by county, with San Francisco’s condo figures highlighted.Chart of federal funds rates from 1981 to 2023, annotated with economic booms and Federal Reserve interventions.California population change infographic comparing domestic migration, foreign migration, and natural growth from 2020 to 2023.Definitions, limitations, and legal disclaimers for real estate market statistics.

Work With Us

We will help you understand the complex aspects of the transaction and share our expertise so that you can make the best decisions possible. We are experienced, market savvy, and energetic. With both of us working for our clients, you get twice the amount of attention and insight.