

The SF Team, Eva + James, Compass

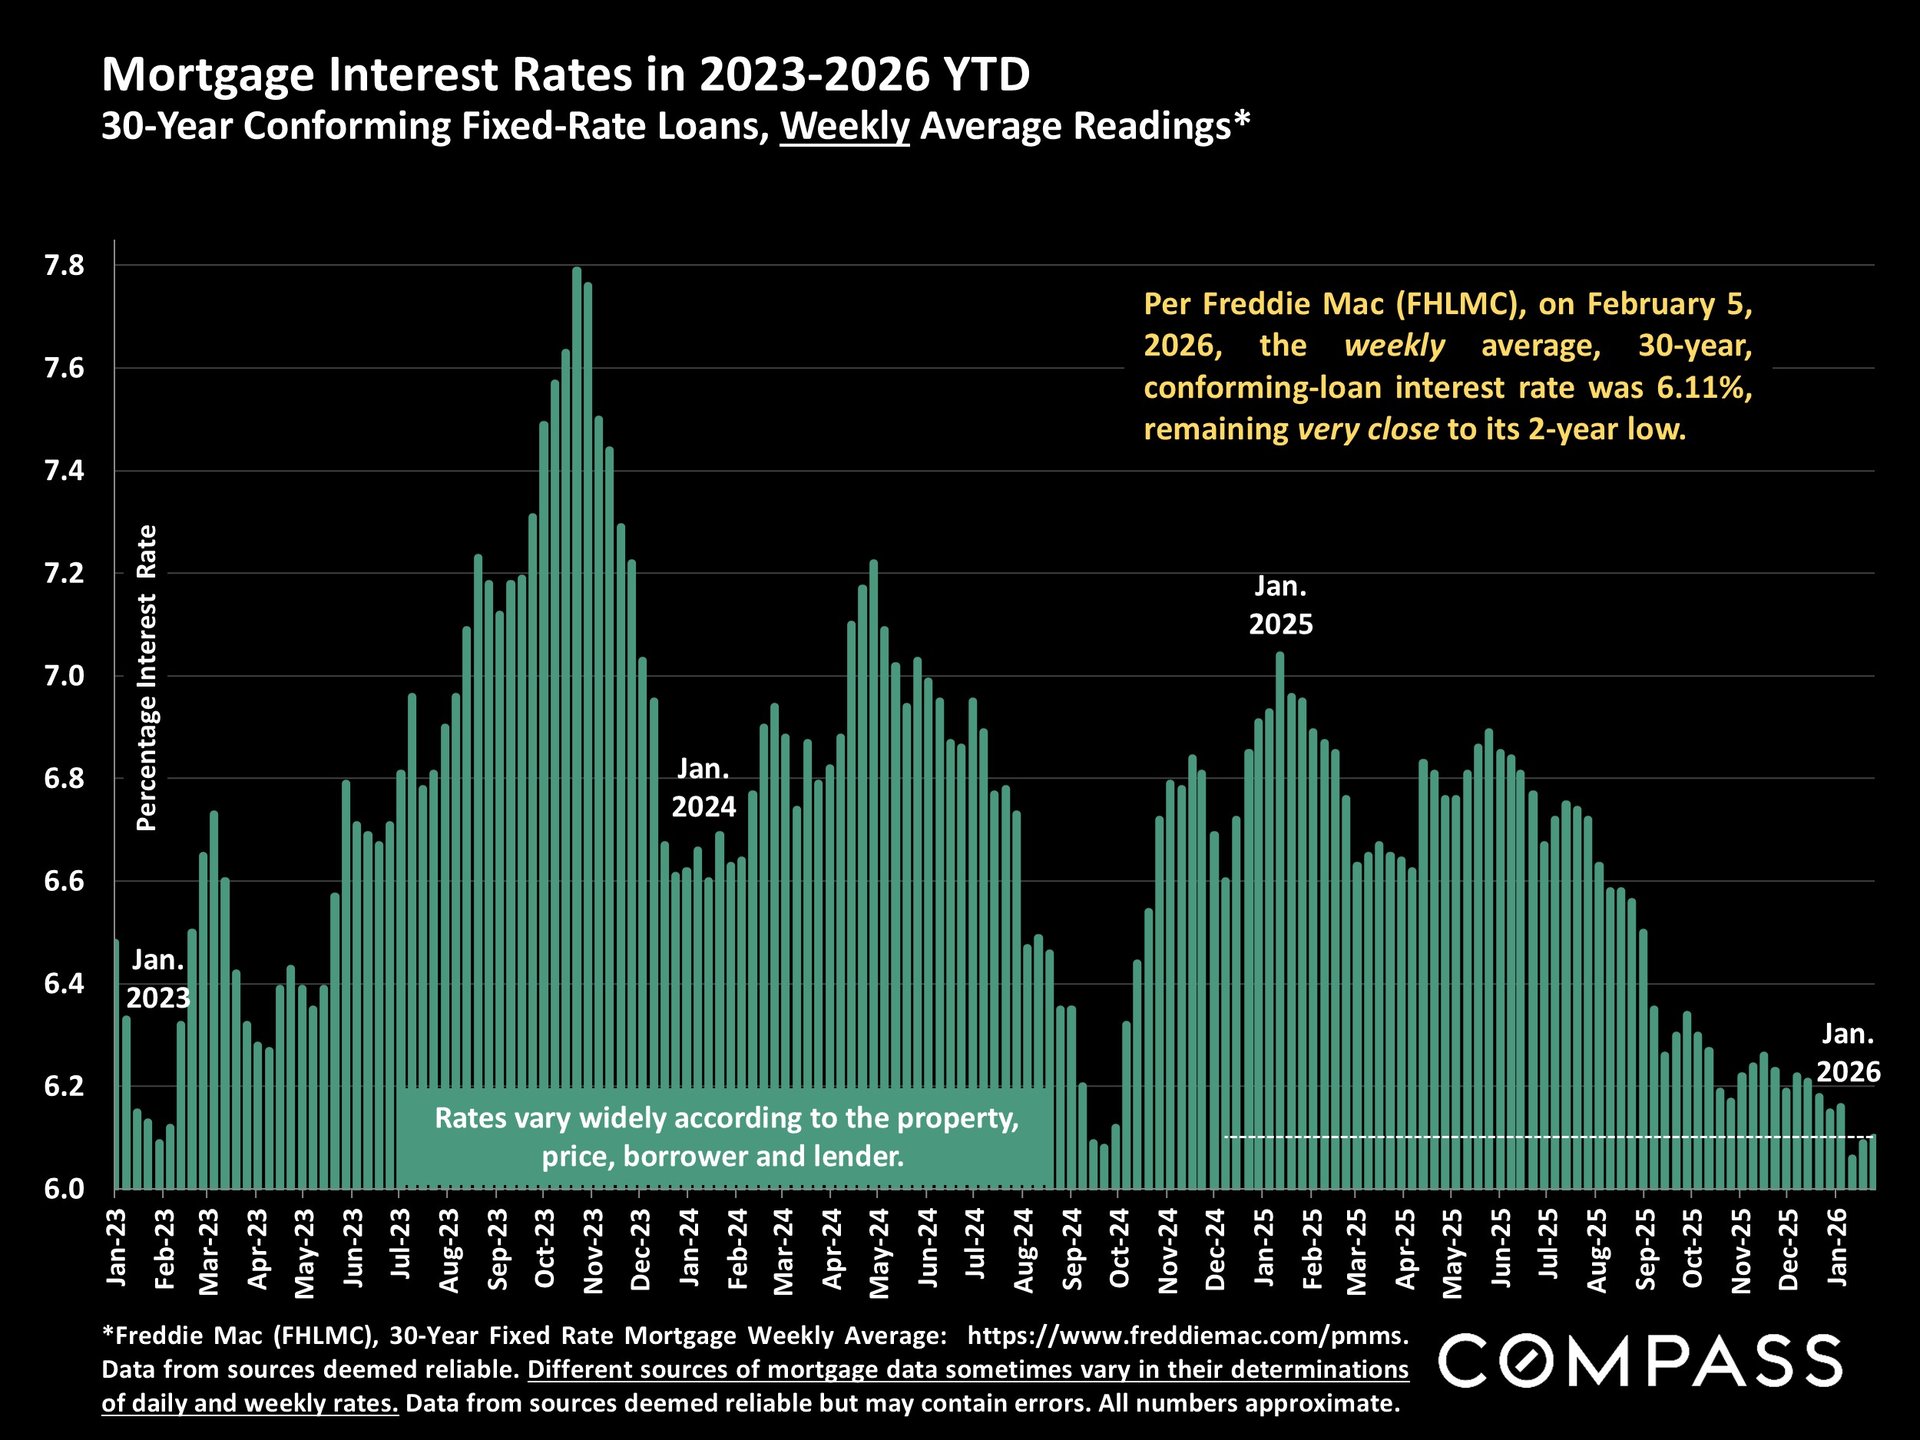
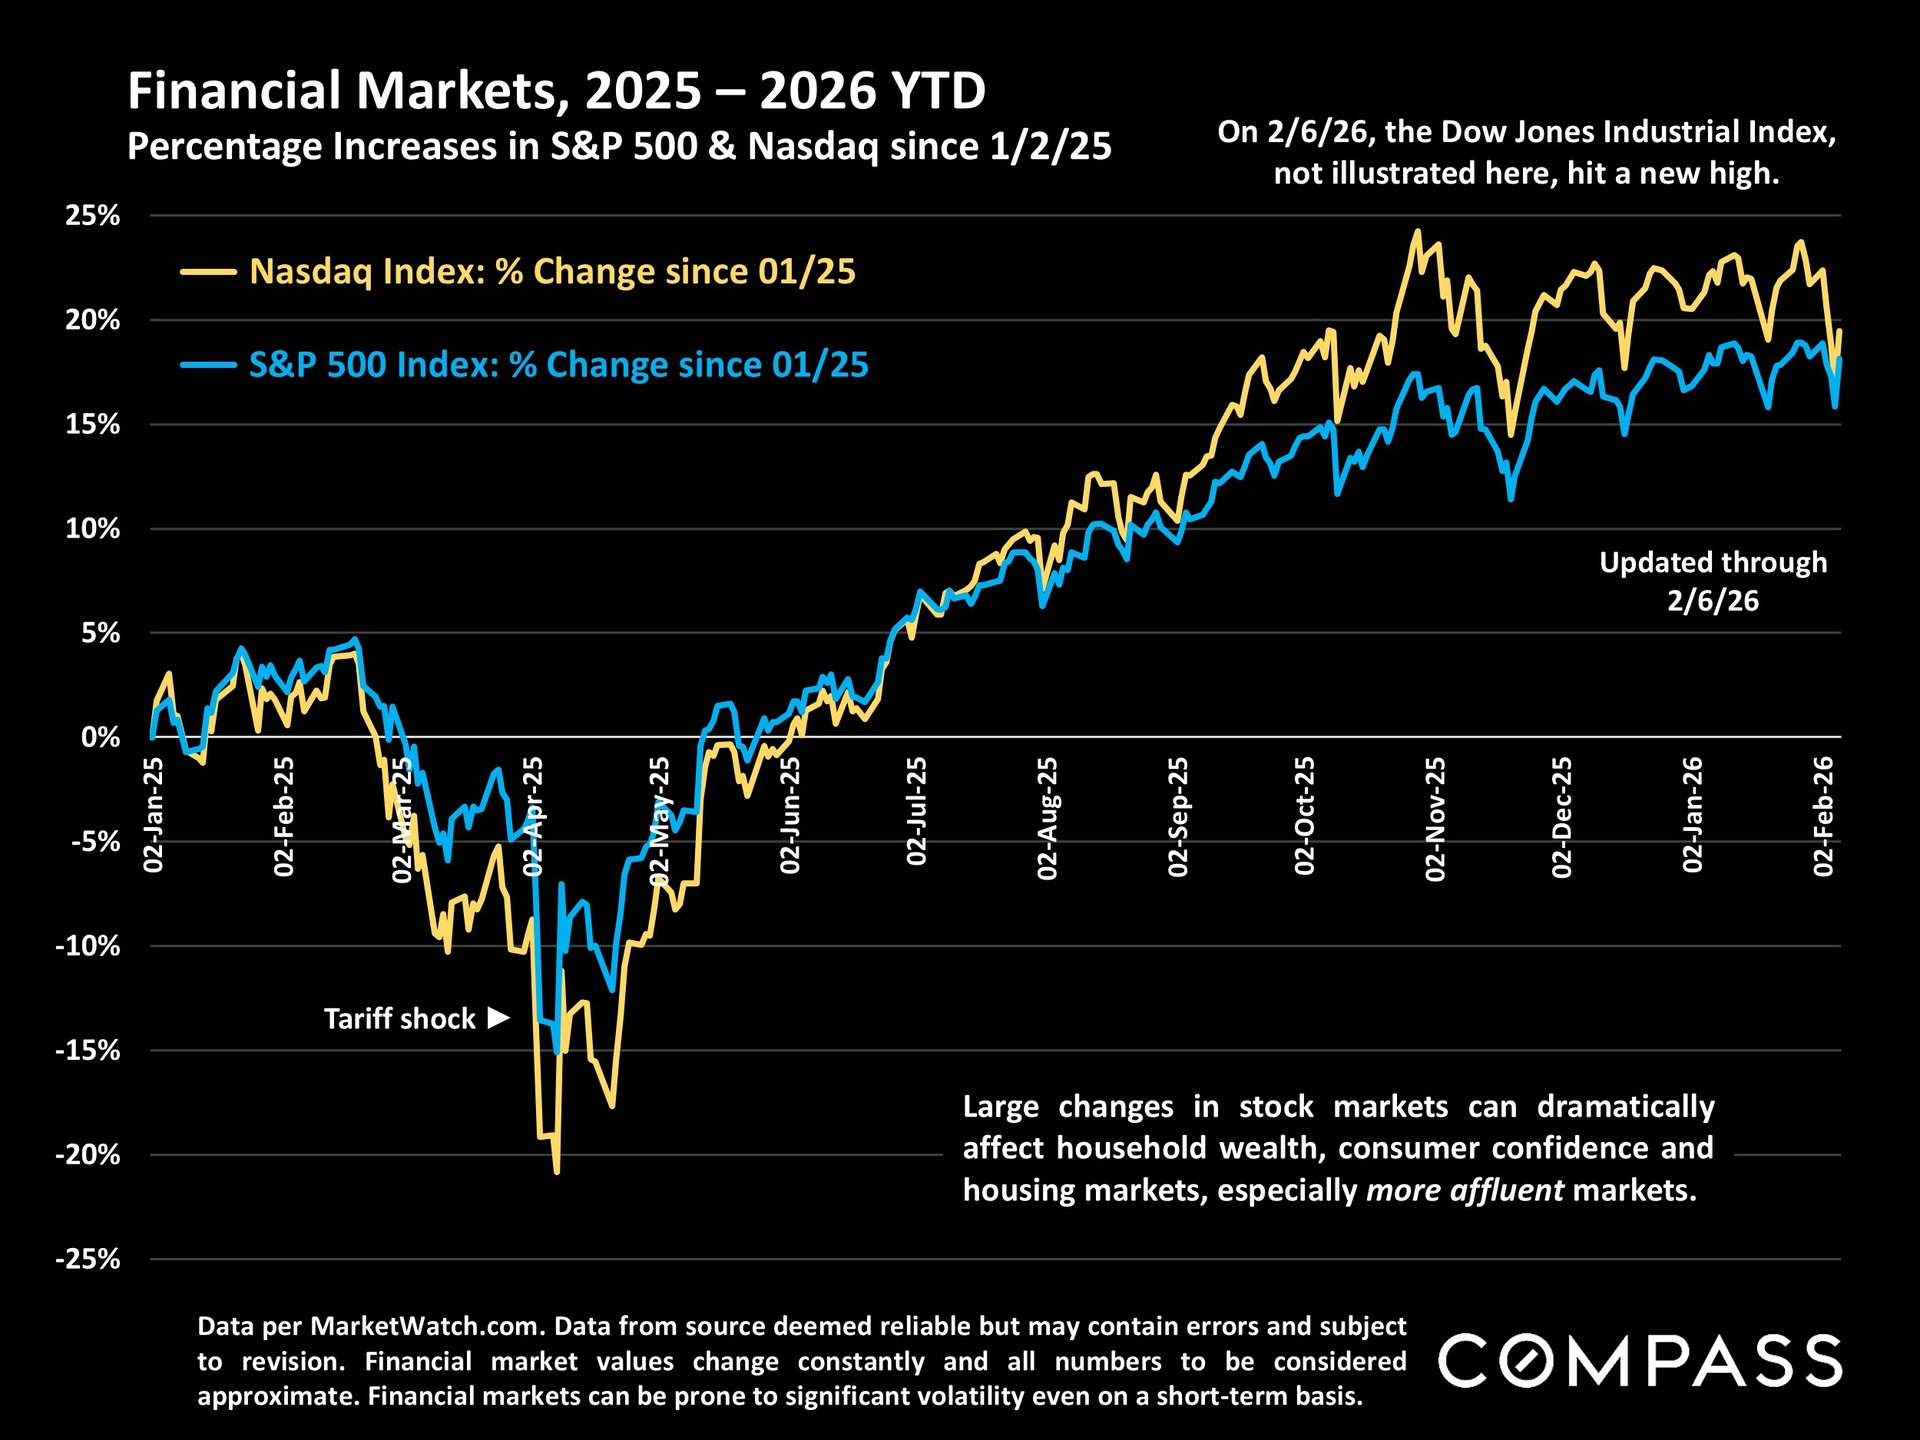
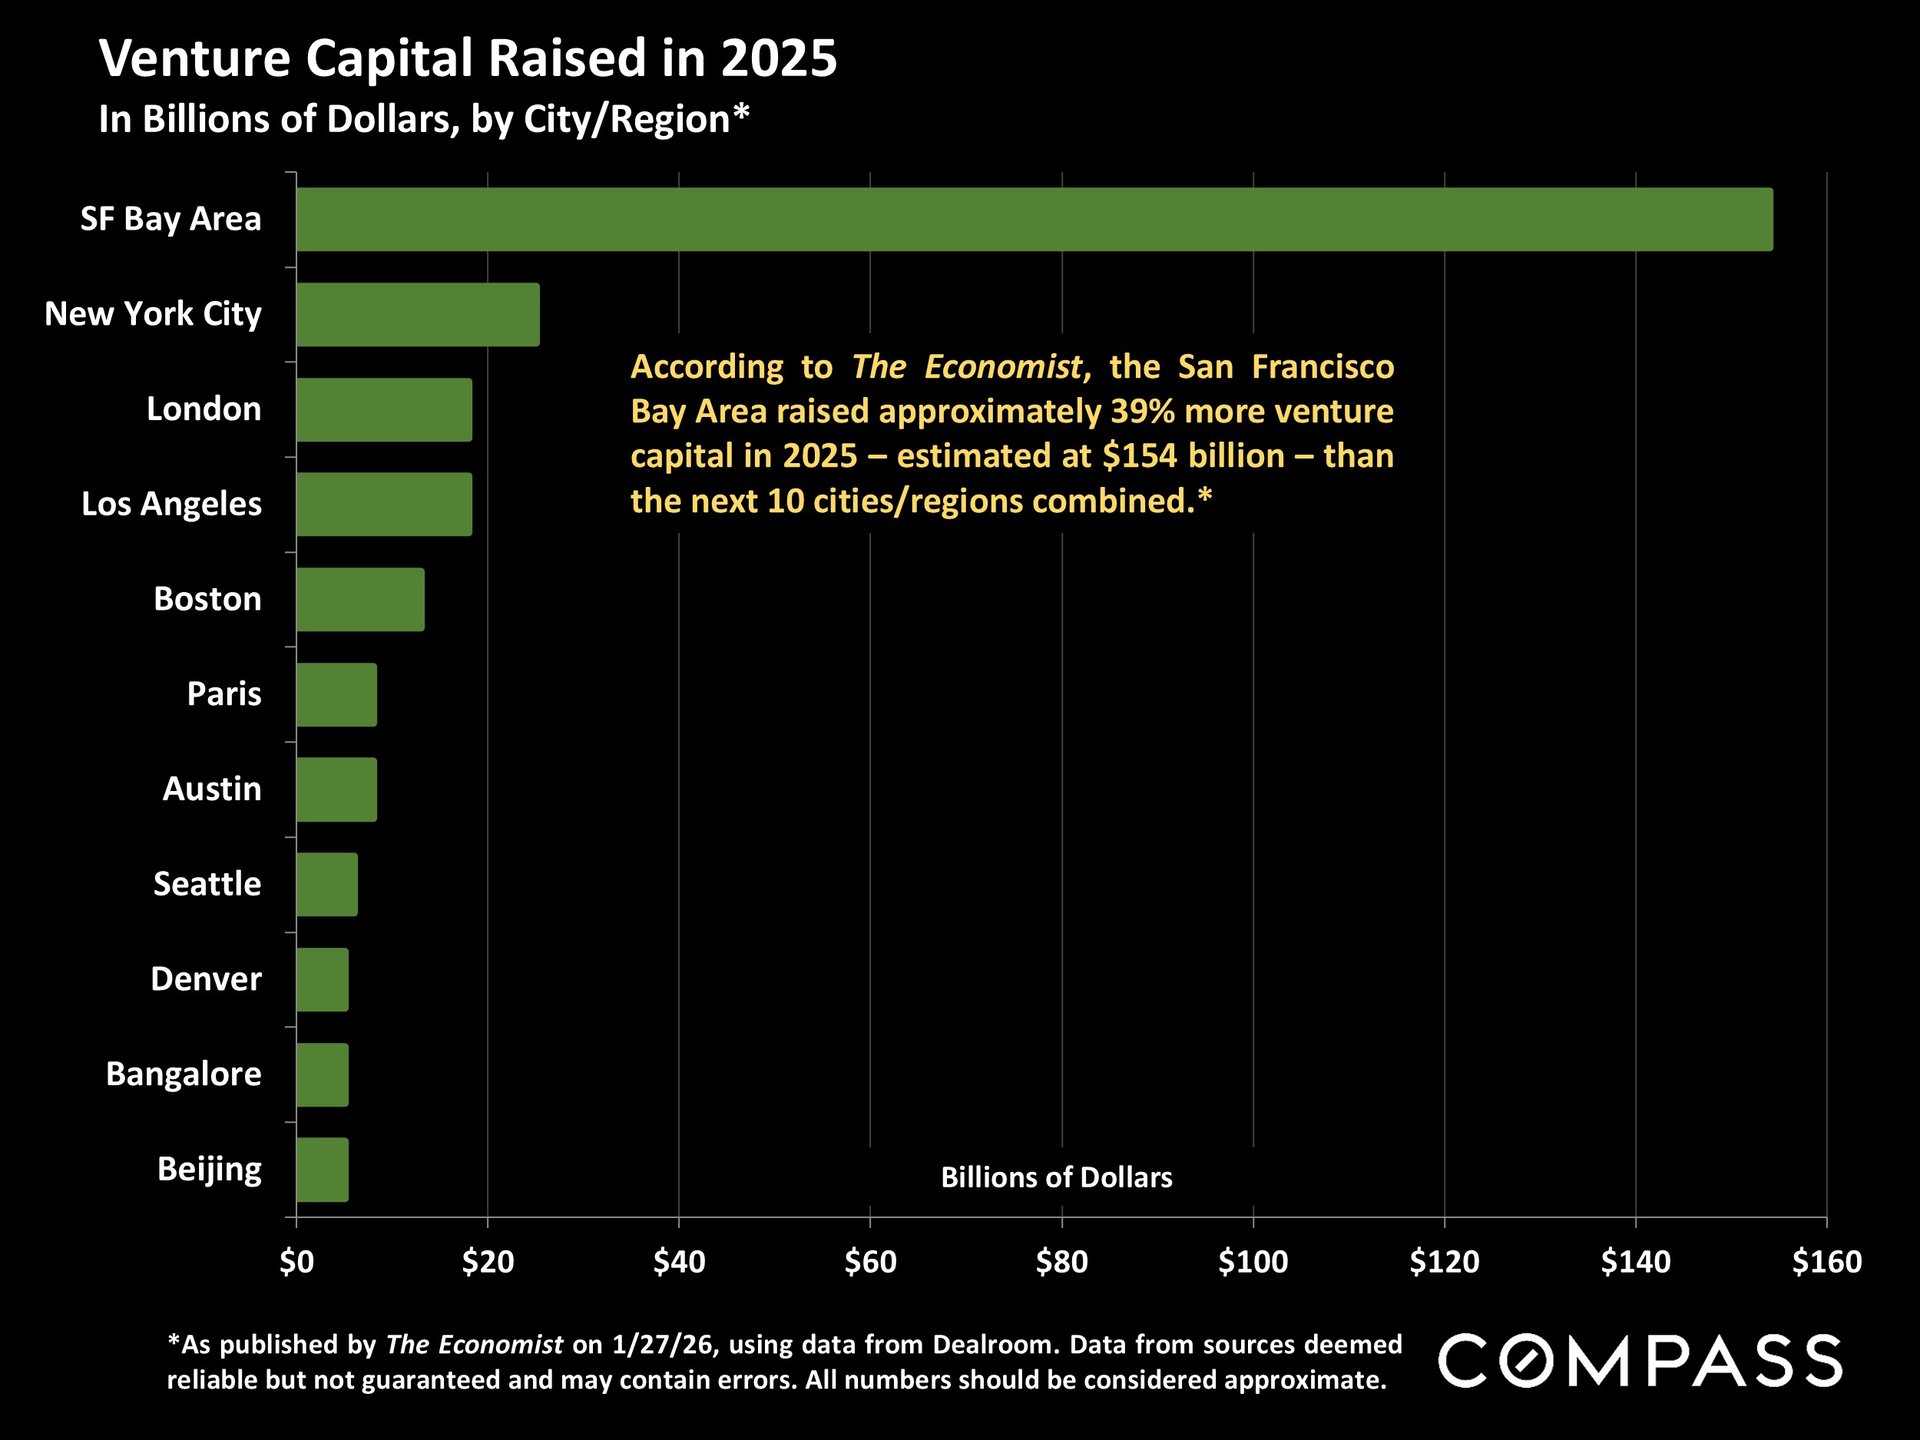
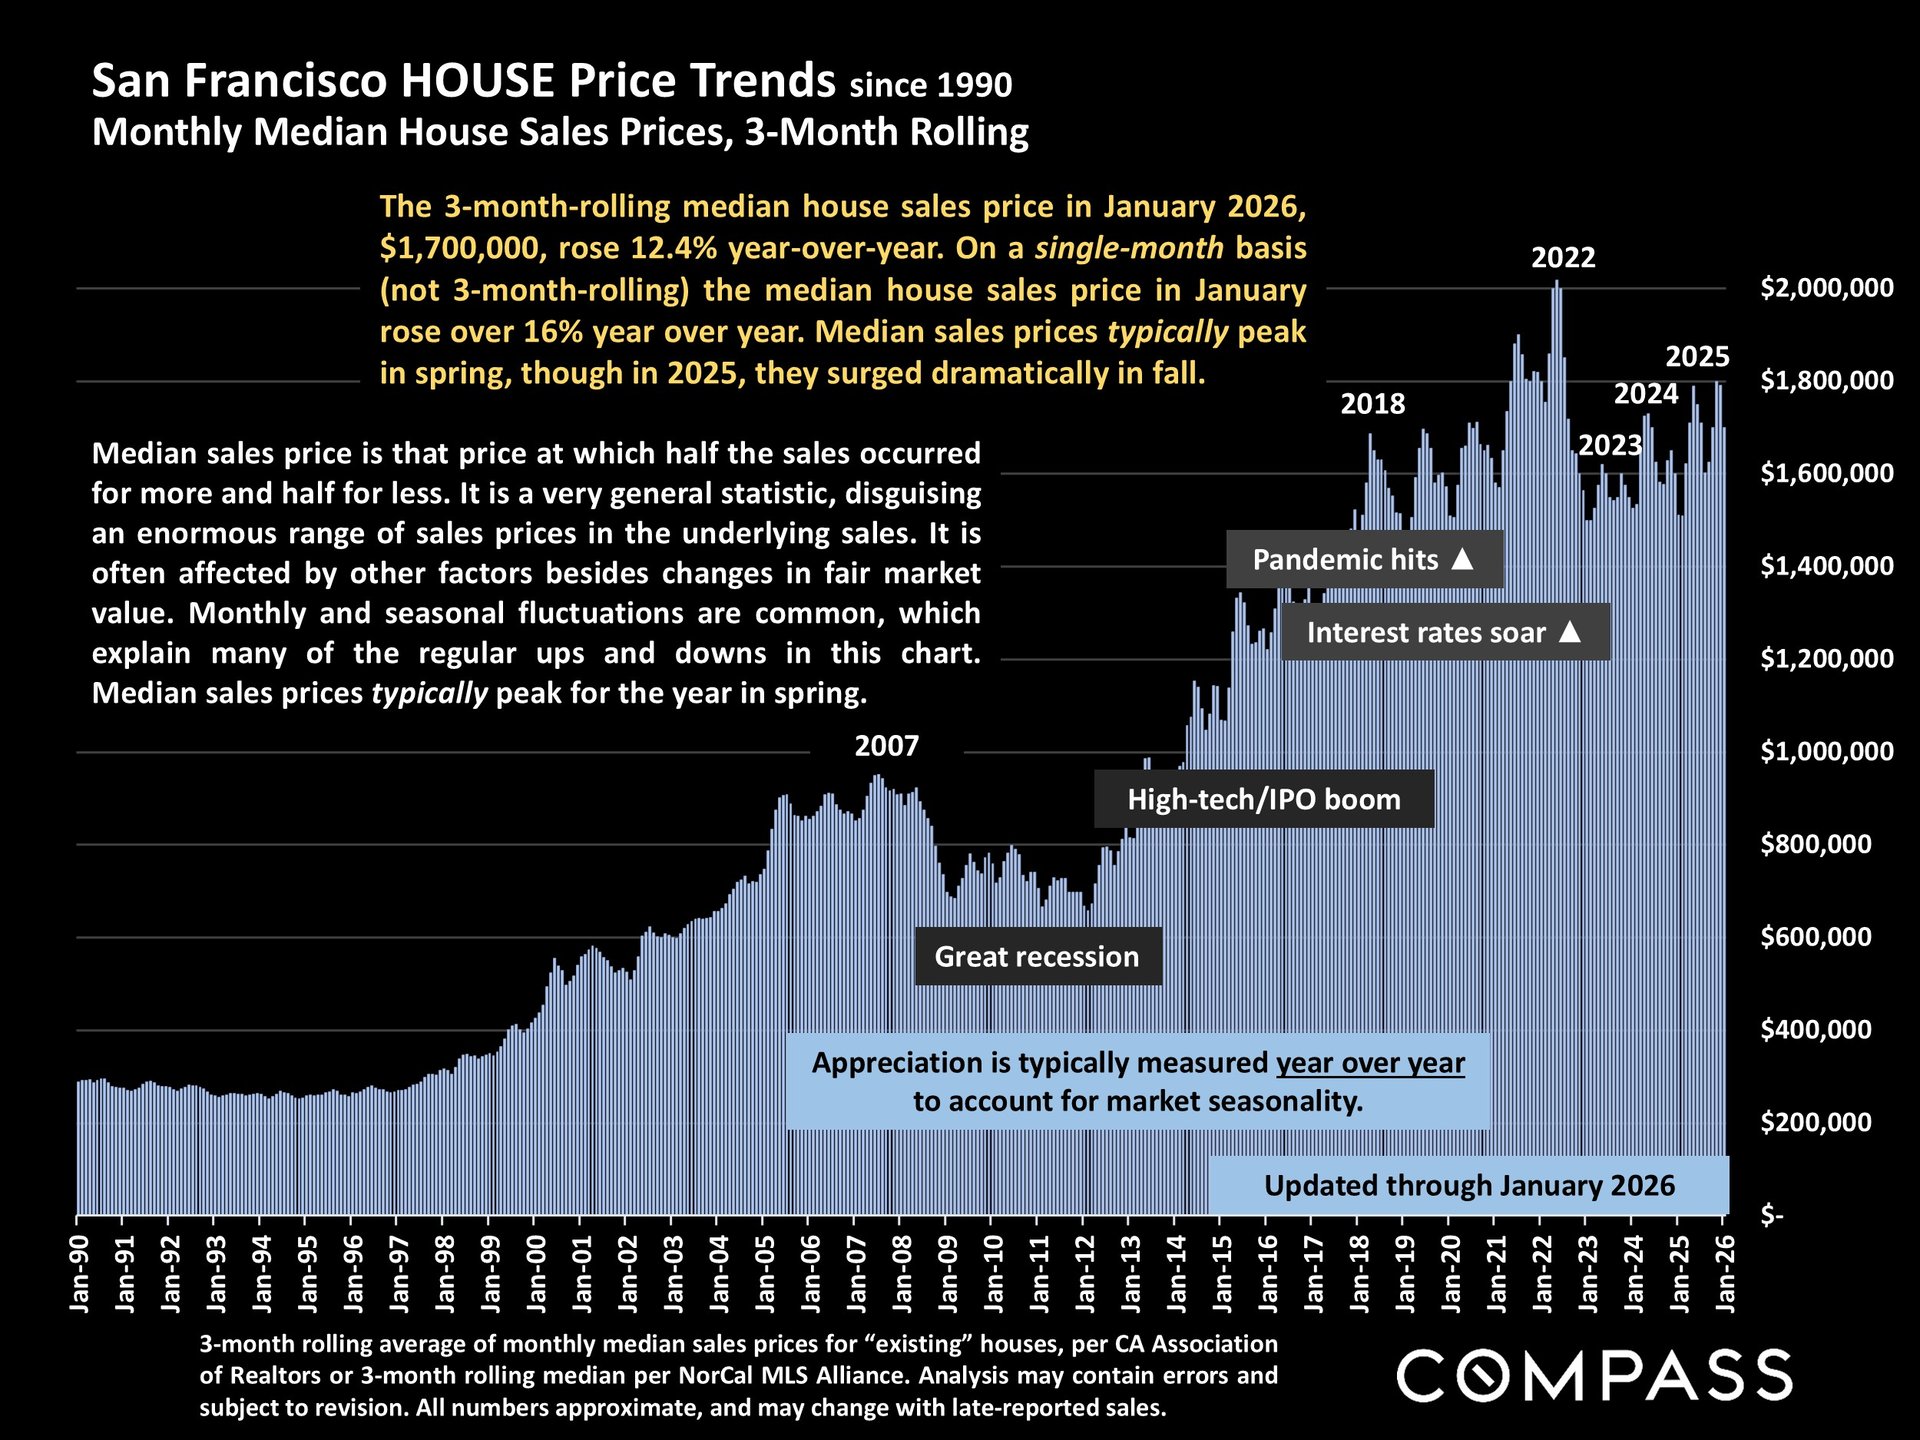
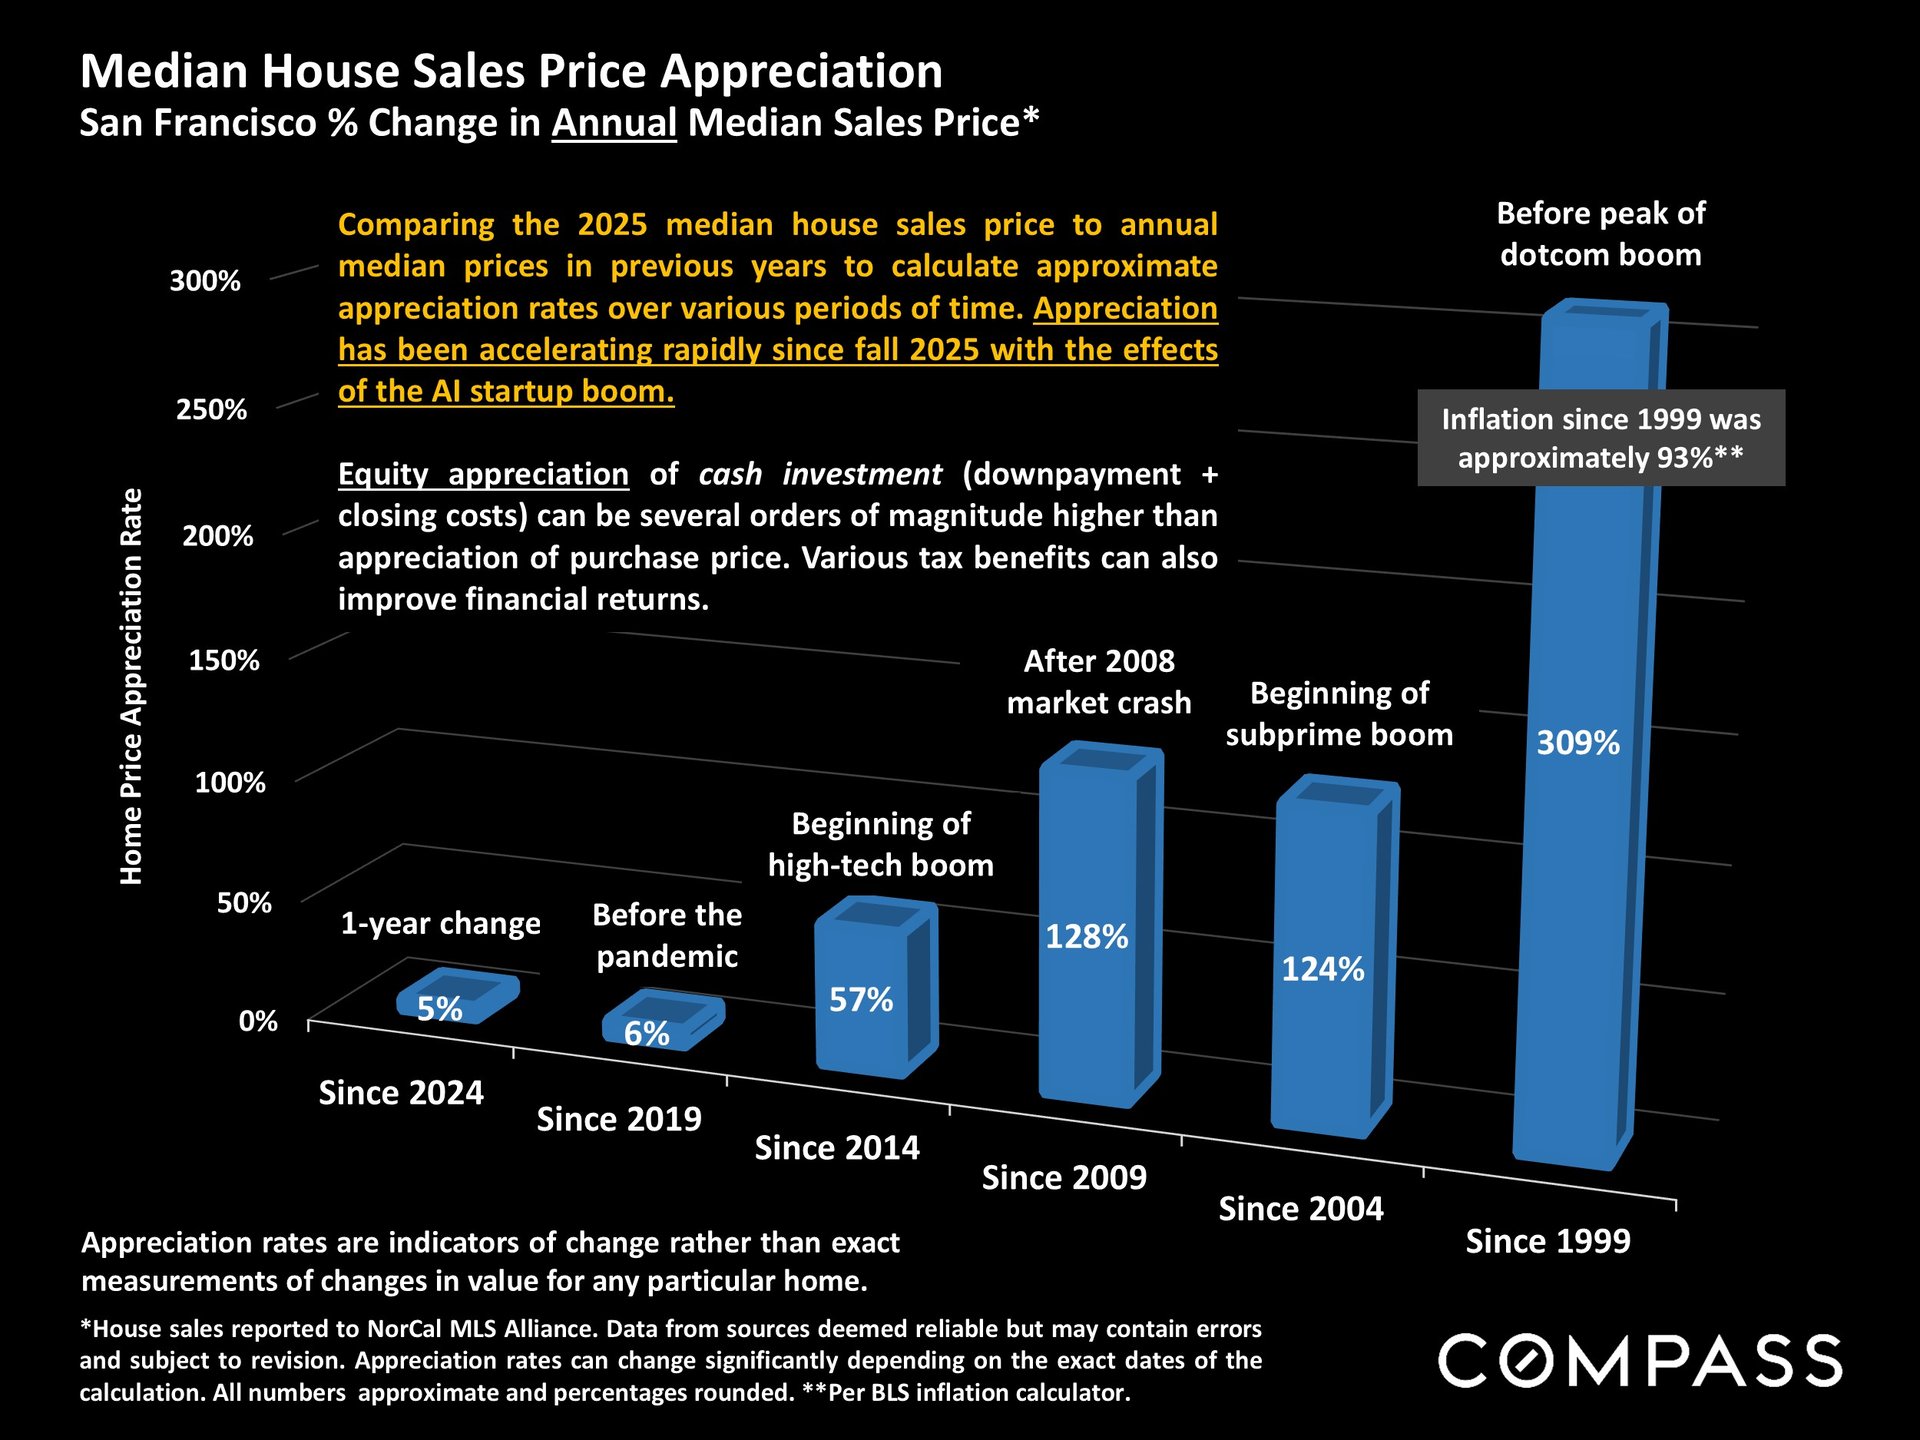
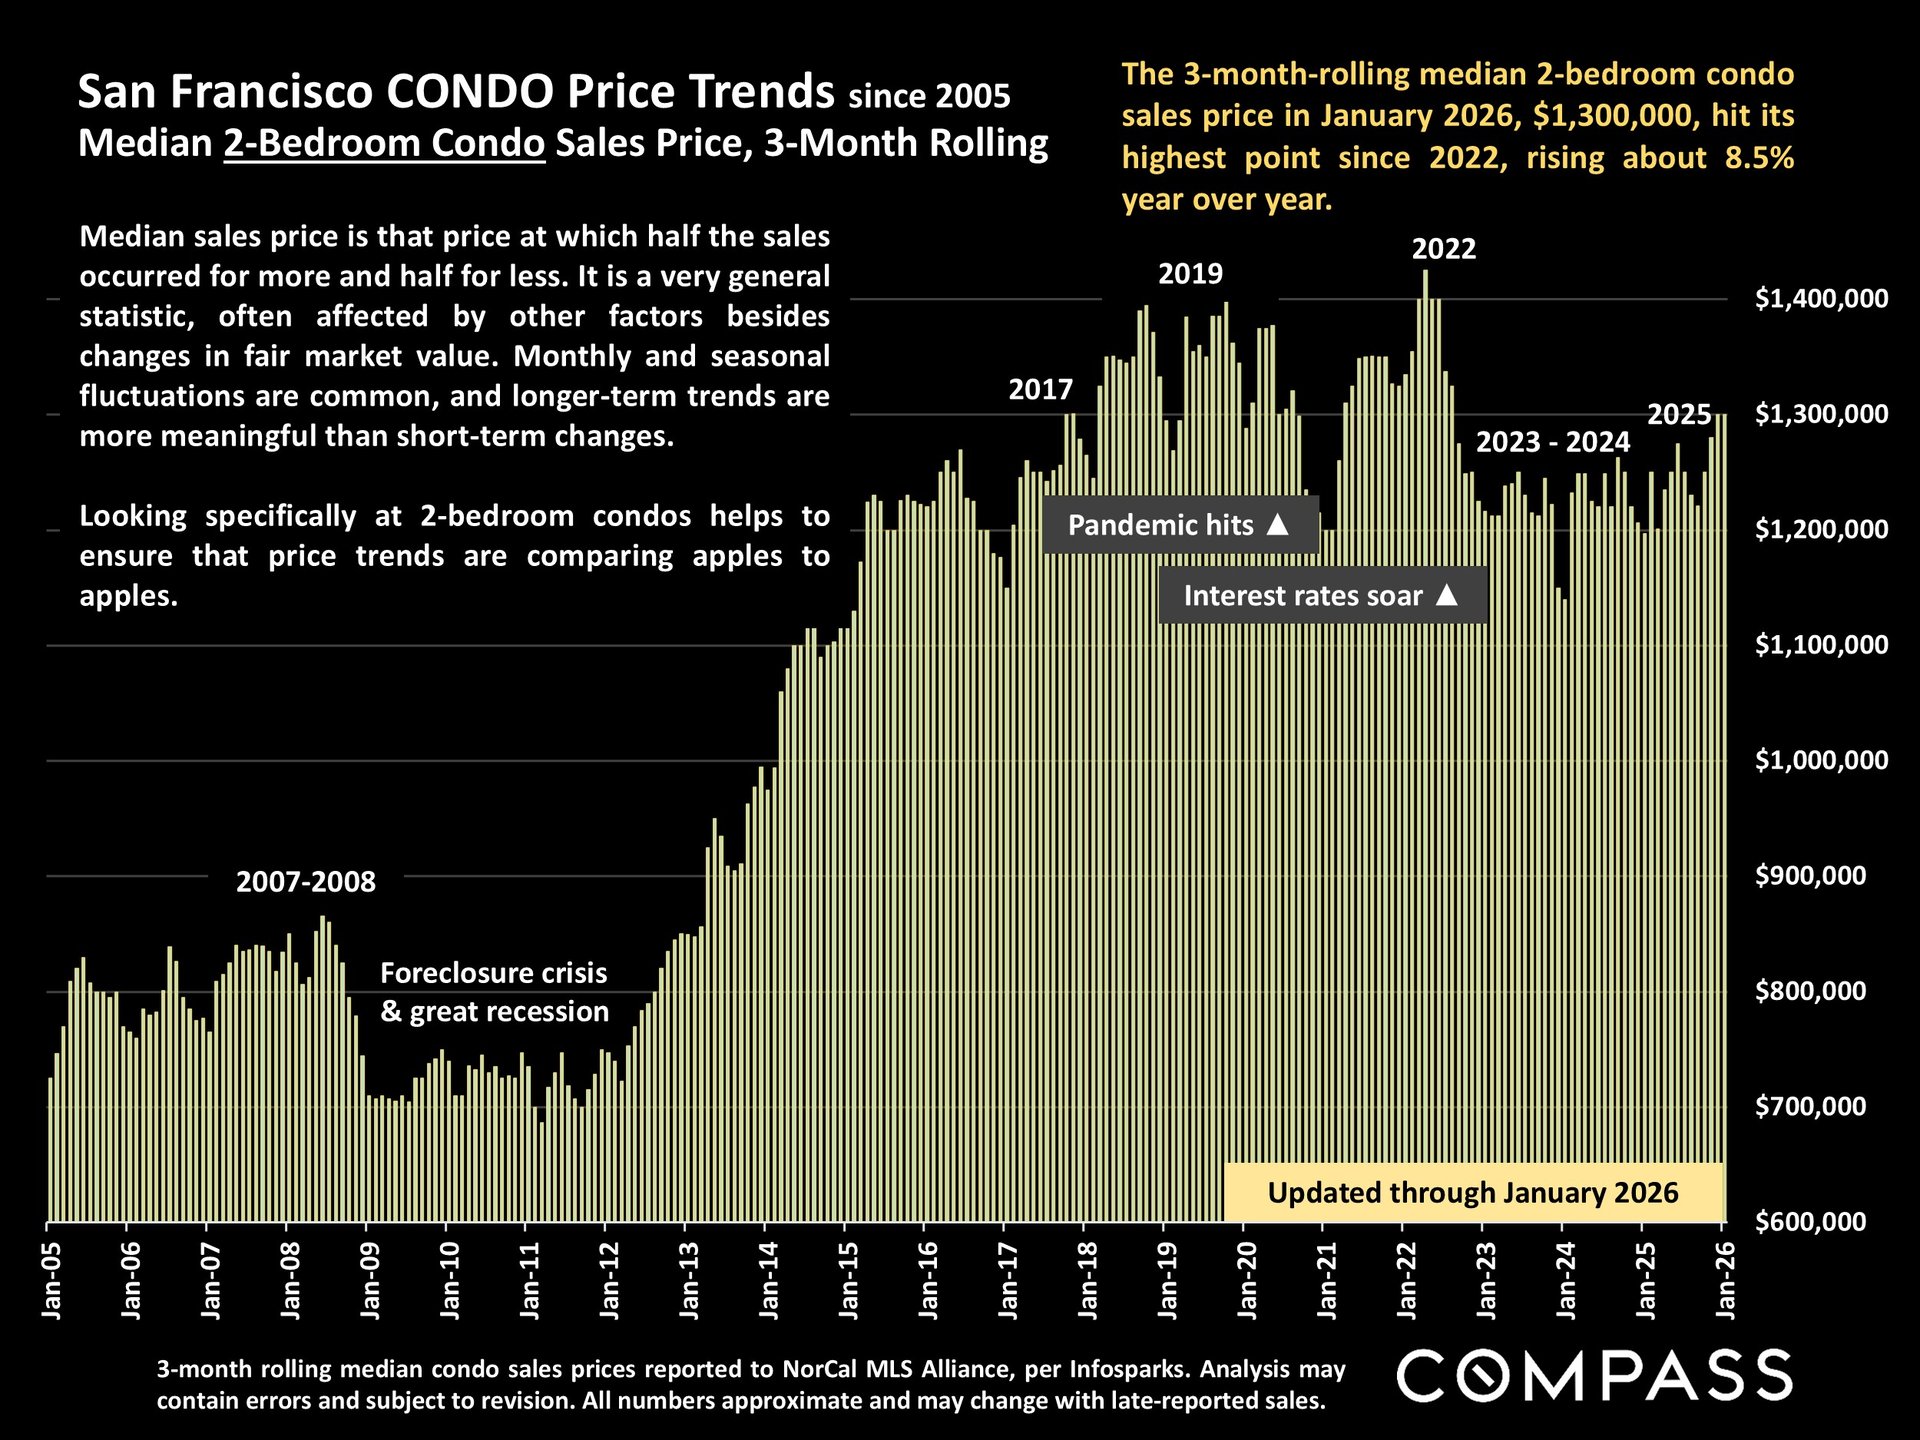
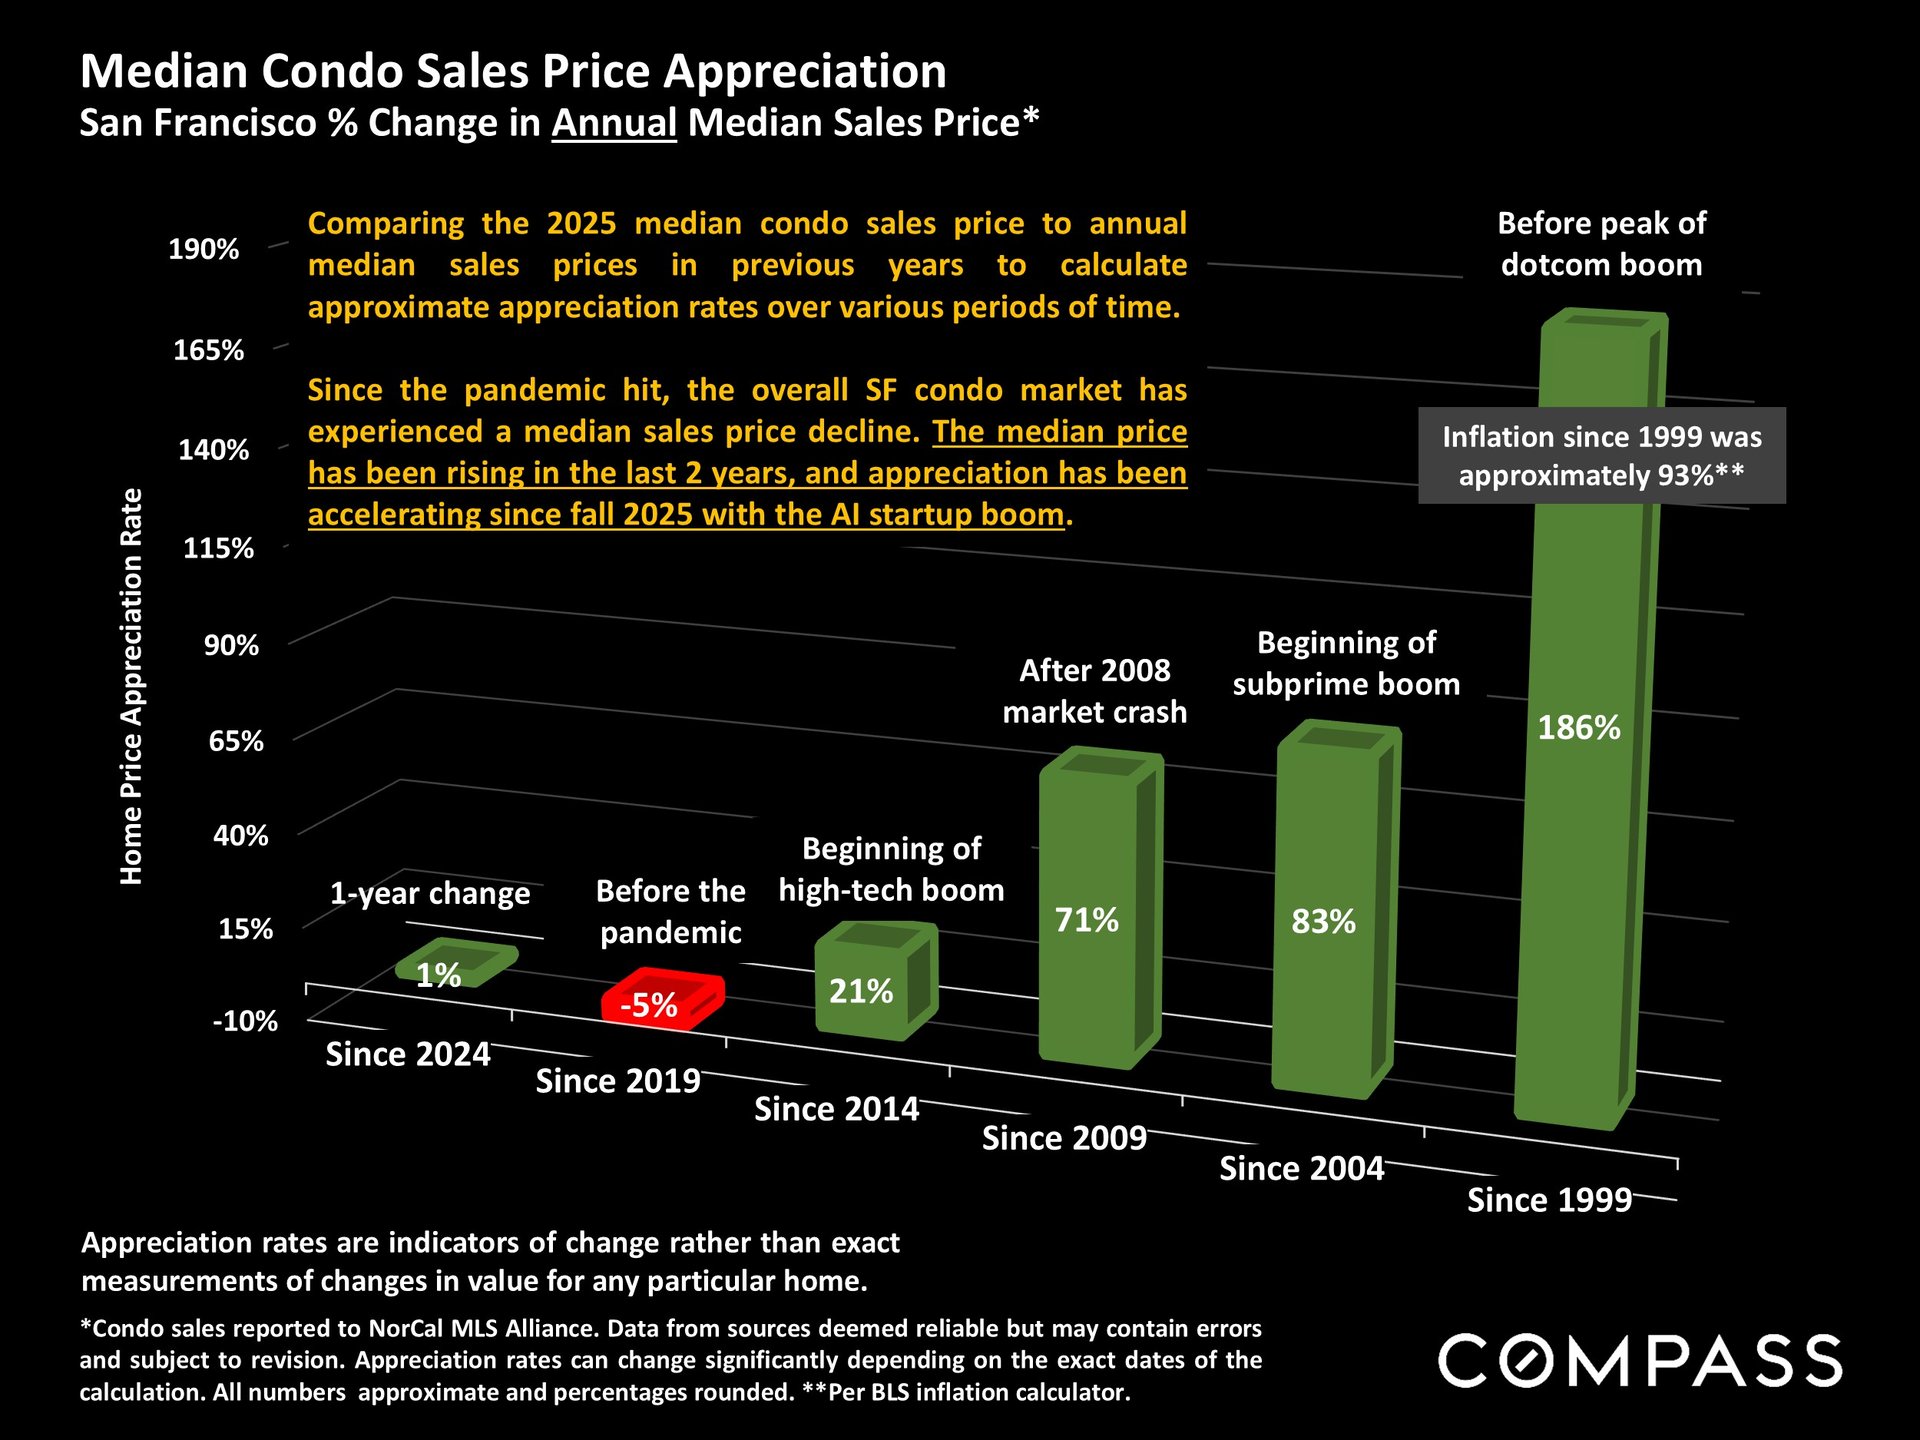
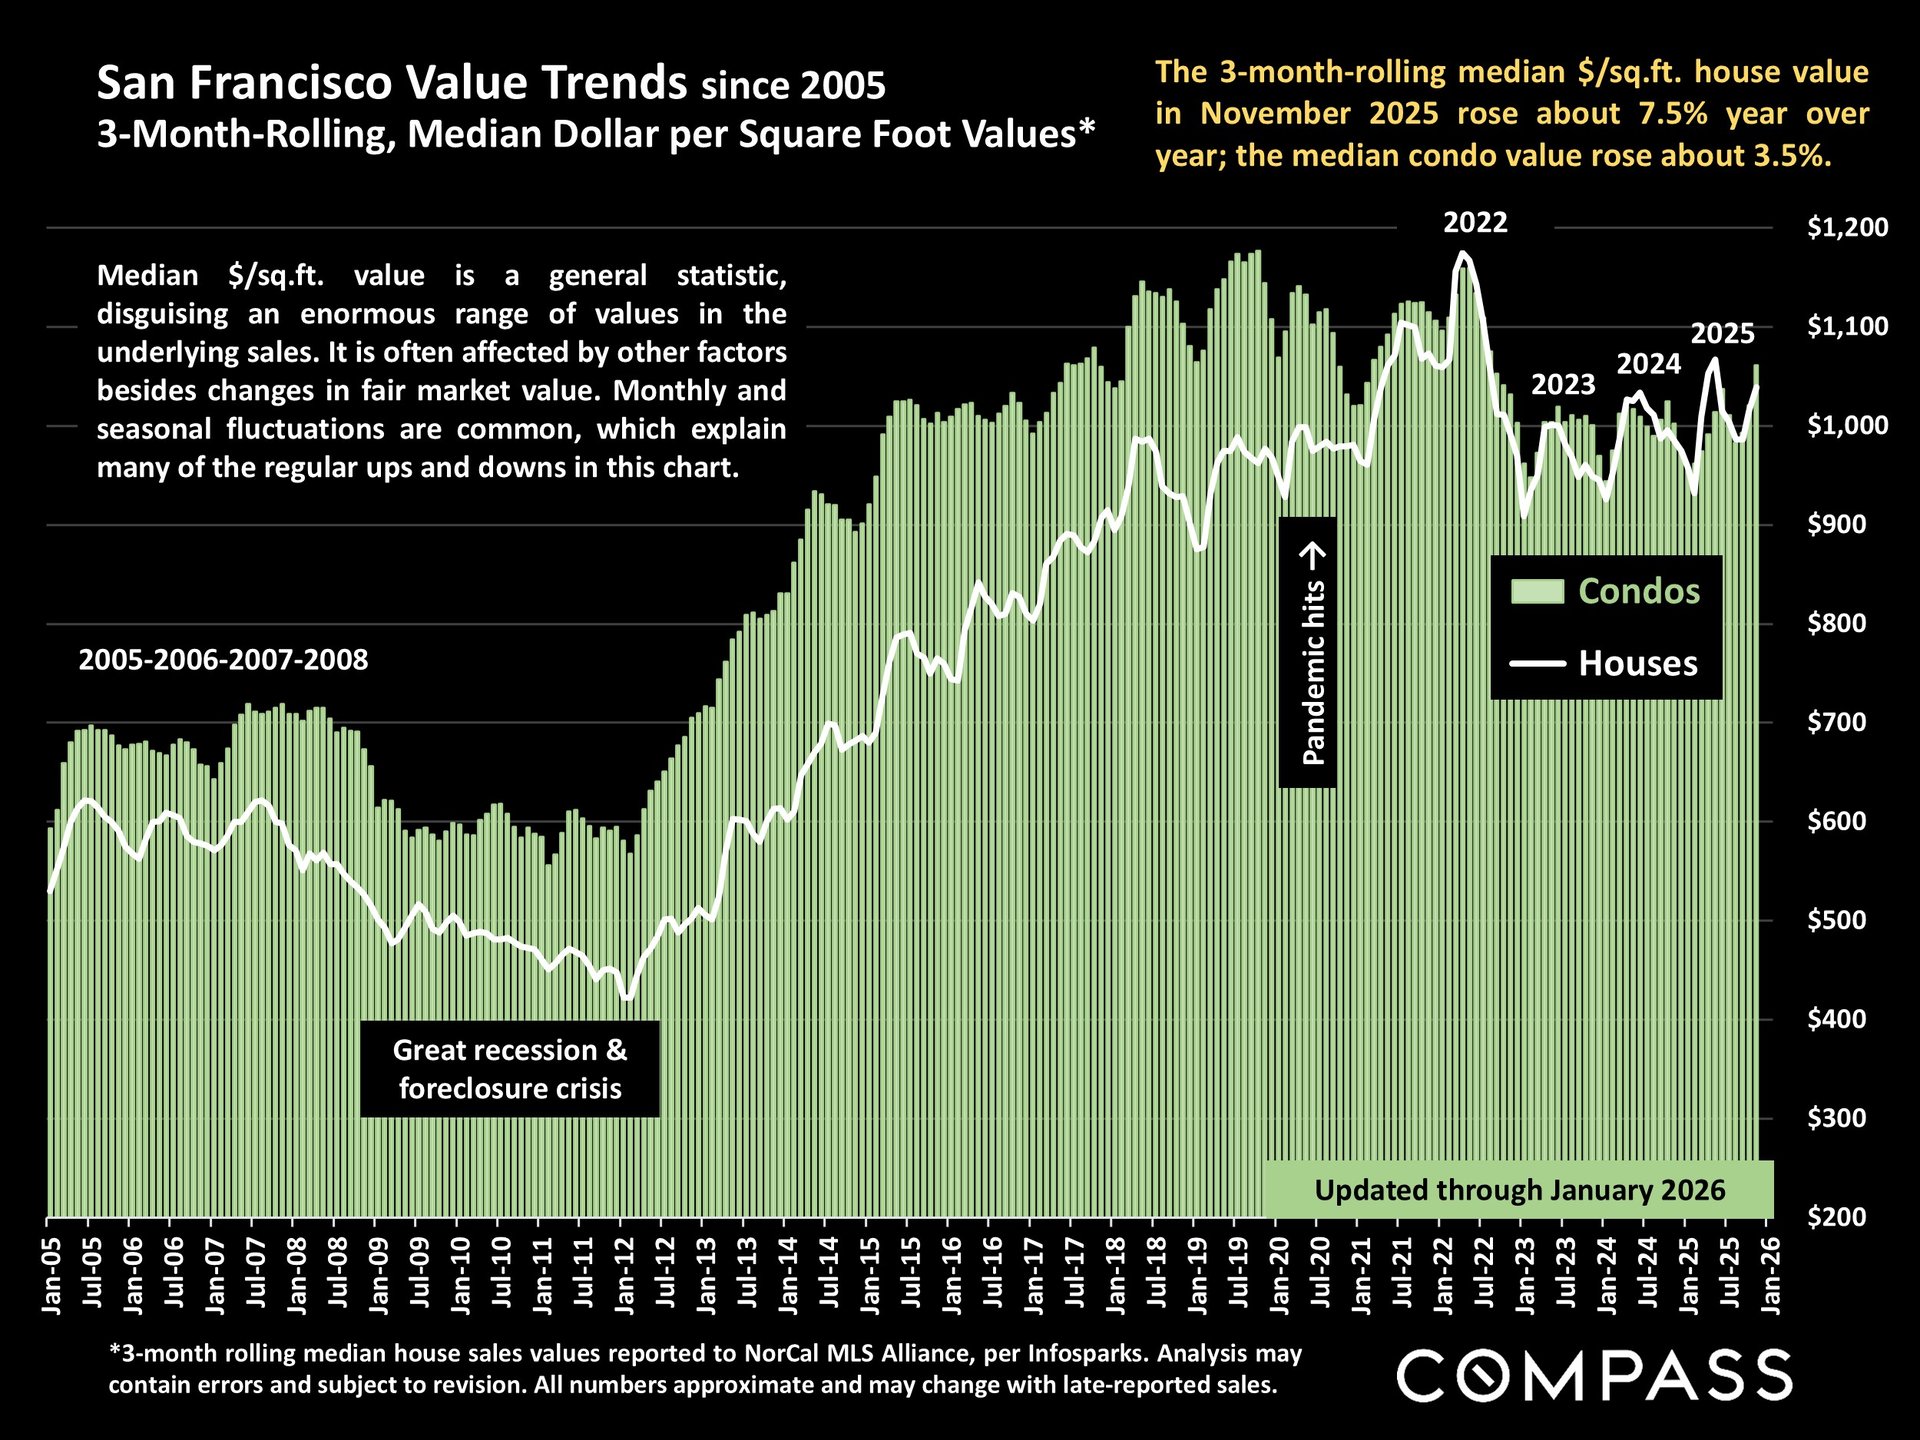
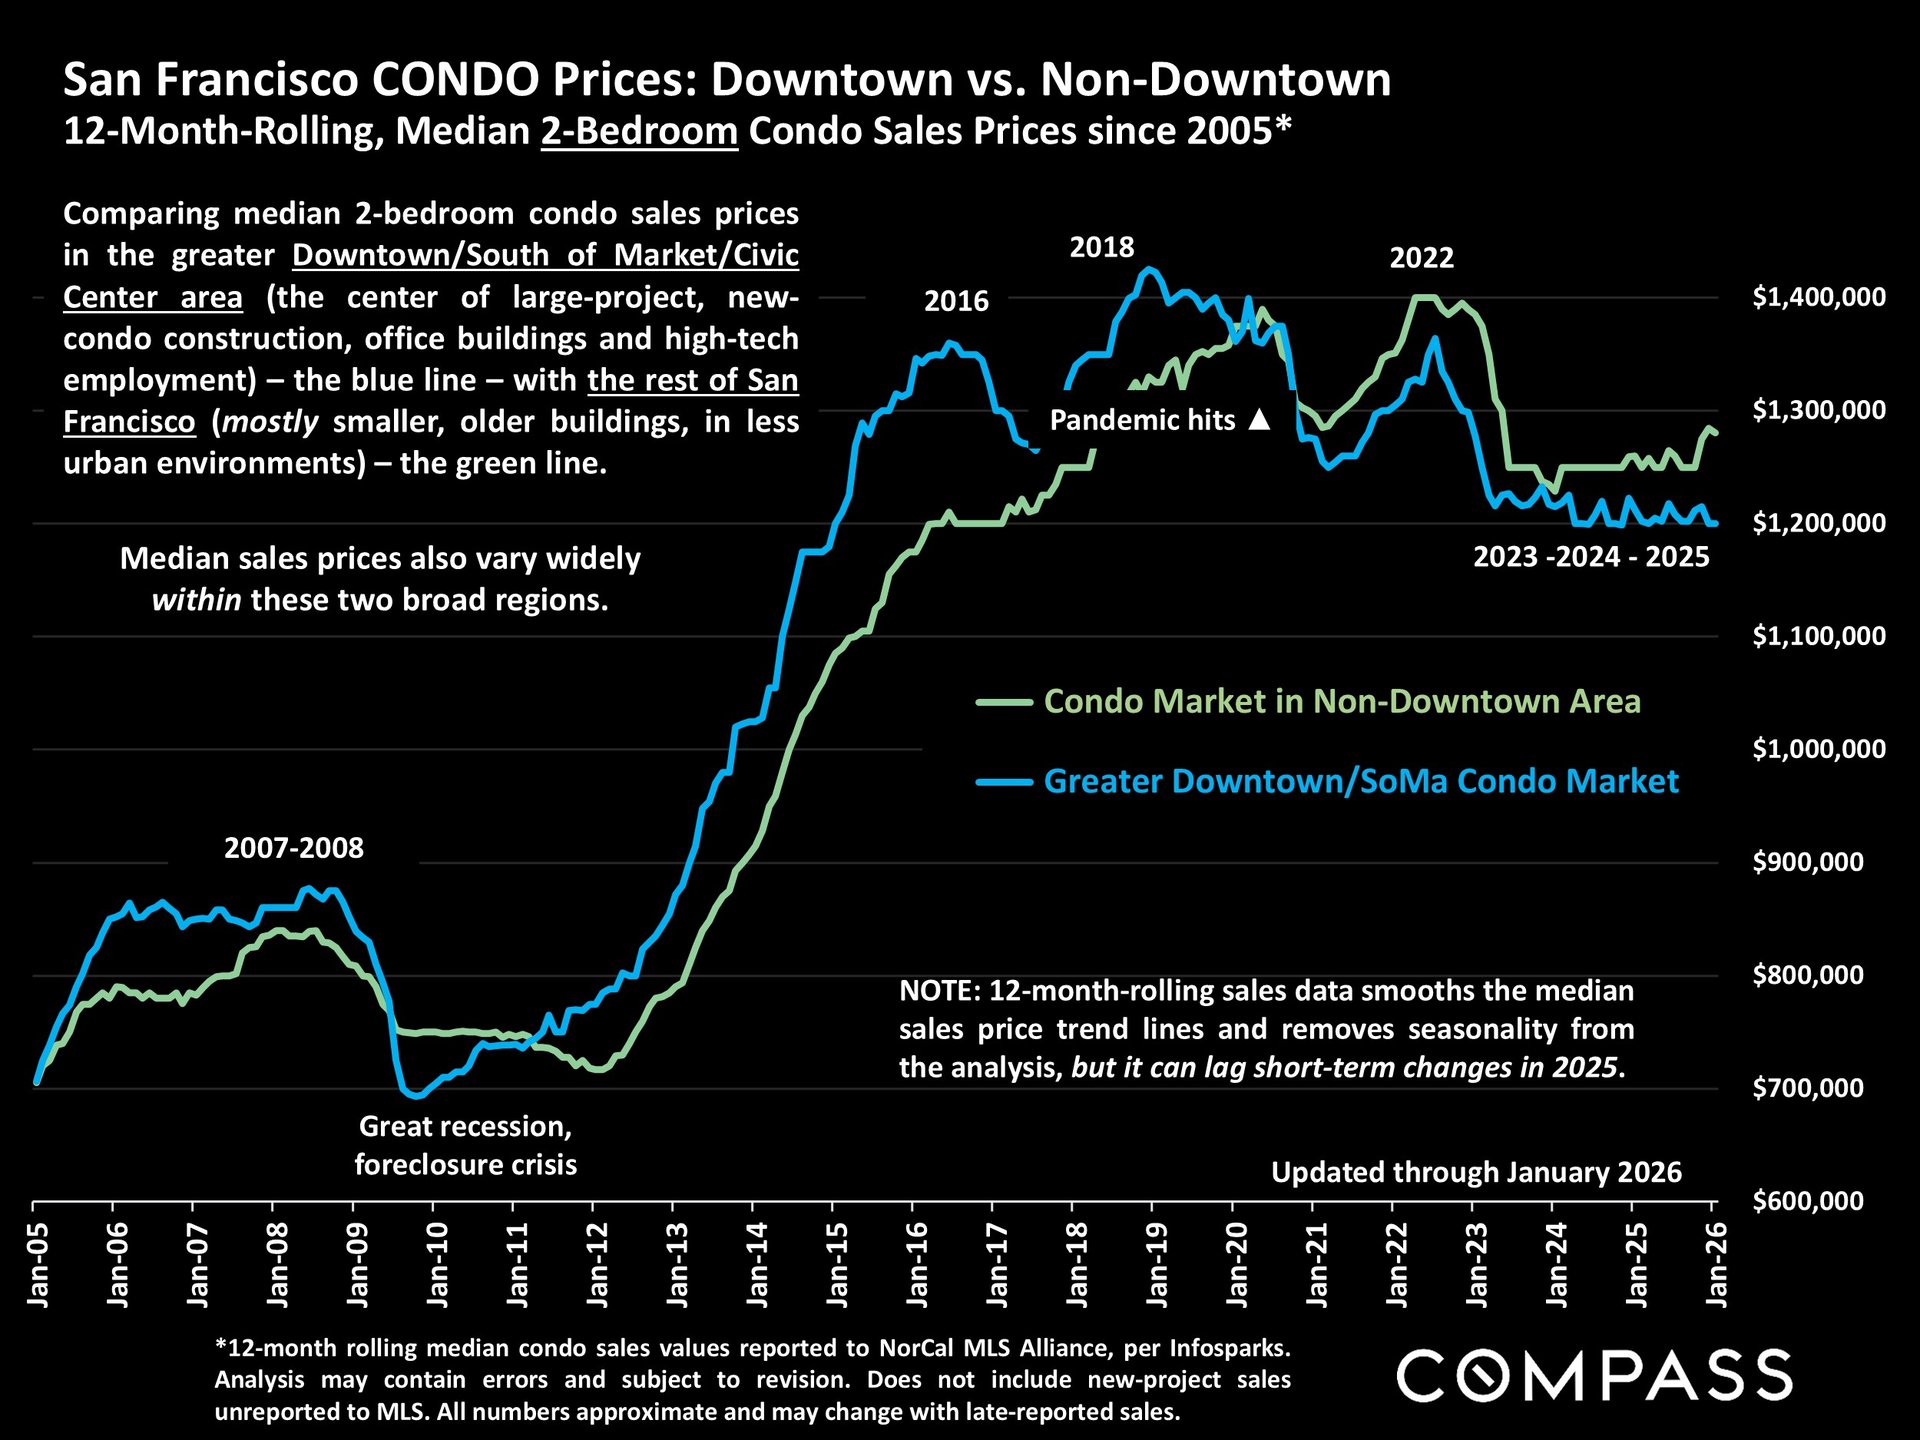
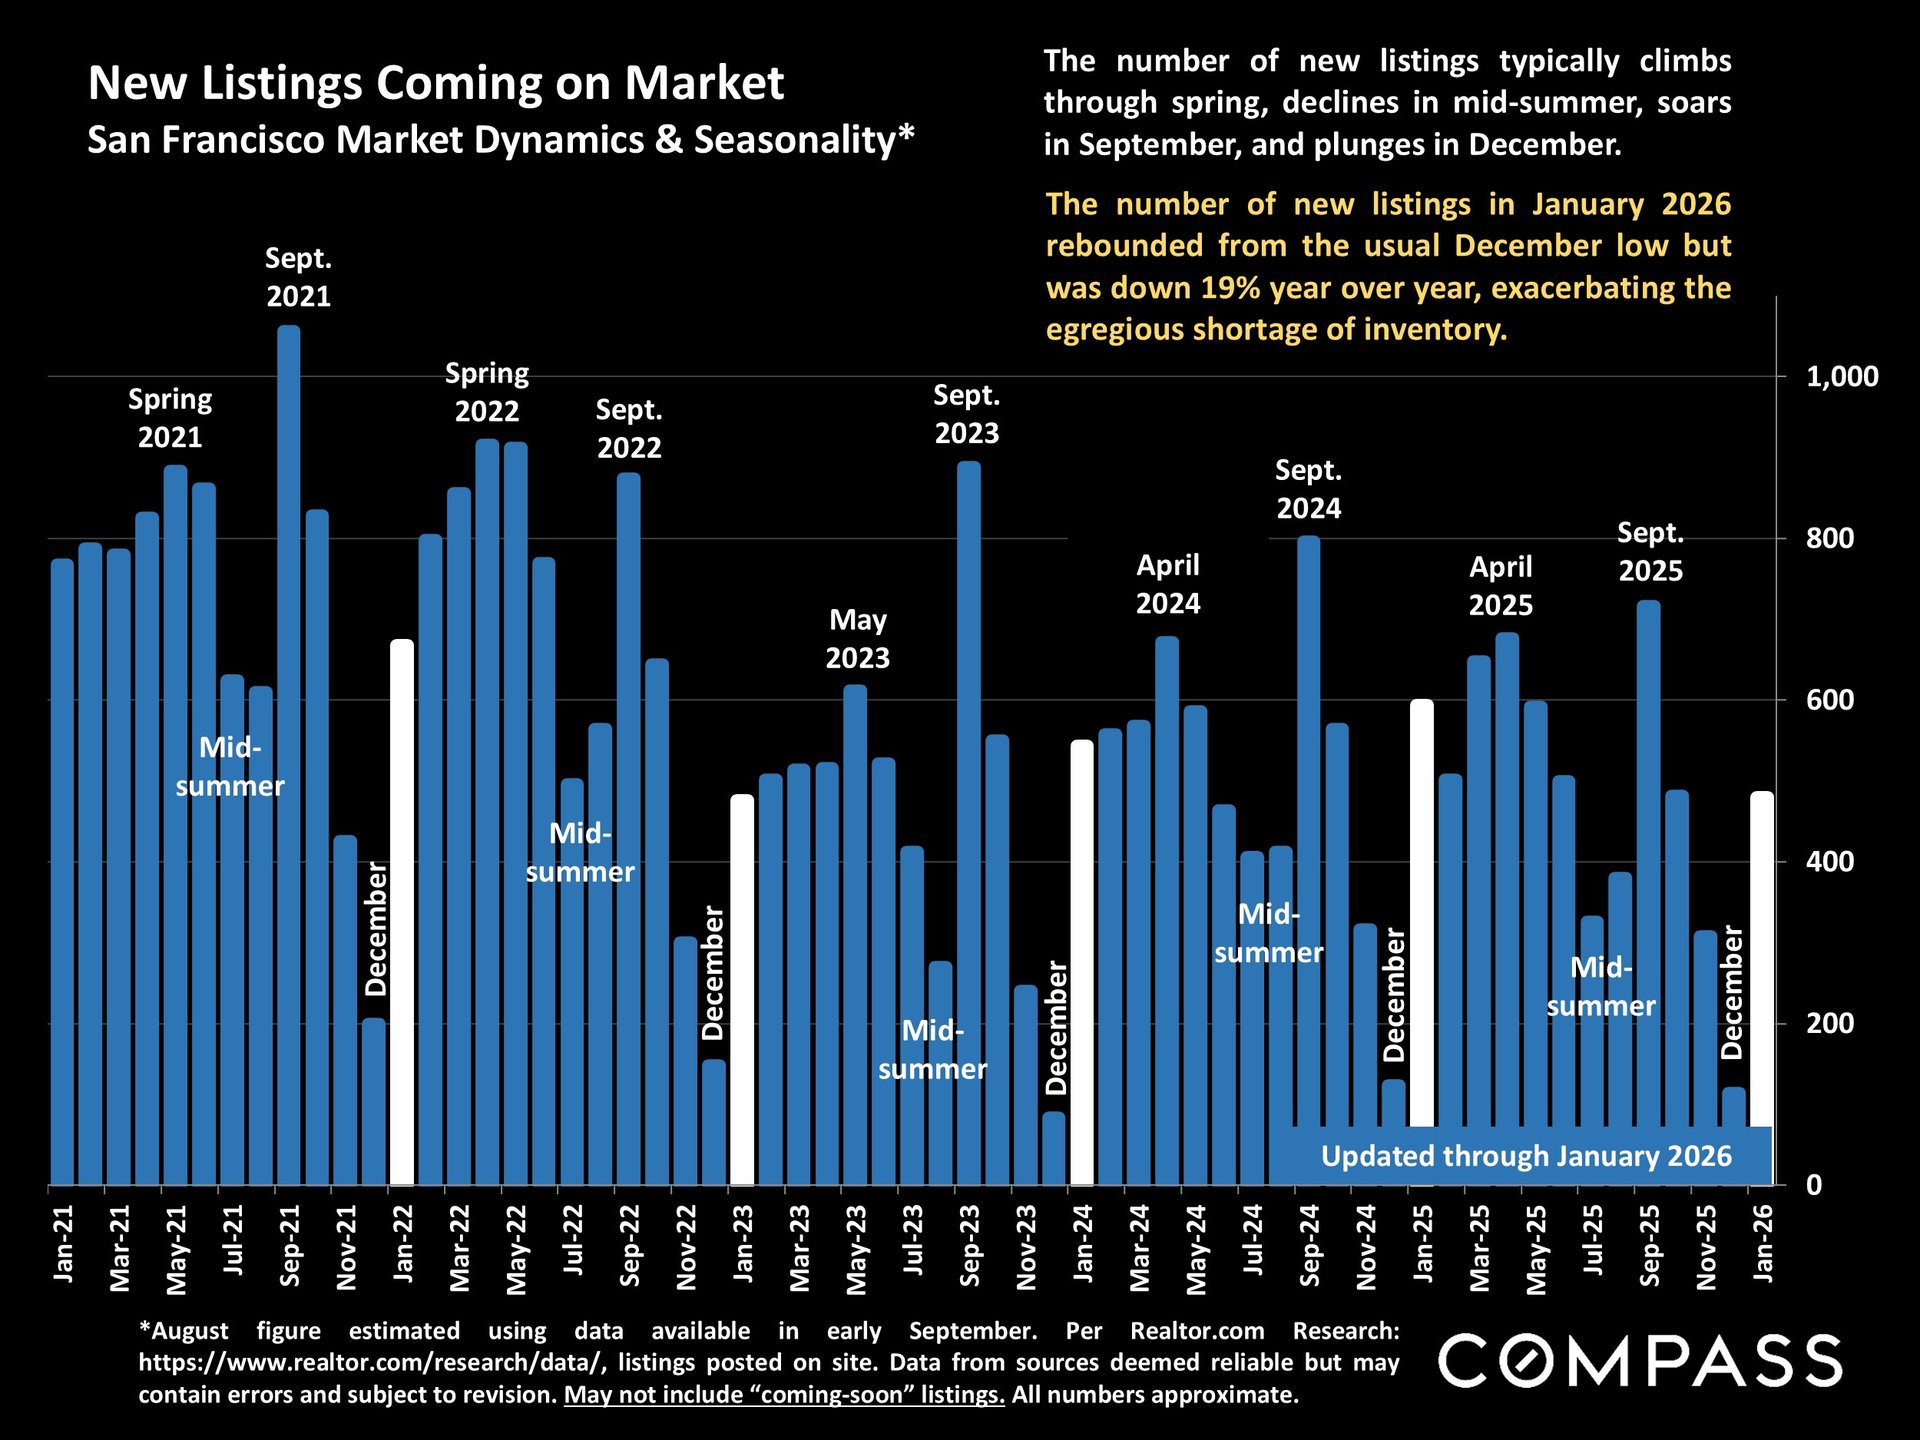
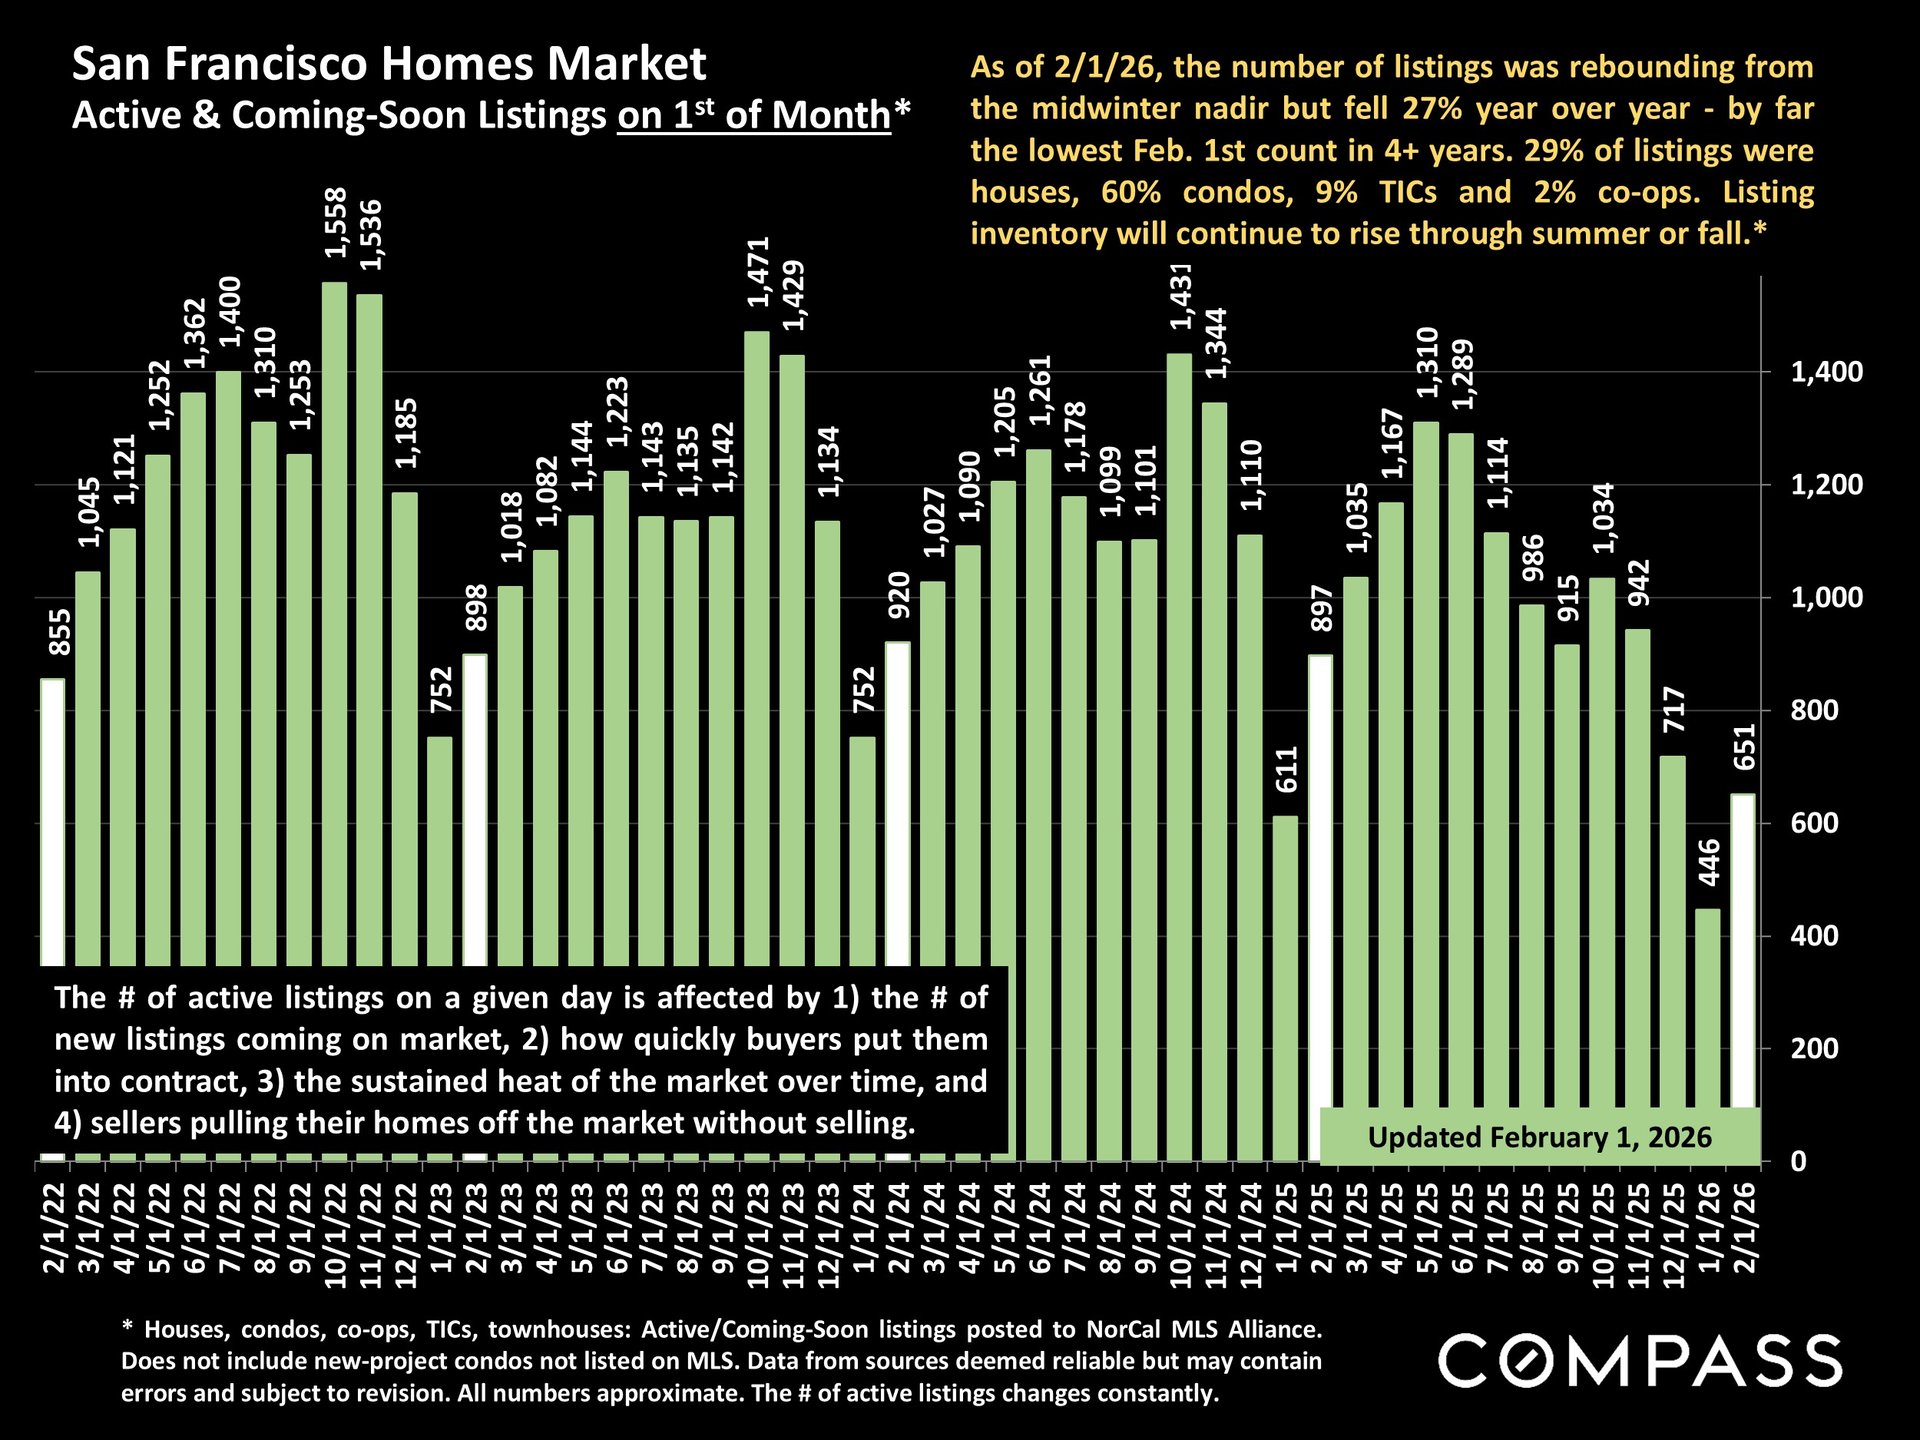
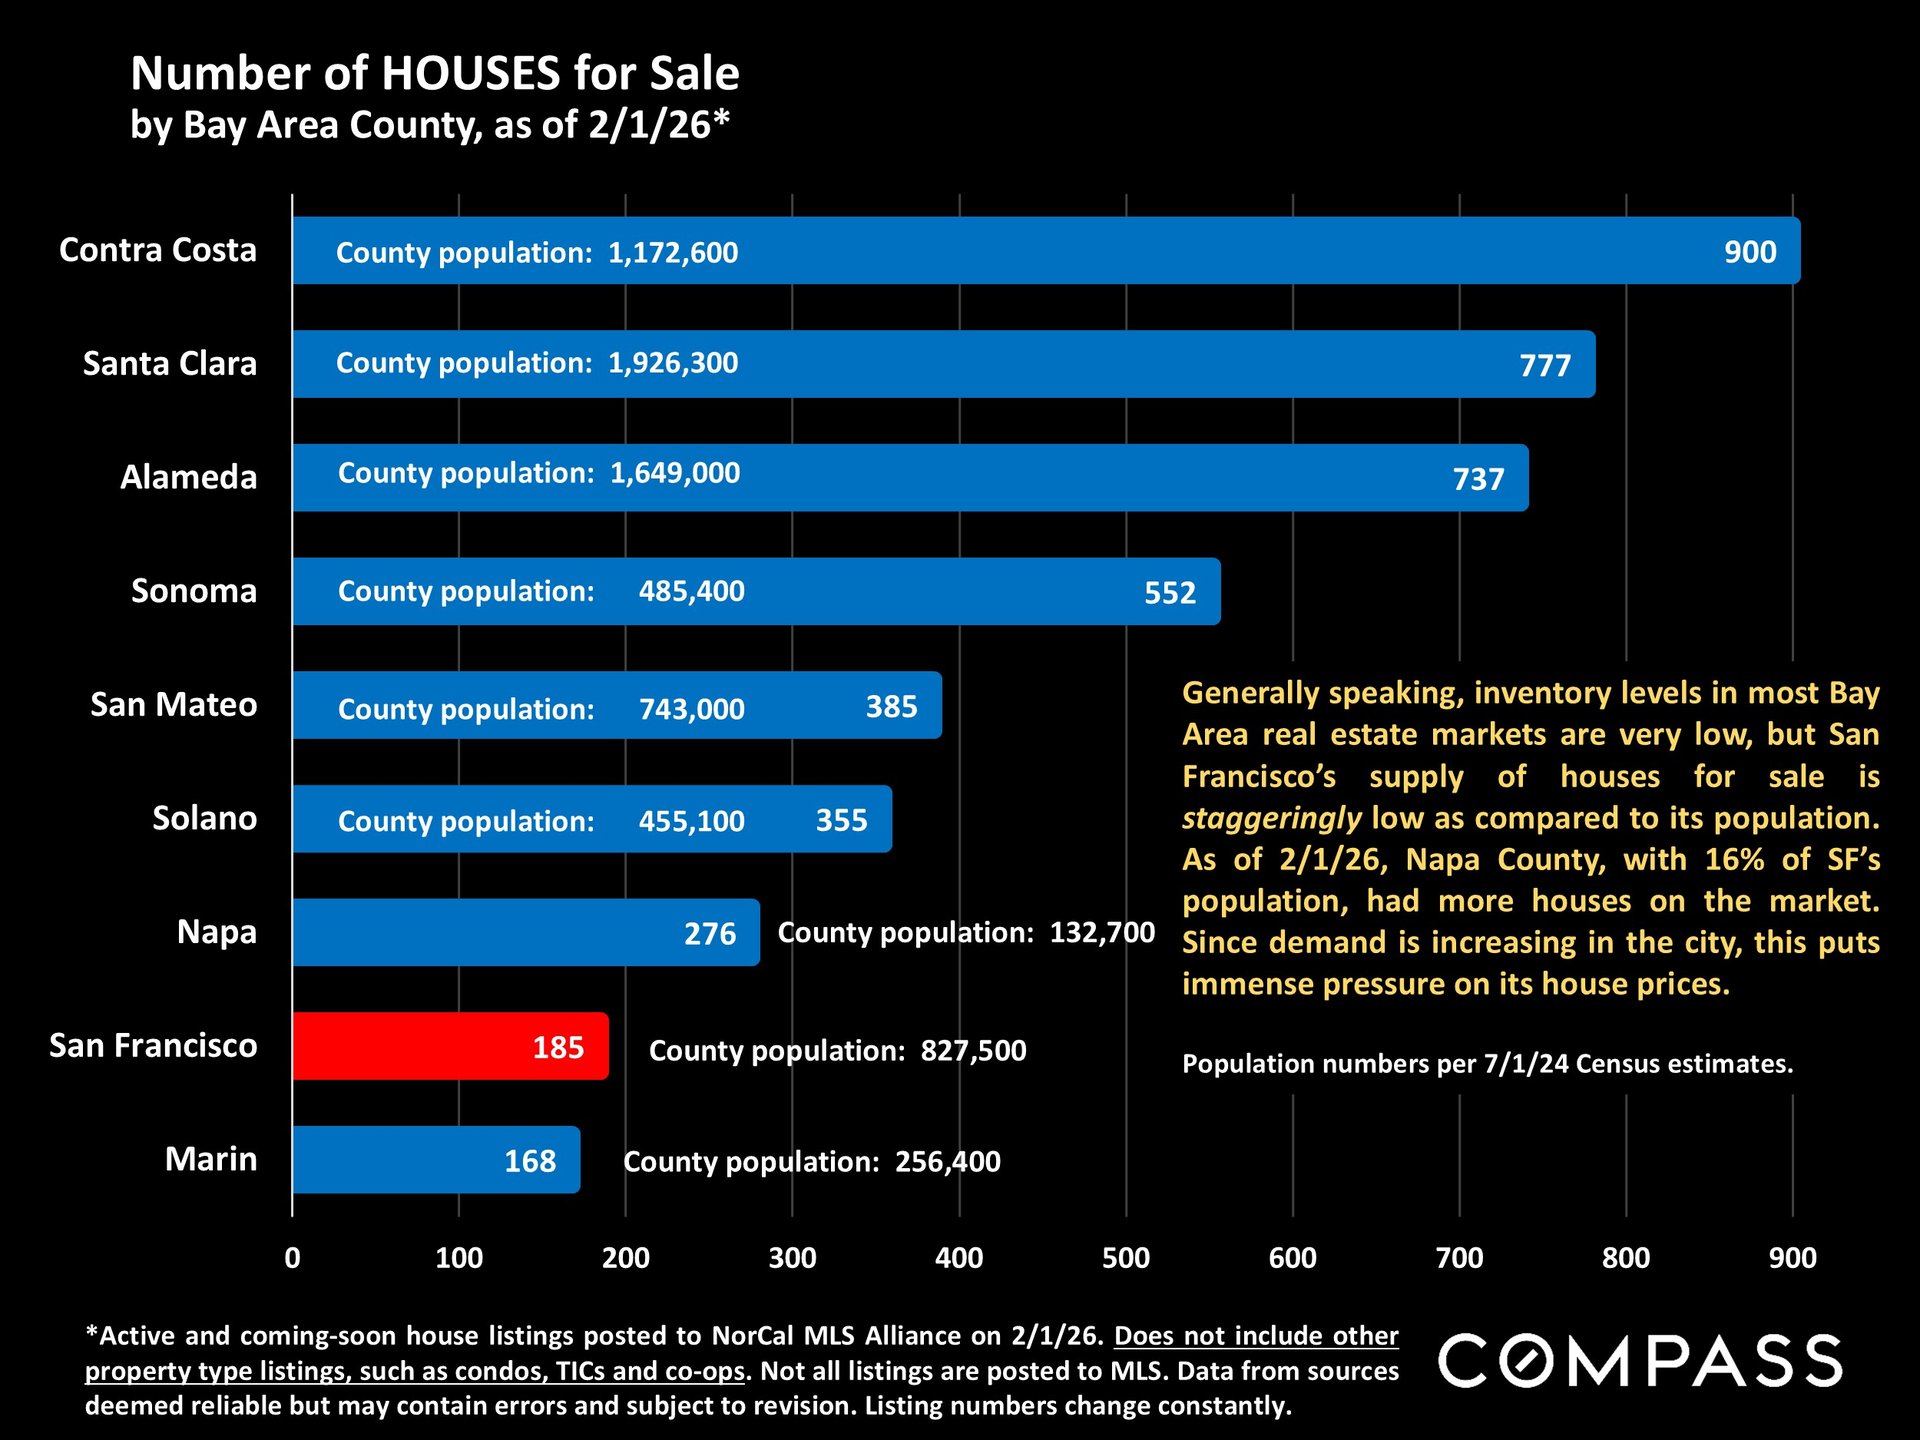
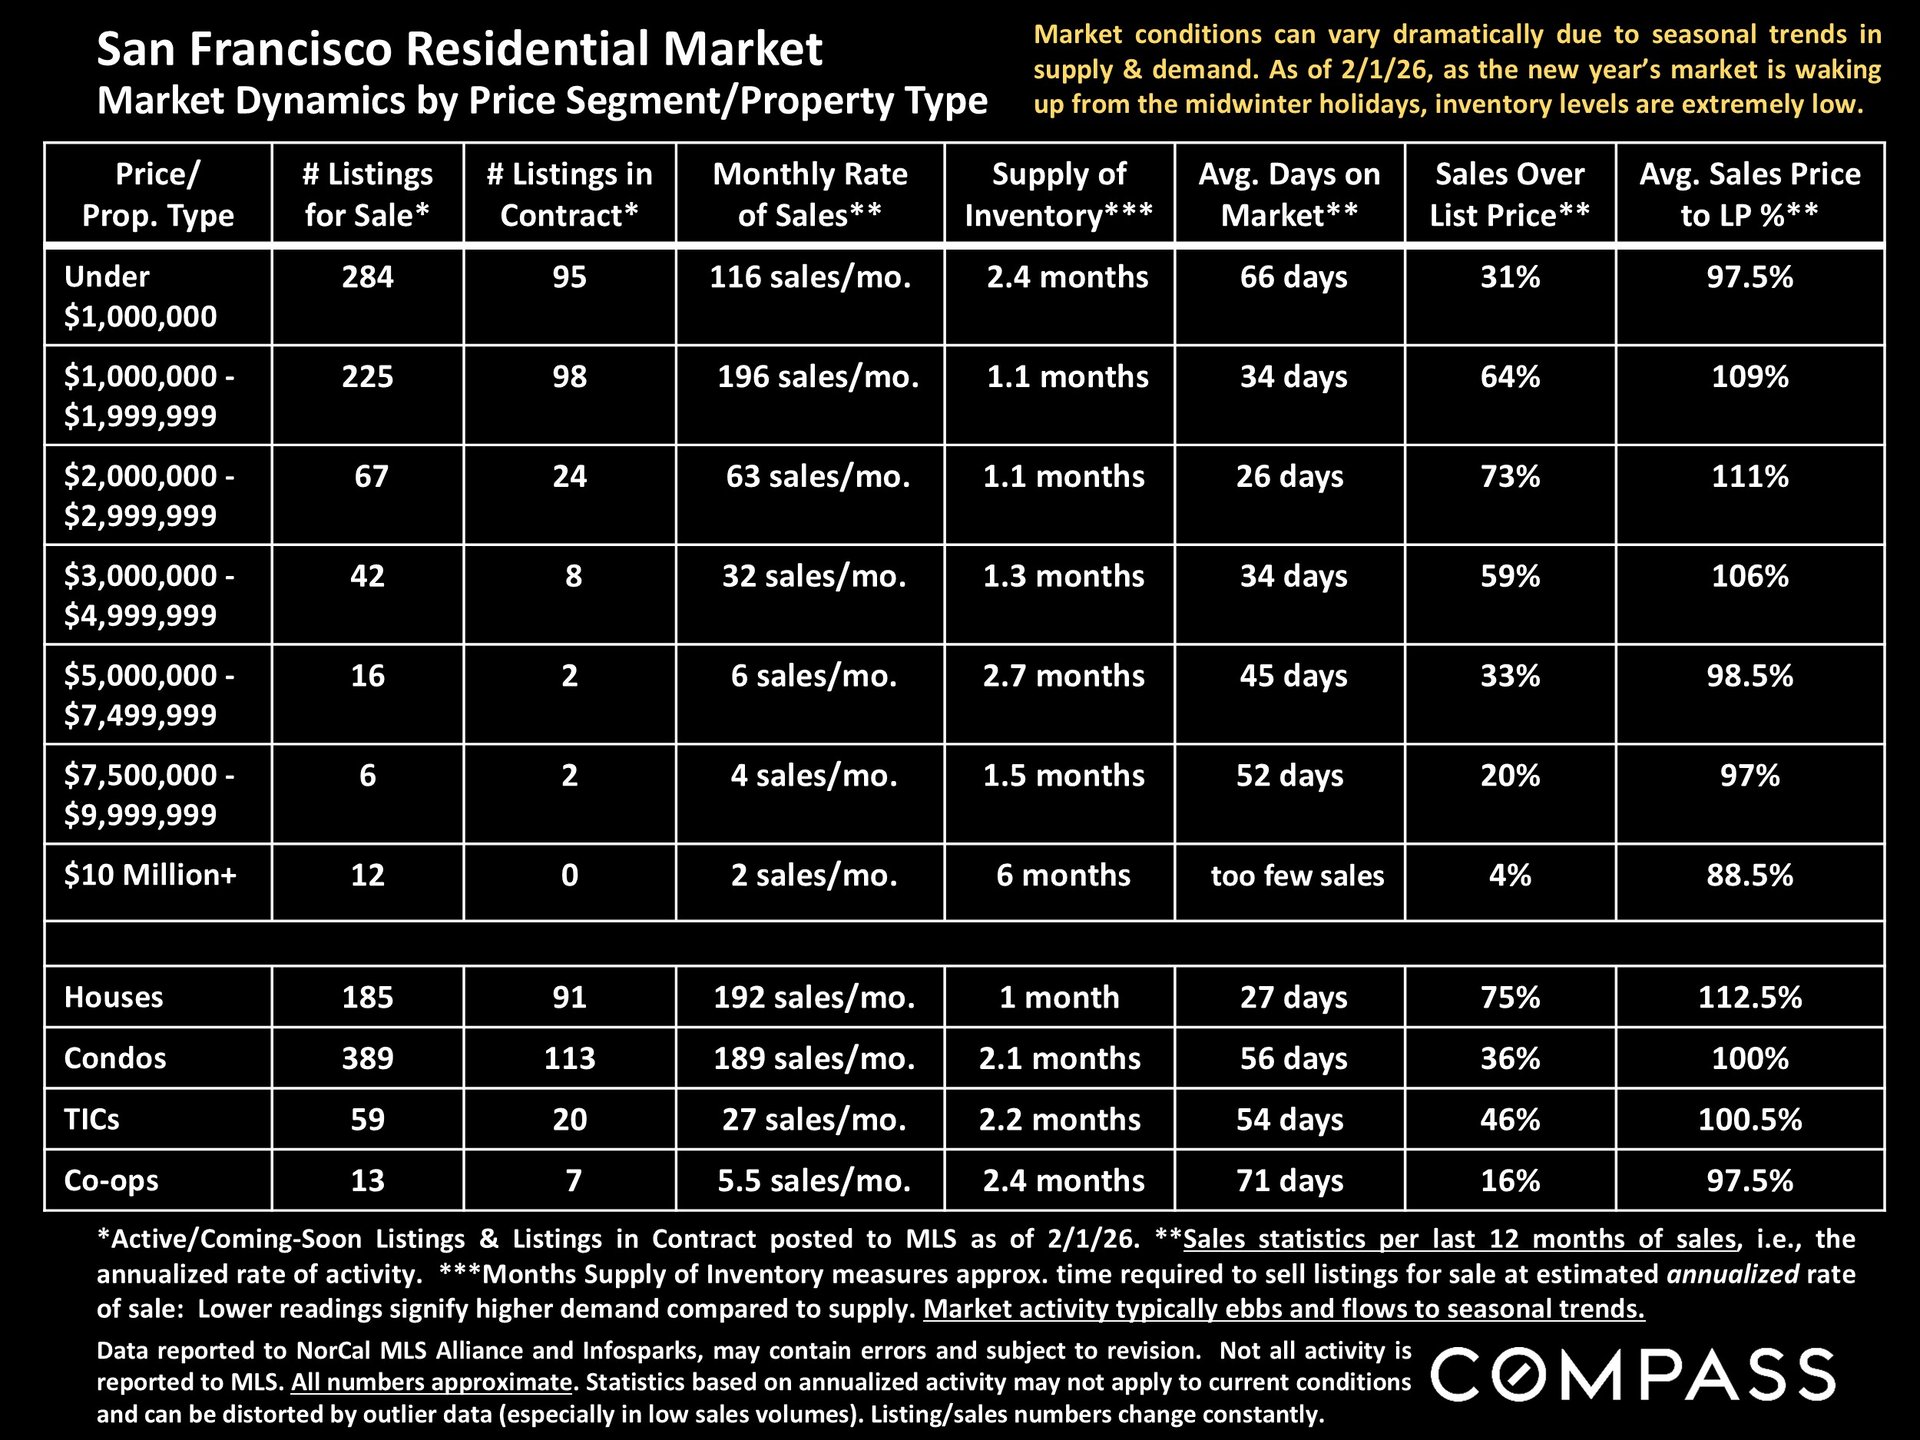
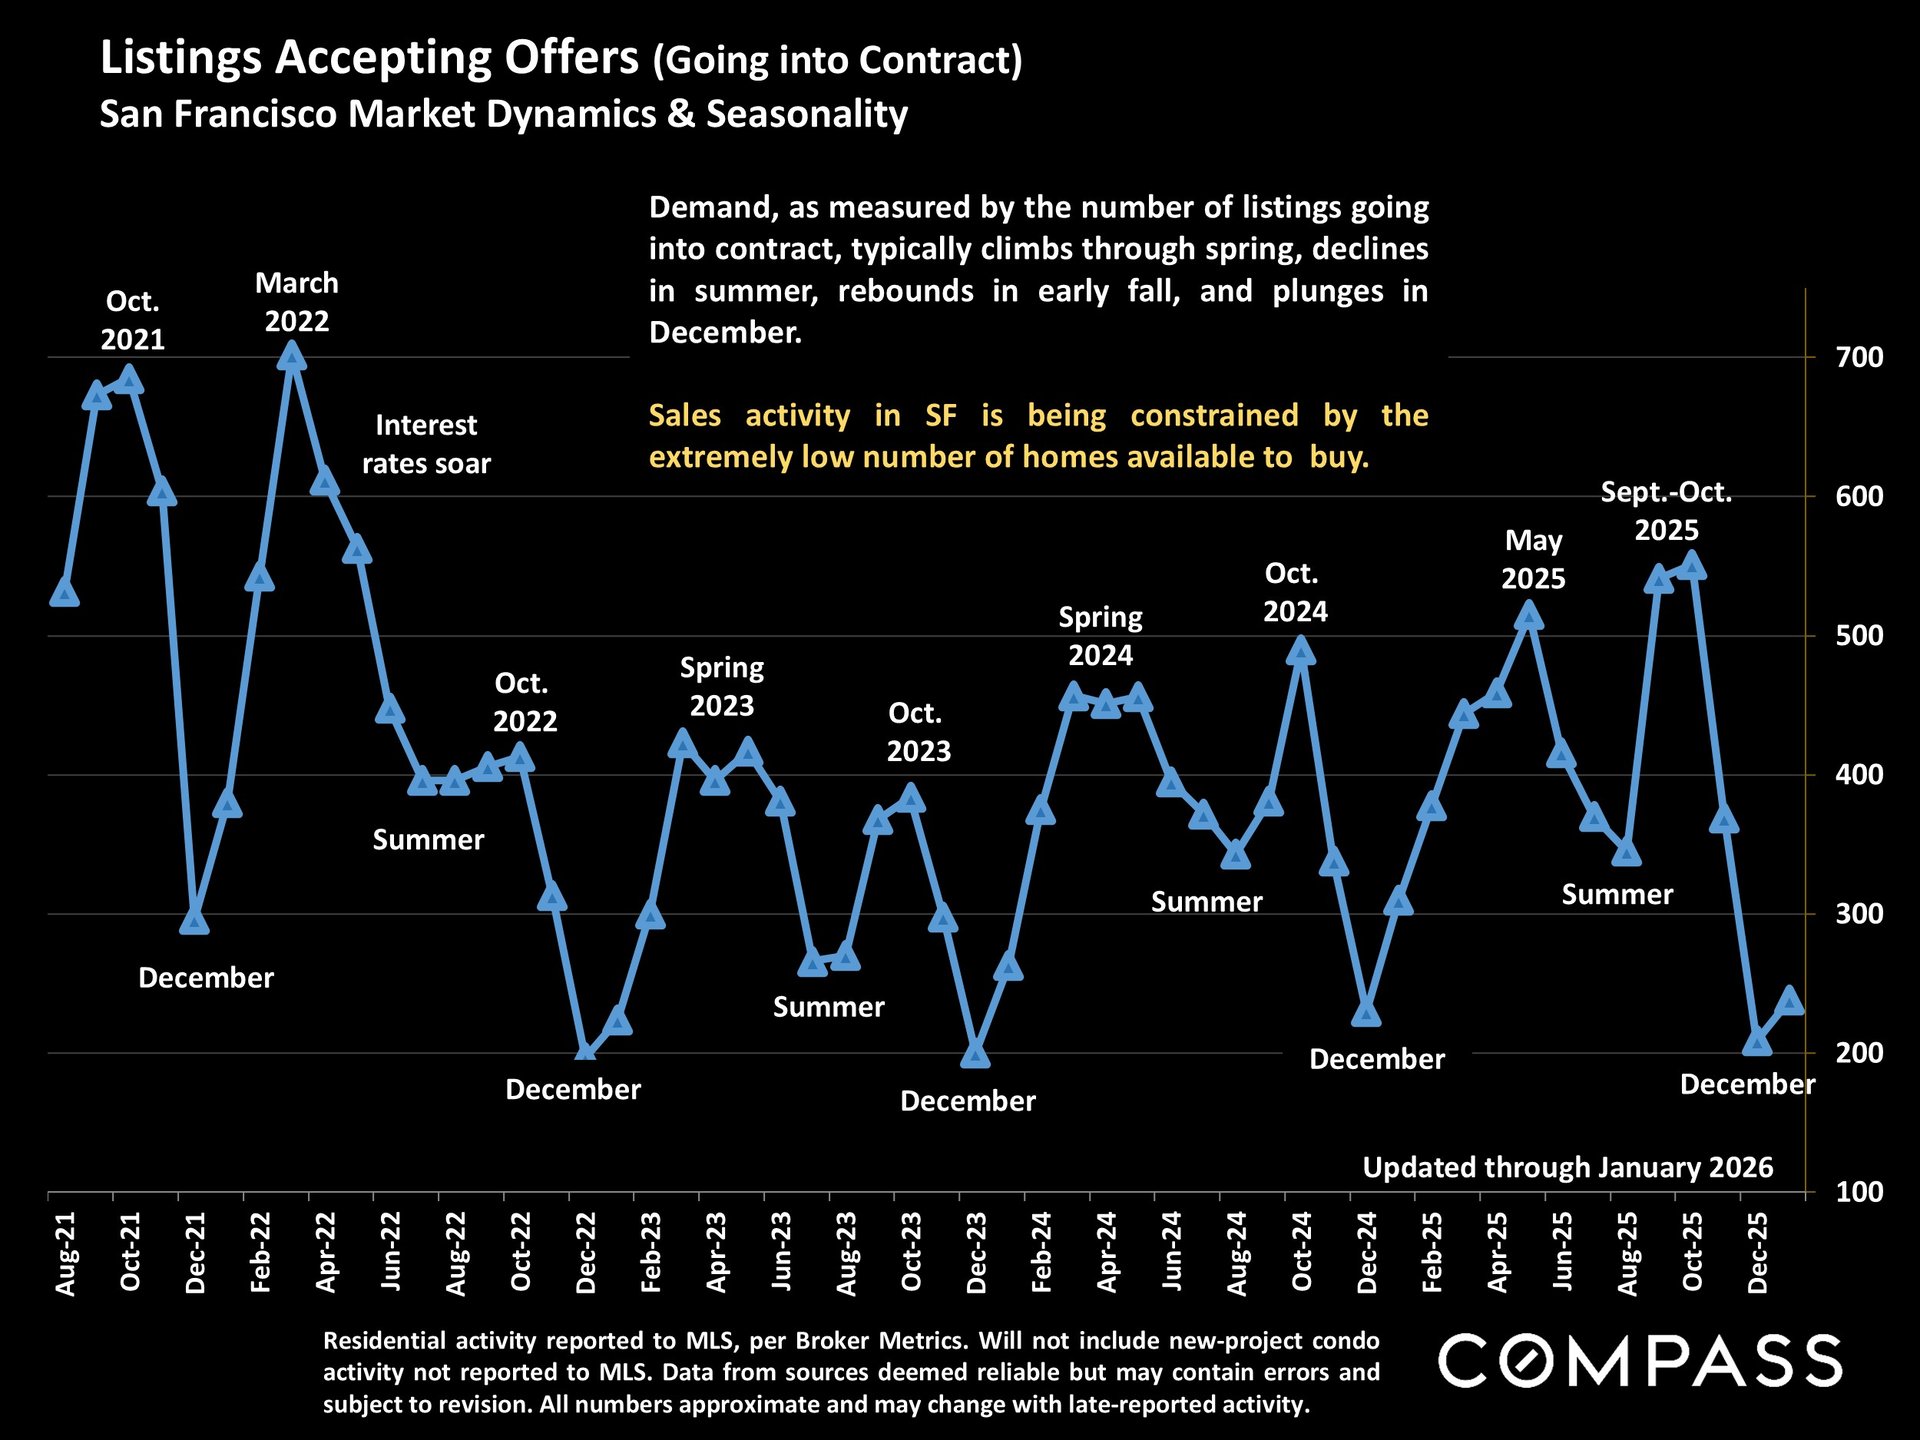
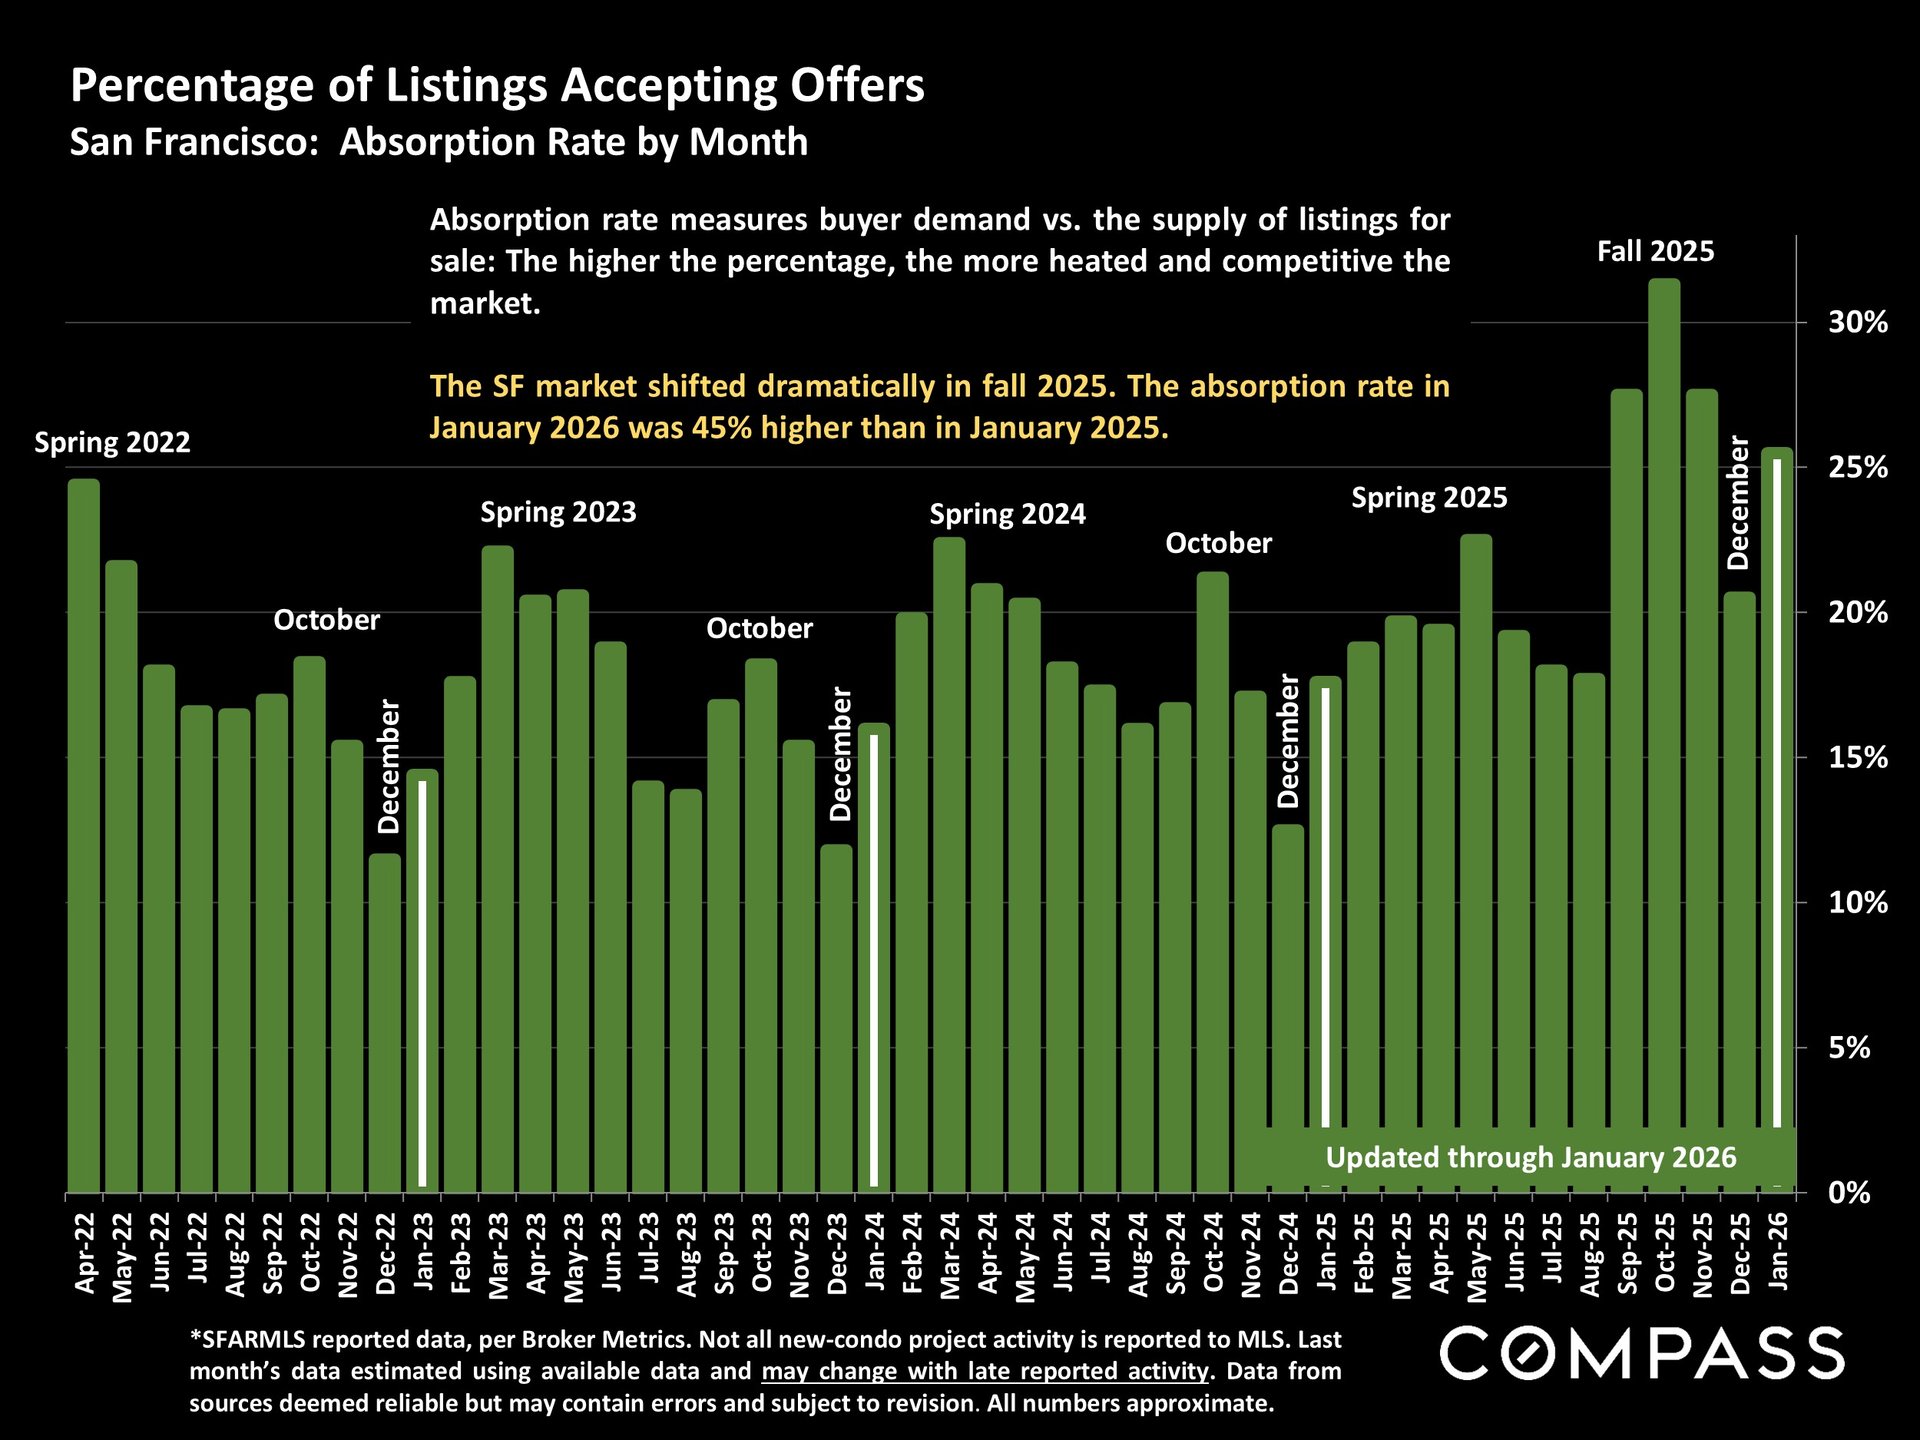
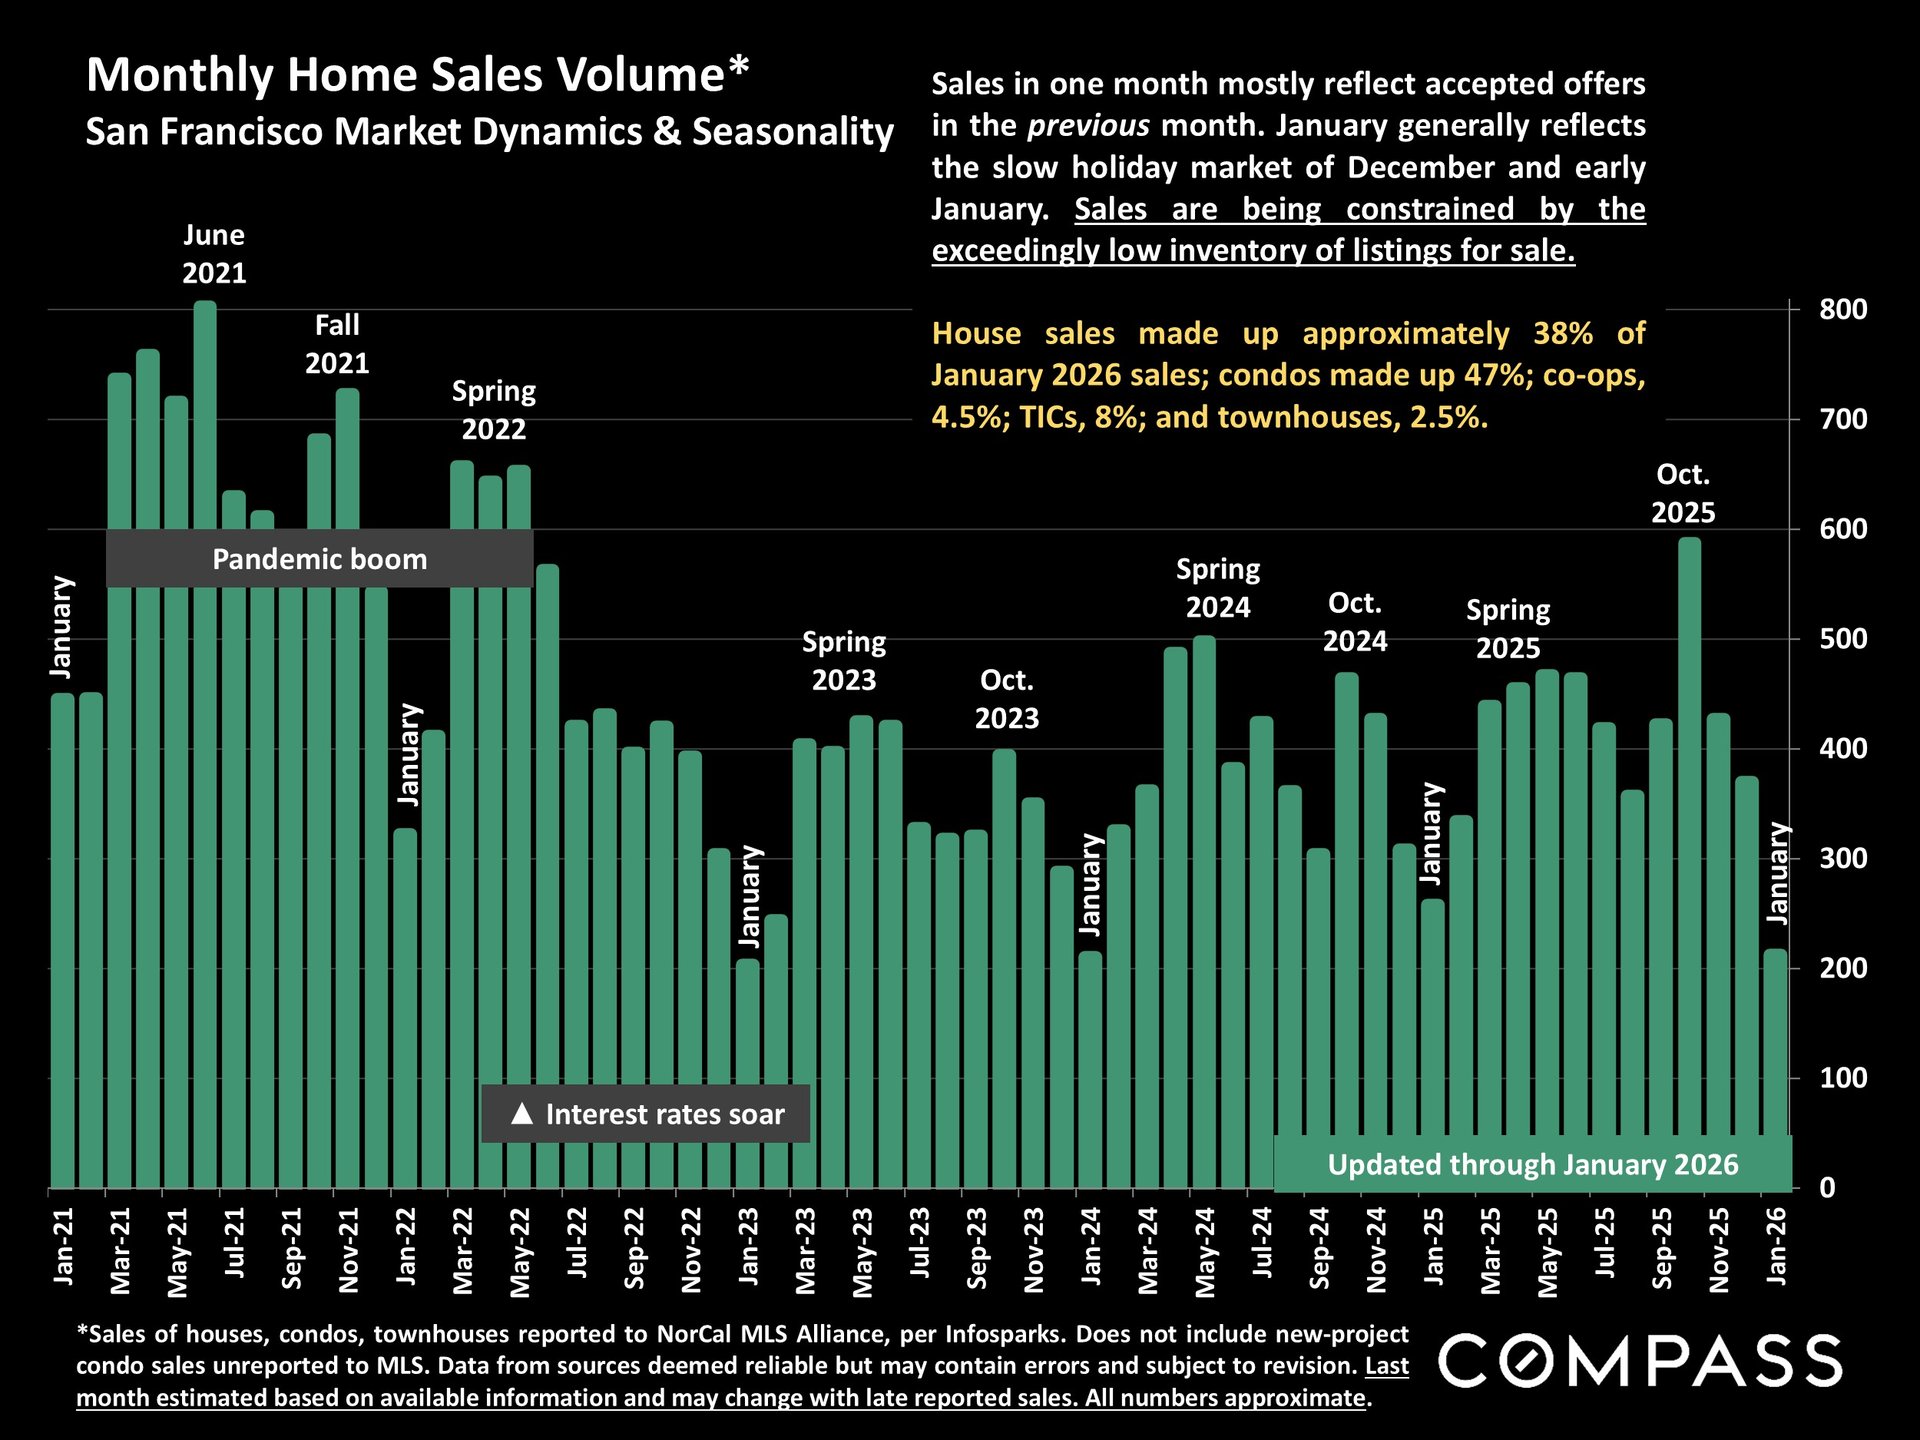
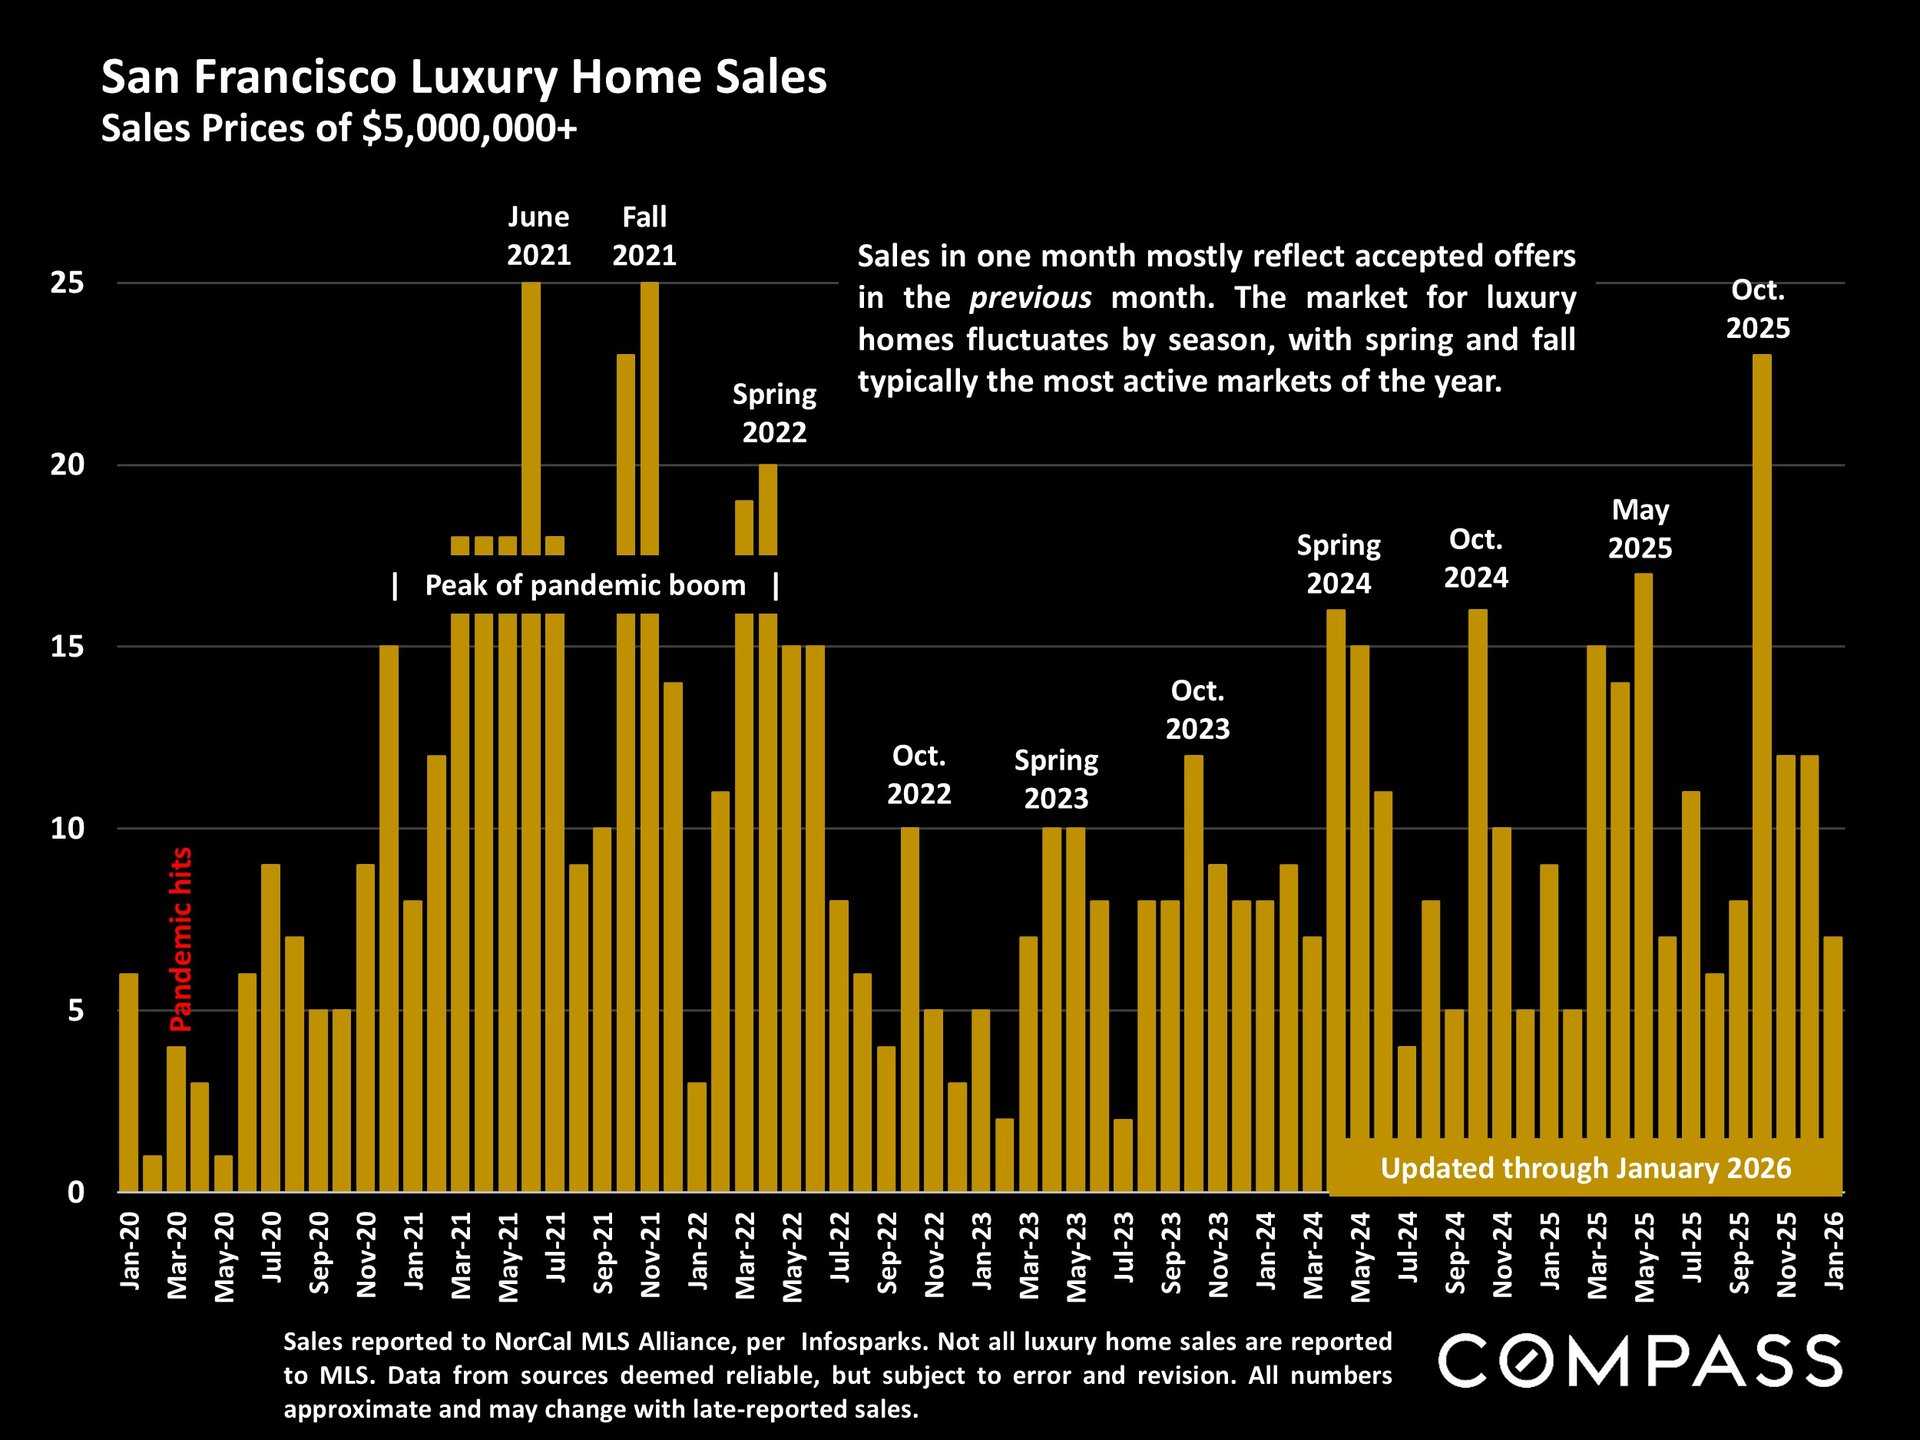
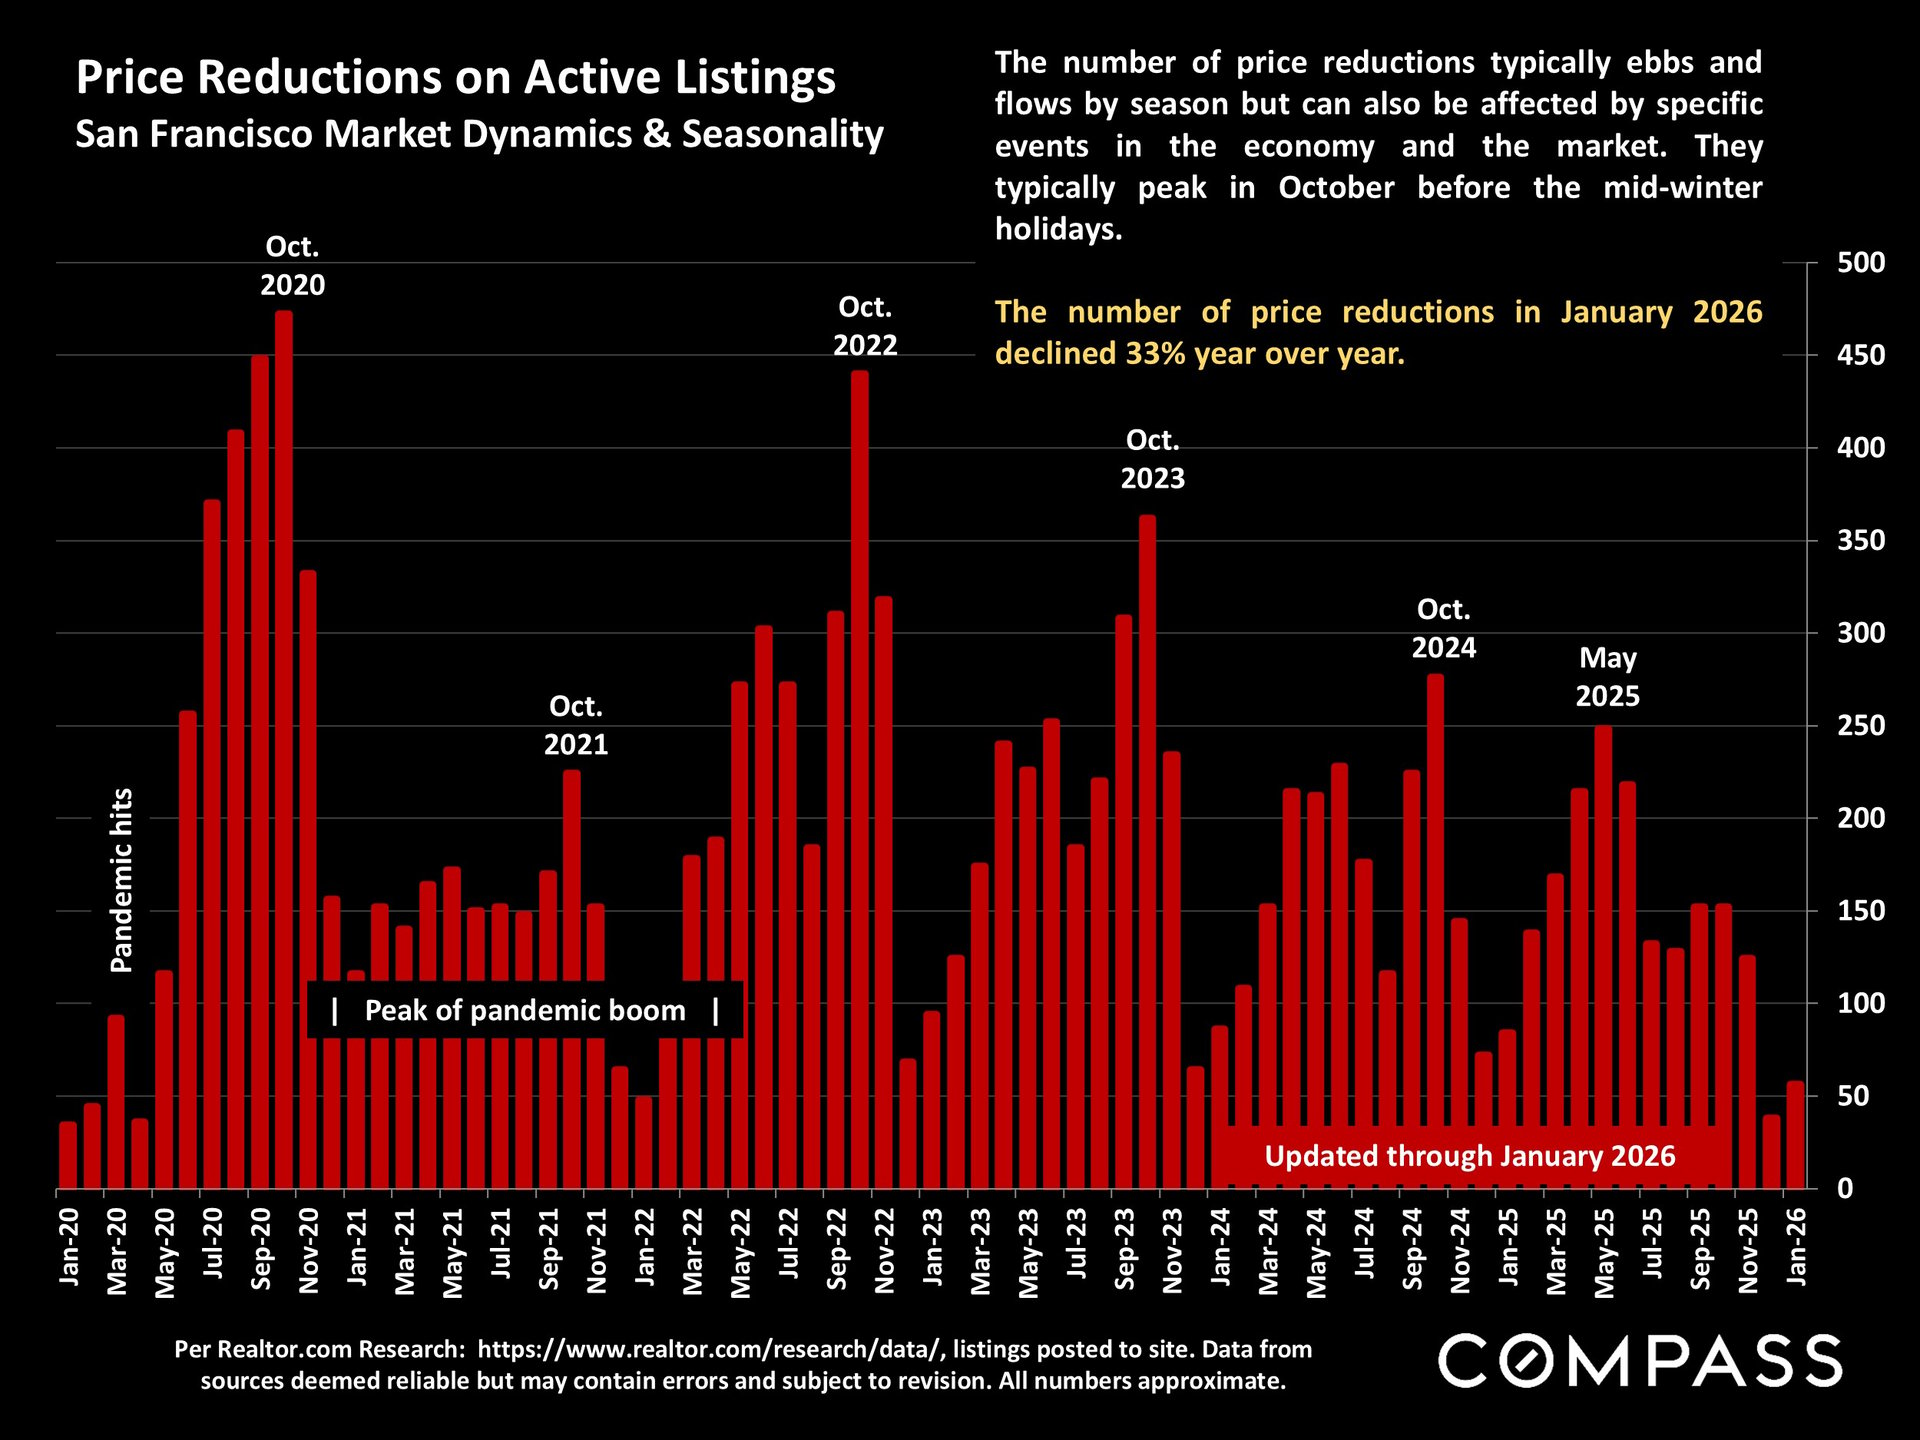
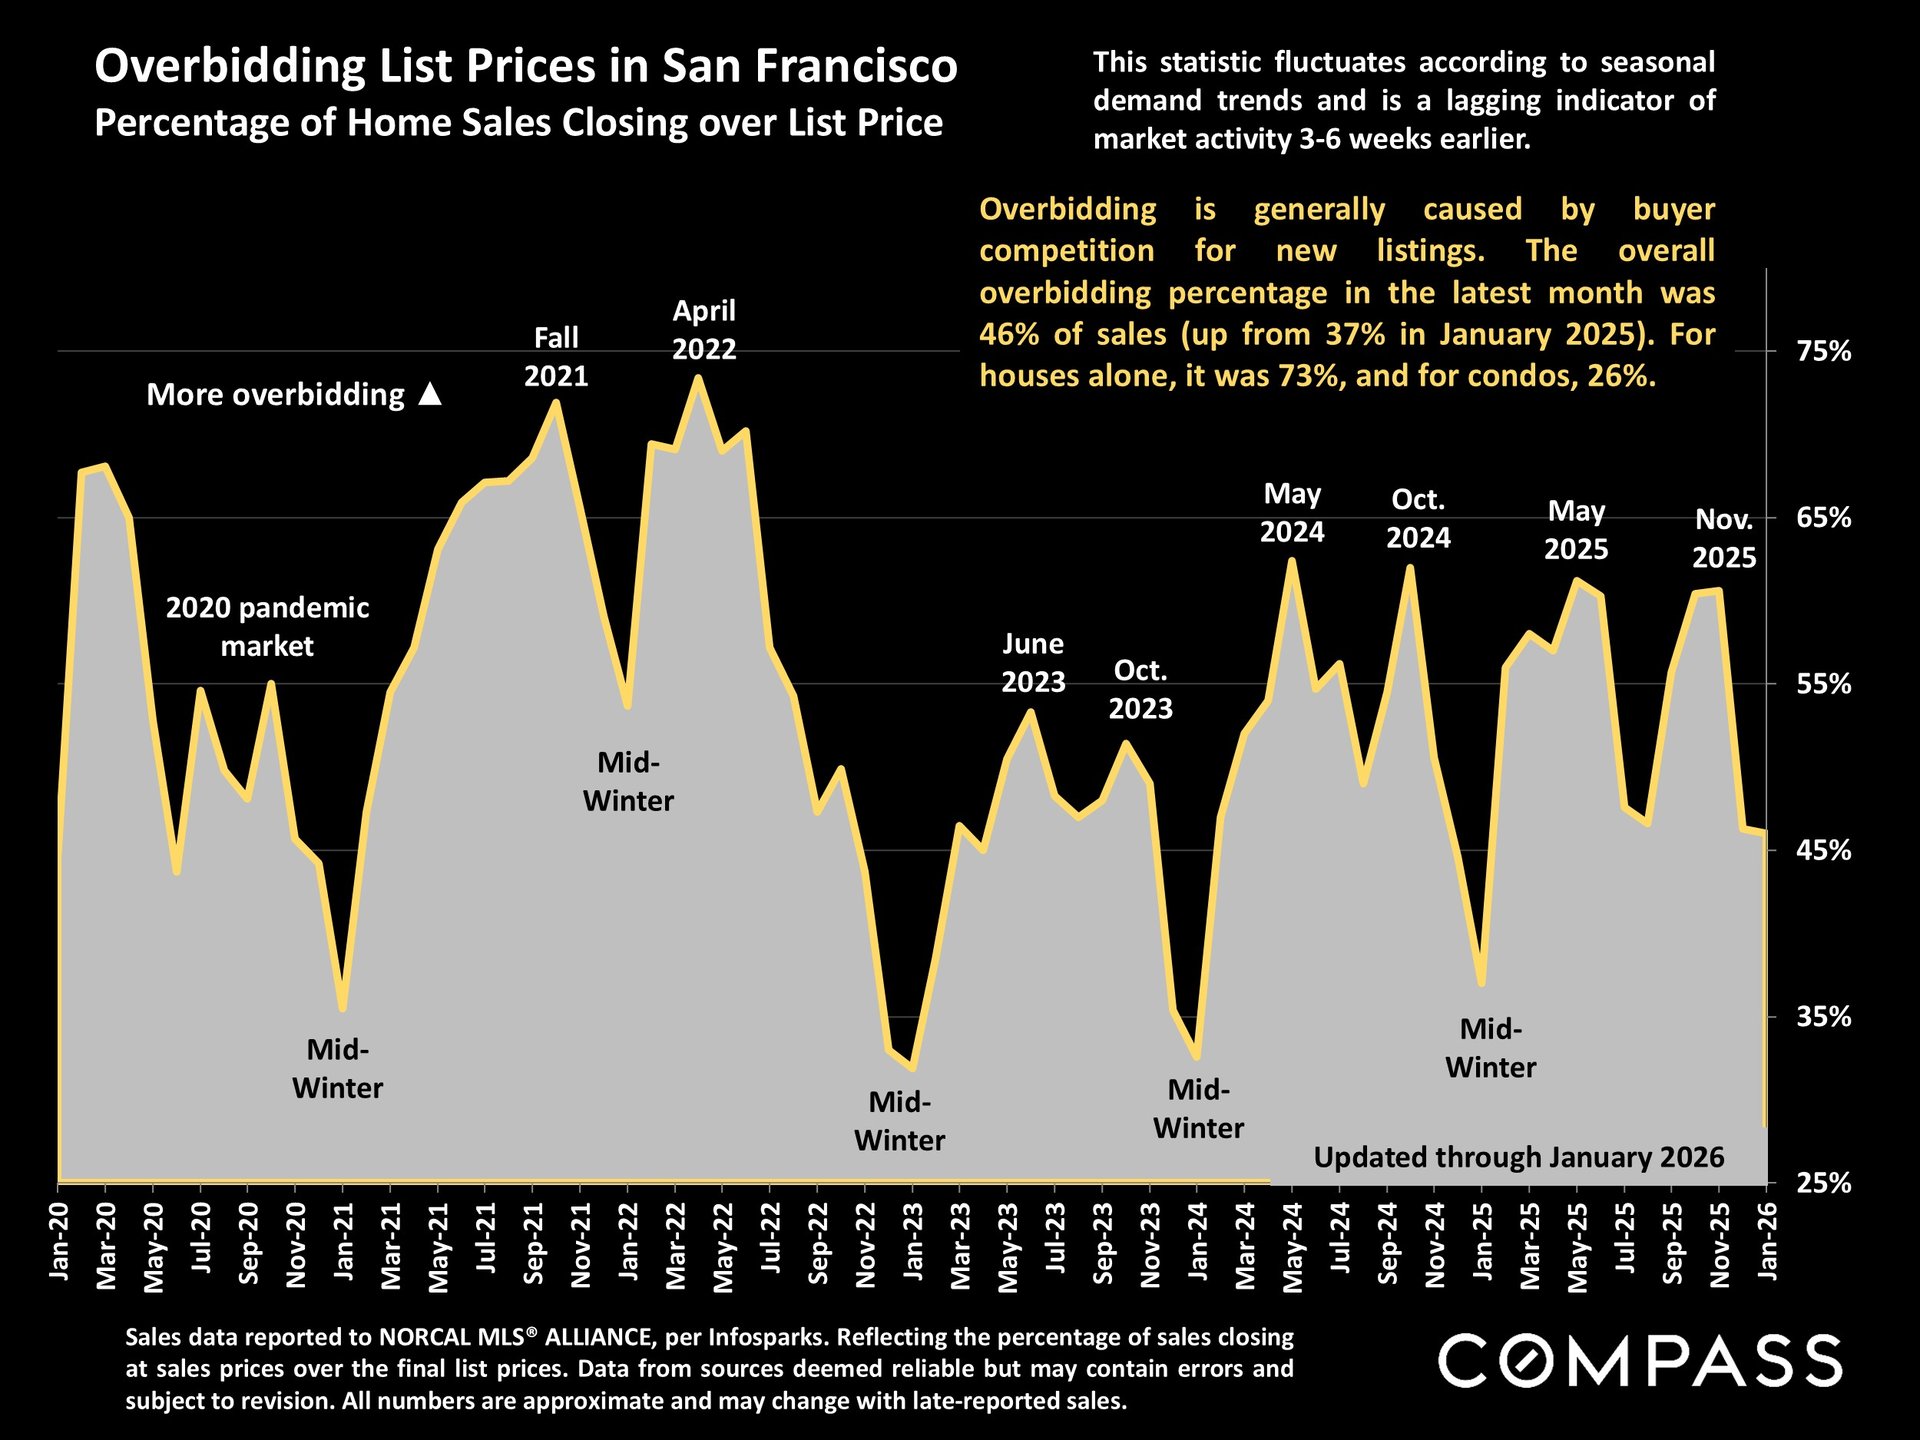
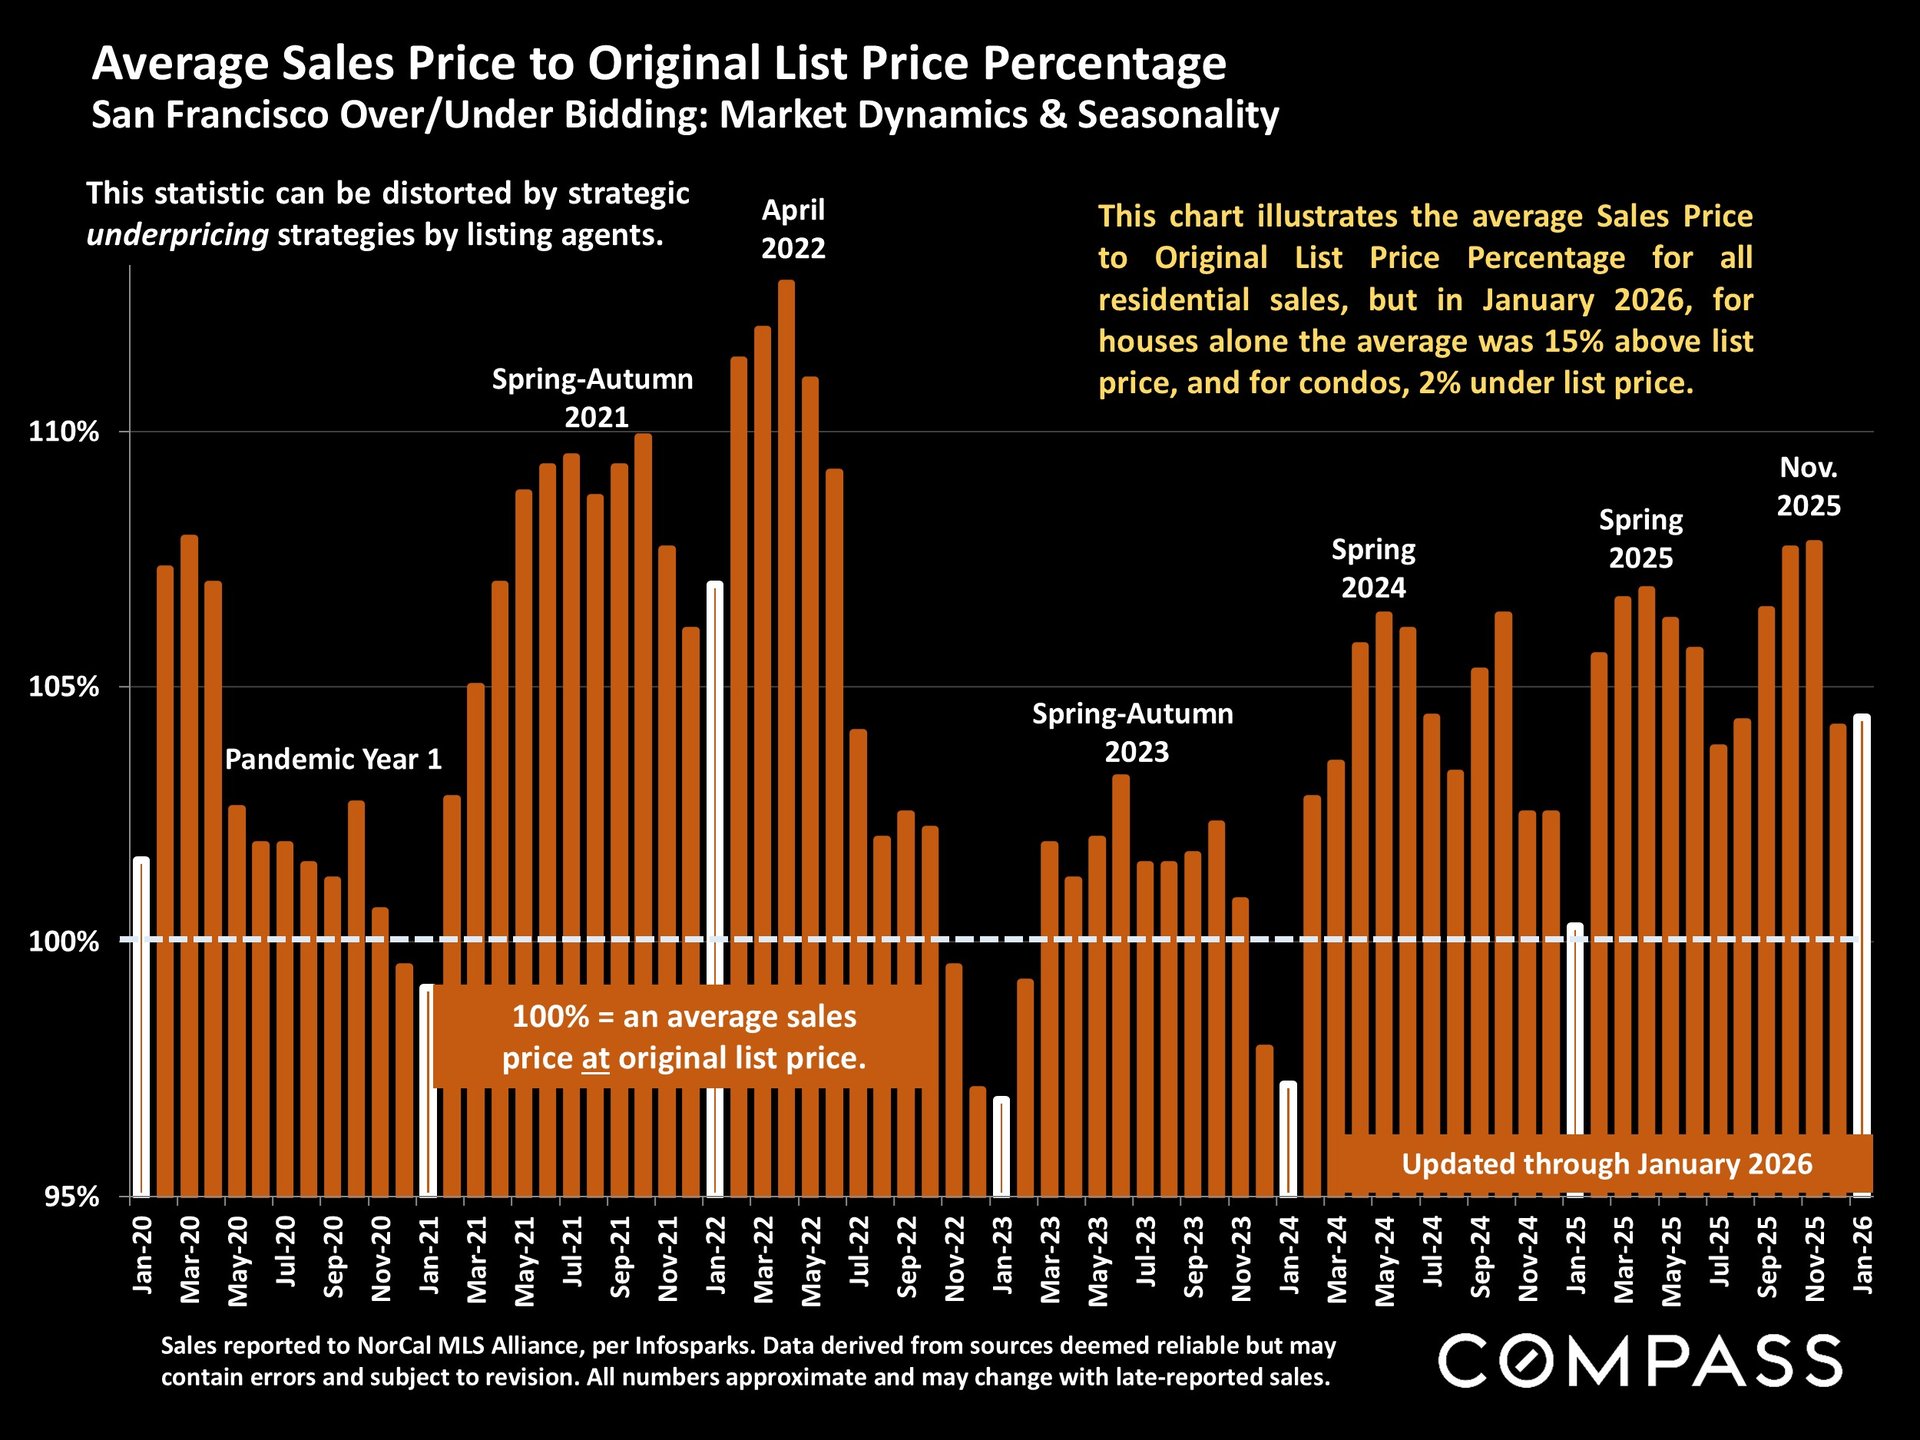
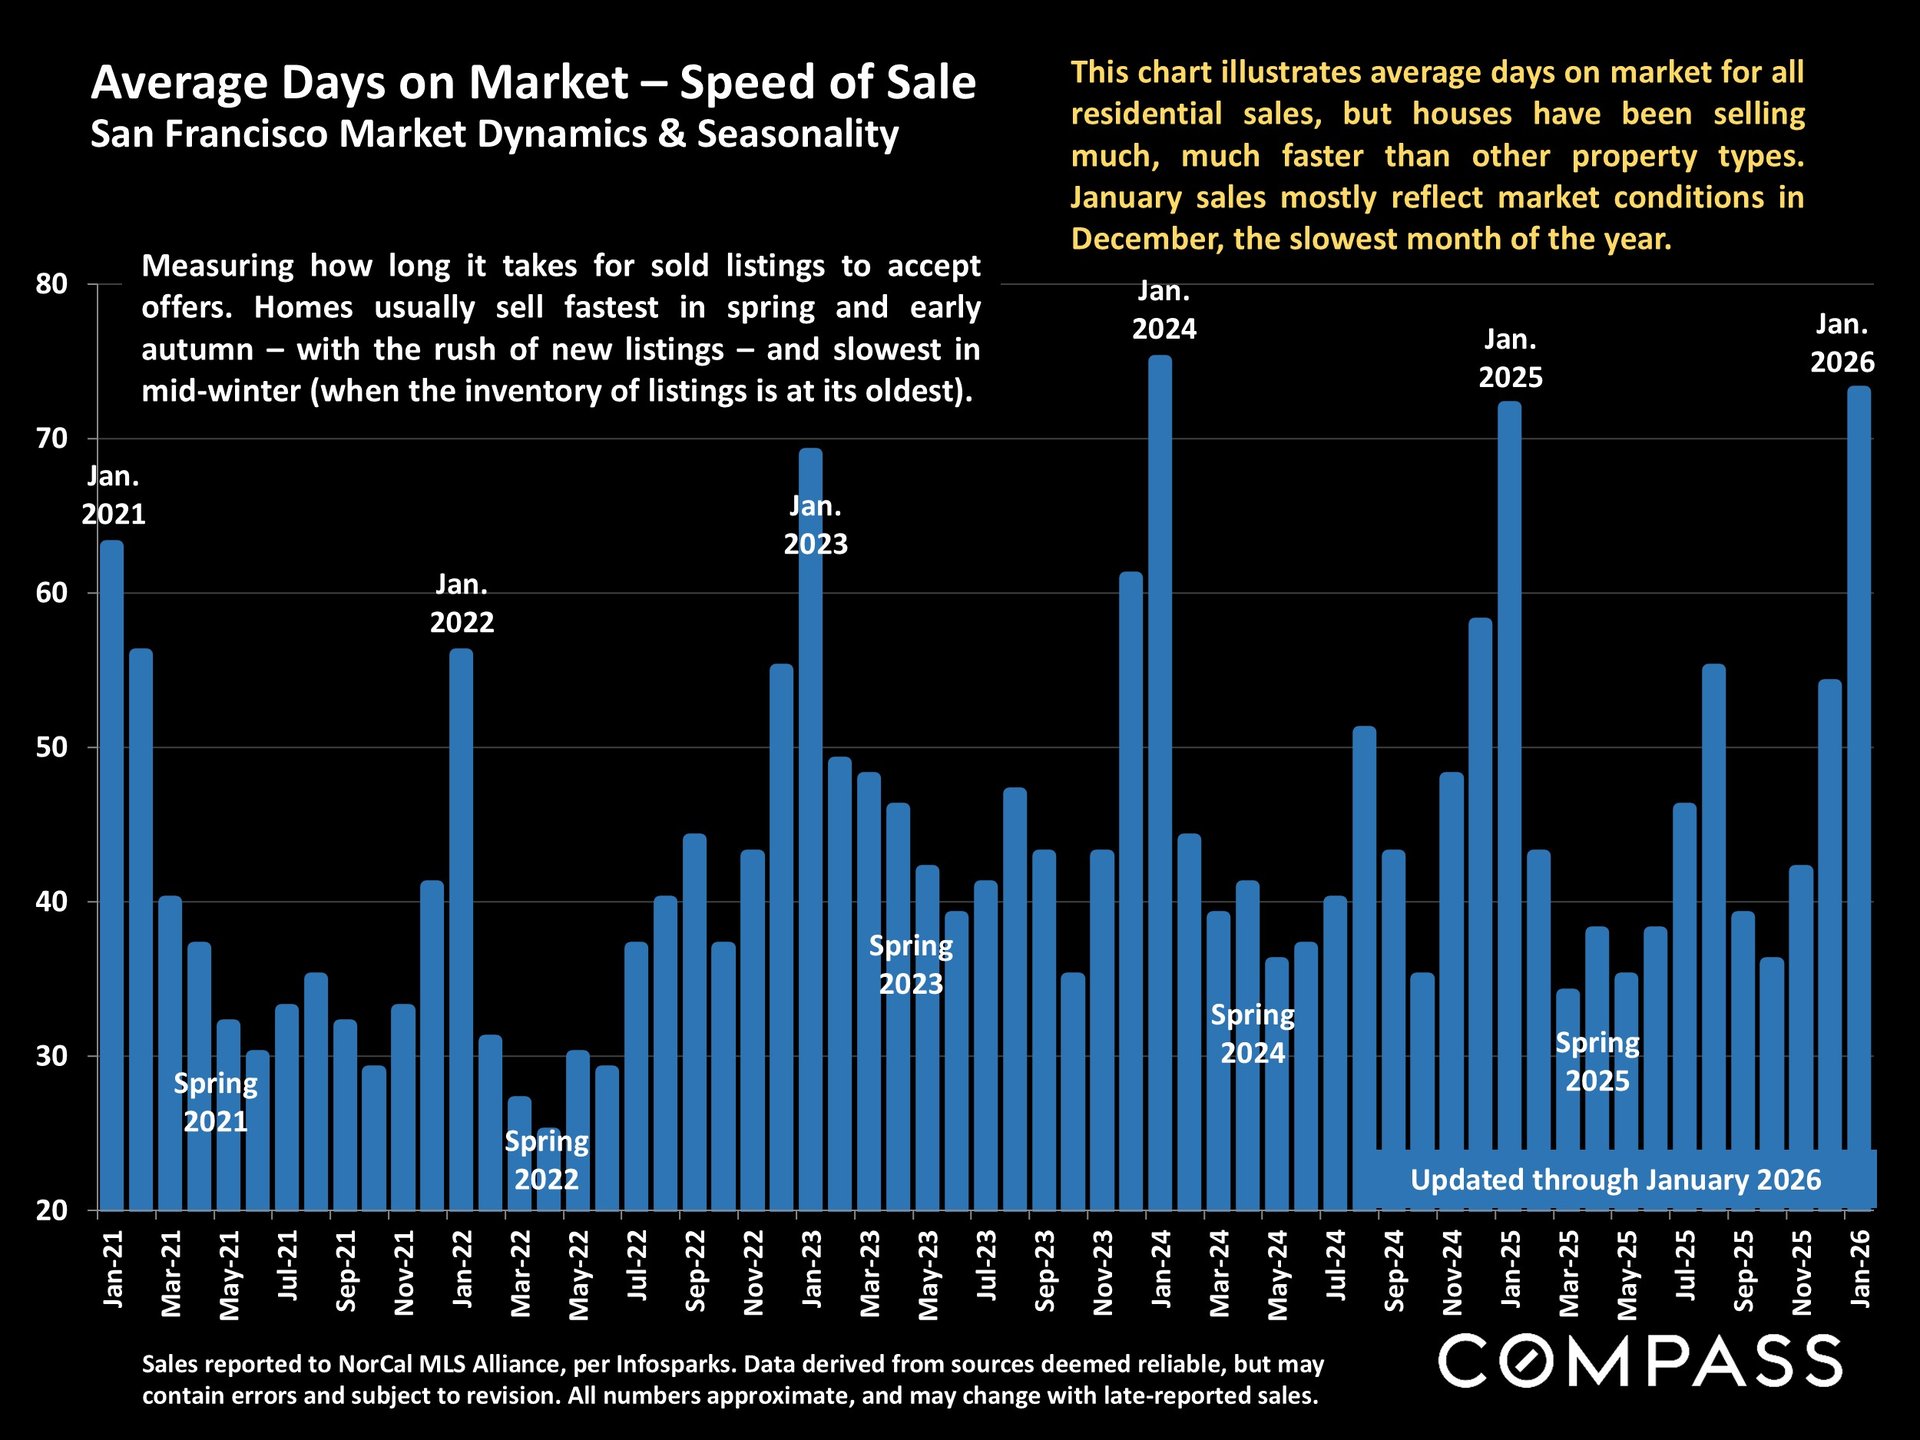
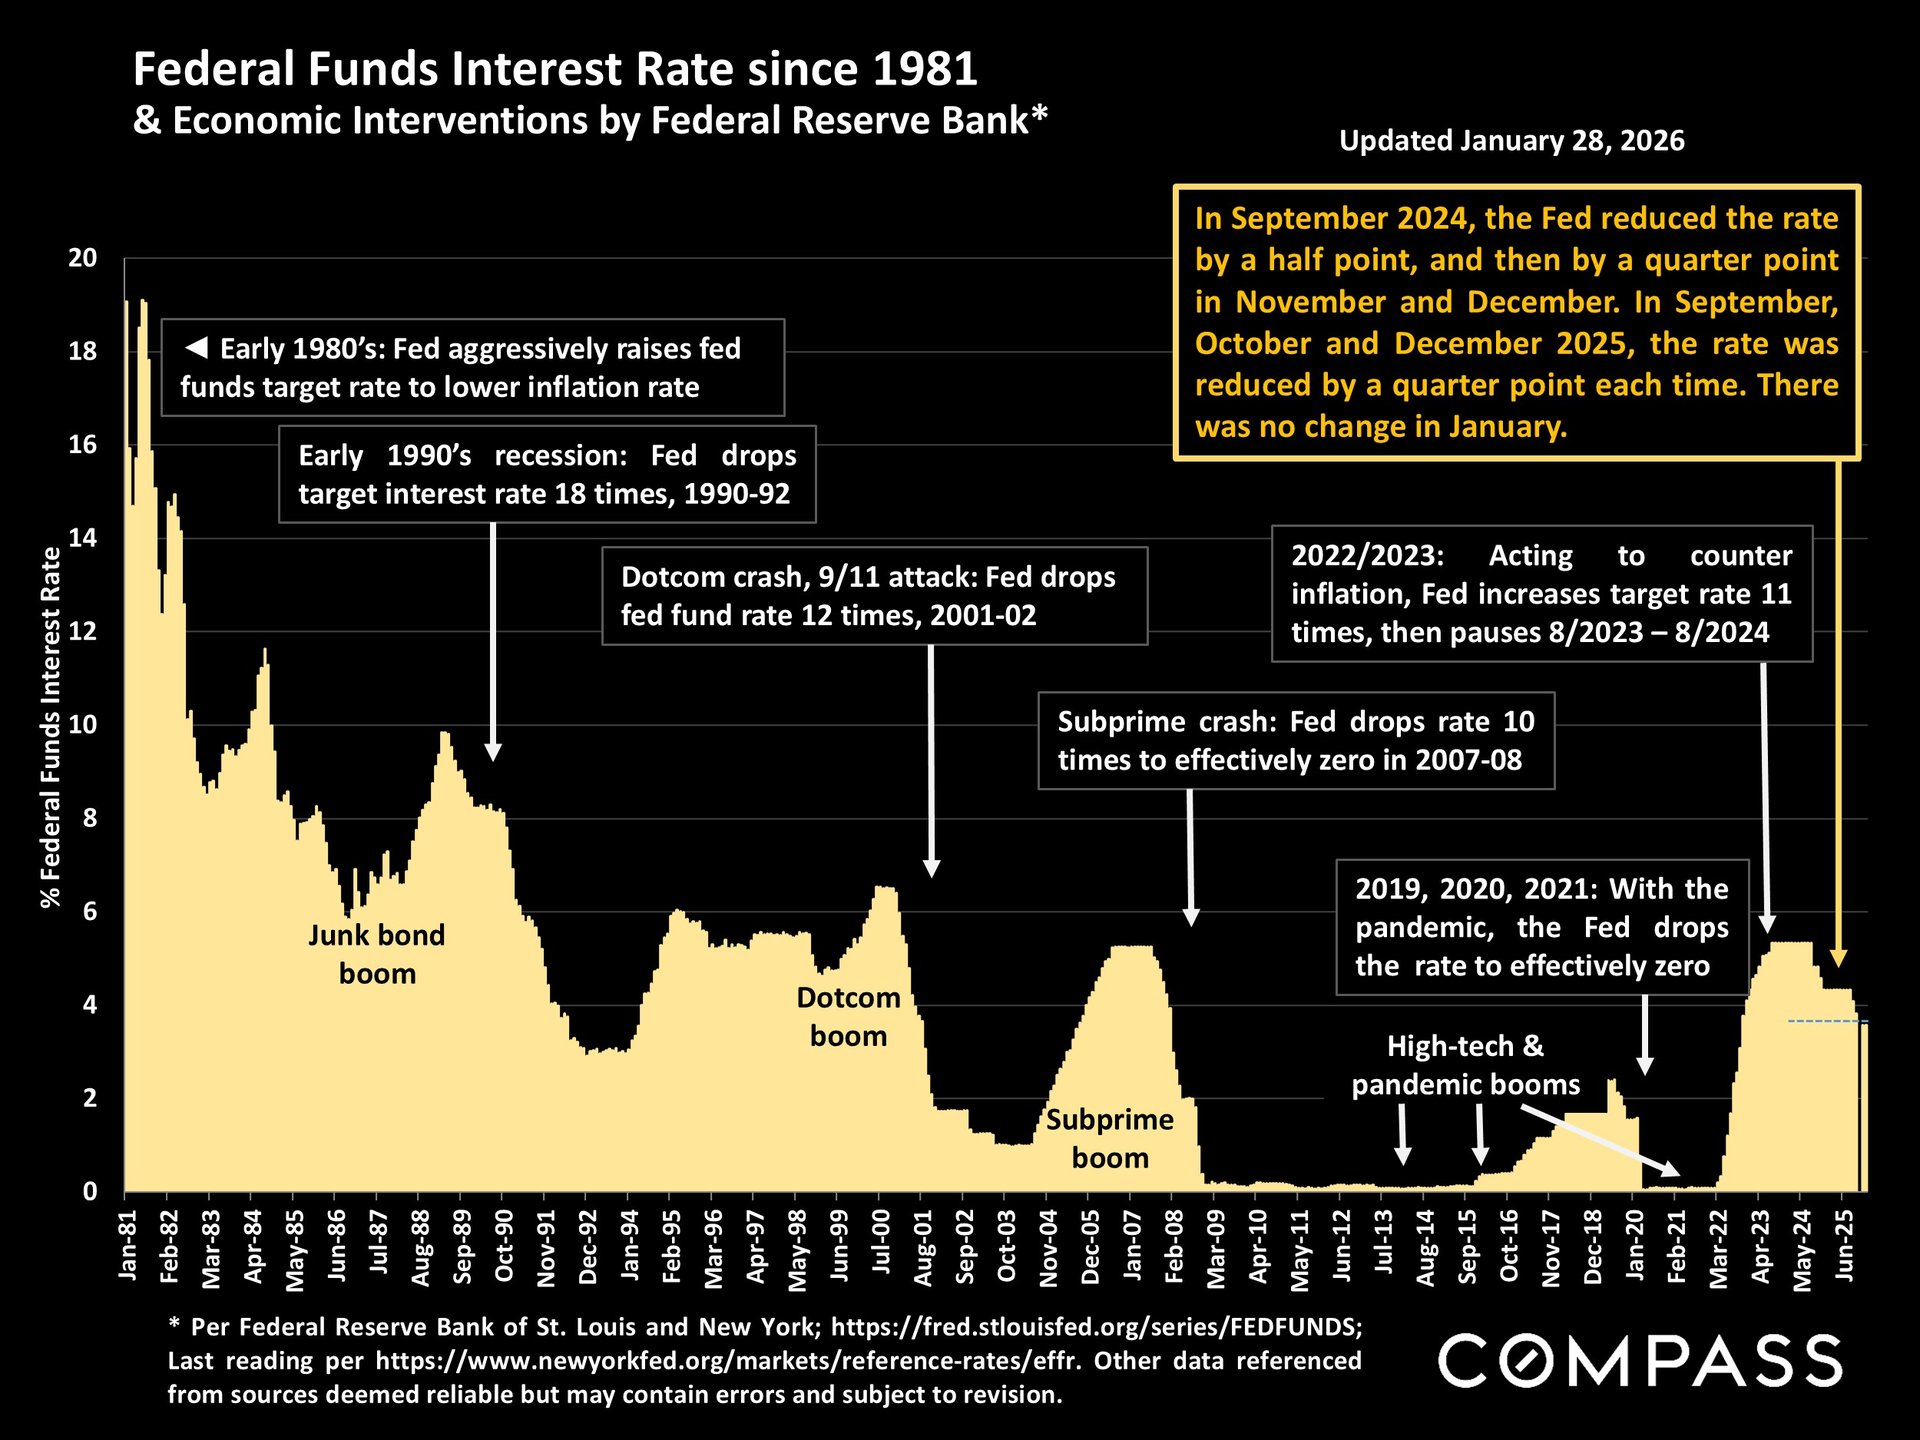
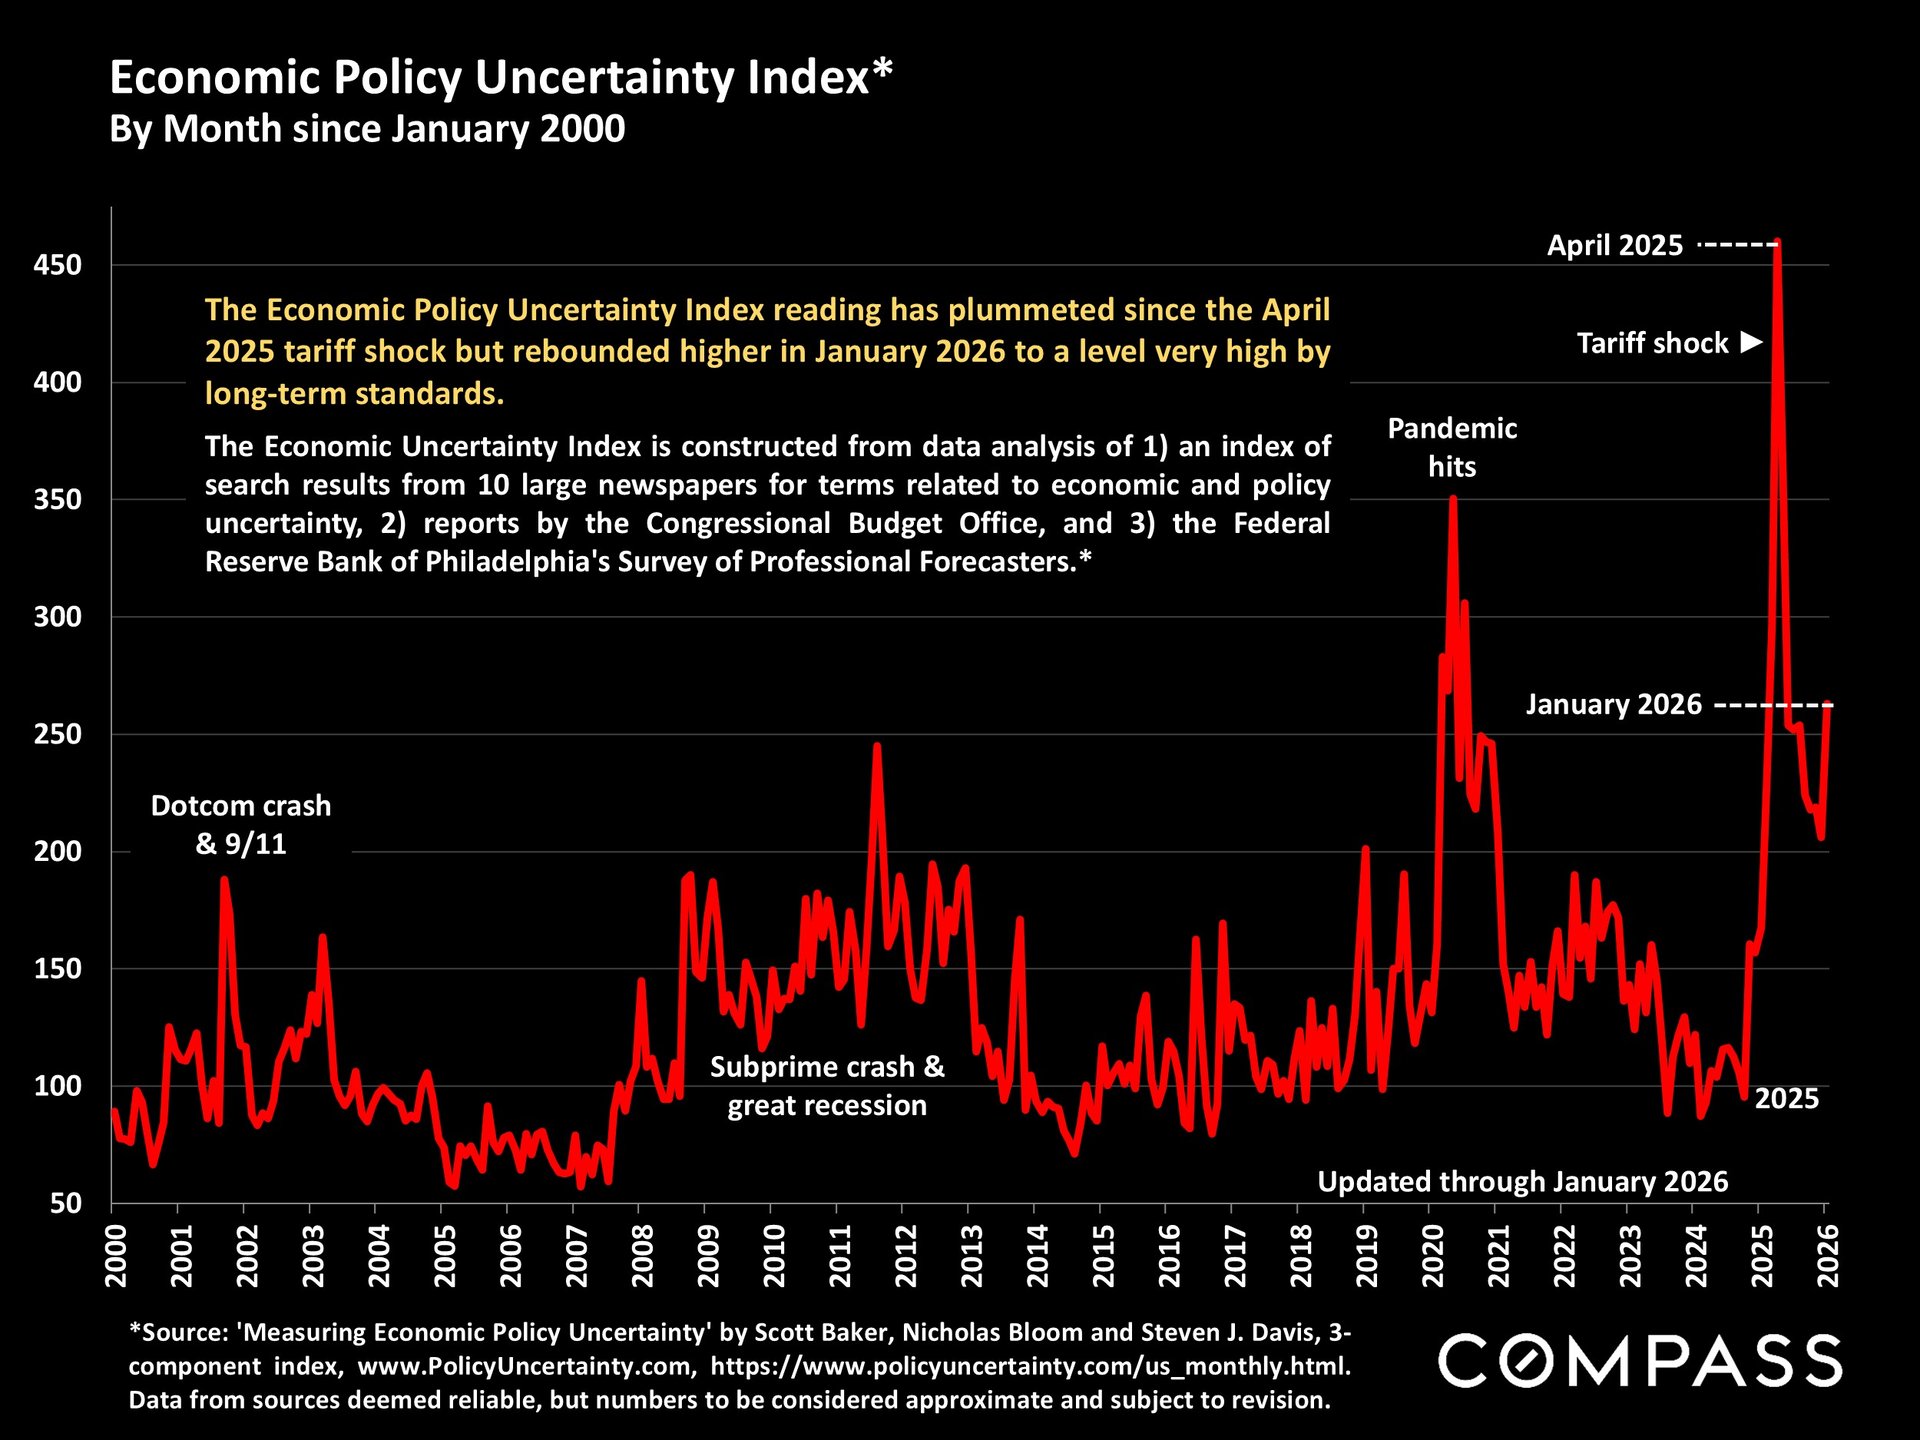
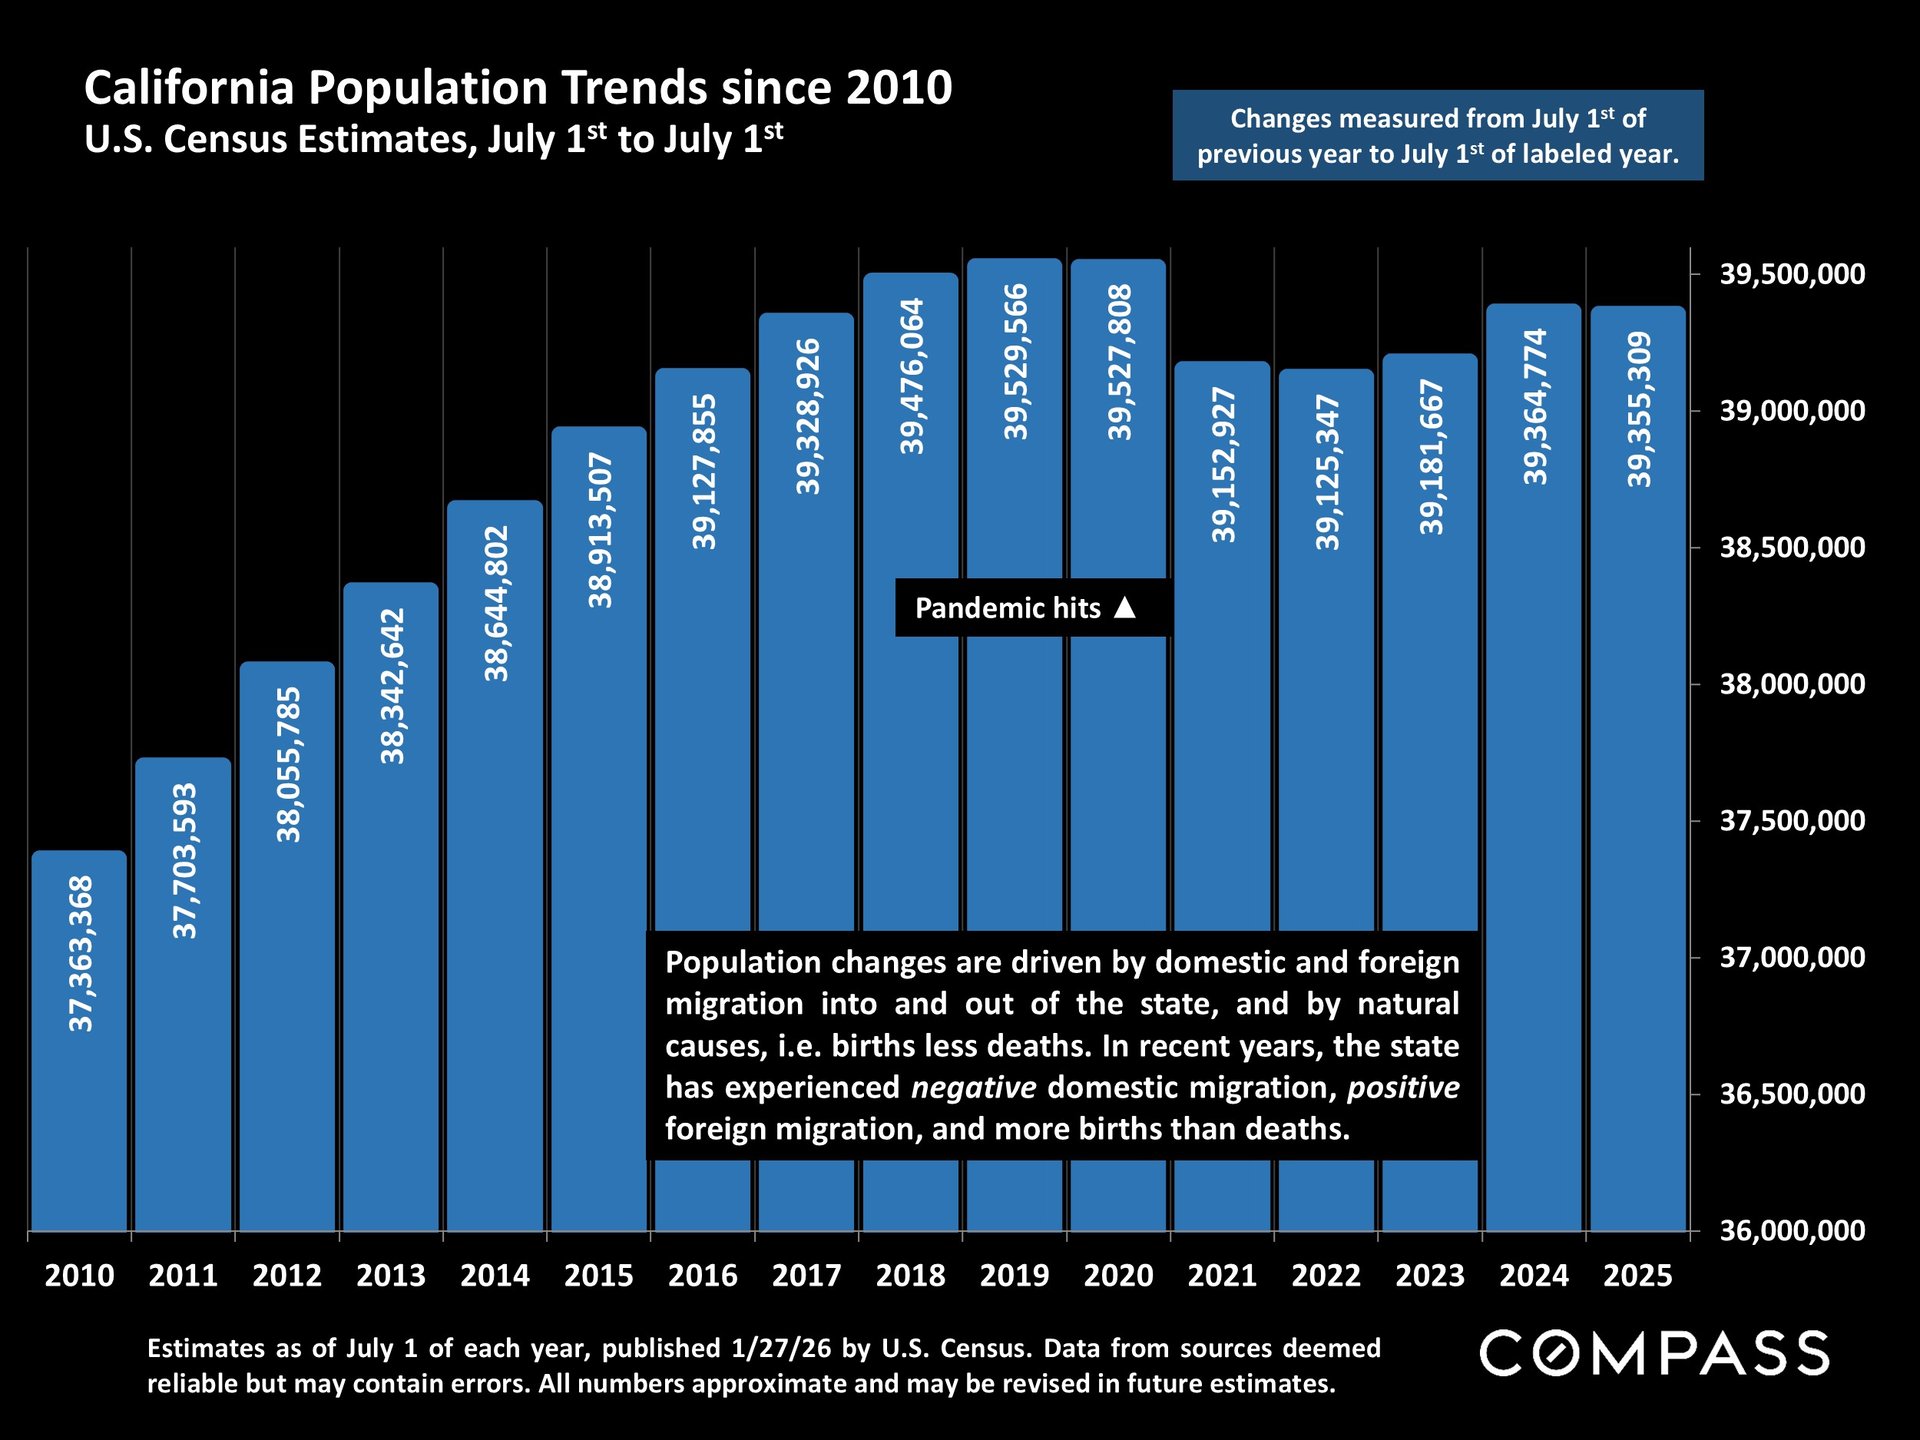
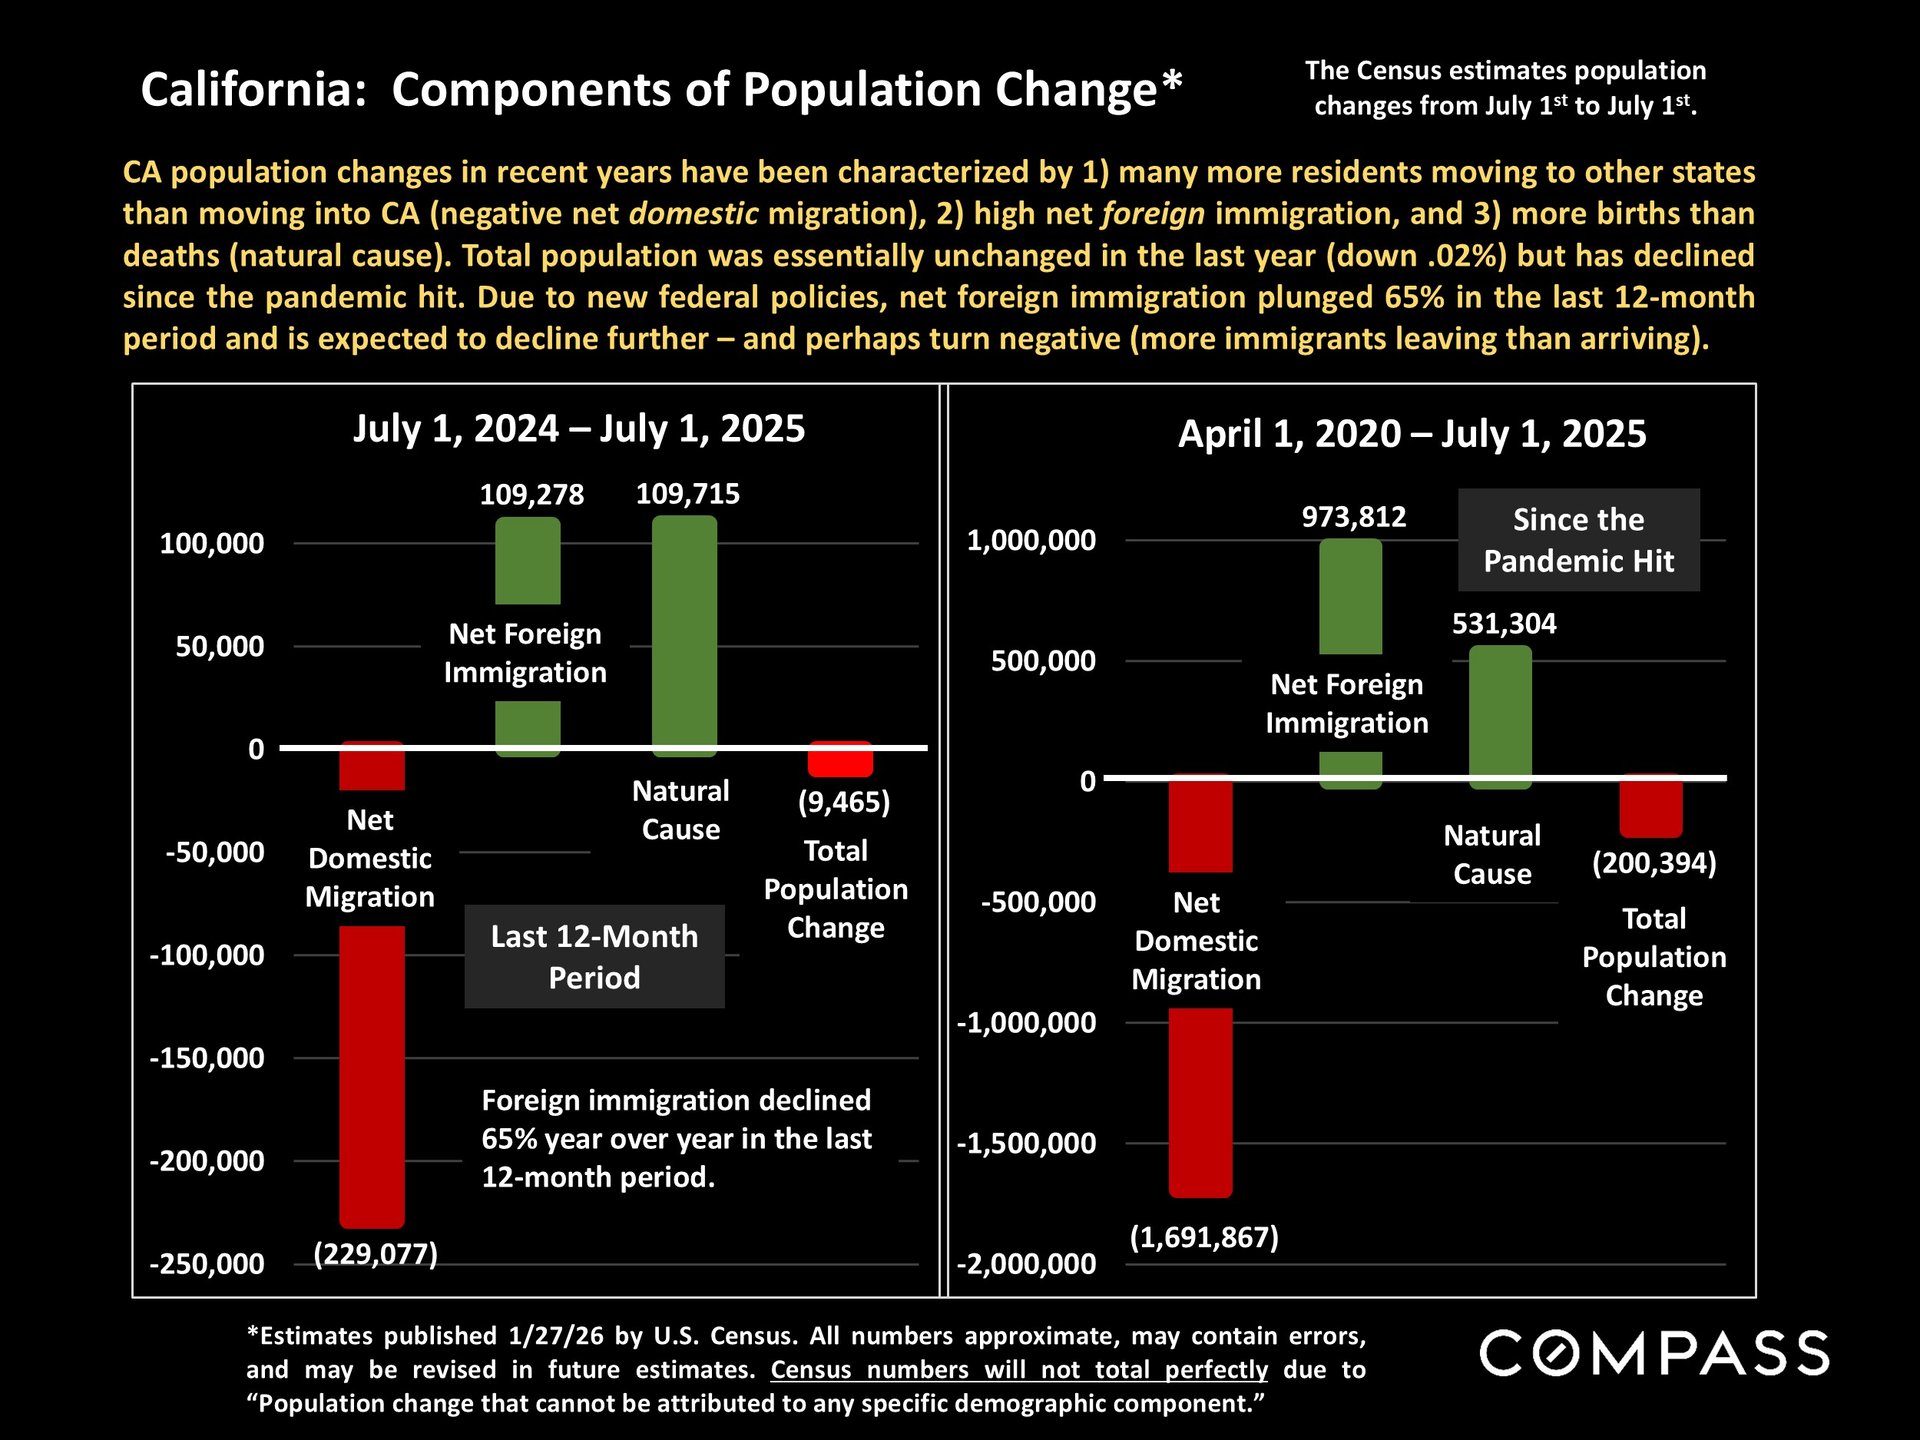
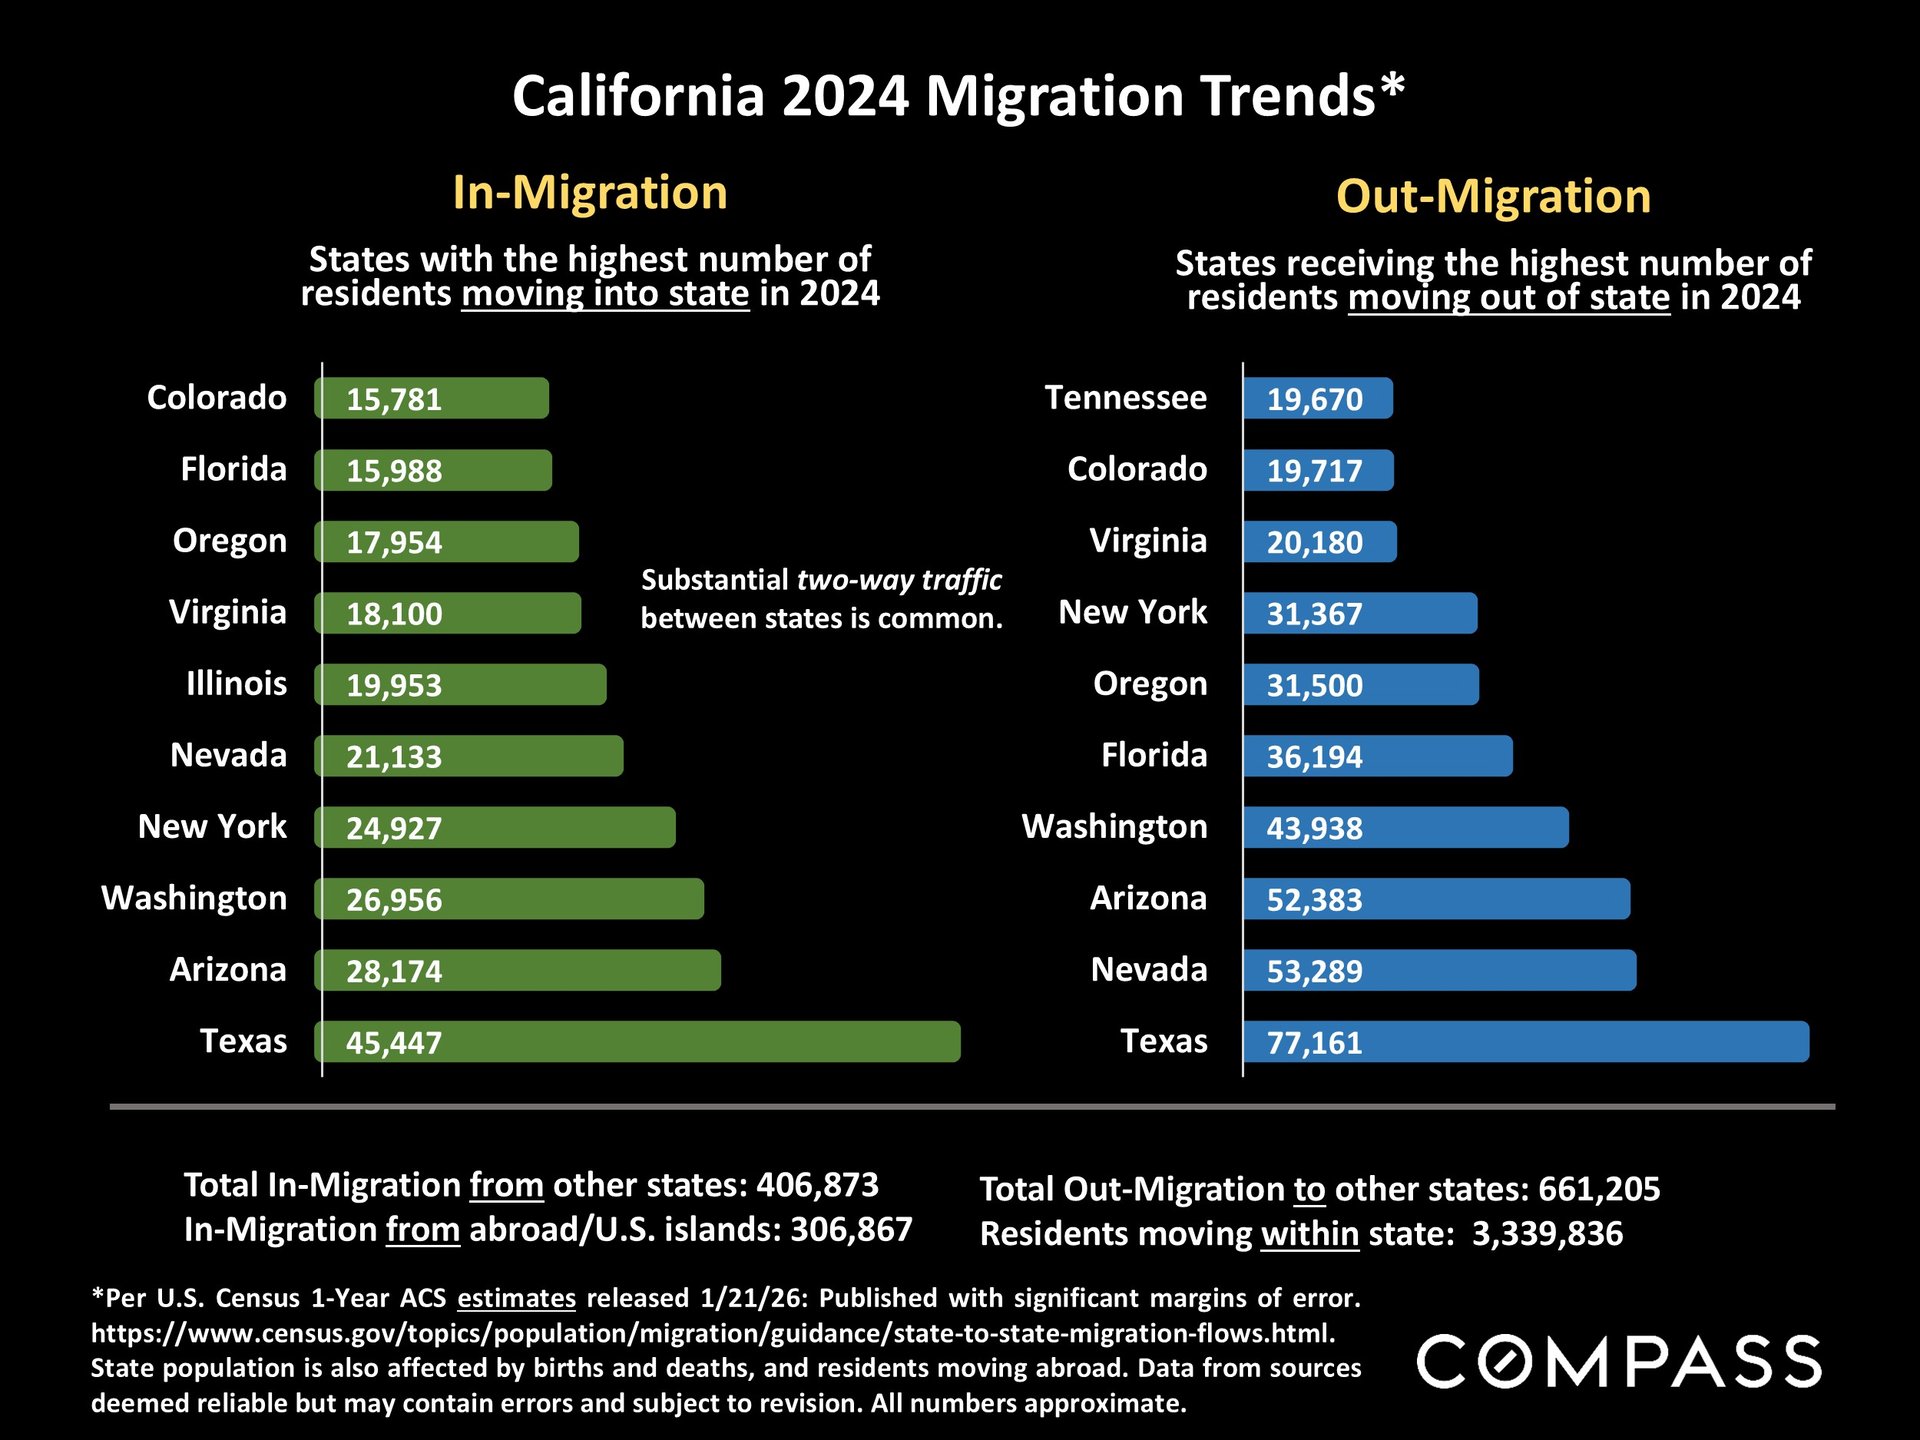
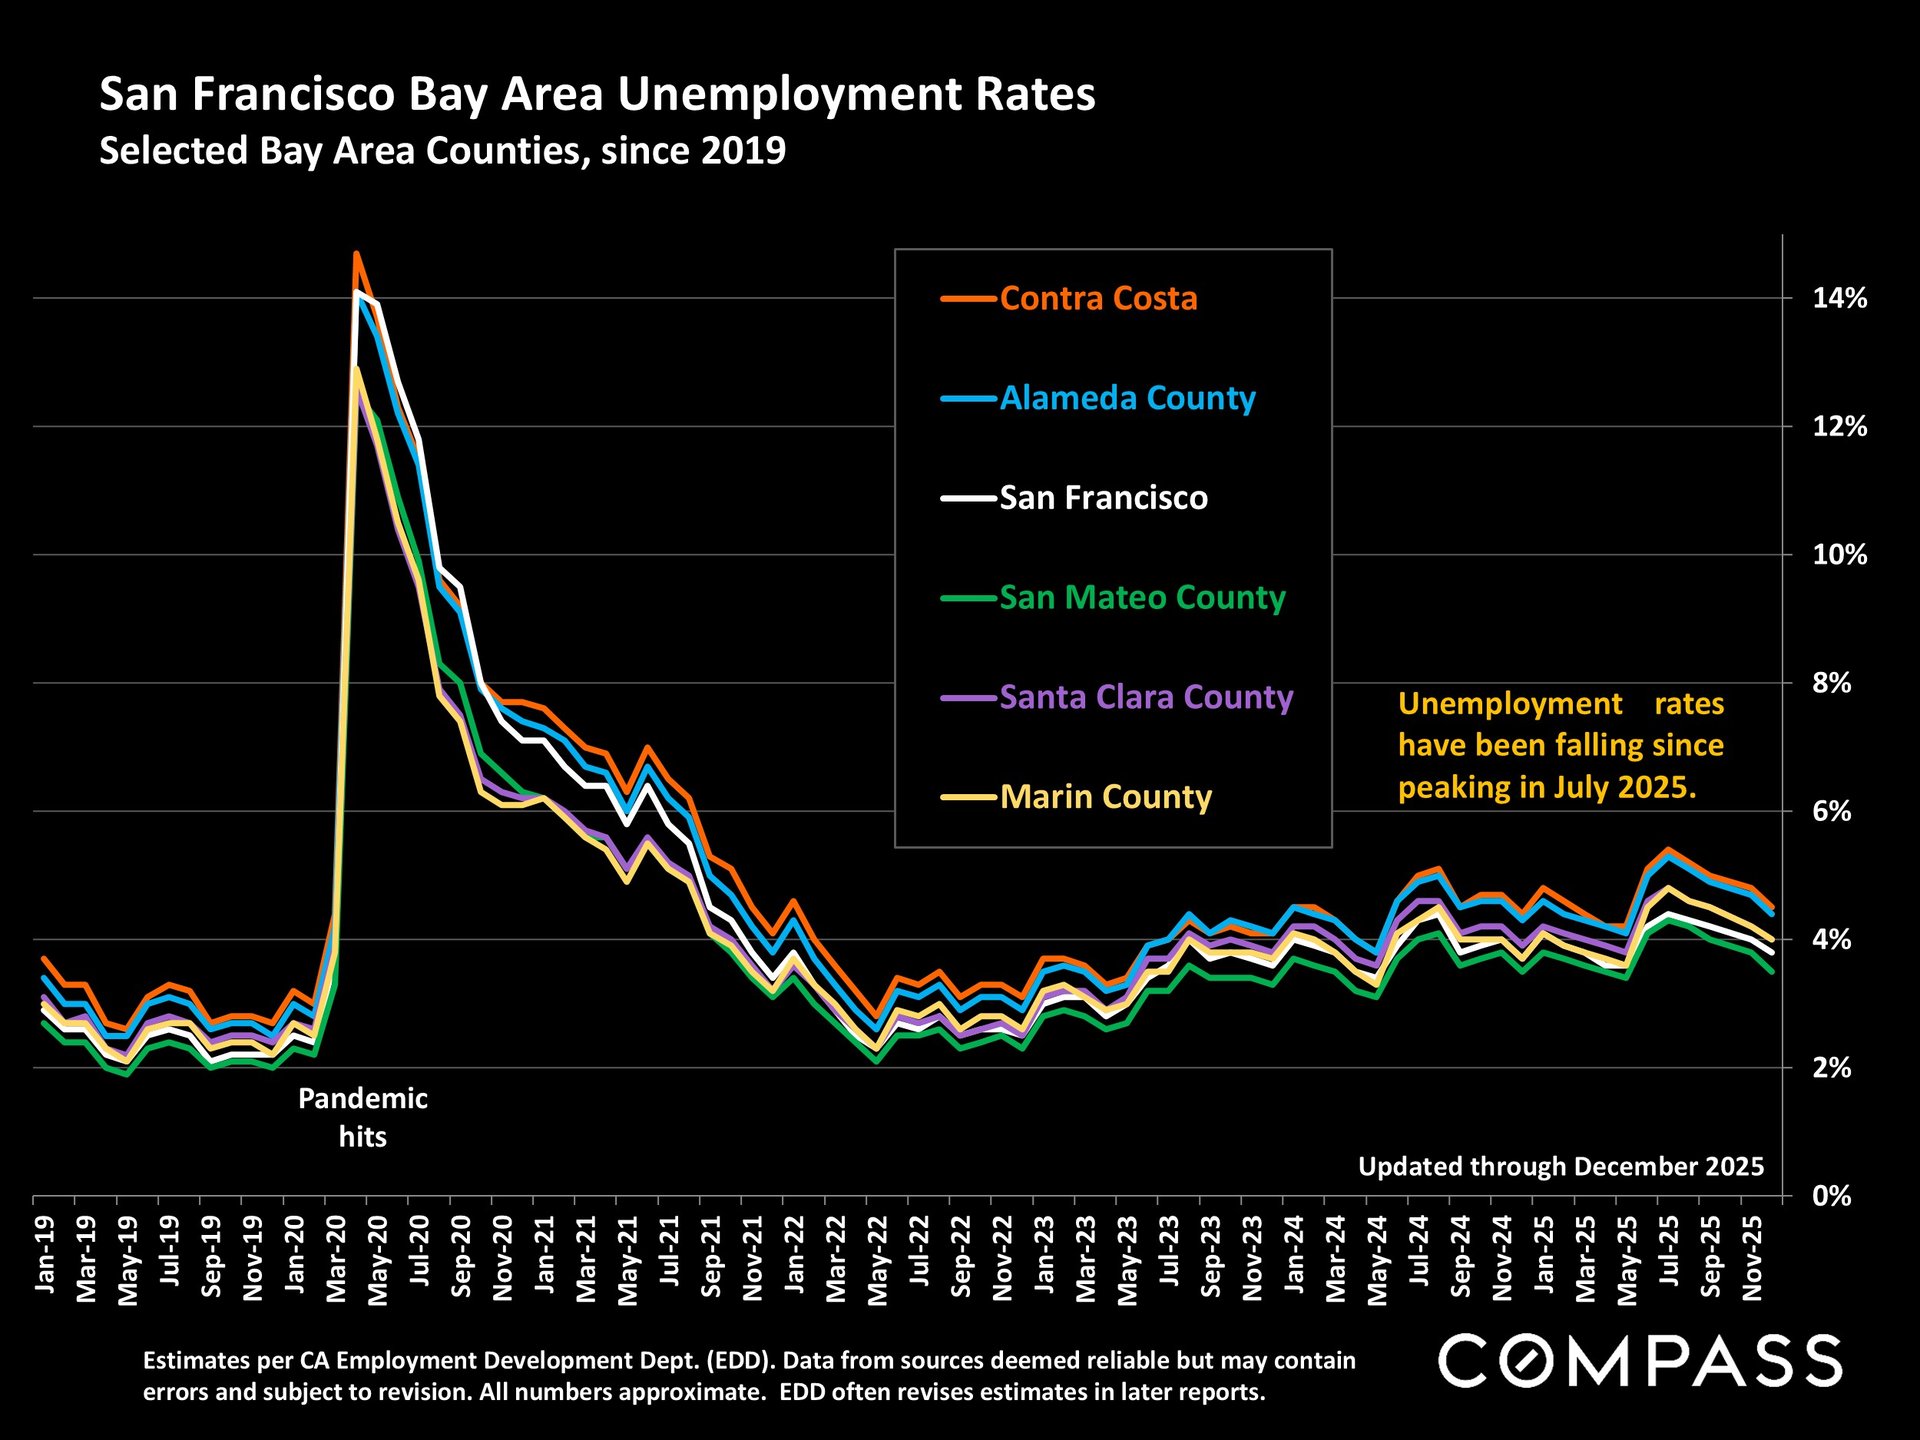
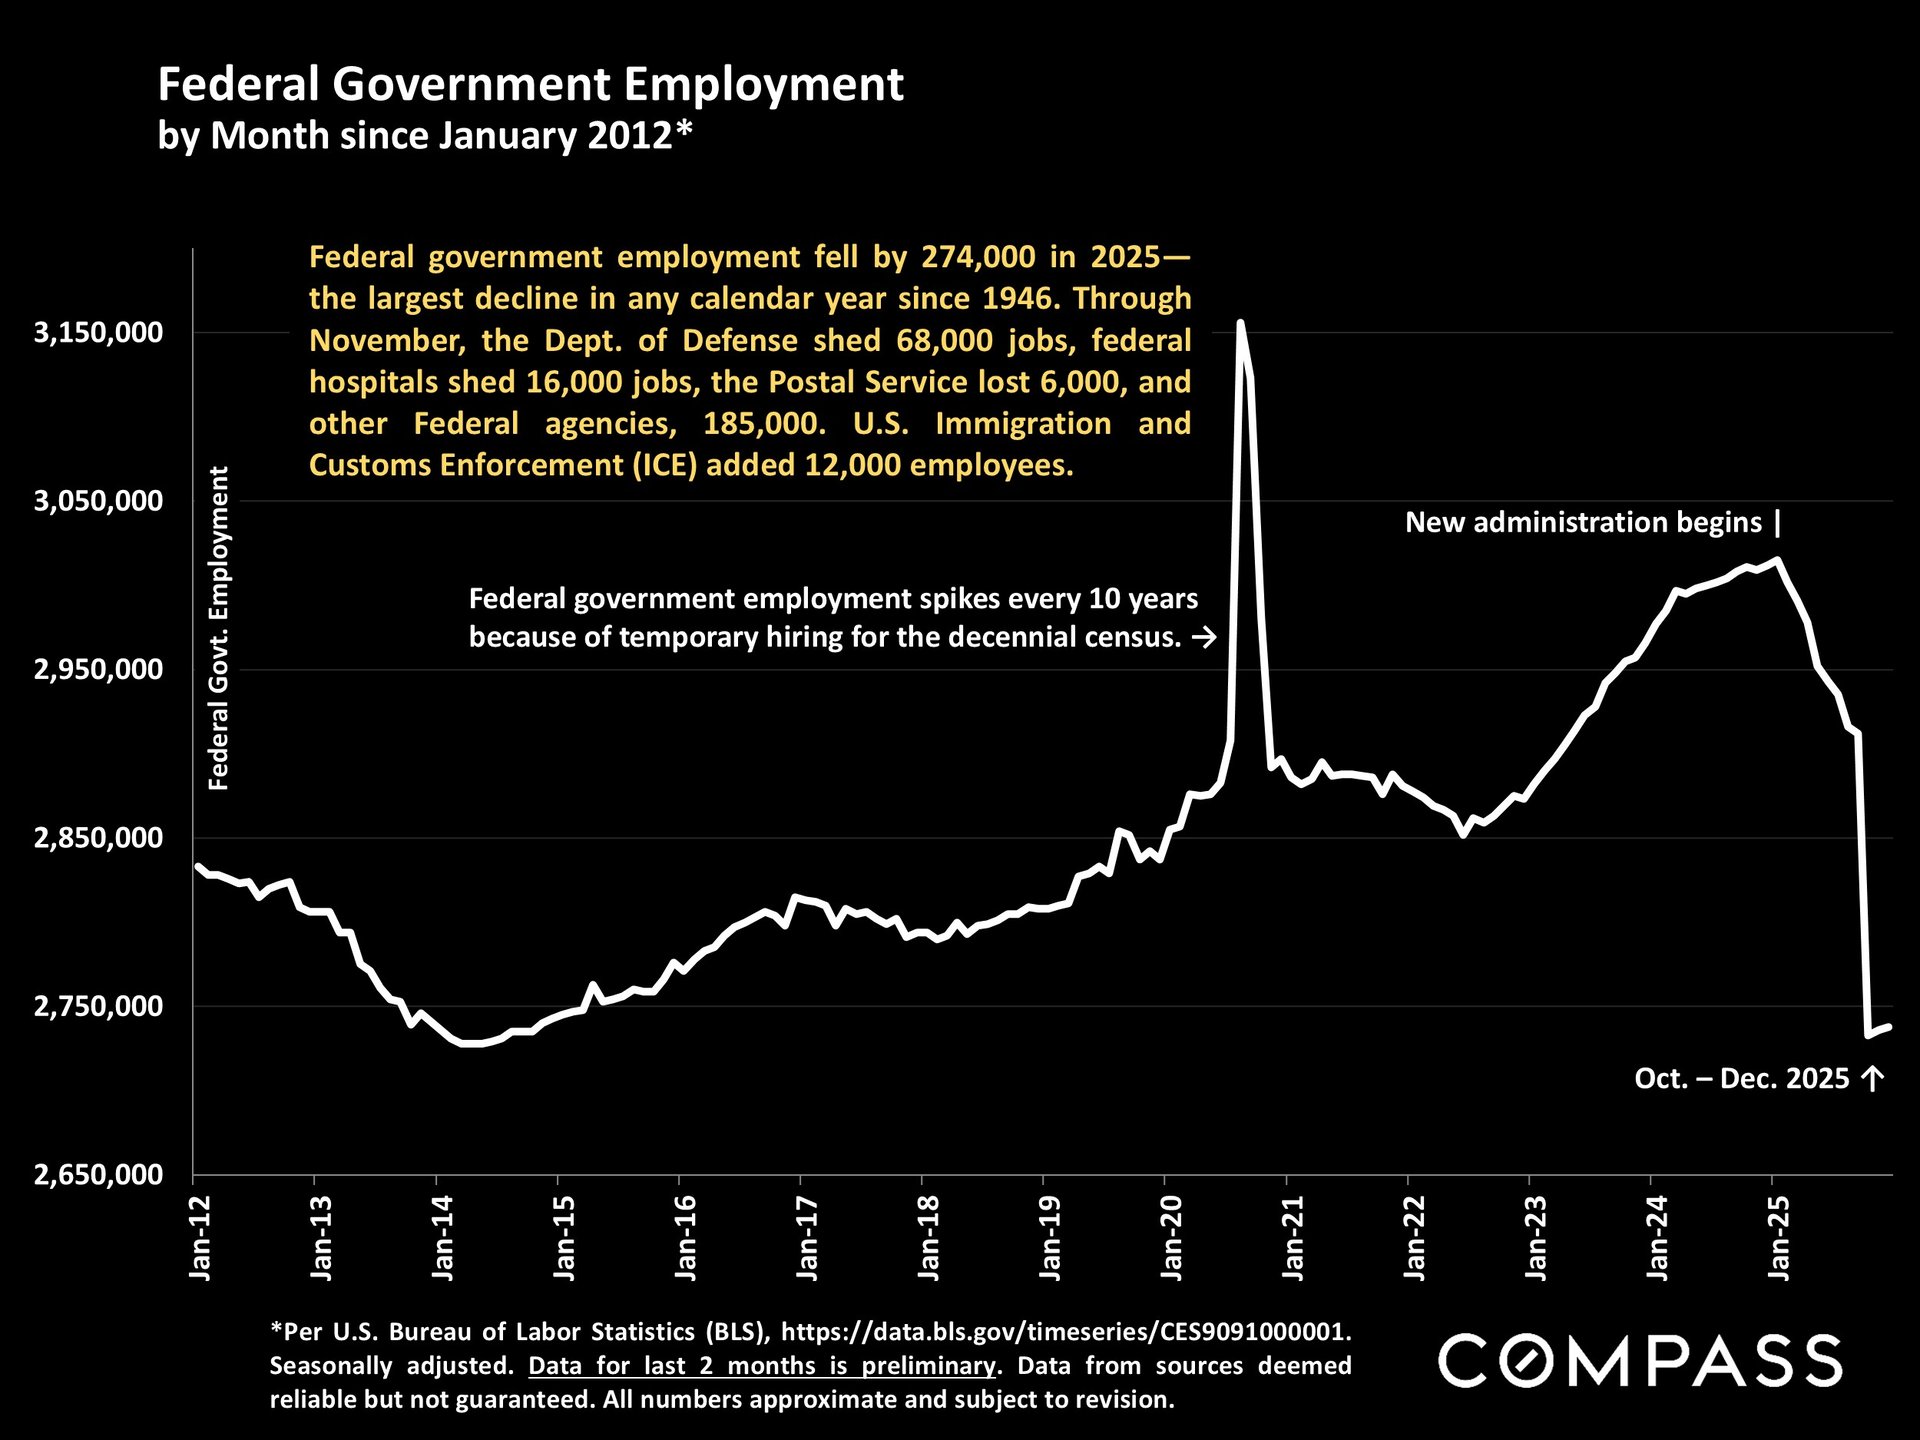
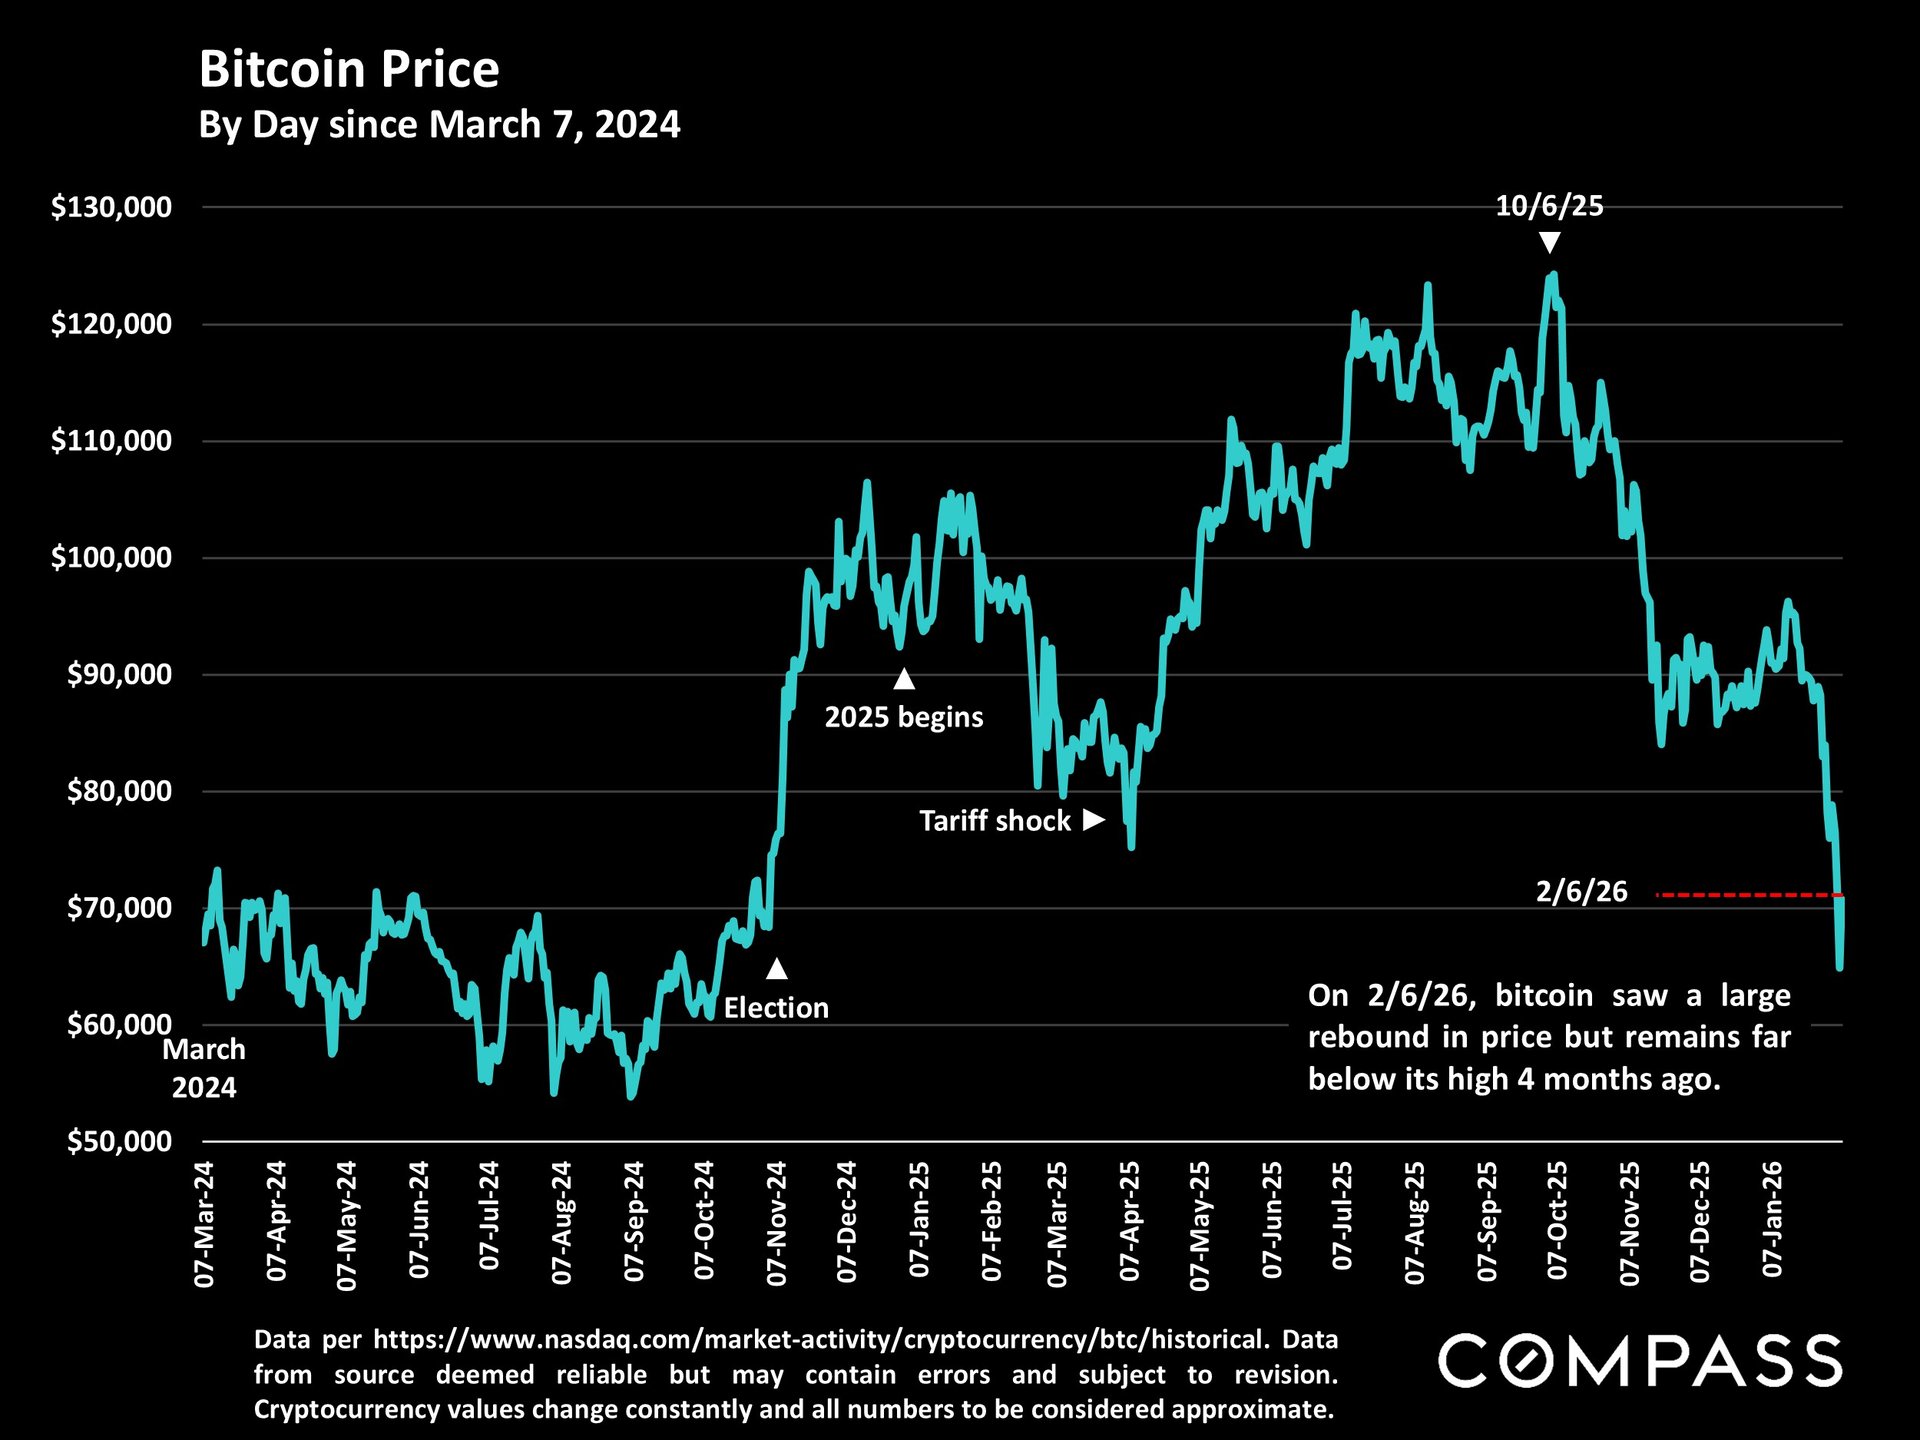
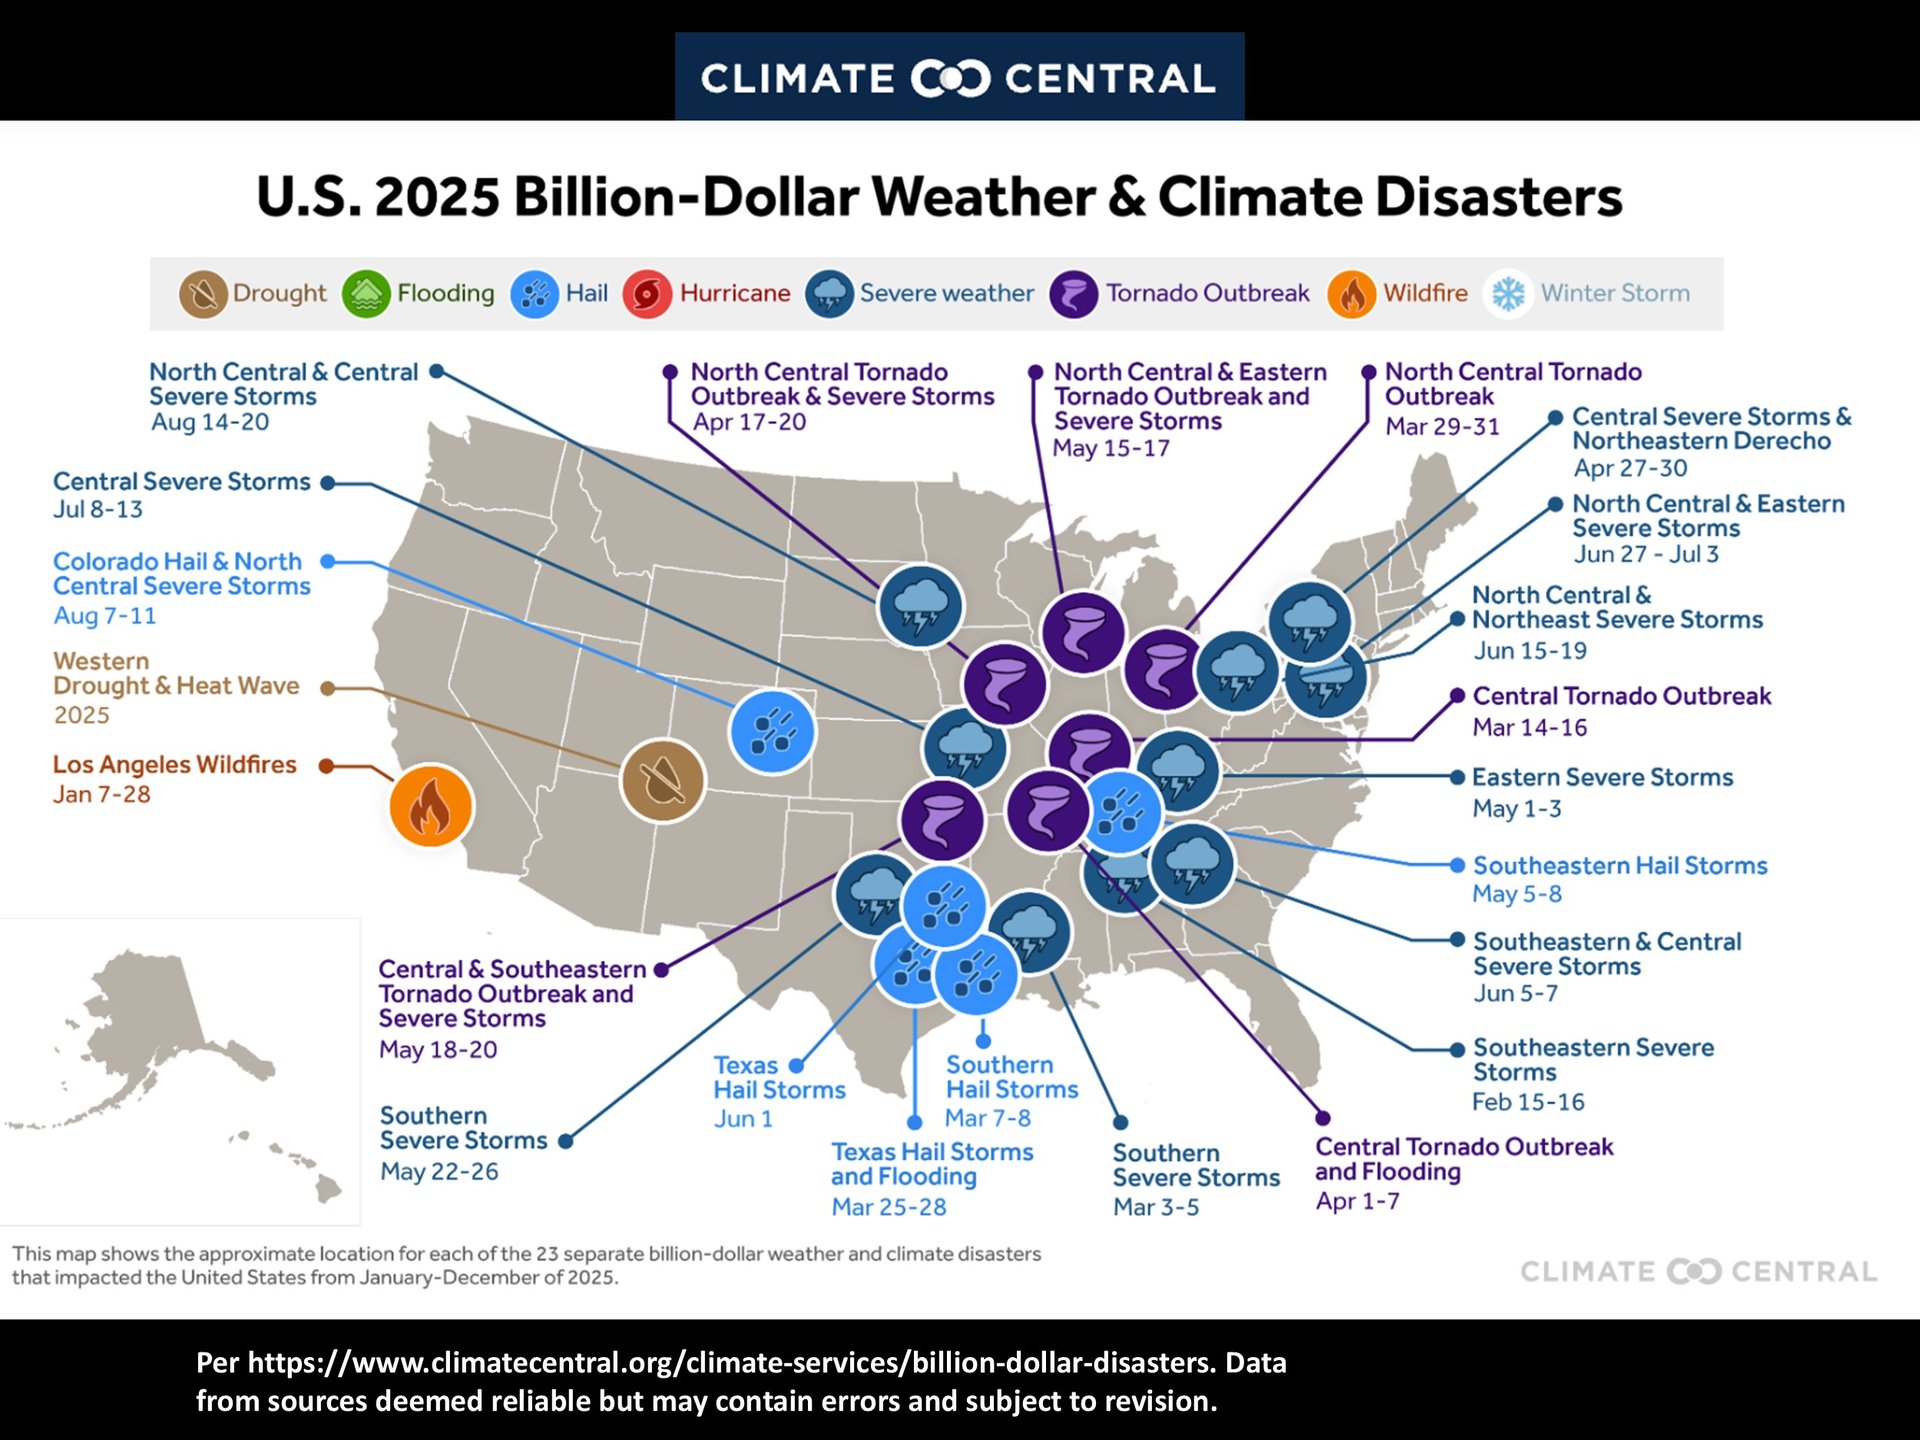
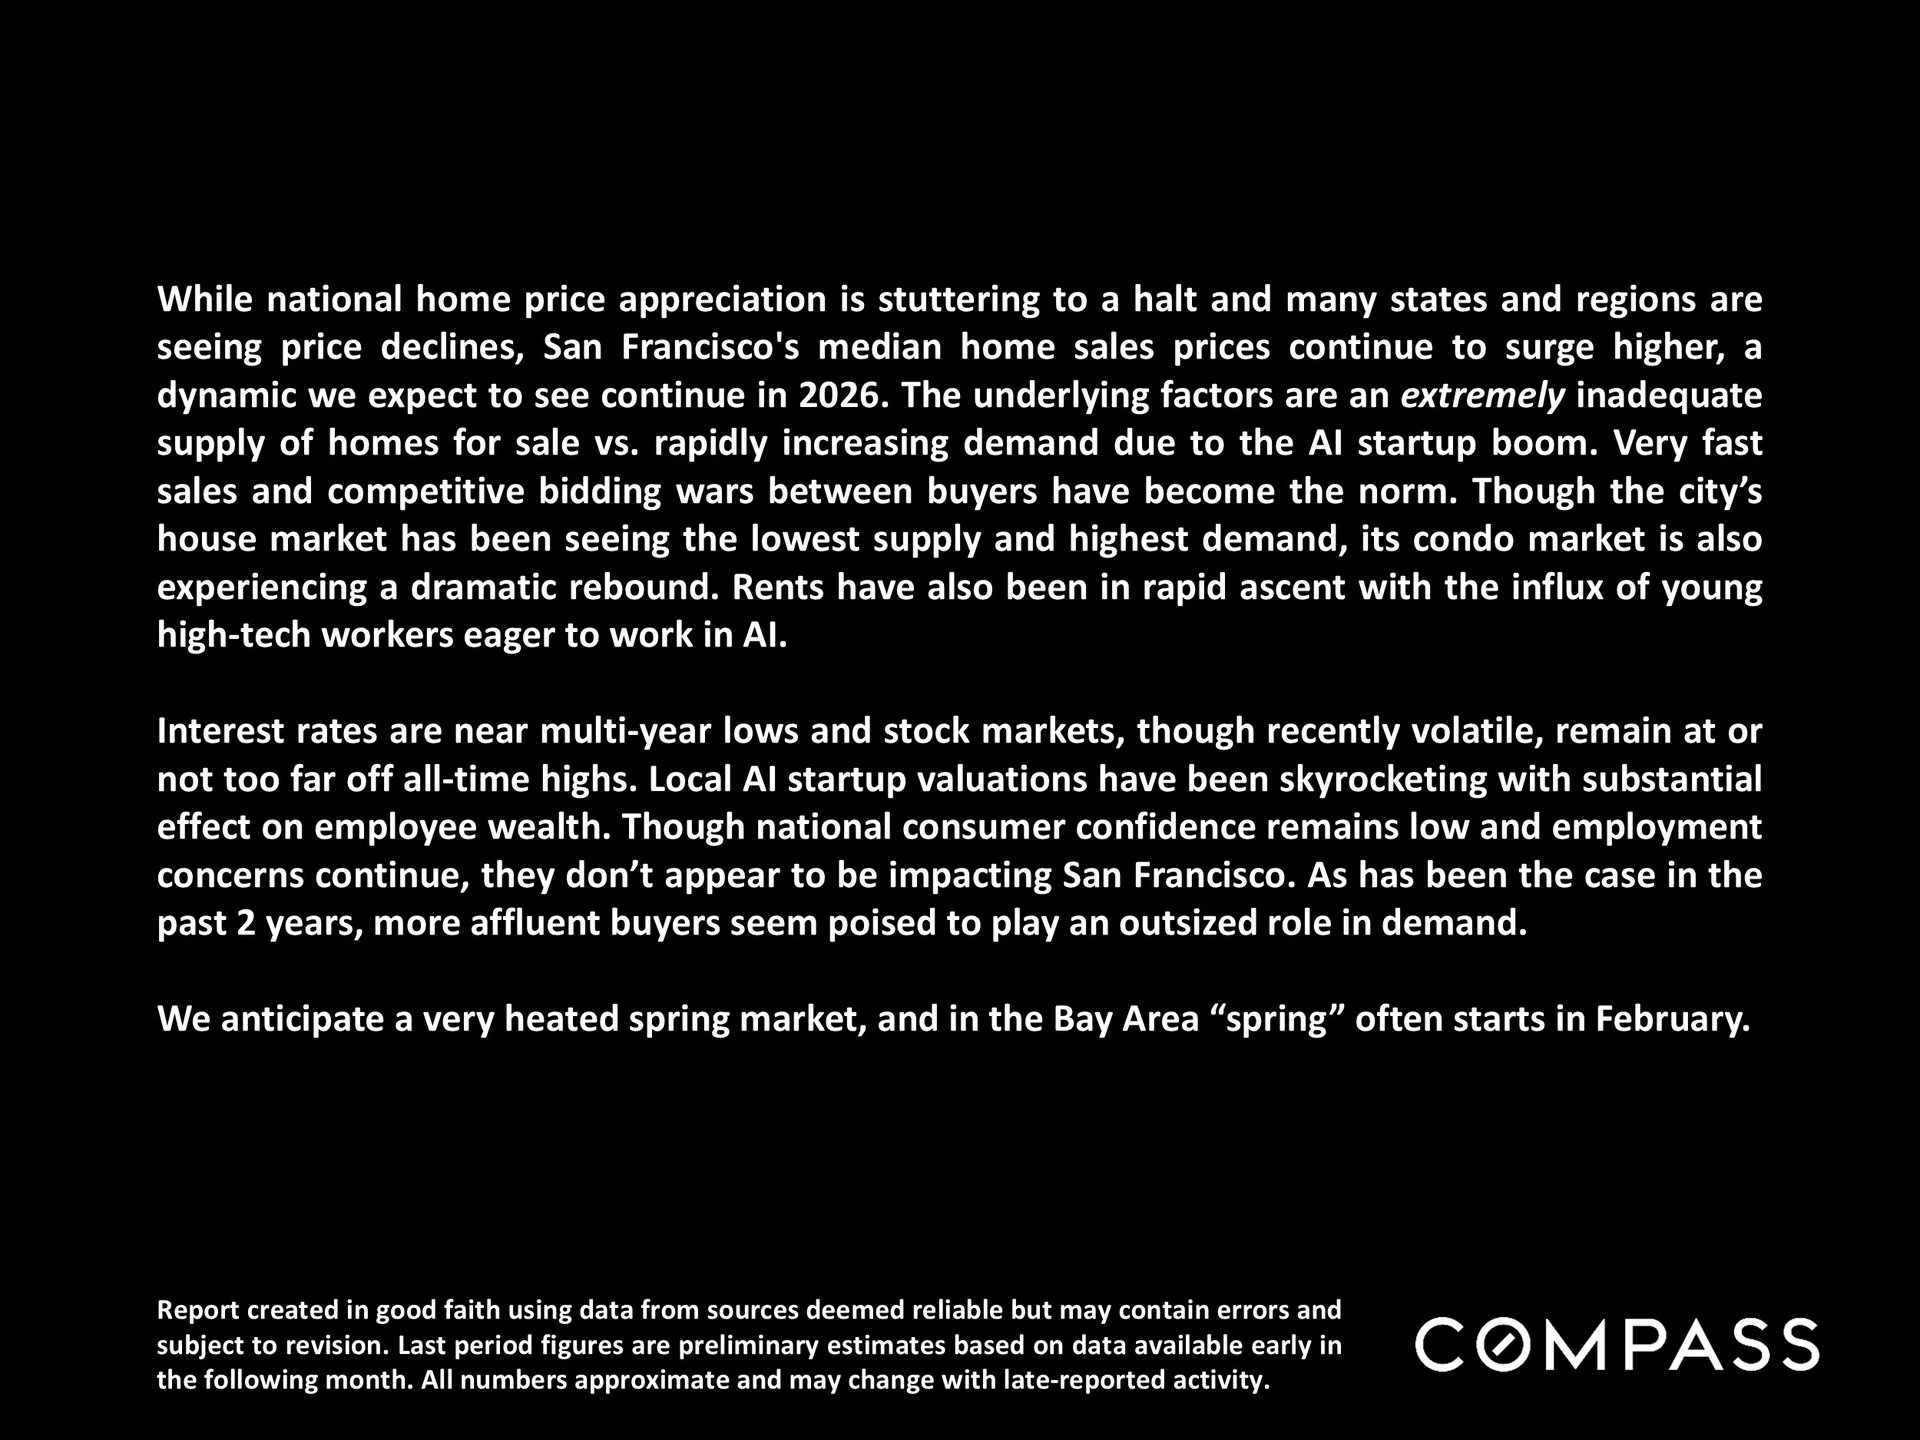
Chart of weekly 30-year mortgage rates from 2023 to 2026, showing rates near 6.1% in February 2026.Chart comparing Nasdaq and S&P 500 percentage changes from January 2025 through February 6, 2026.Chart comparing 2025 venture capital raised by city; the San Francisco Bay Area leads at approximately $154 billion.Chart of San Francisco median house prices from 1990 to 2026, with January 2026 price at $1.7 million.San Francisco home price appreciation chart, with blue bars showing gains from 5% since 2024 to 309% since 1999.Chart tracking San Francisco two-bedroom condo prices from 2005 to January 2026, with the latest median at $1.3 million.Chart of San Francisco condo price appreciation, from 1% since 2024 to 186% since 1999.Chart of San Francisco house and condo values since 2005, with condo bars, a house-value line, and recession and pandemic annotations.Chart comparing median two-bedroom condo prices in downtown and non-downtown San Francisco through January 2026.Chart of San Francisco monthly new listings, January 2021–January 2026, showing seasonal peaks in September and lows in December.Bar chart of San Francisco active and coming-soon listings, showing 651 listings on February 1, 2026, down 27% year over year.Bar chart of Bay Area houses for sale by county; San Francisco is highlighted in red with 185 listings.San Francisco February 2026 housing market table comparing price segments and property types.Chart of San Francisco listings accepting offers, showing seasonal peaks and December dips from 2021 to January 2026.San Francisco monthly absorption-rate bar chart, with green bars through January 2026 and a sharp rise in fall 2025.San Francisco monthly home sales bar chart from January 2021 to January 2026, with pandemic and seasonal annotations.Chart of monthly San Francisco home sales priced at $5 million or more, January 2020–January 2026.Chart of San Francisco listing price reductions, January 2020–January 2026, with seasonal October peaks and a 33% annual decline.San Francisco home sales over list price, charted monthly from 2020 through January 2026.Chart of San Francisco sale prices versus original list prices, updated through January 2026.Chart of San Francisco days on market from 2021 to January 2026, with seasonal peaks and springtime lows.Selected Economic & Demographic DataChart of federal funds rates since 1981, with annotations about economic events and Federal Reserve interventions.Economic policy uncertainty chart from 2000 to 2026, with sharp spikes during the pandemic and April 2025 tariff shock.Chart of California population estimates from 2010 to 2025, showing a dip around 2020 and growth by 2025.California population-change infographic compares migration, natural increase, and total change across two periods.California 2024 migration infographic compares state in-migration and out-migration, with Texas highest in both.Line chart of Bay Area county unemployment rates, showing the 2020 pandemic spike and decline since July 2025.Federal government employment chart, with a census-related spike in 2020 and a sharp decline at the end of 2025.Bitcoin price chart from March 2024 to February 2026, showing an October 2025 peak and a sharp subsequent decline.Map of 23 U.S. billion-dollar weather and climate disasters in 2025, marked by hazard type and date.Real estate report notes explaining statistics, sales prices, square-foot calculations, and disclaimers.San Francisco real estate report highlights rising prices, tight housing supply, and expectations for a heated spring market.

Work With Us

We will help you understand the complex aspects of the transaction and share our expertise so that you can make the best decisions possible. We are experienced, market savvy, and energetic. With both of us working for our clients, you get twice the amount of attention and insight.