
The SF Team, Eva + James, Compass

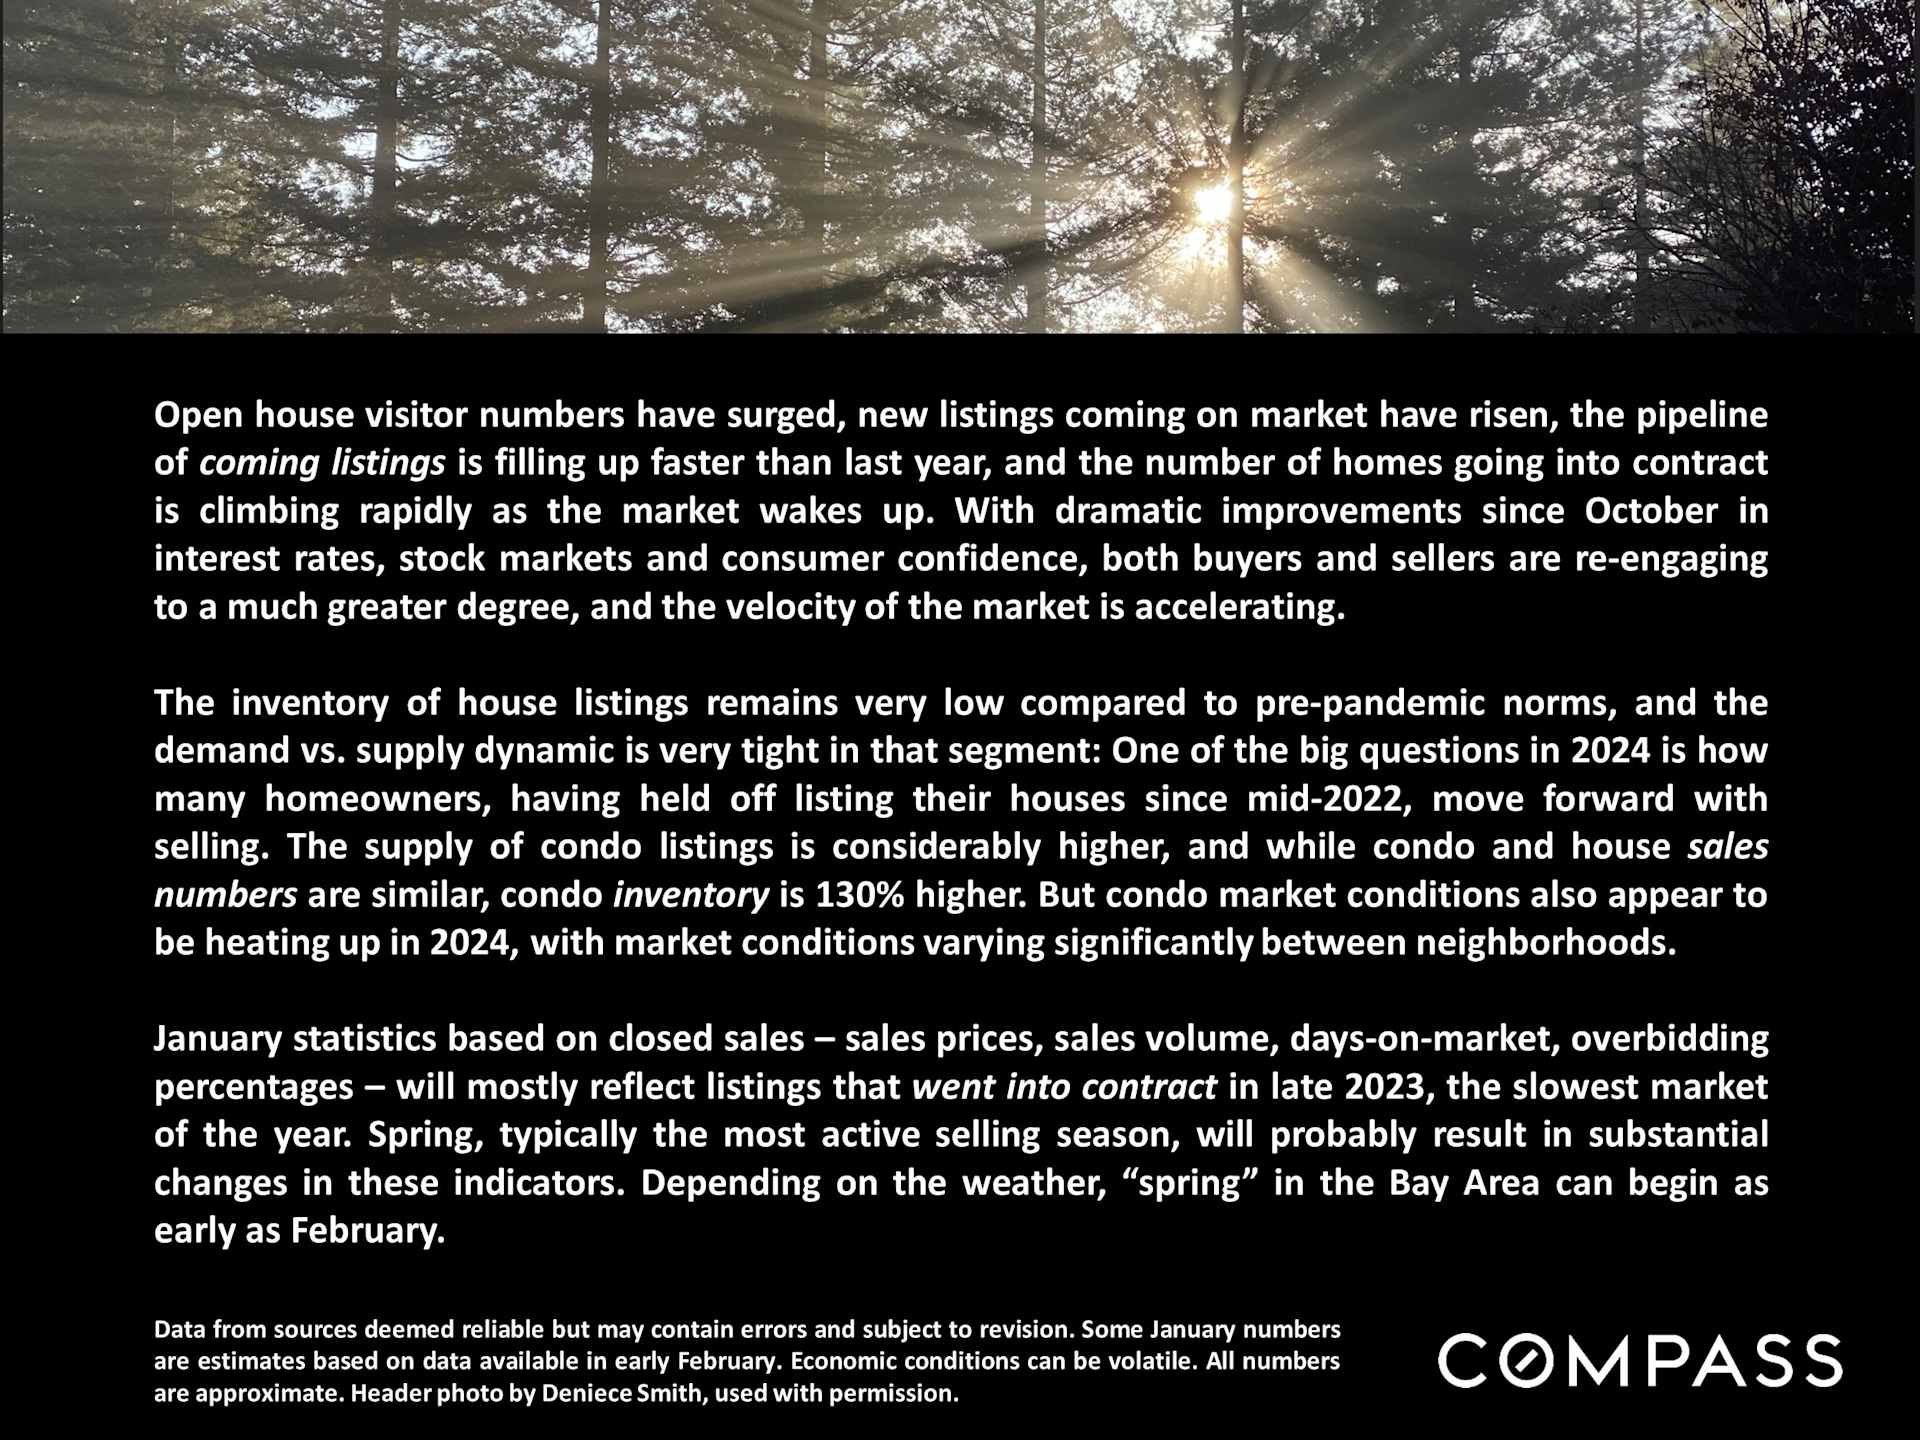
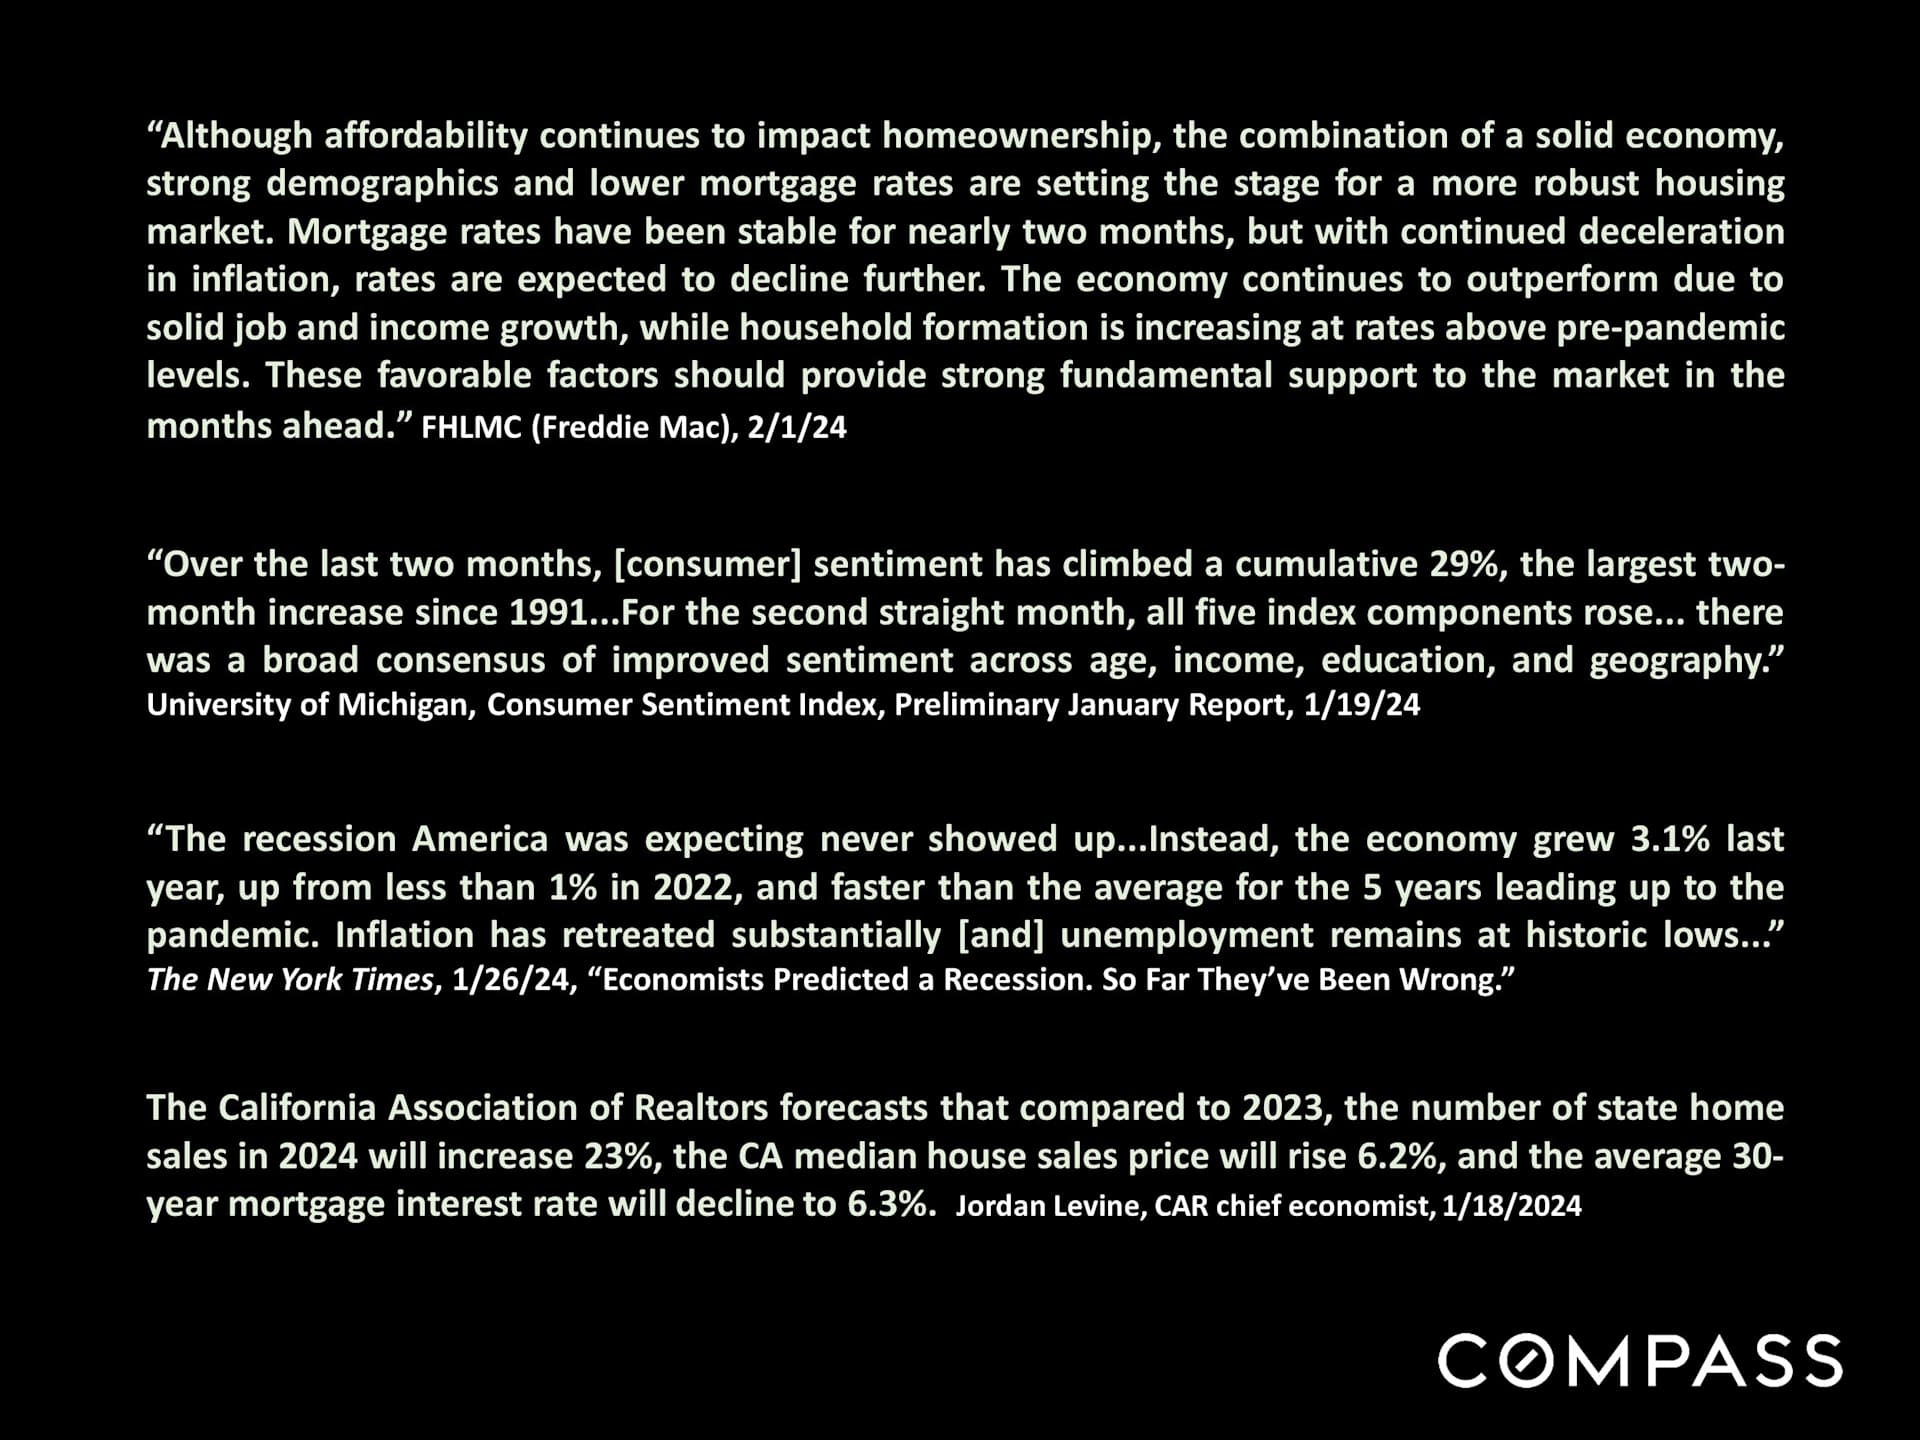
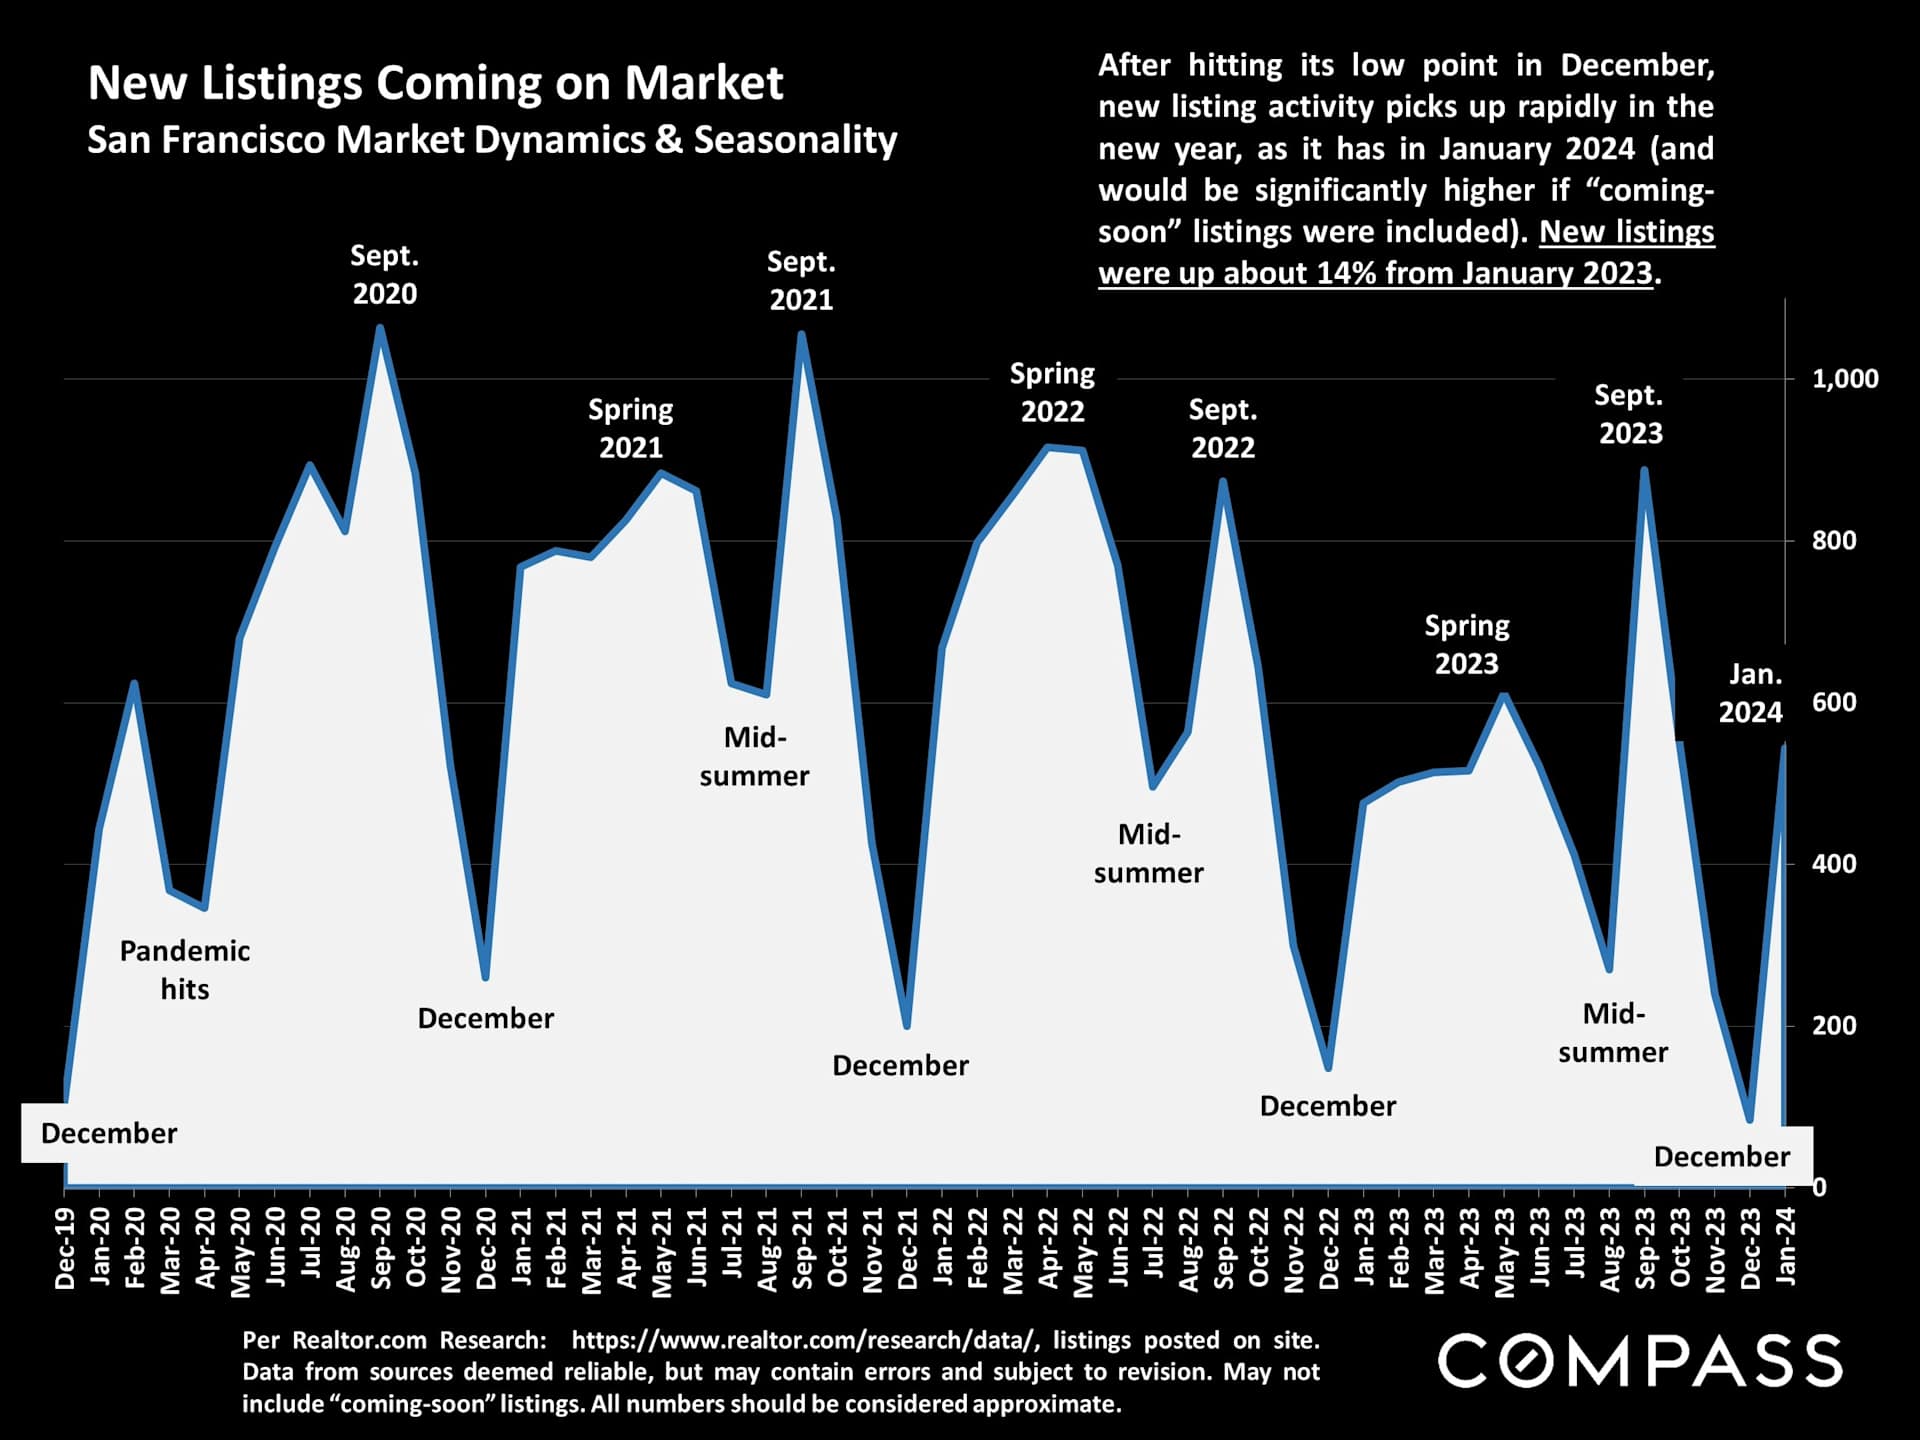
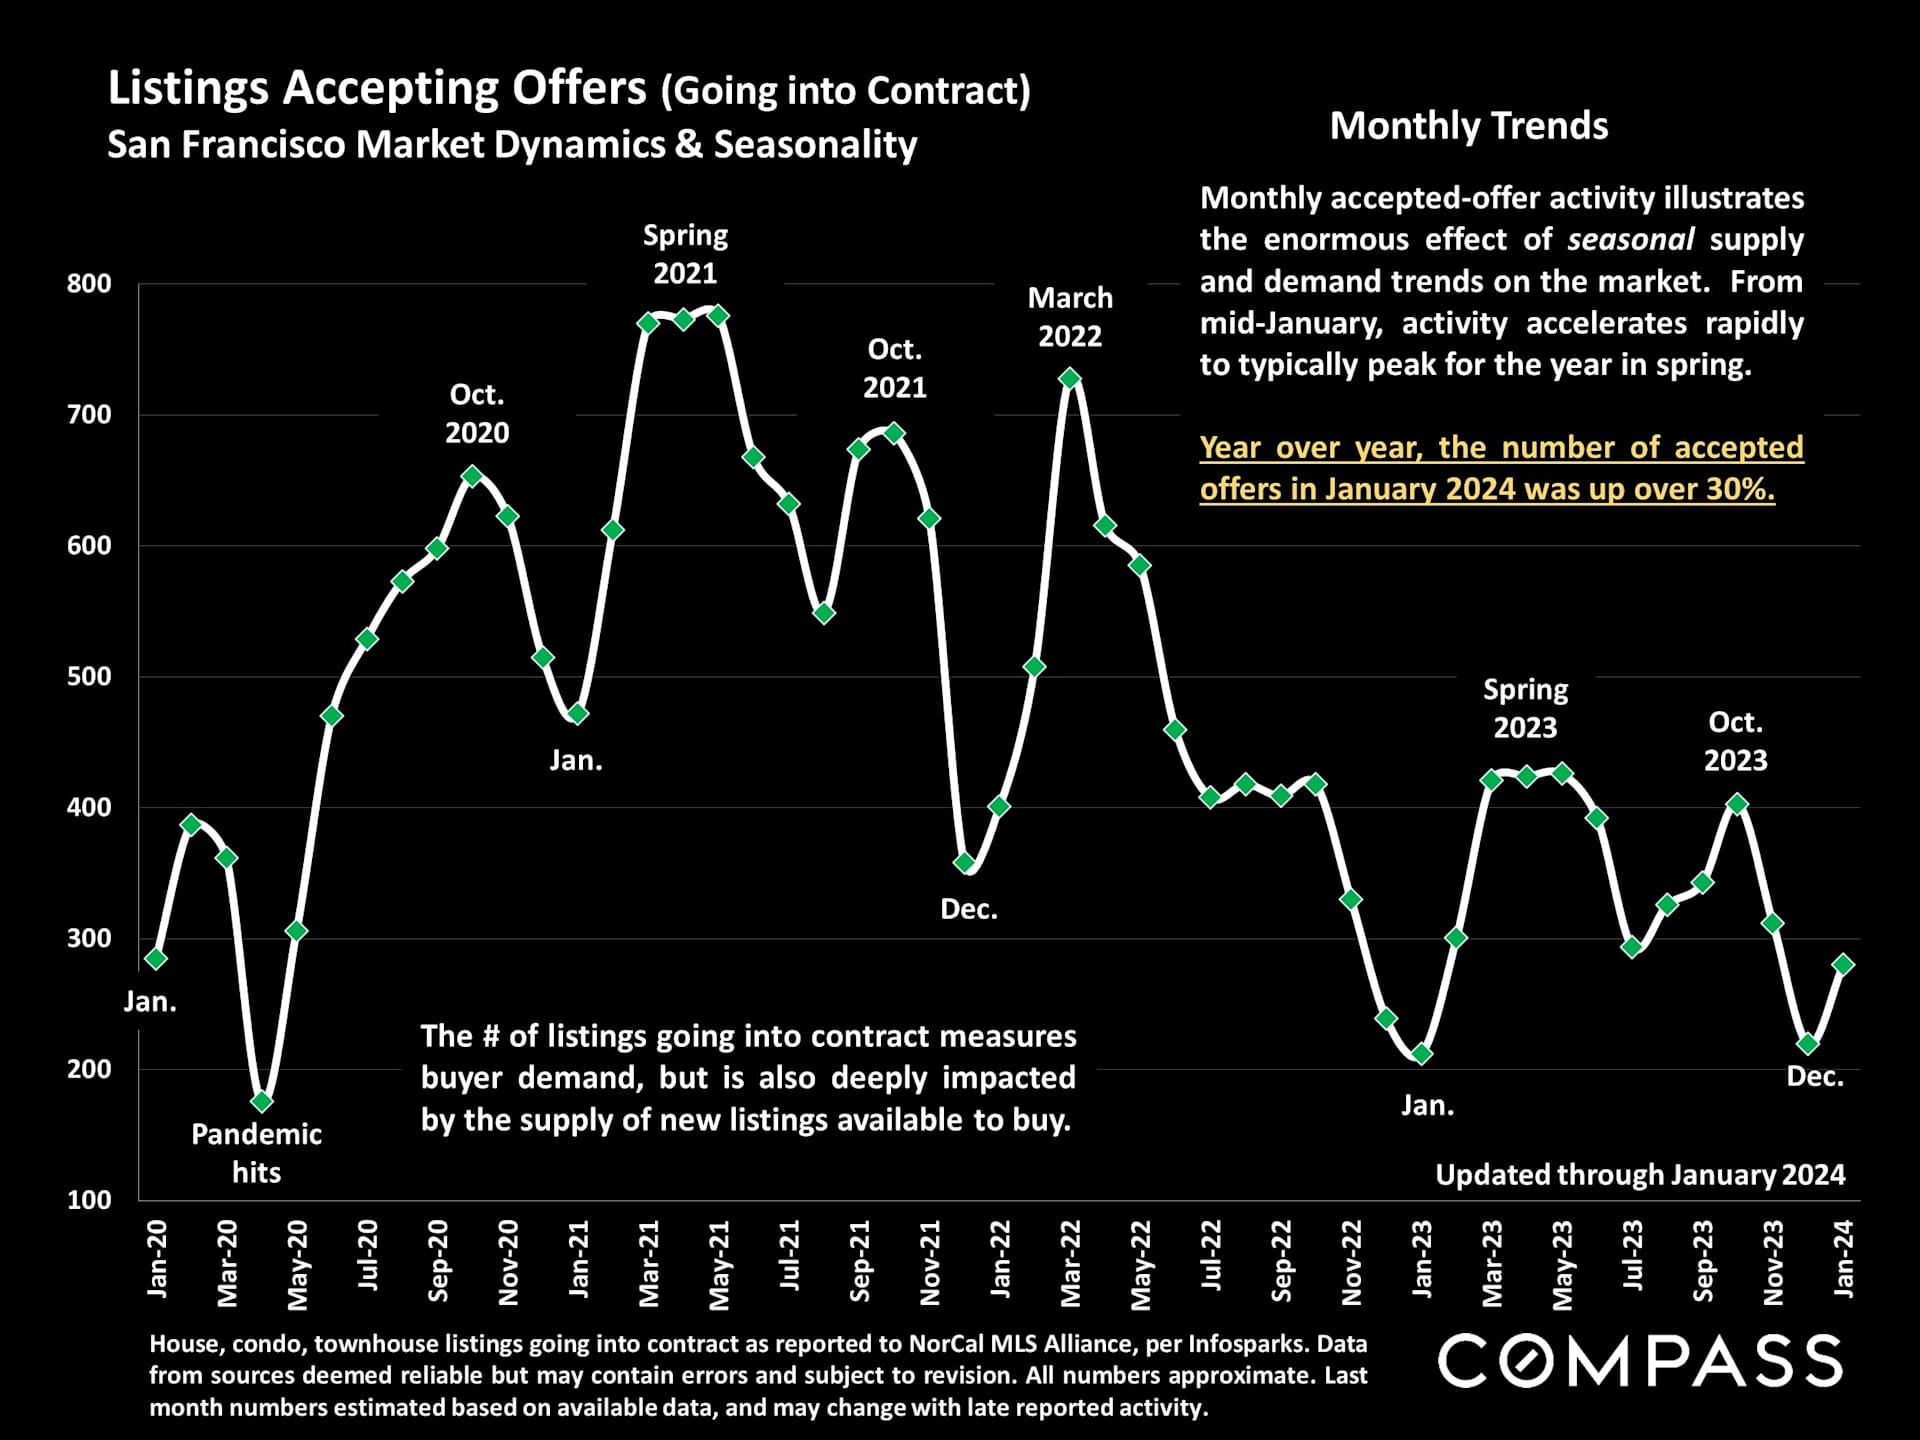
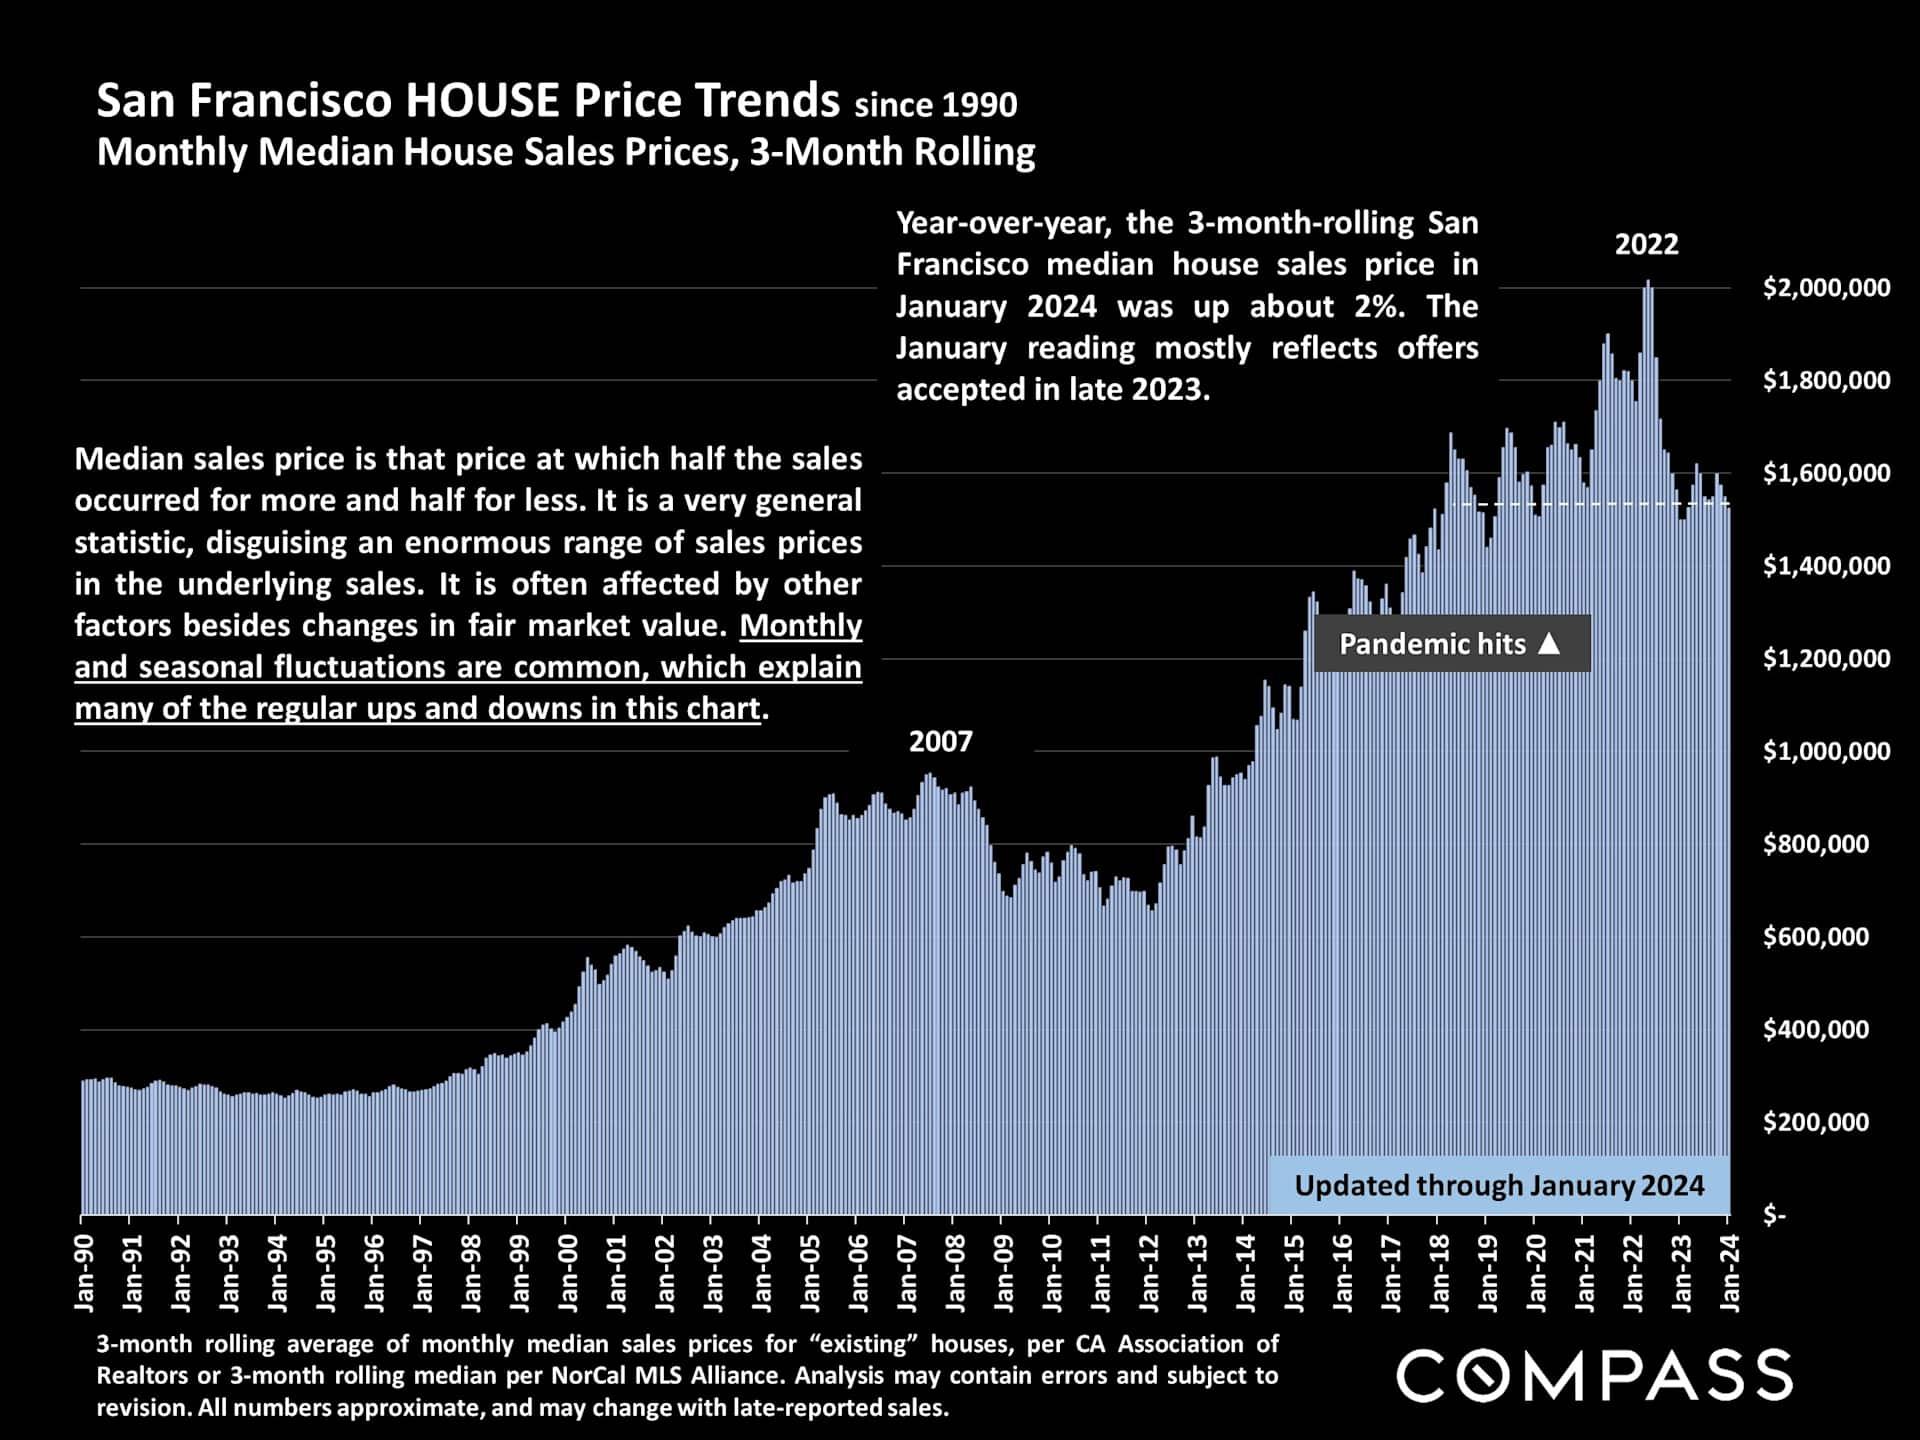
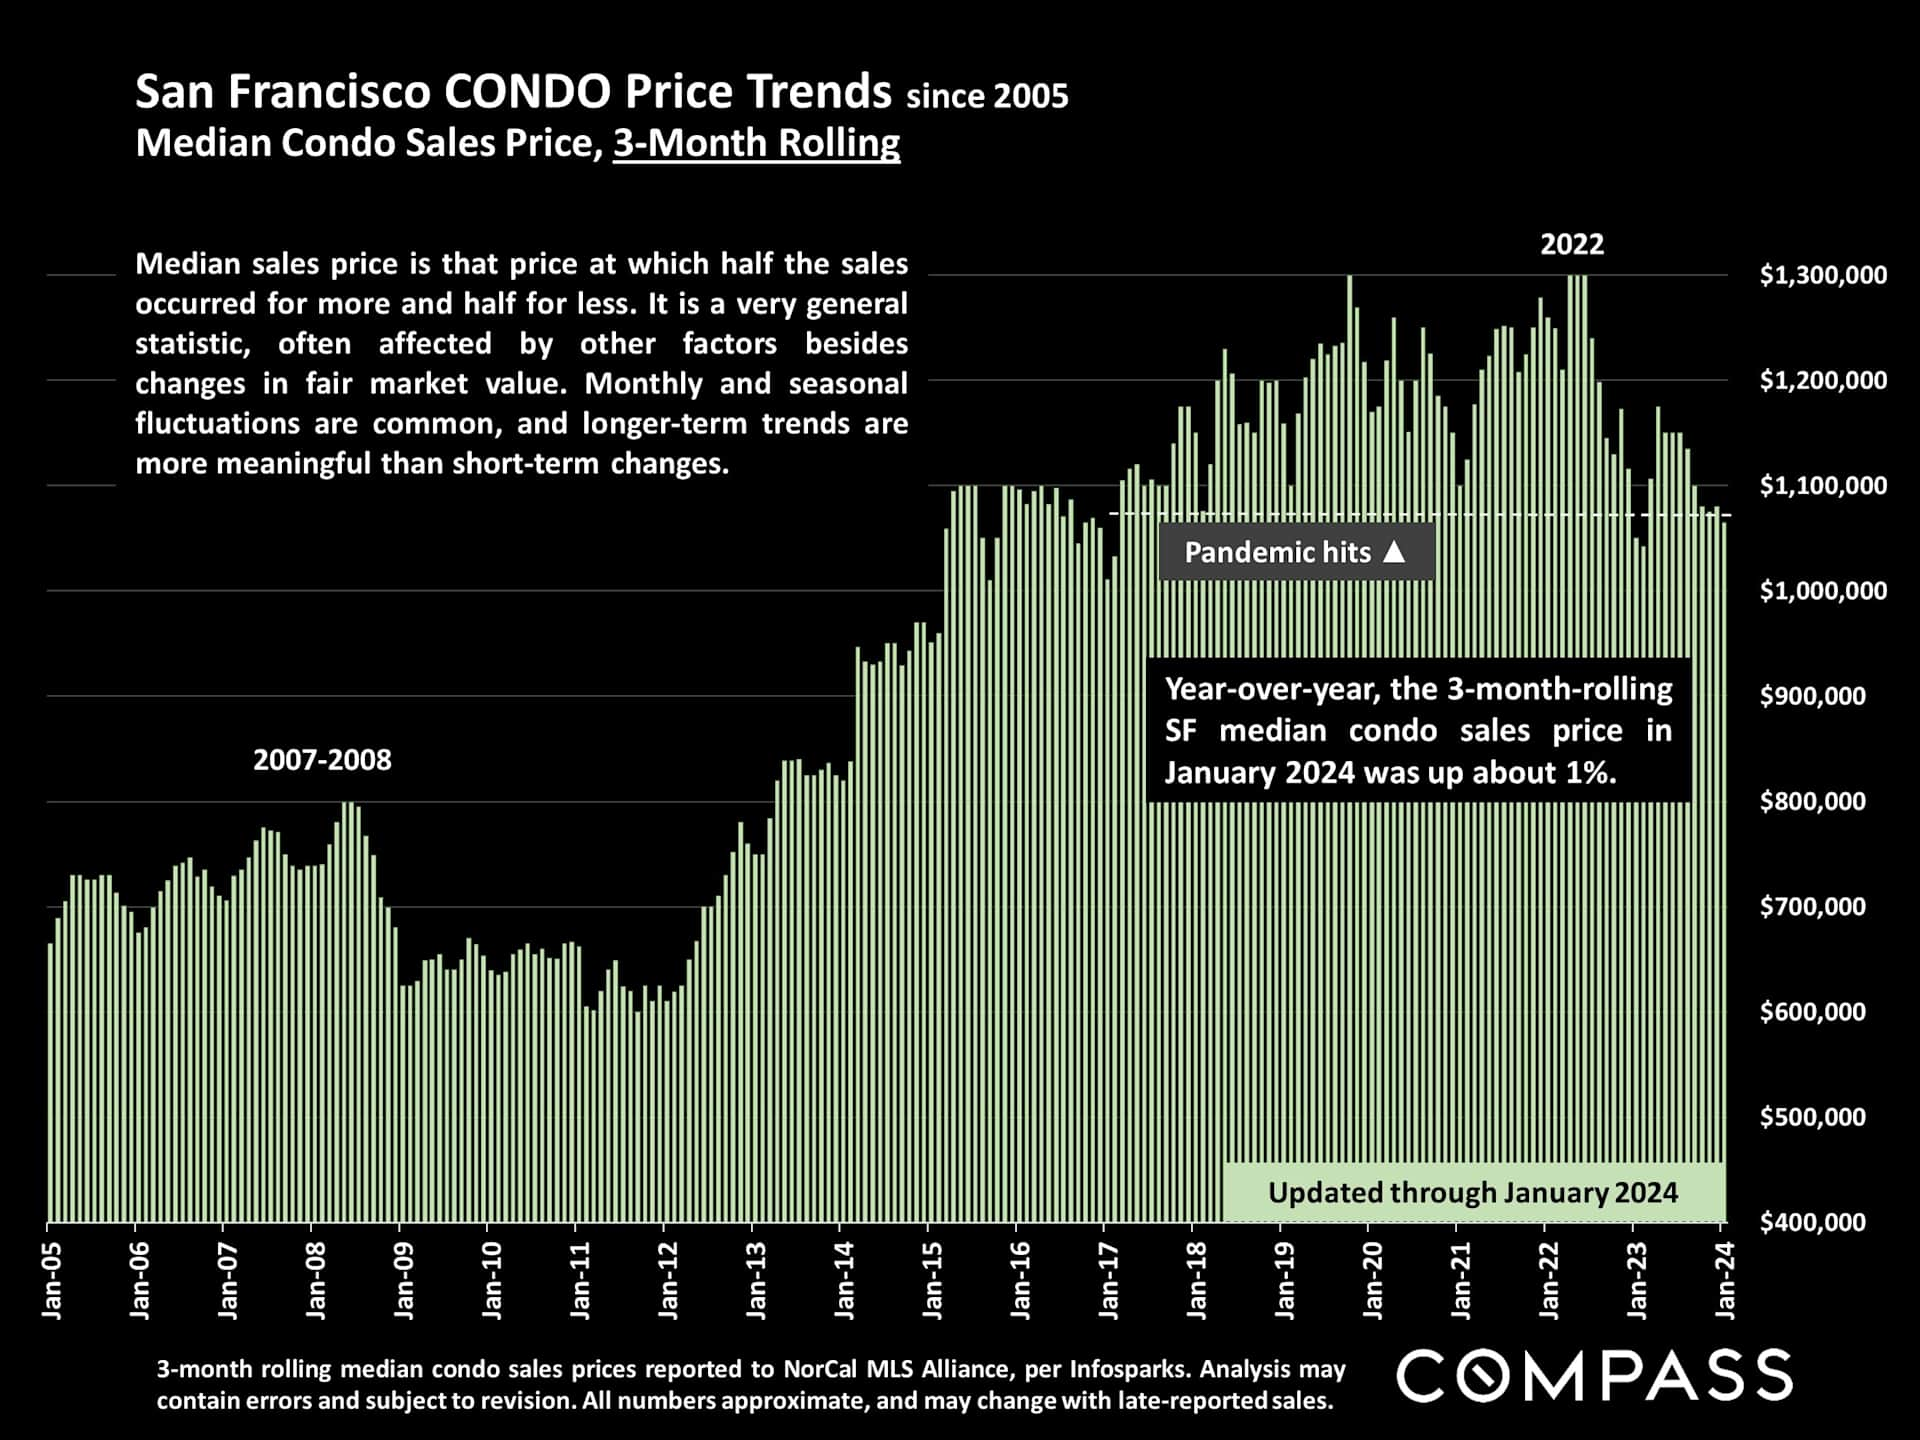
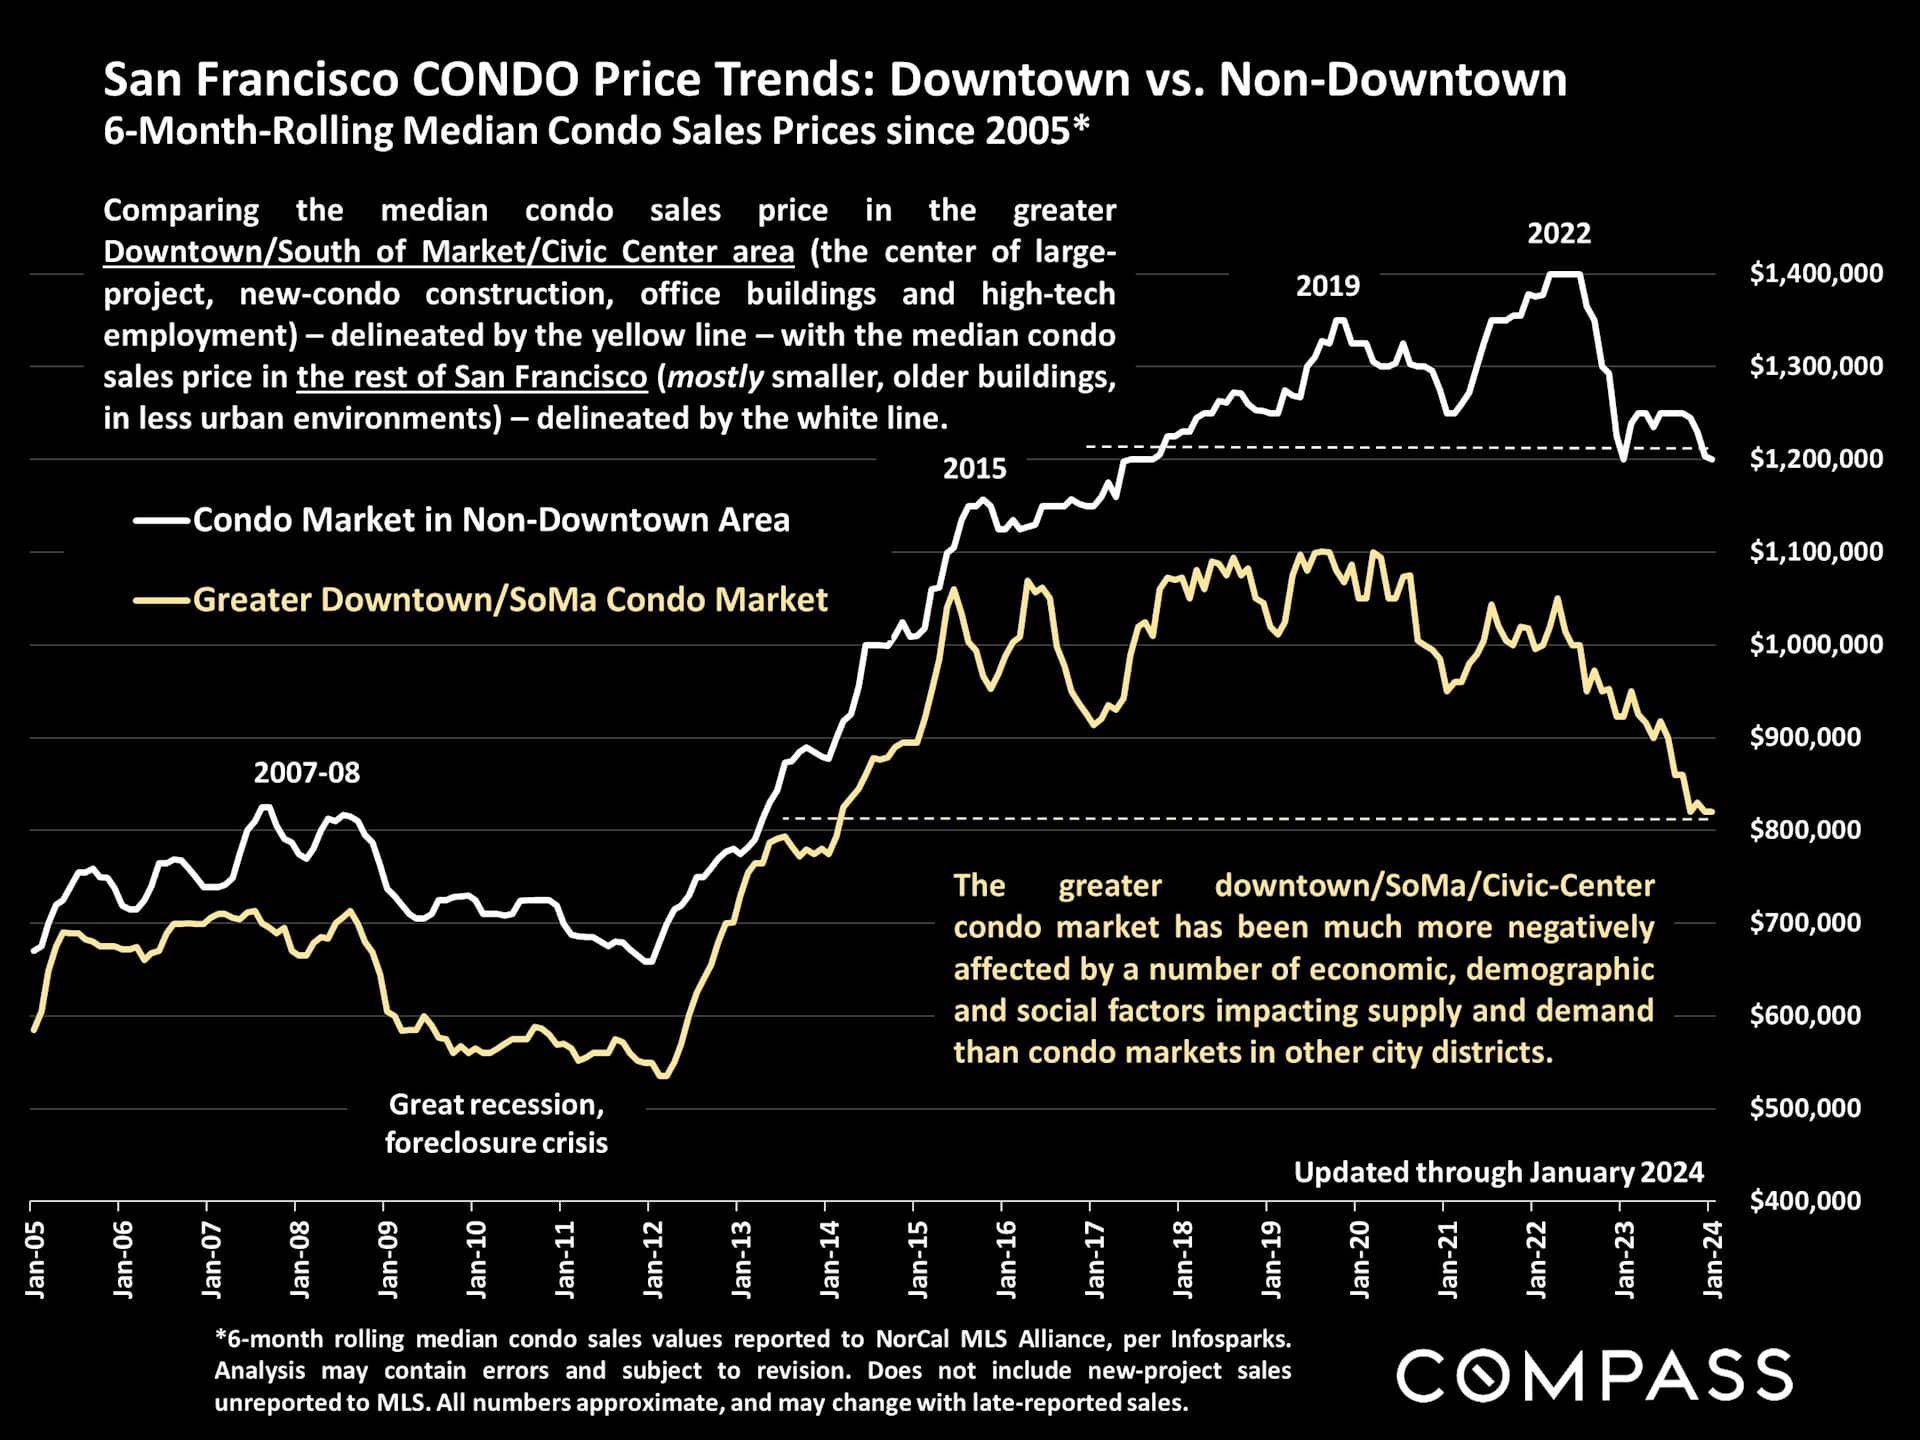
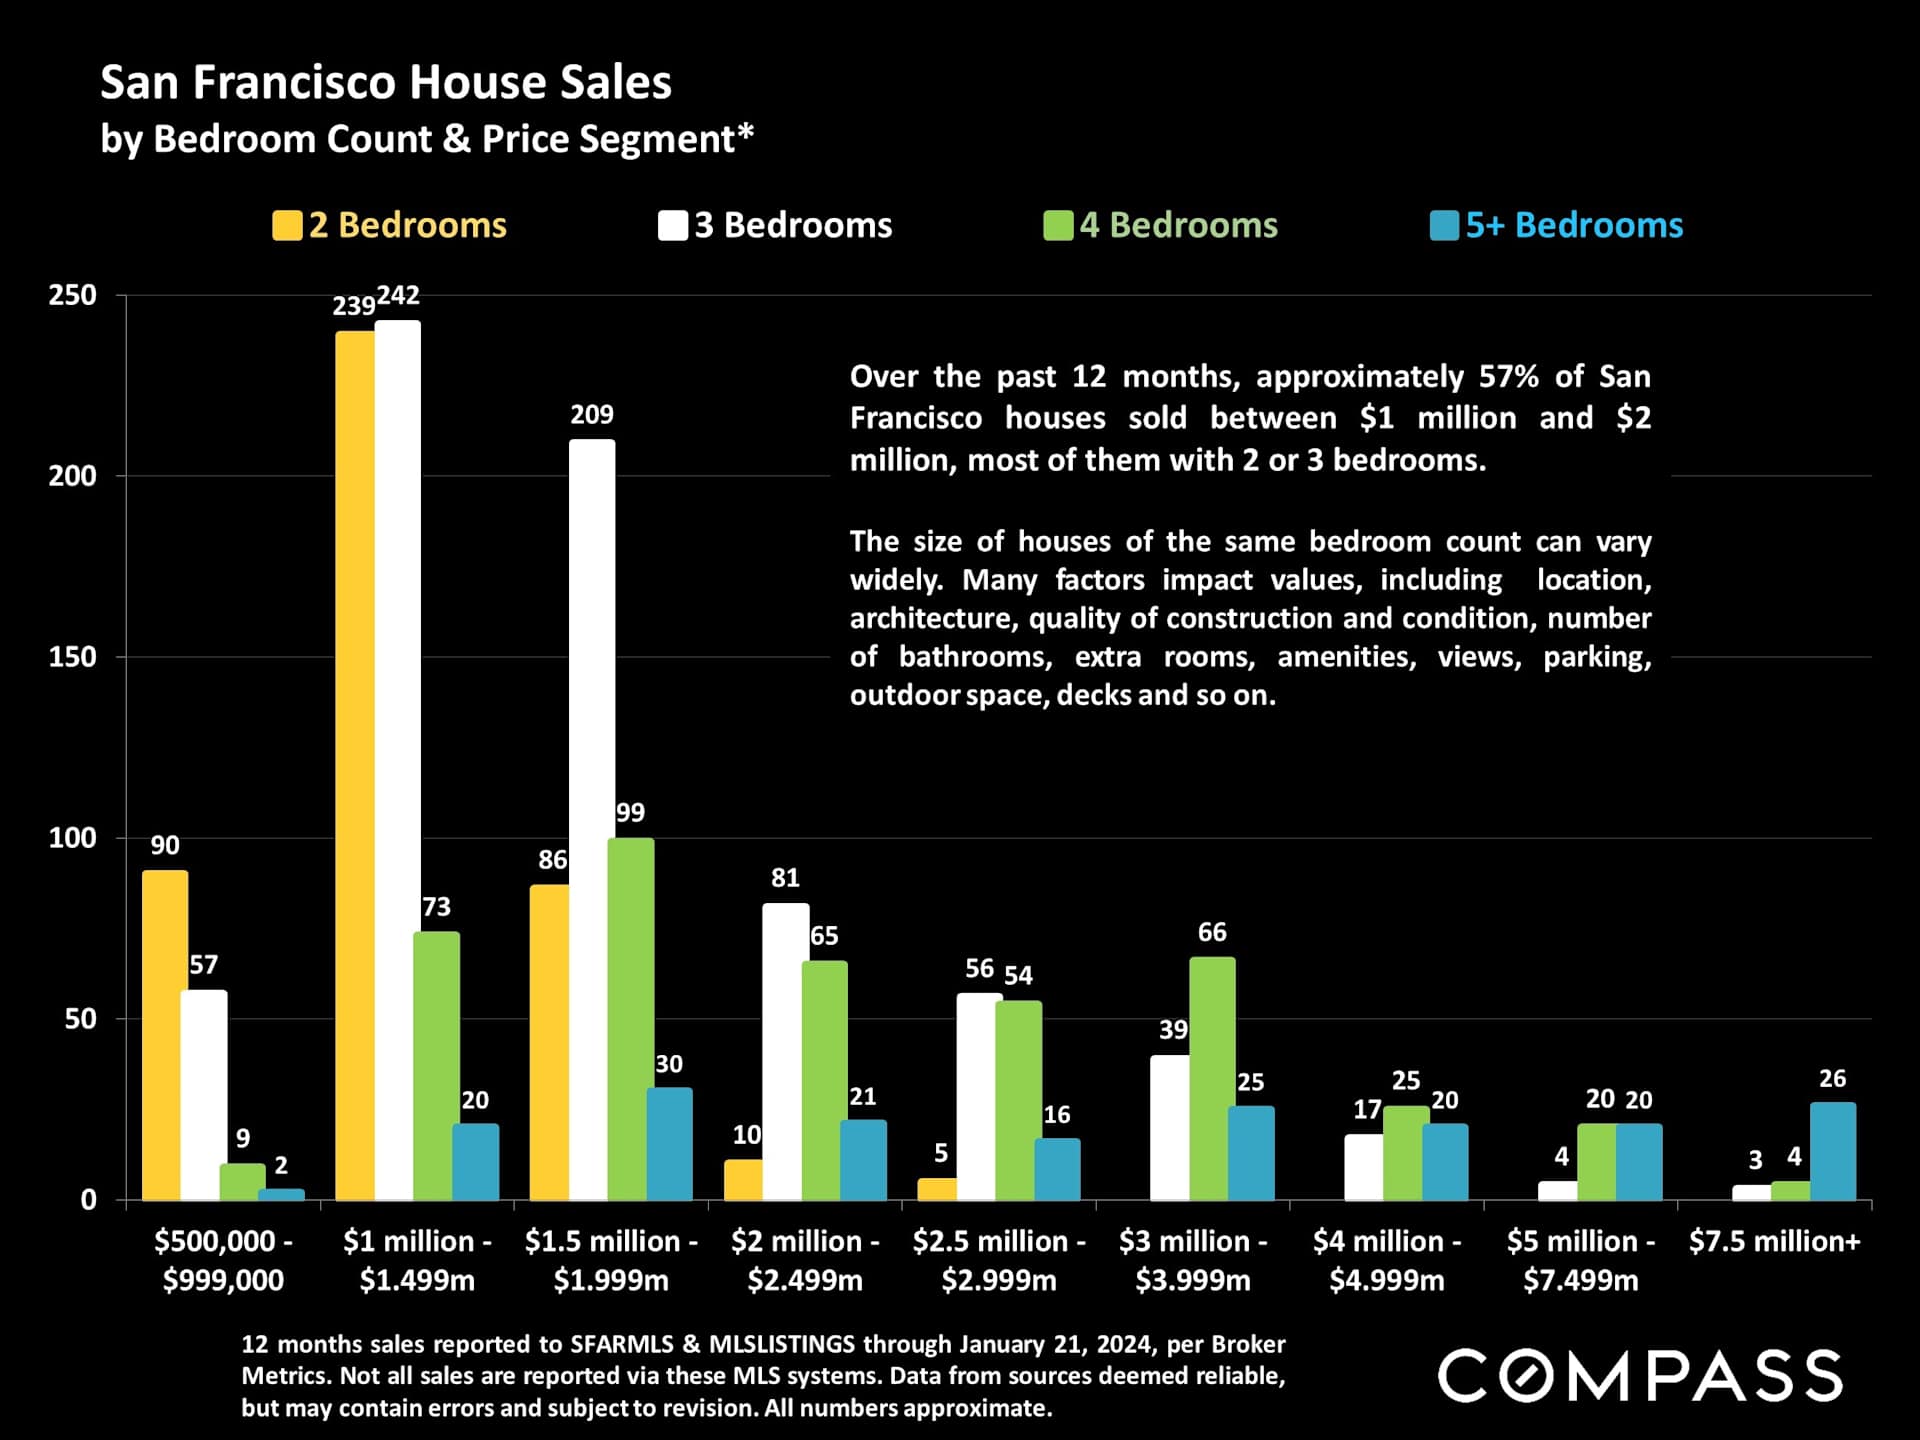
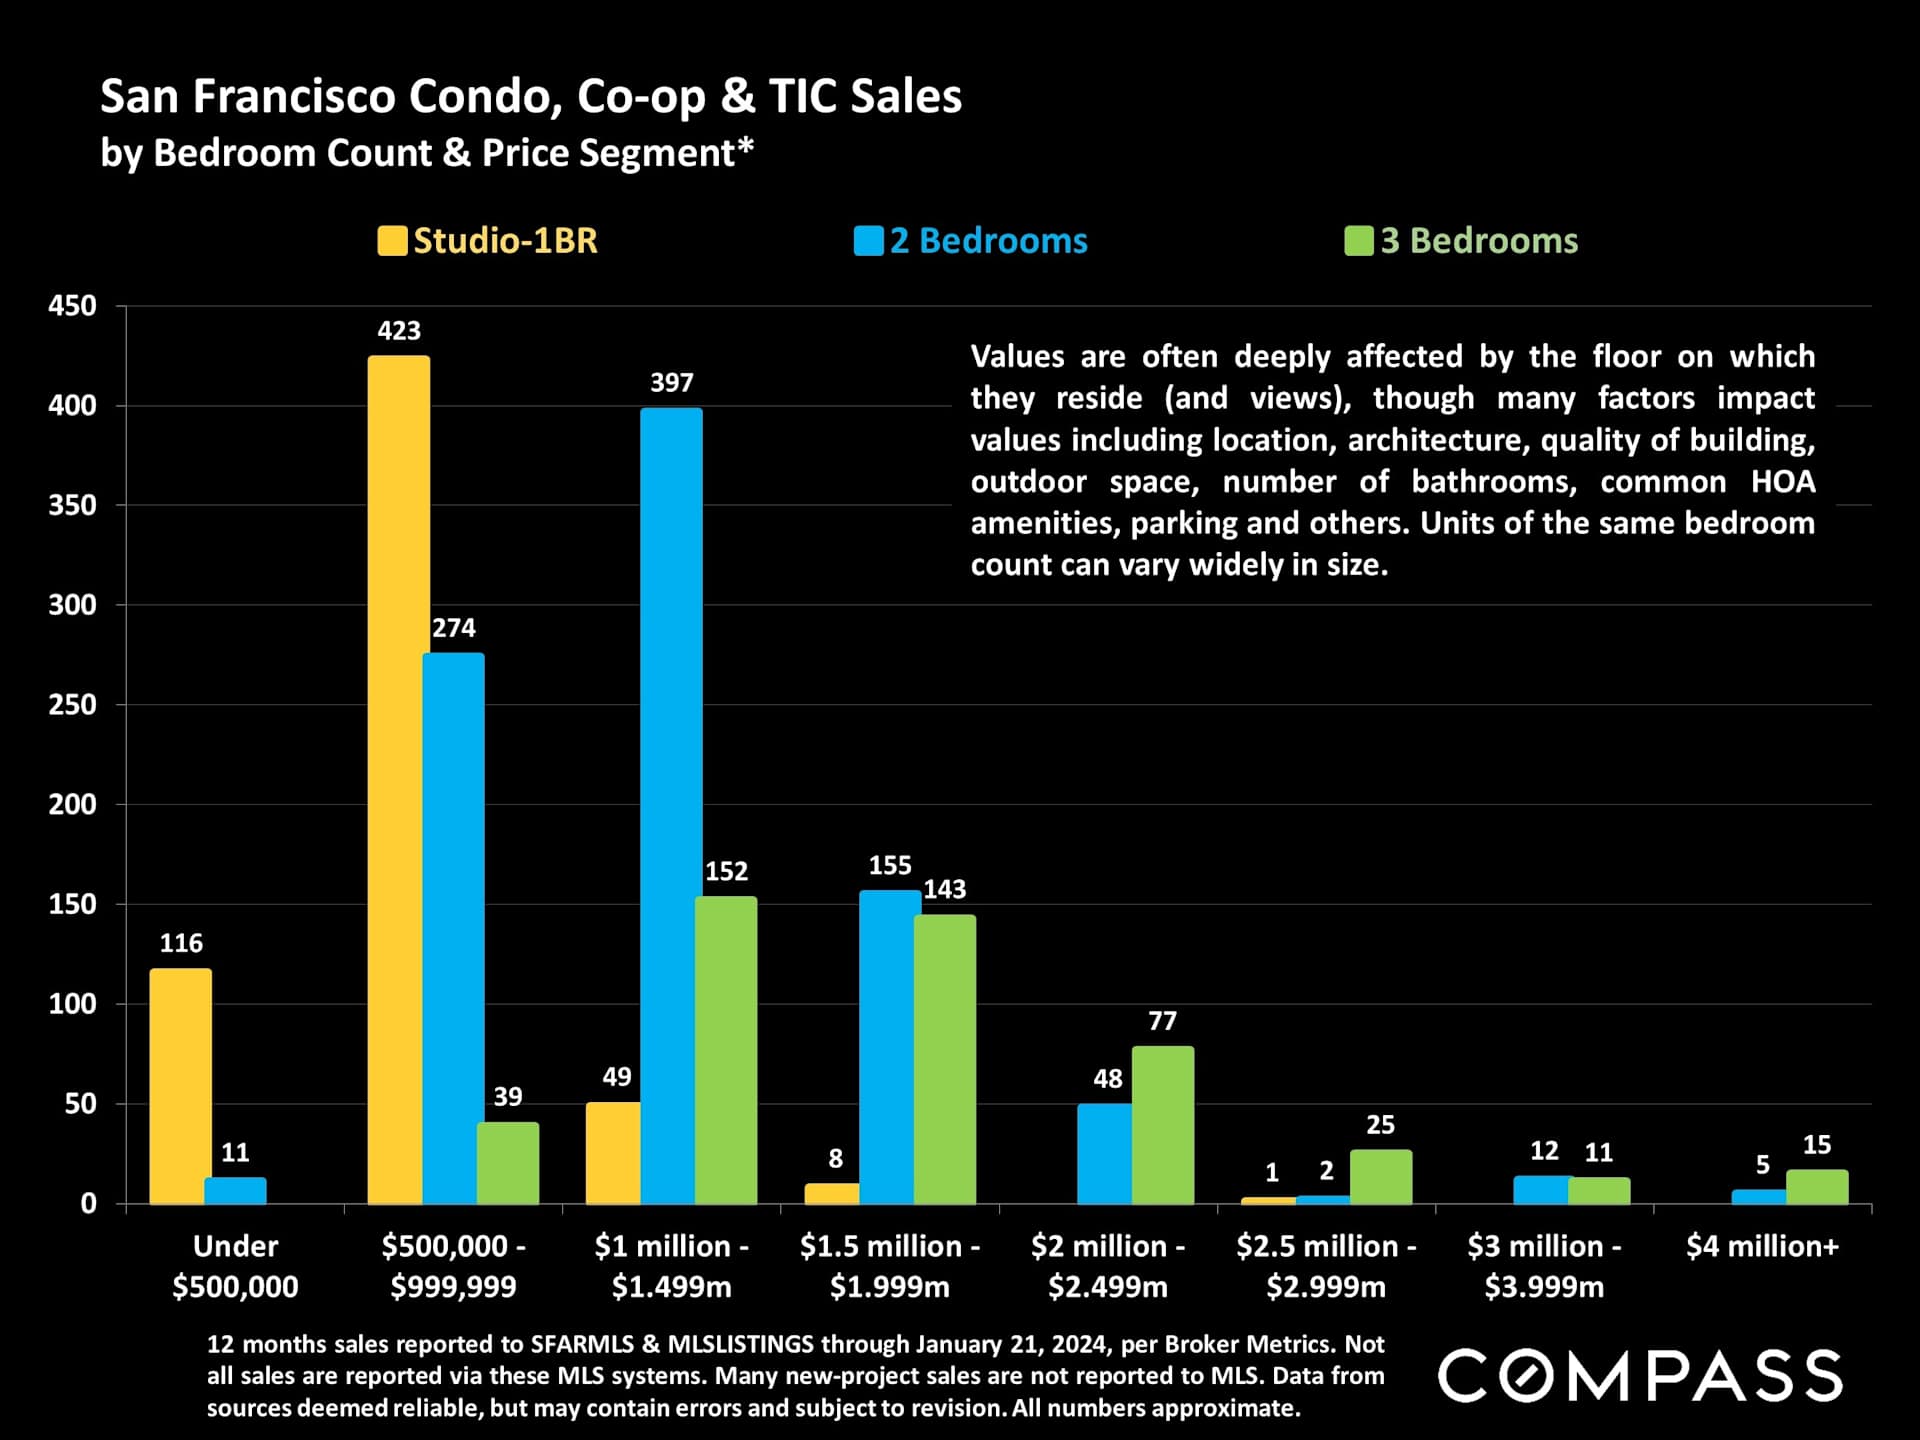
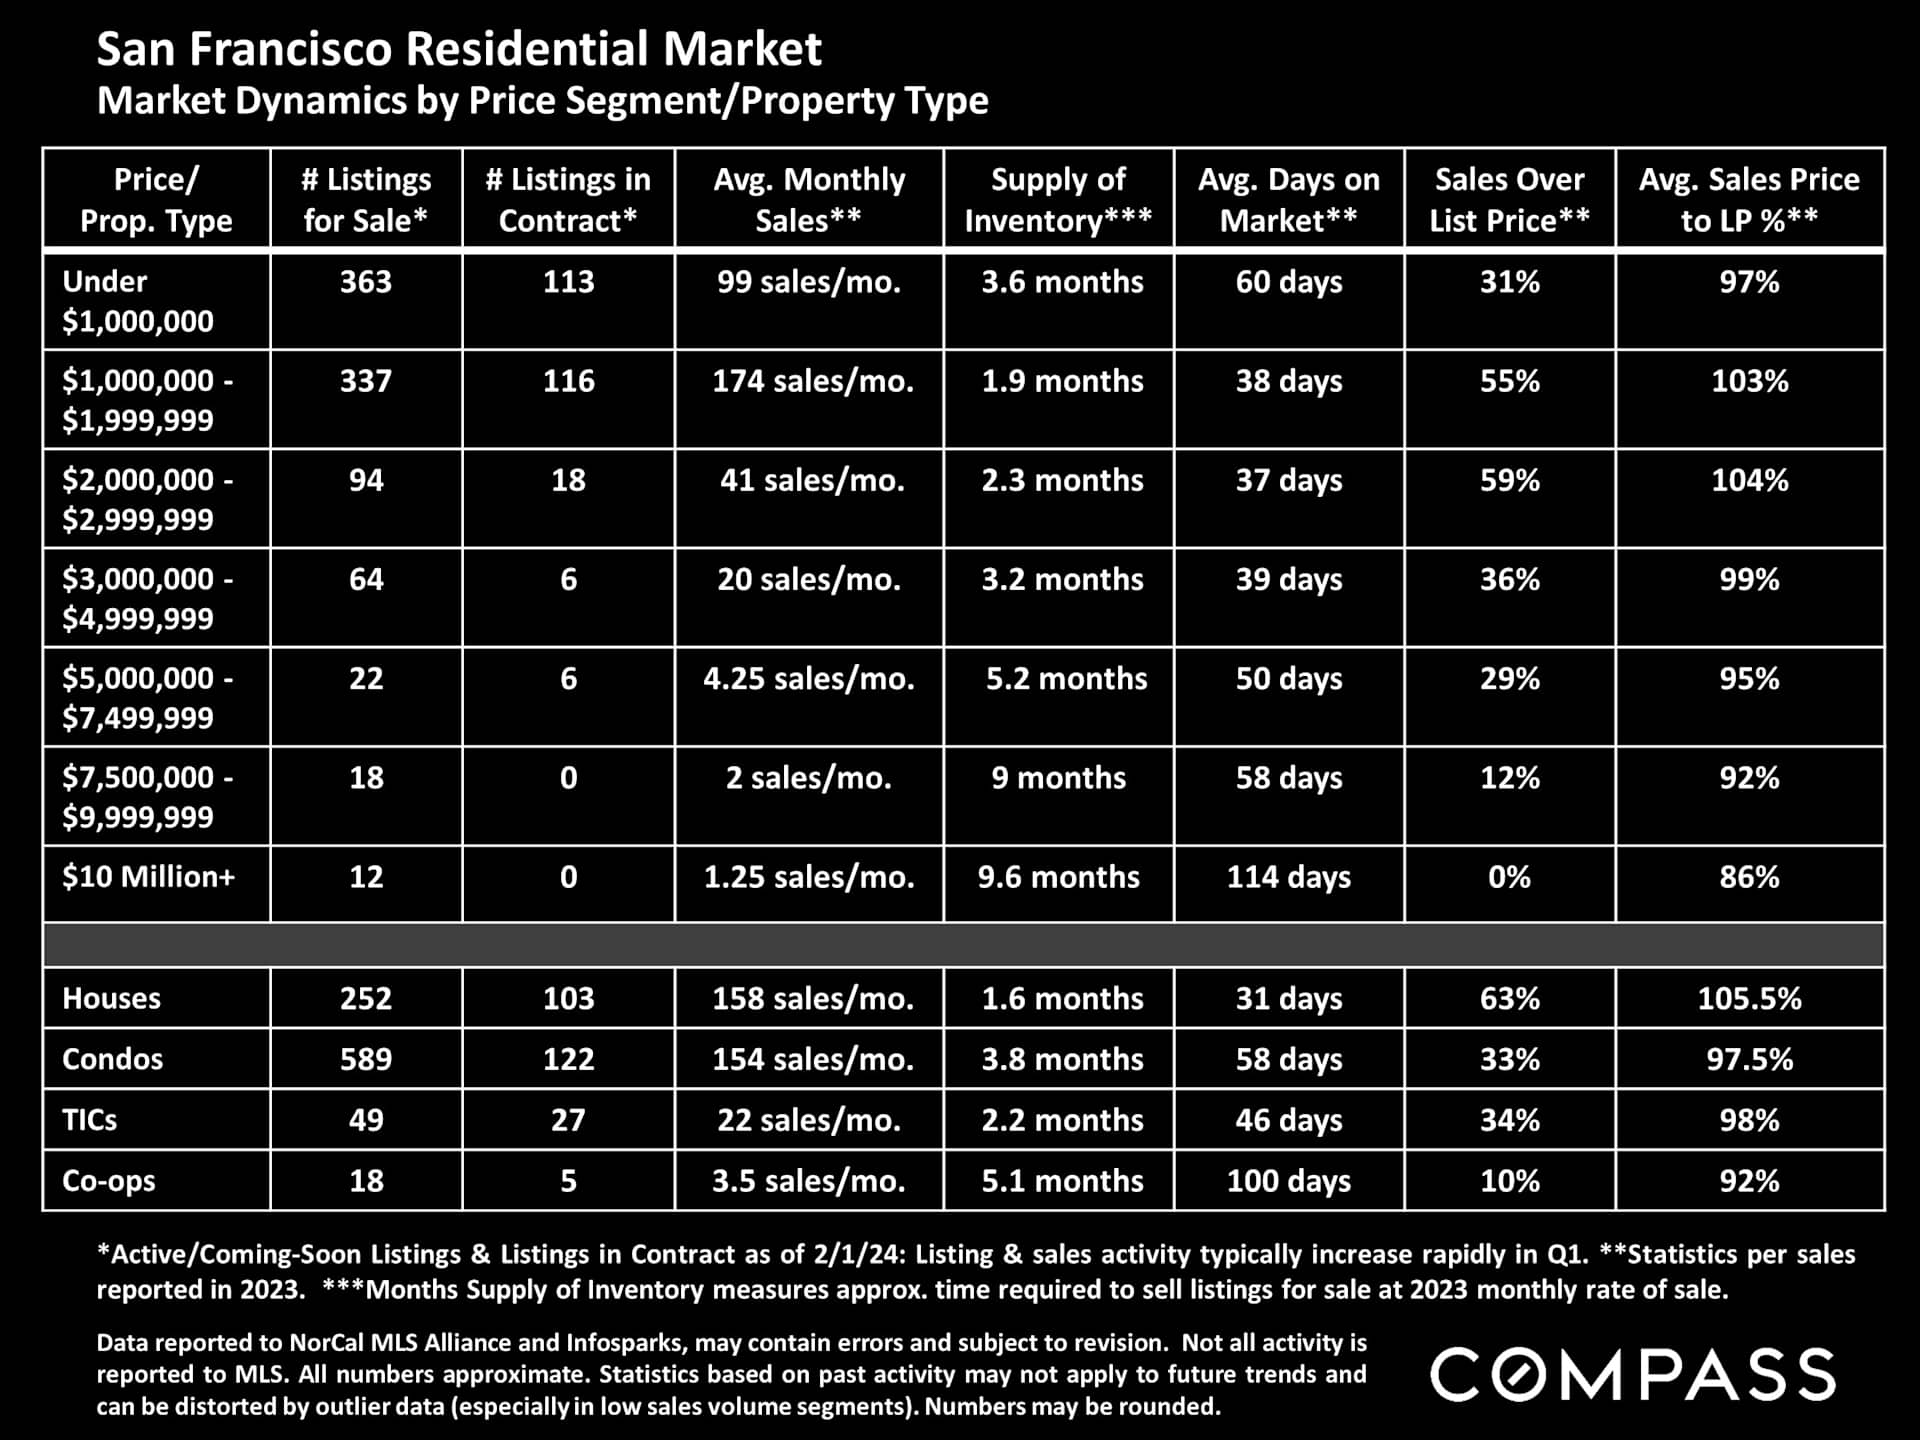
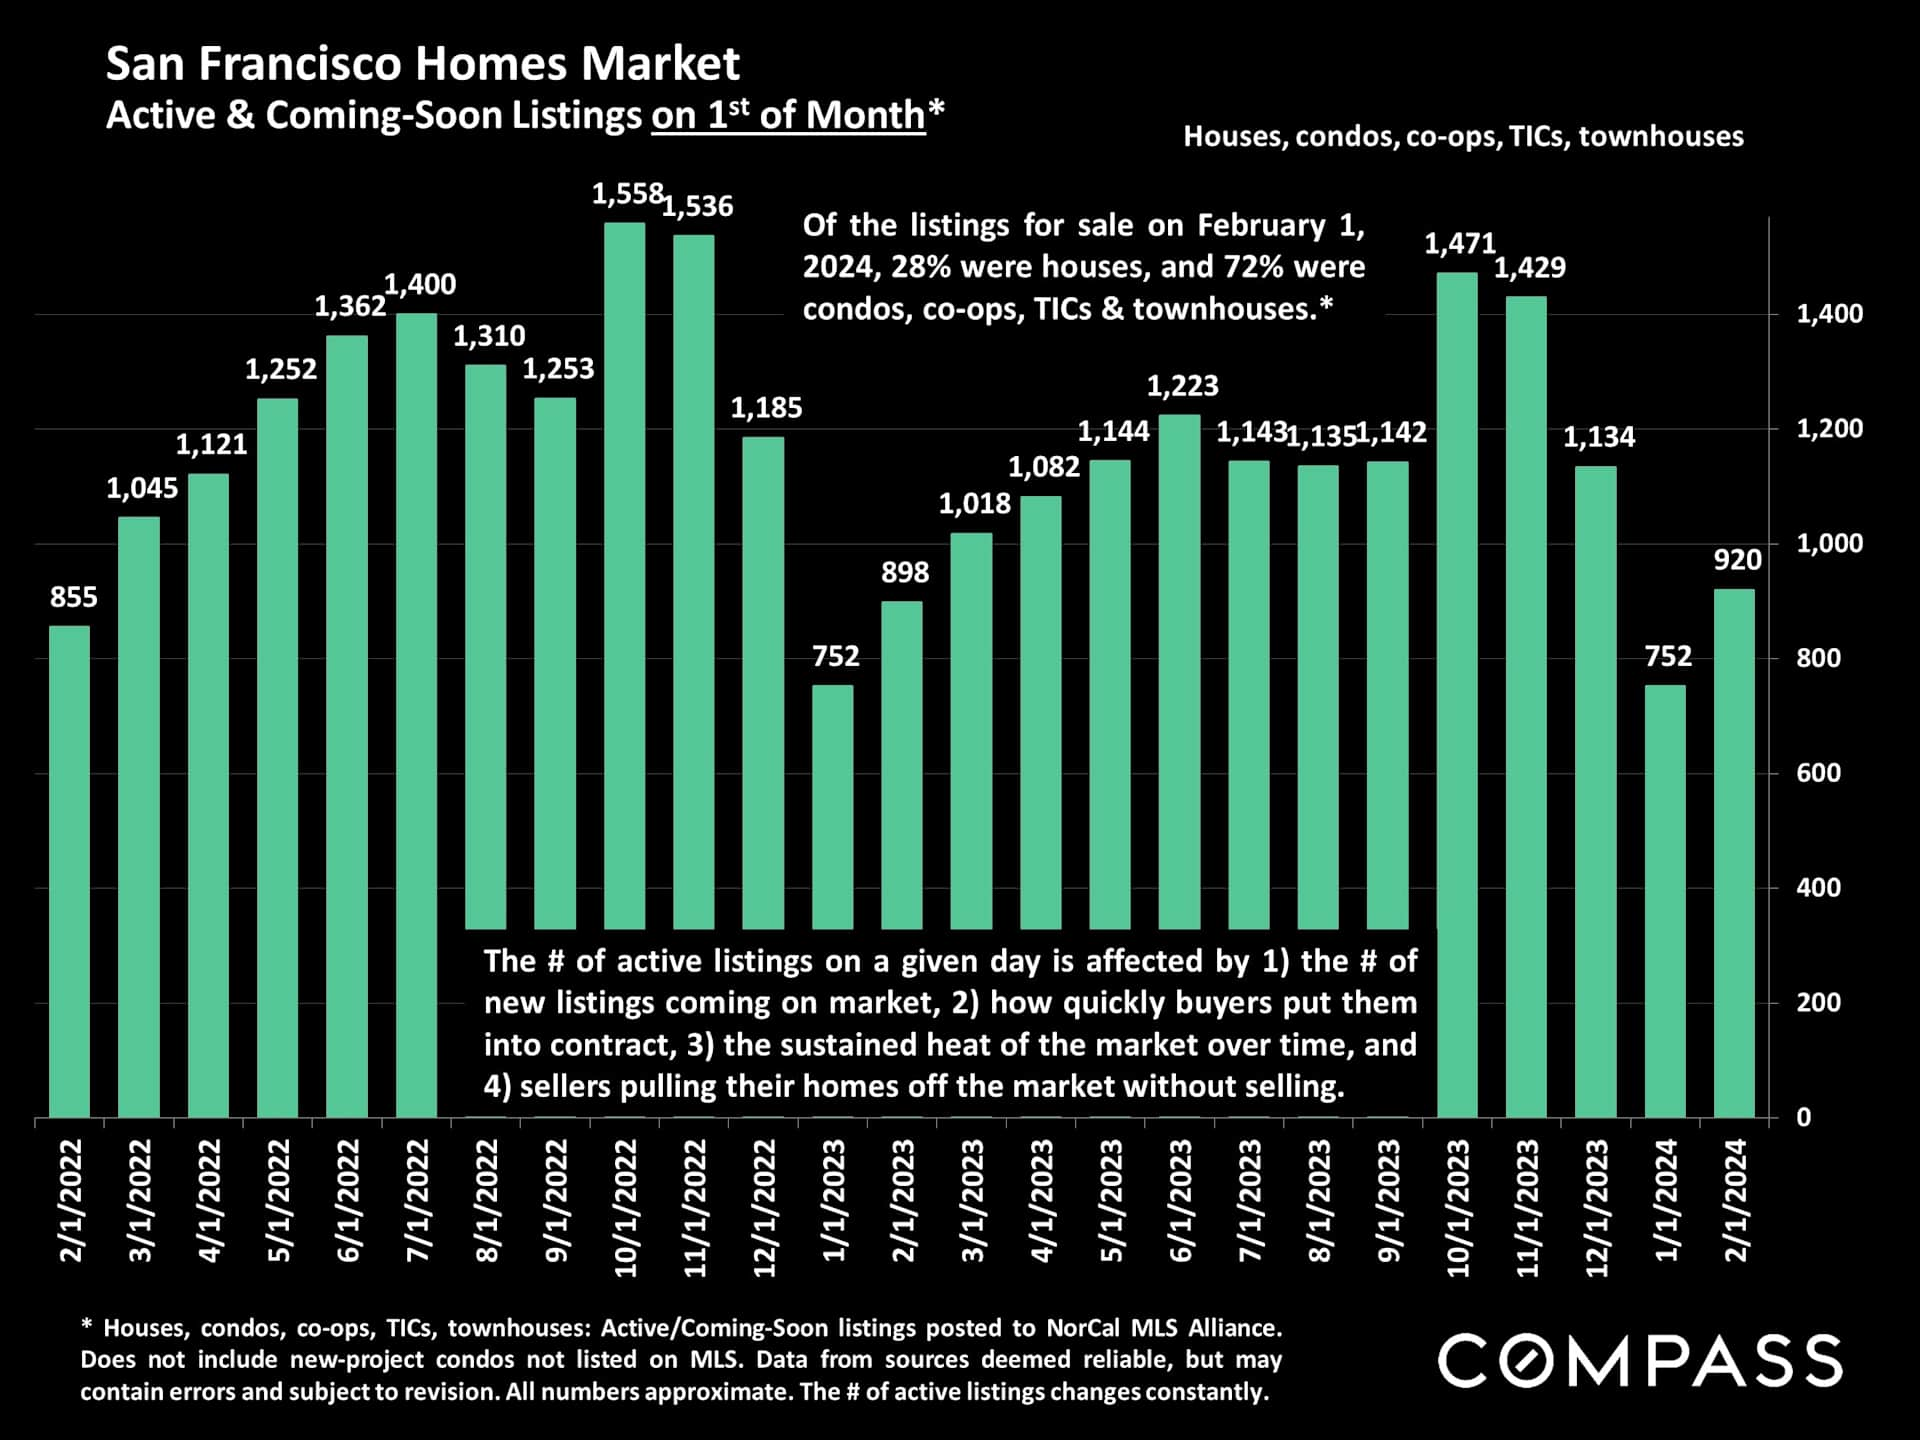
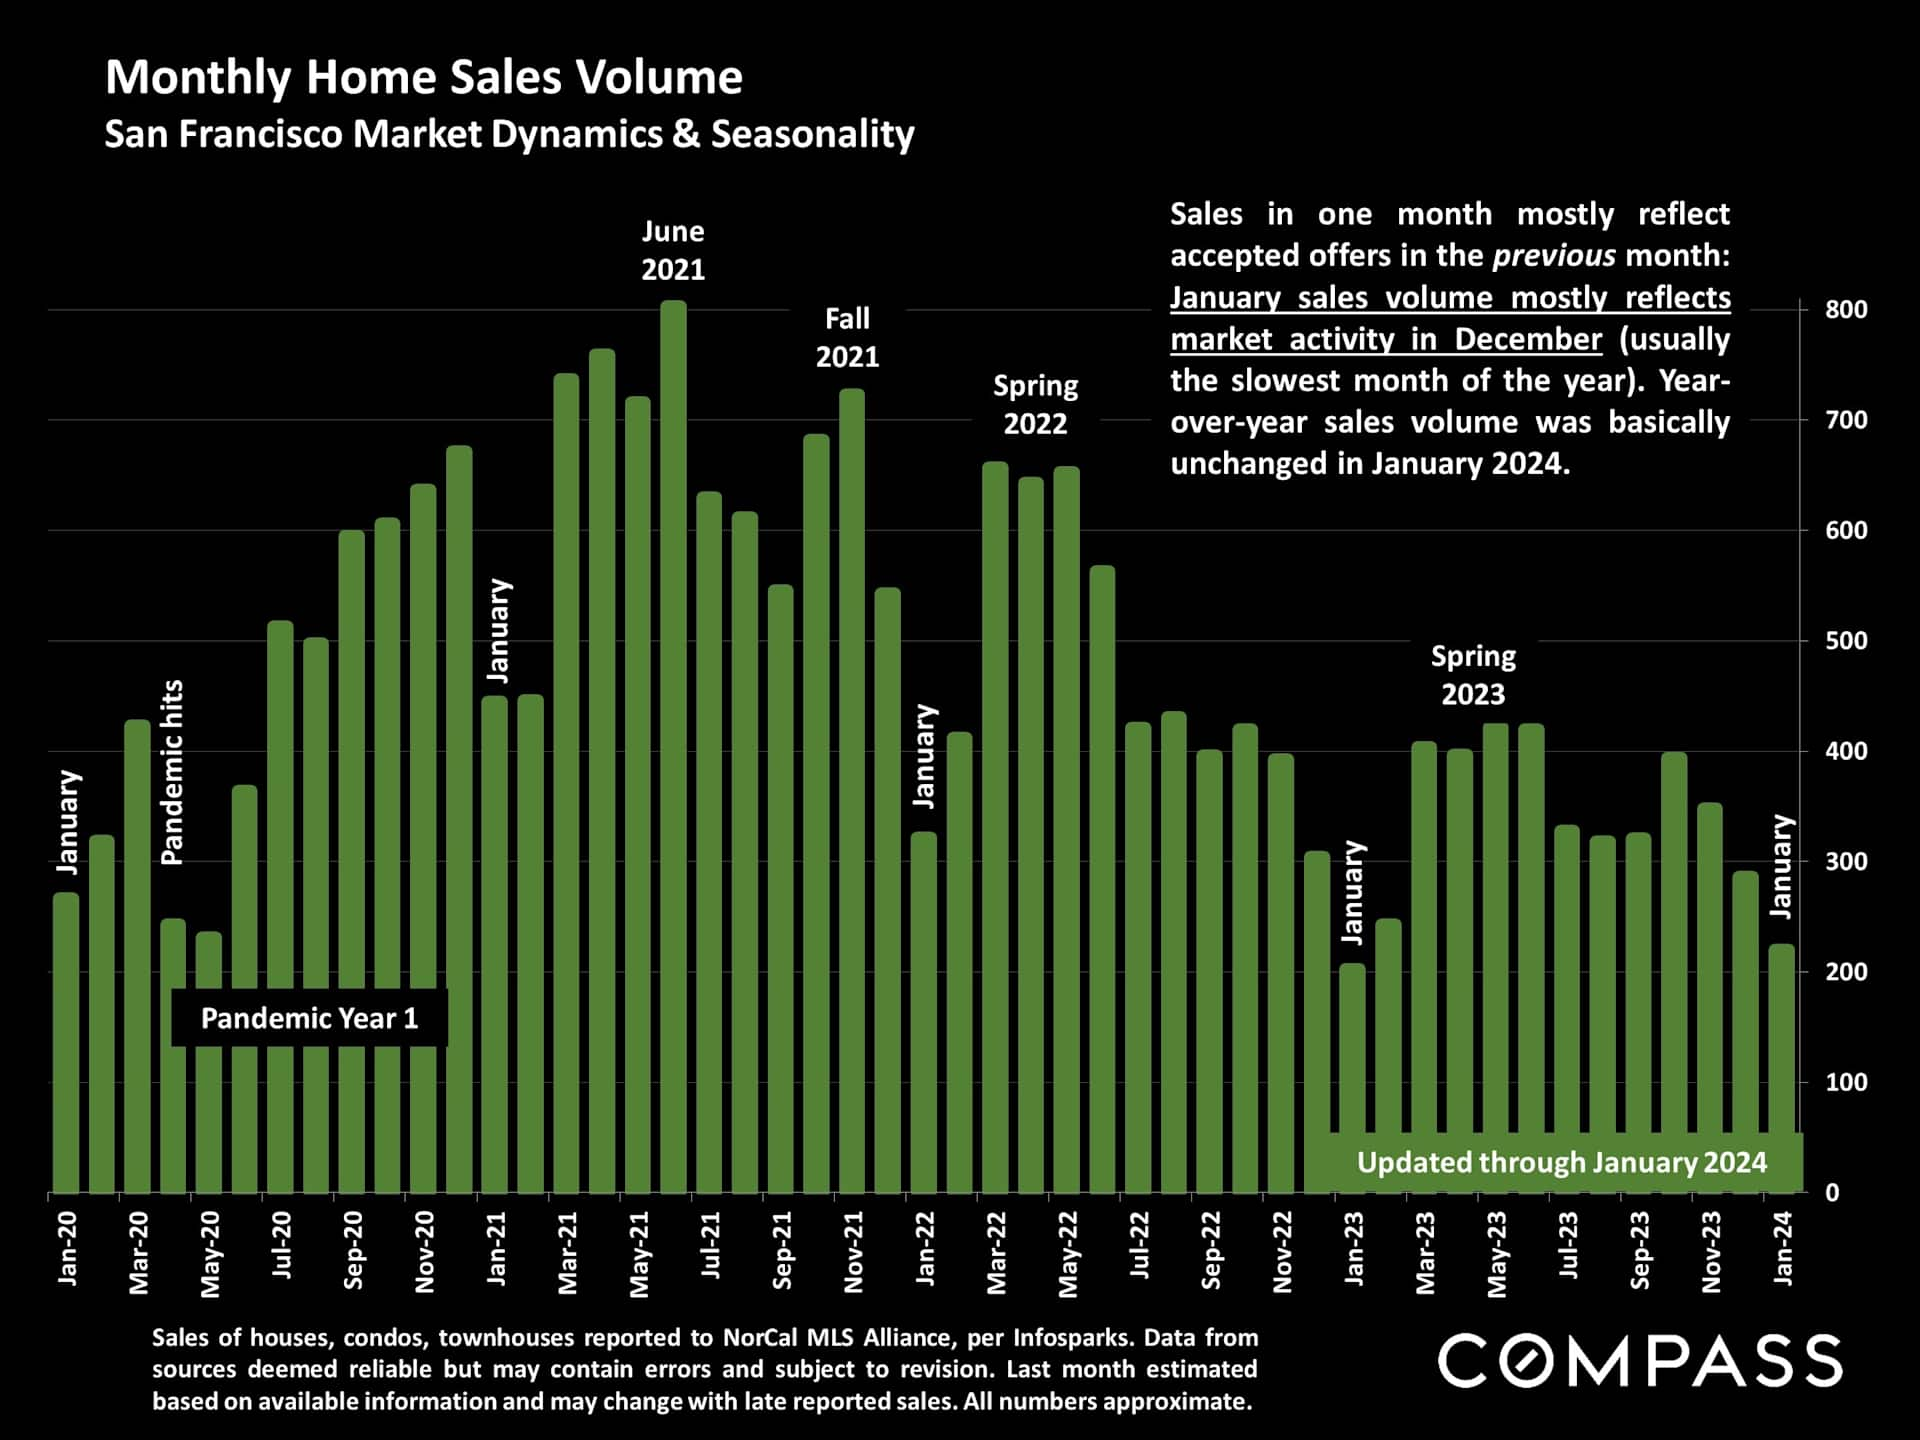
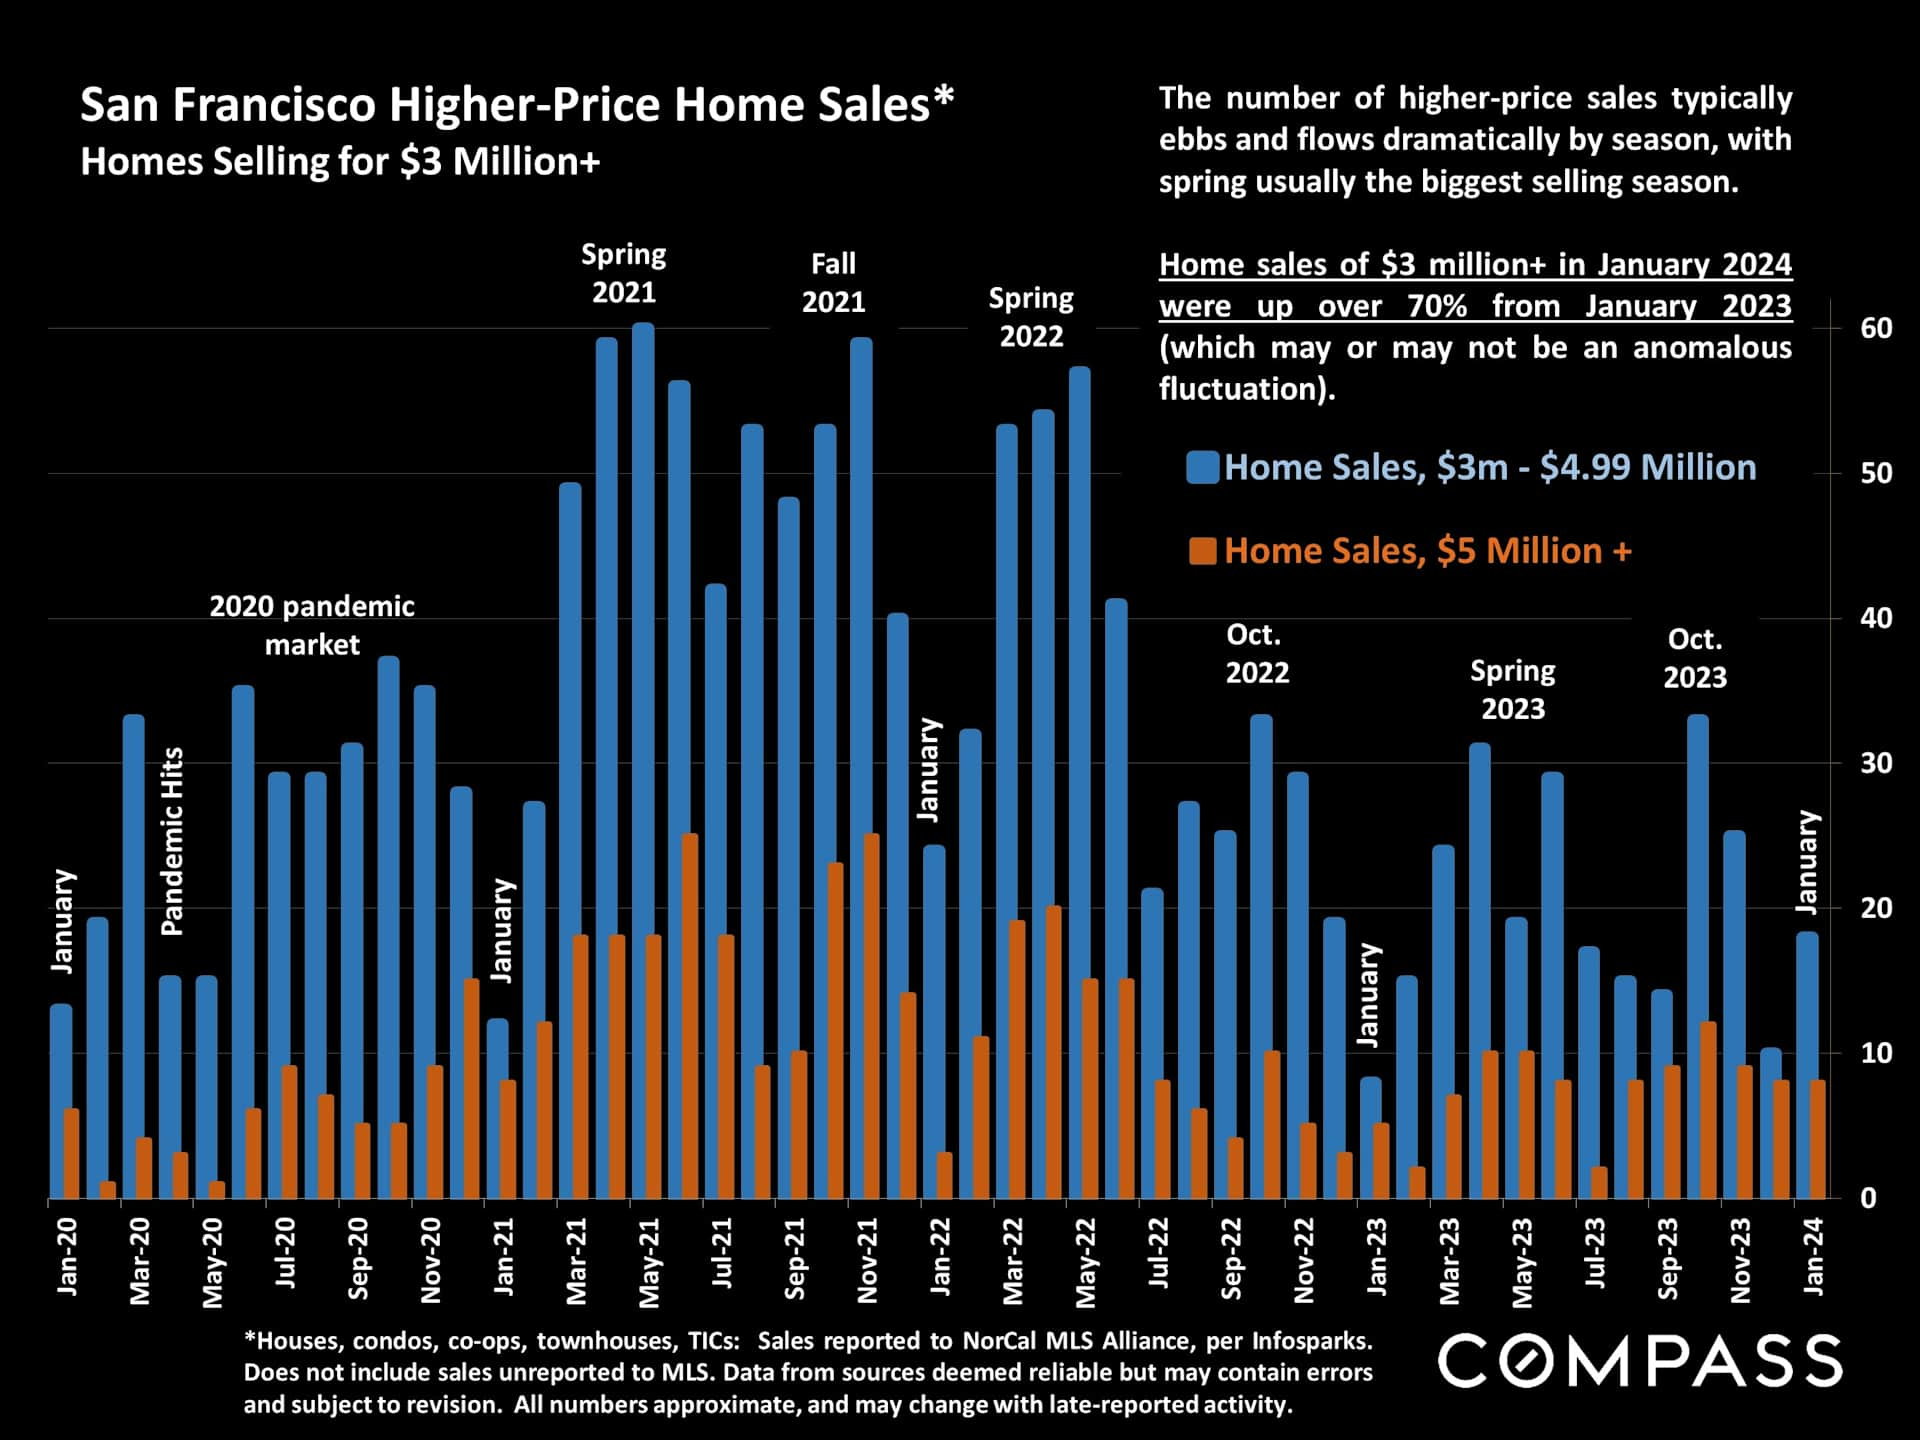
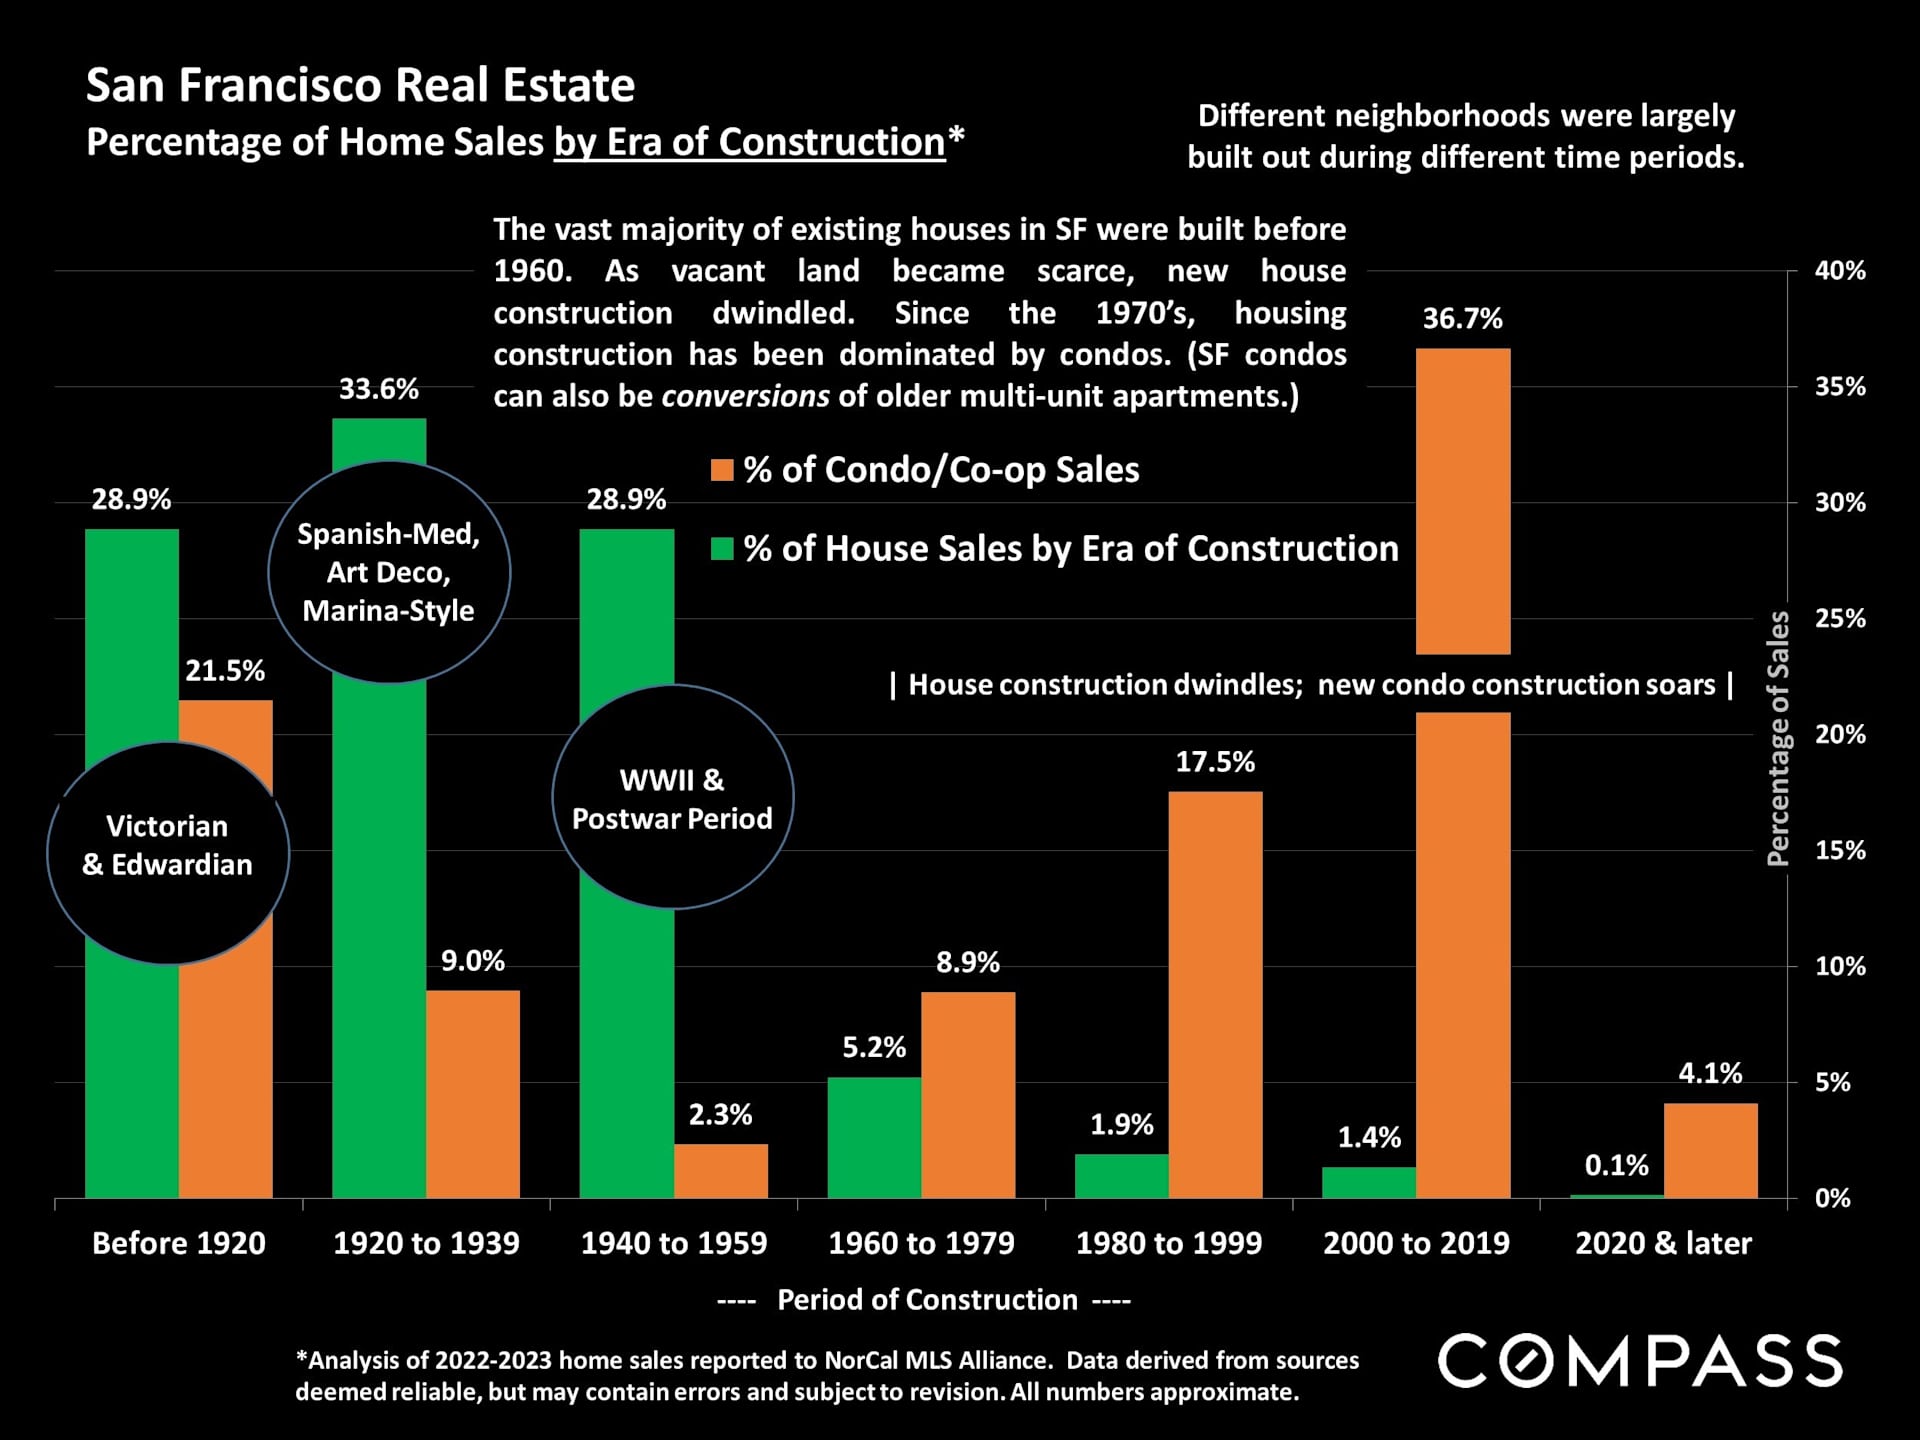
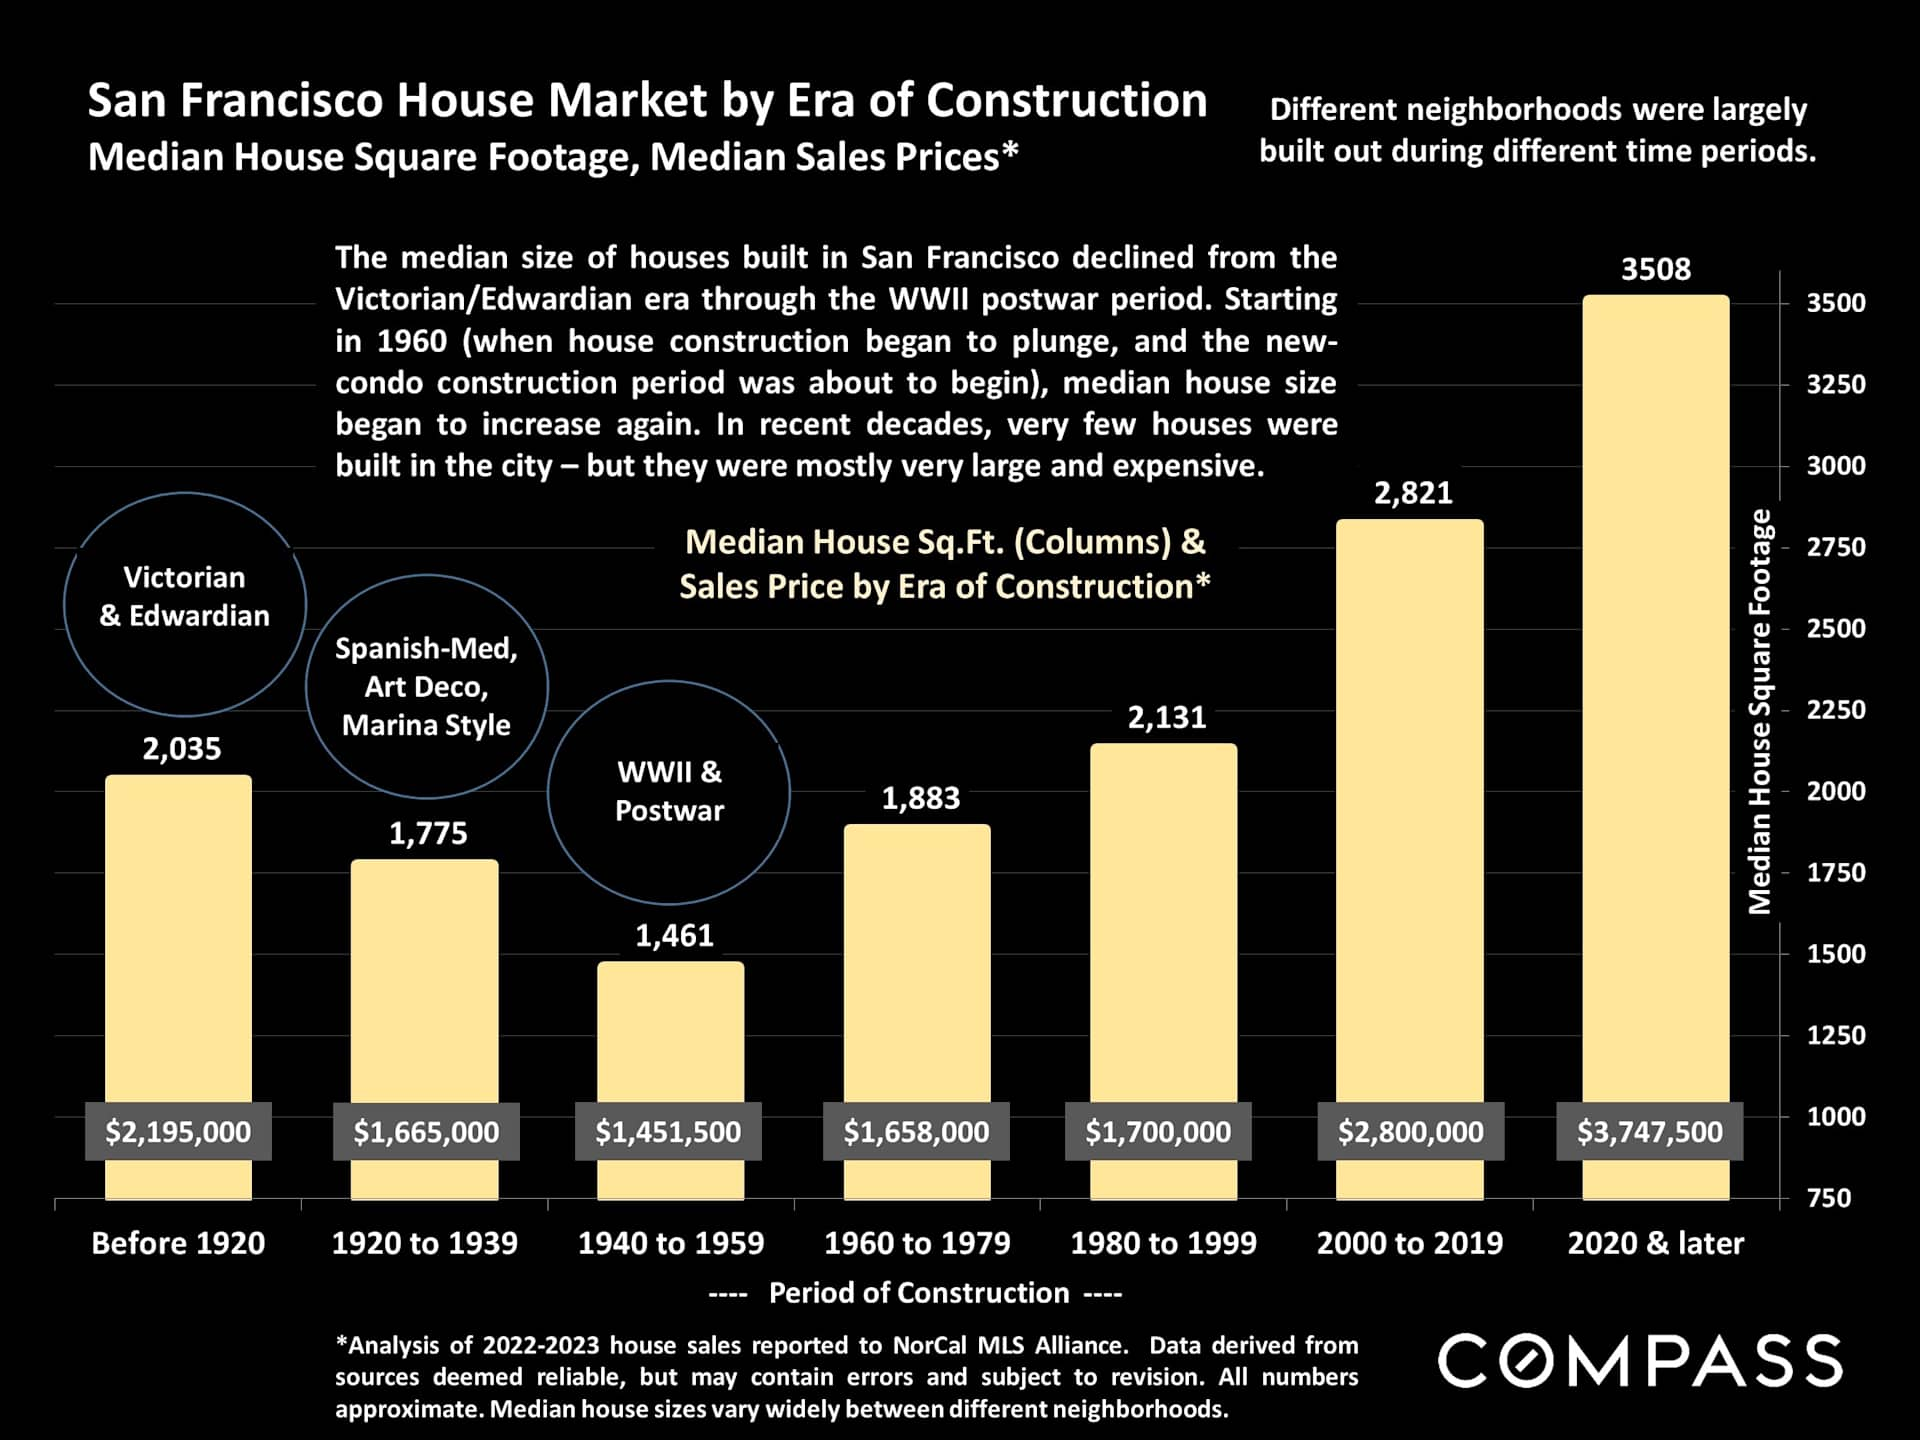
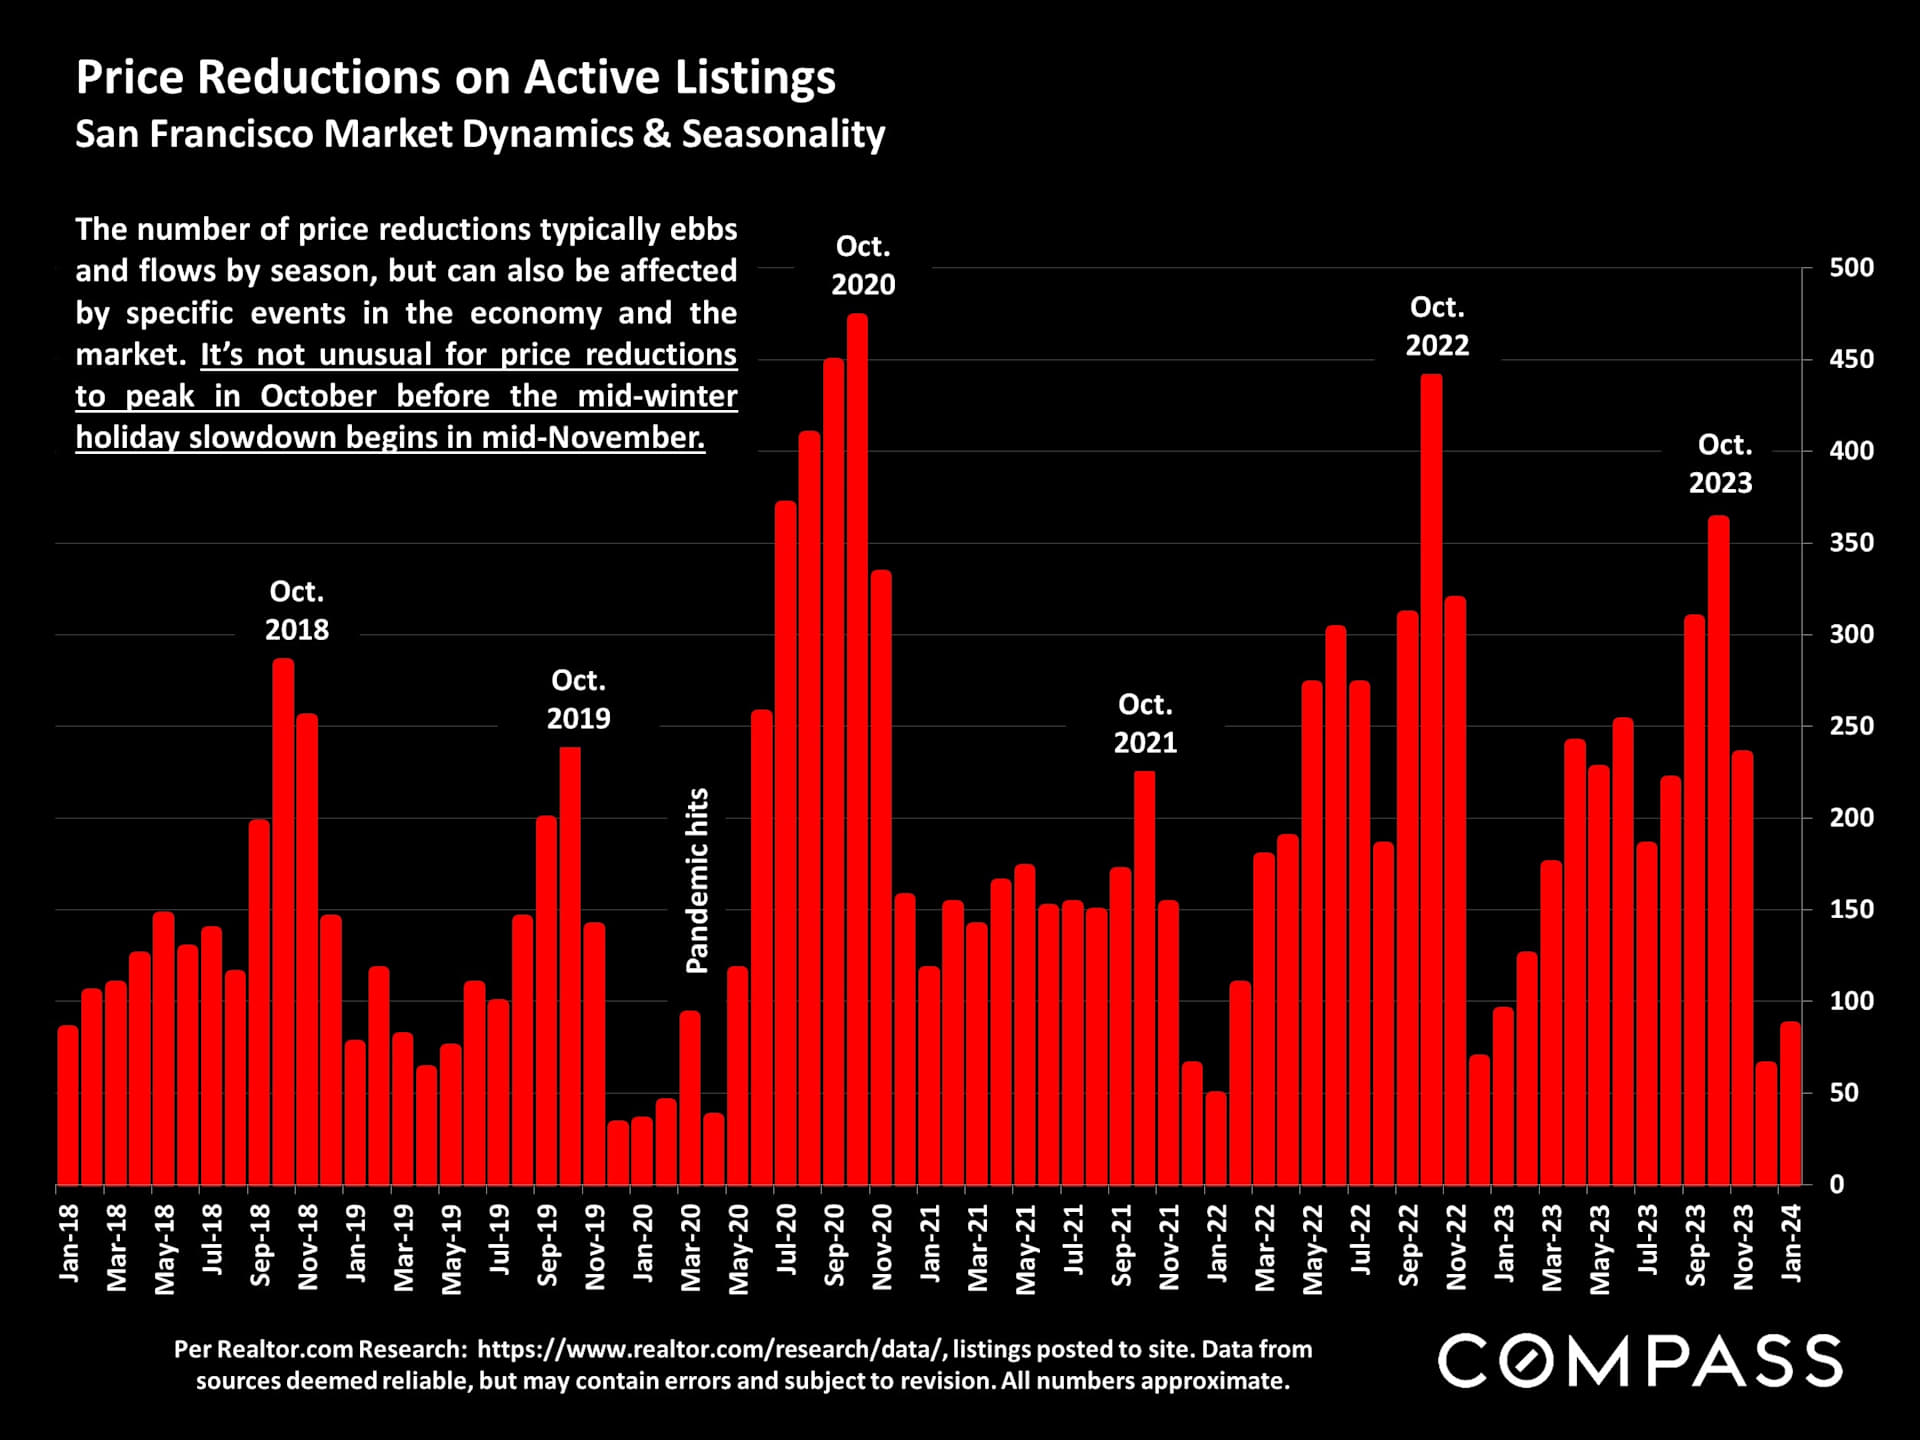
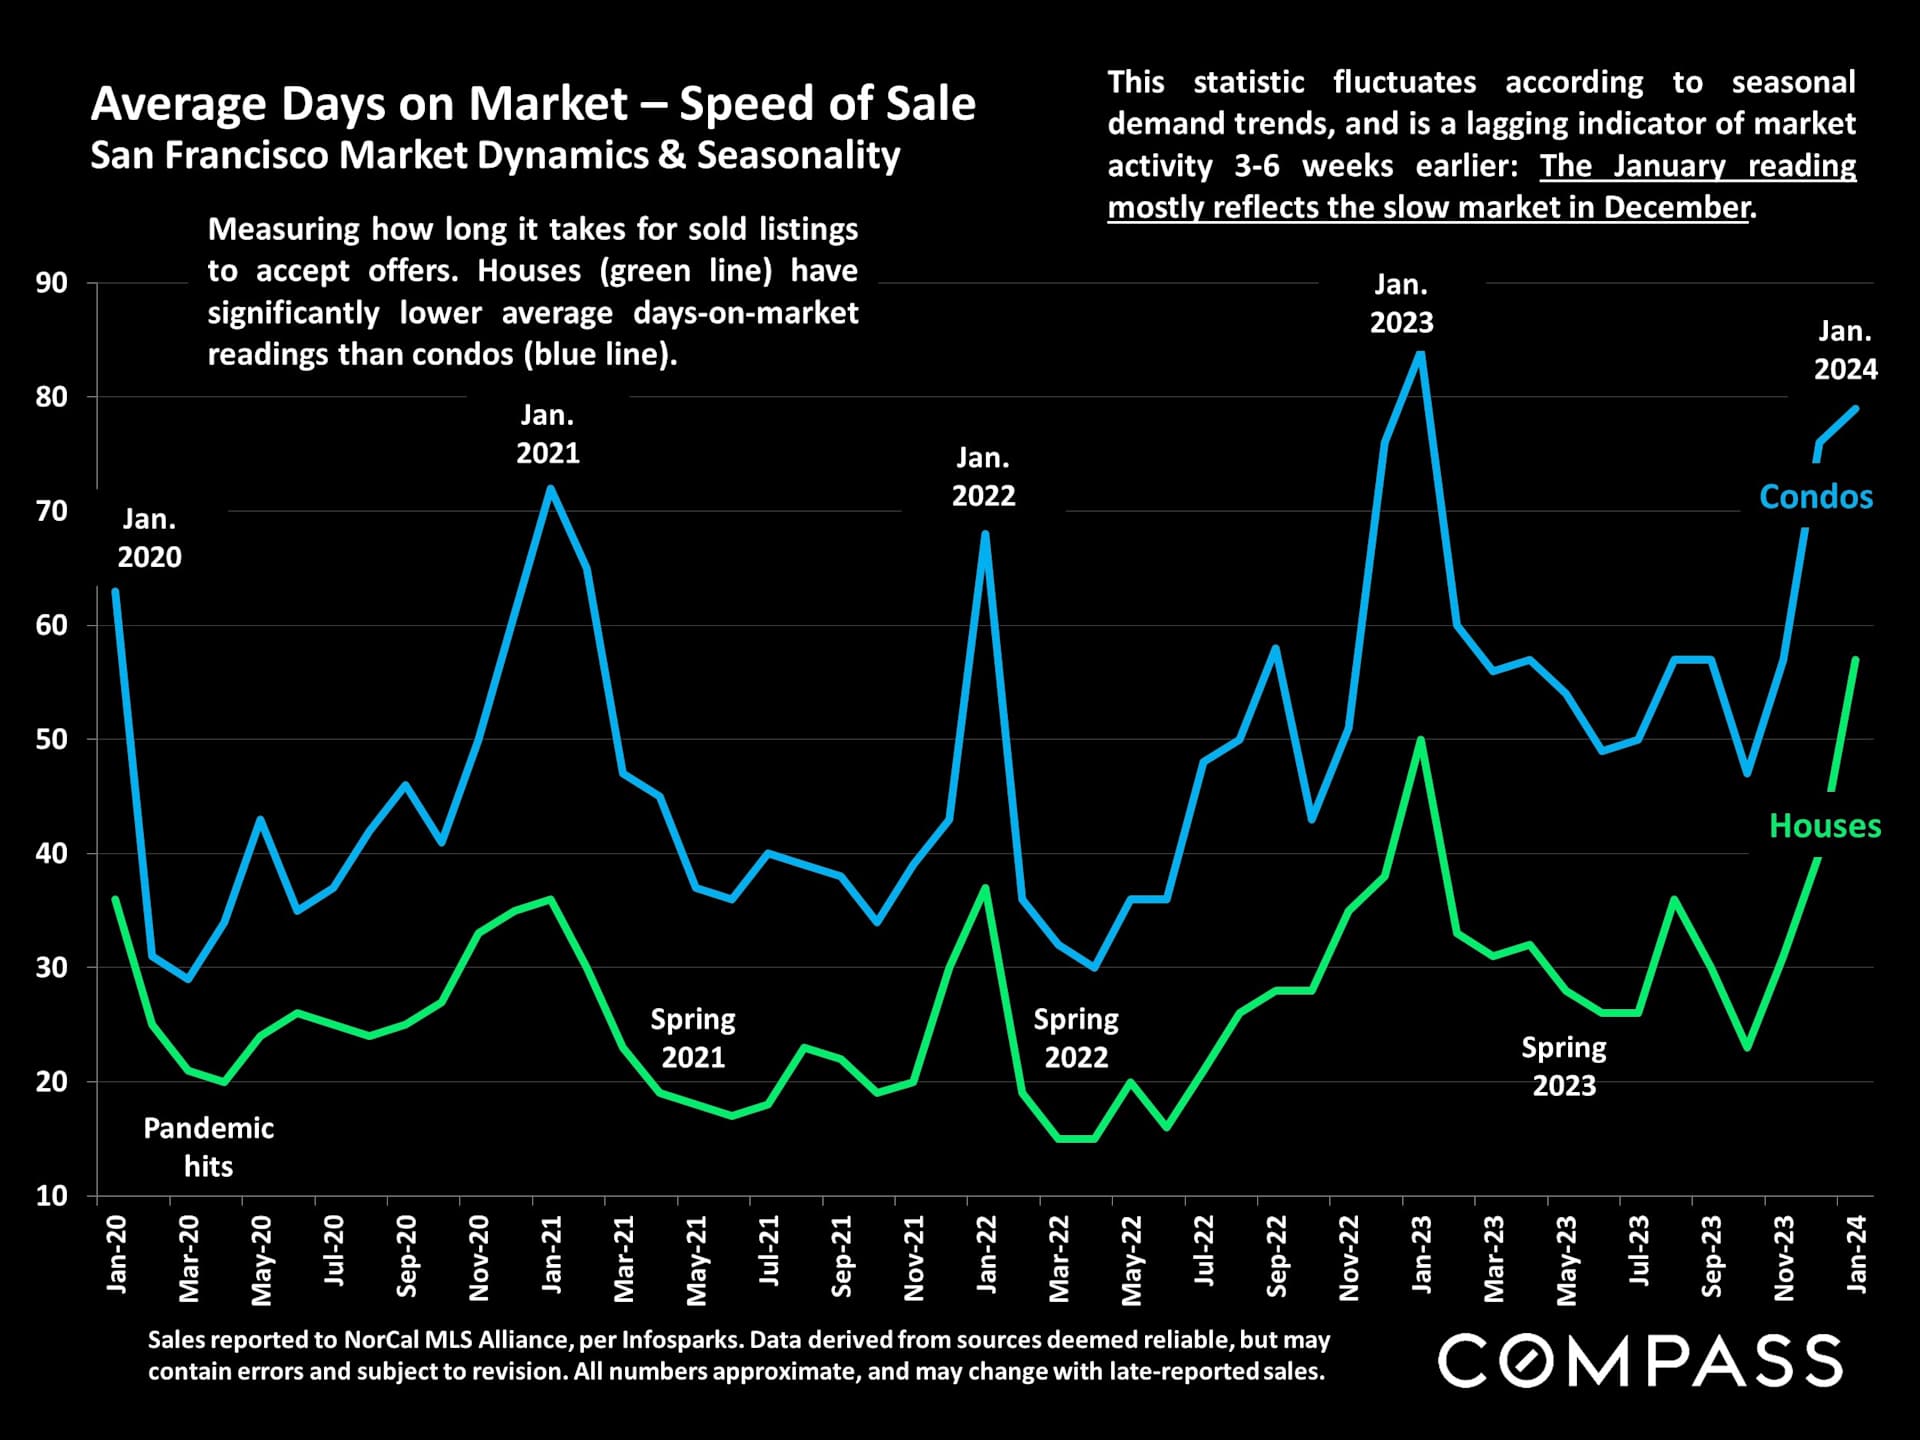
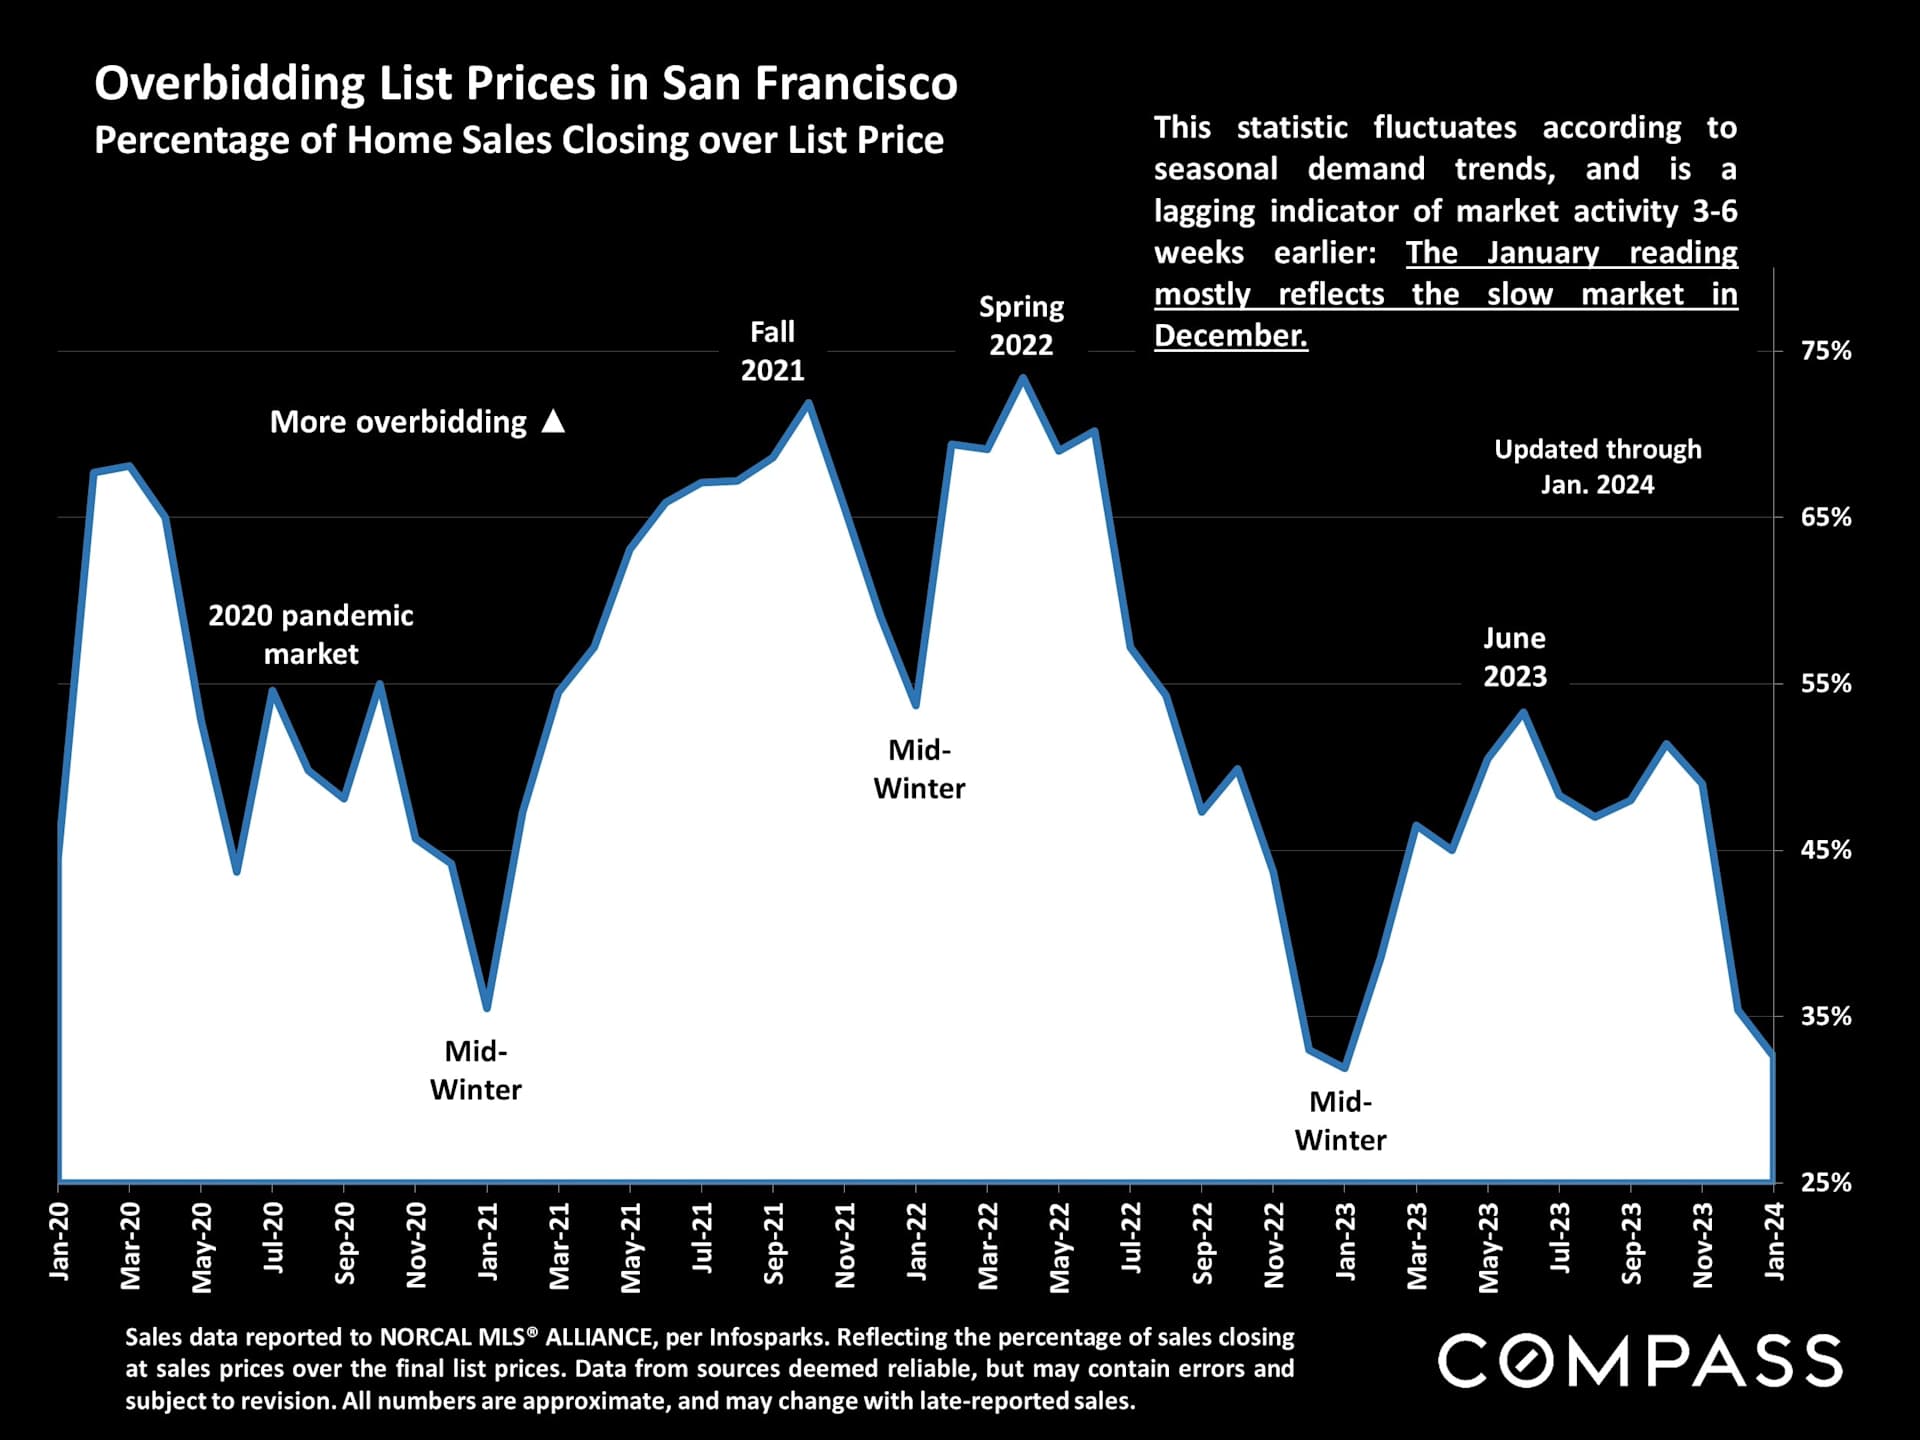
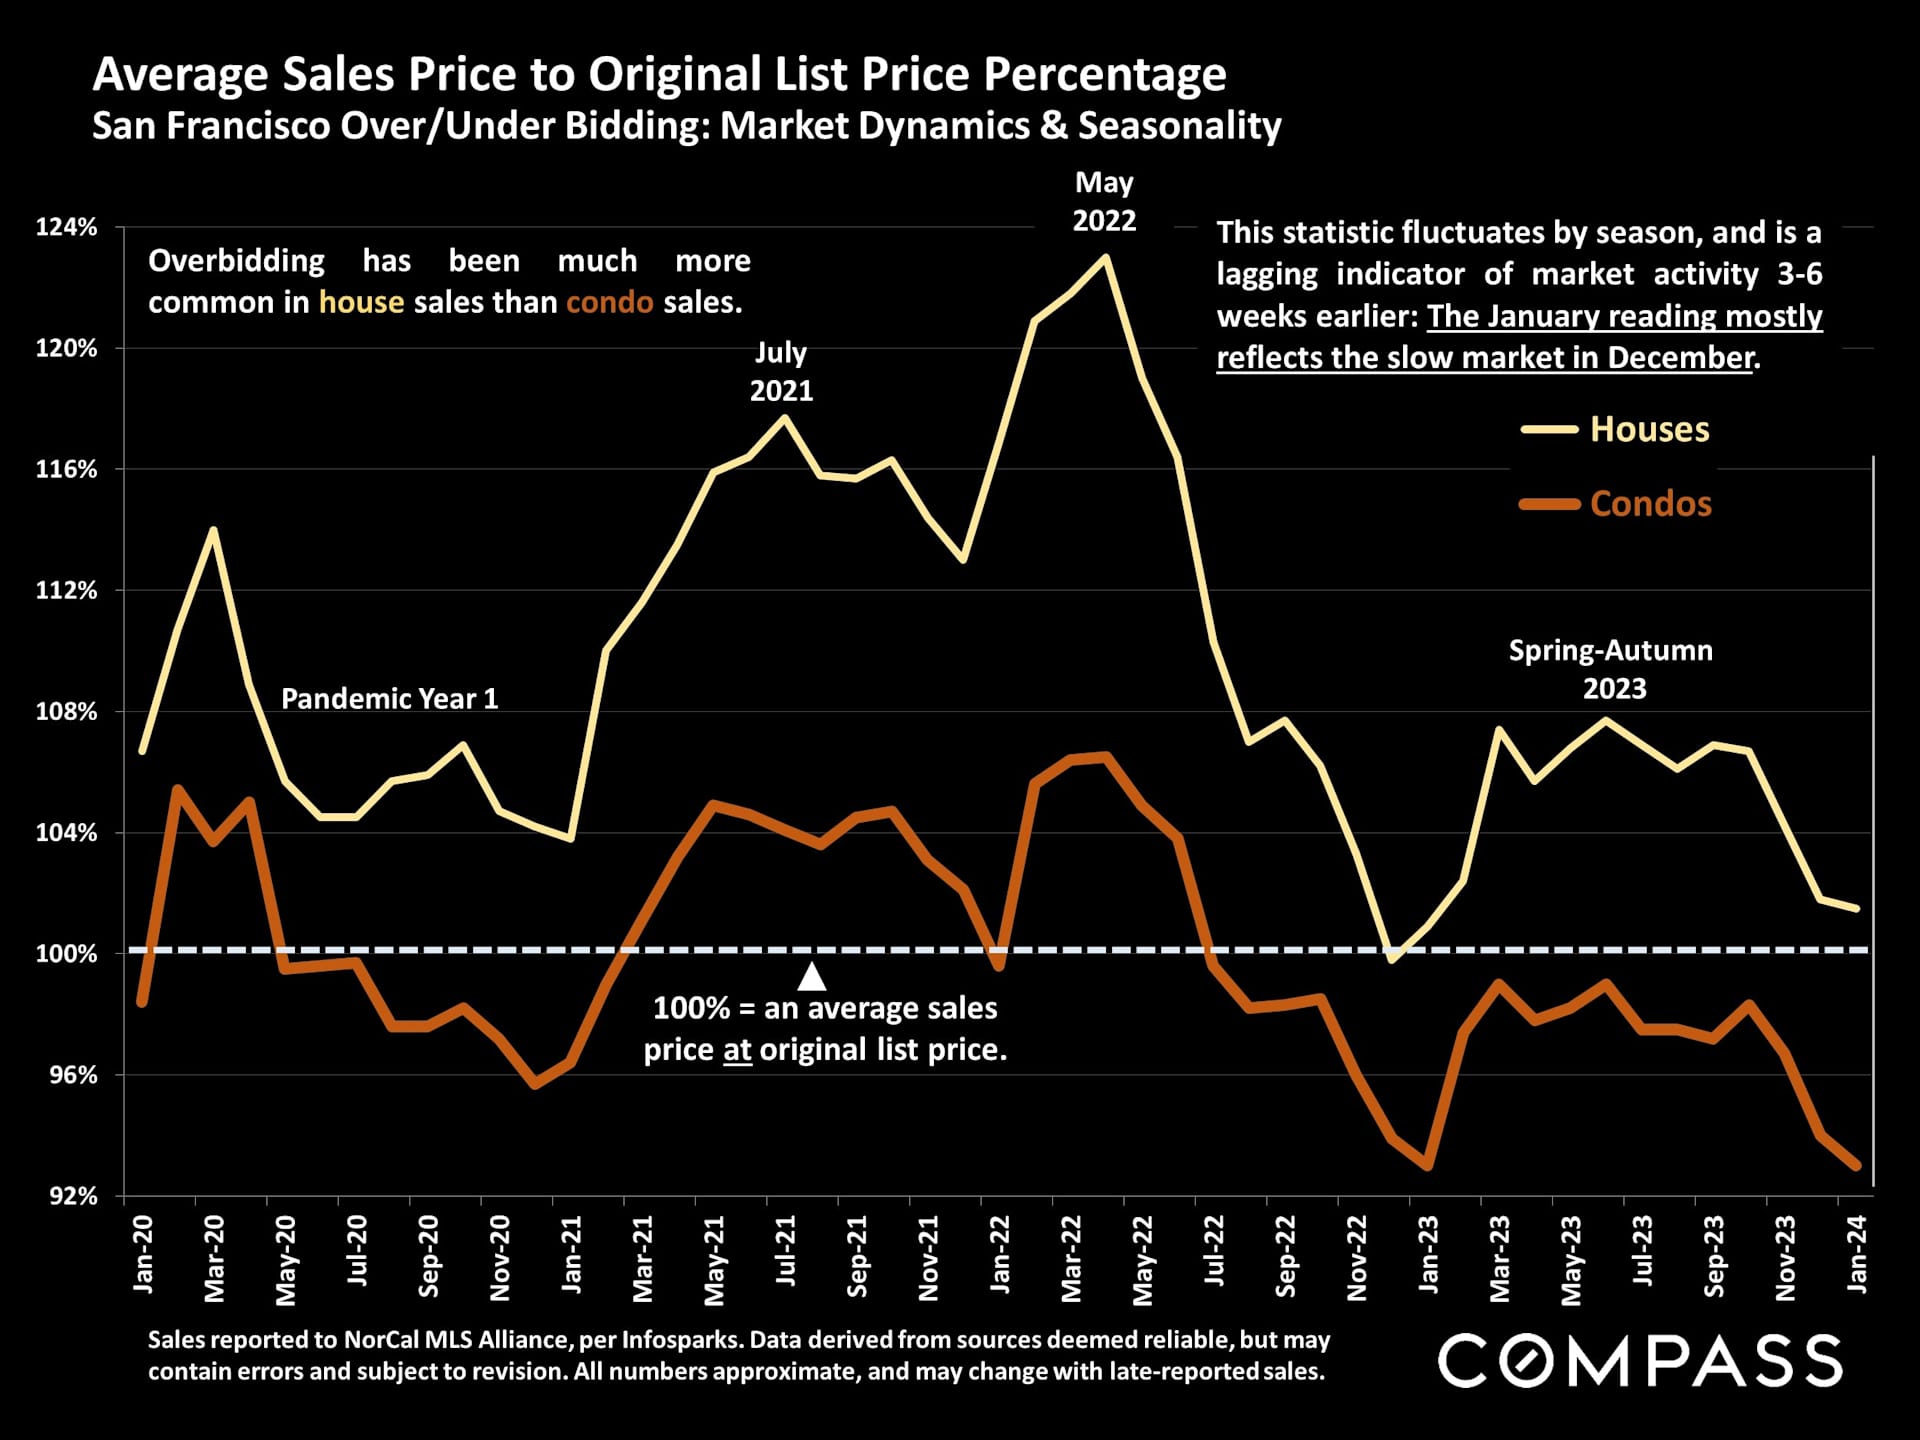
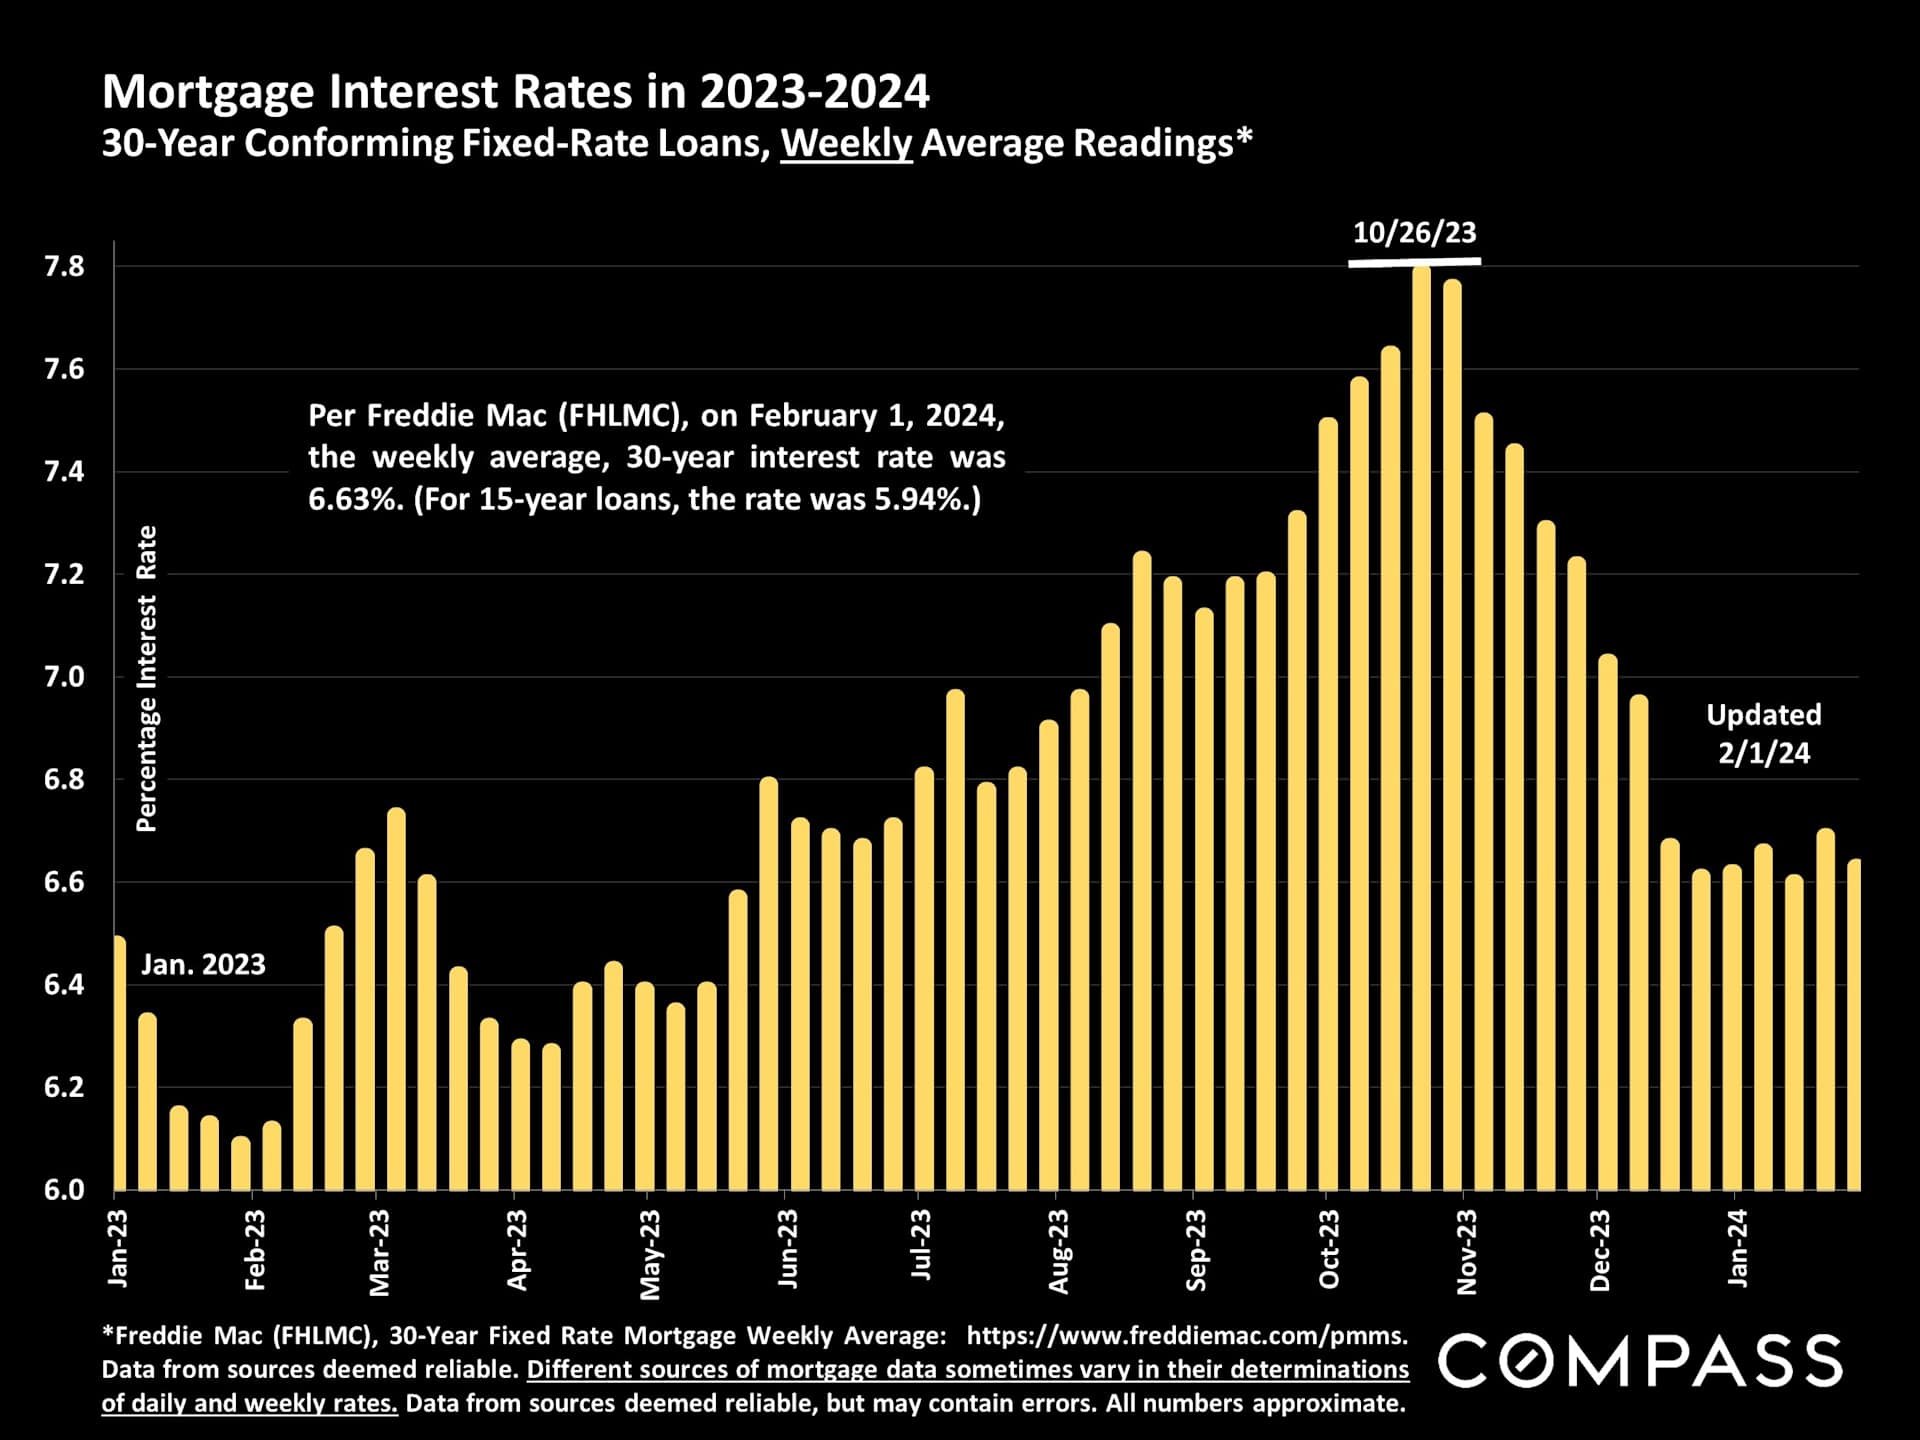
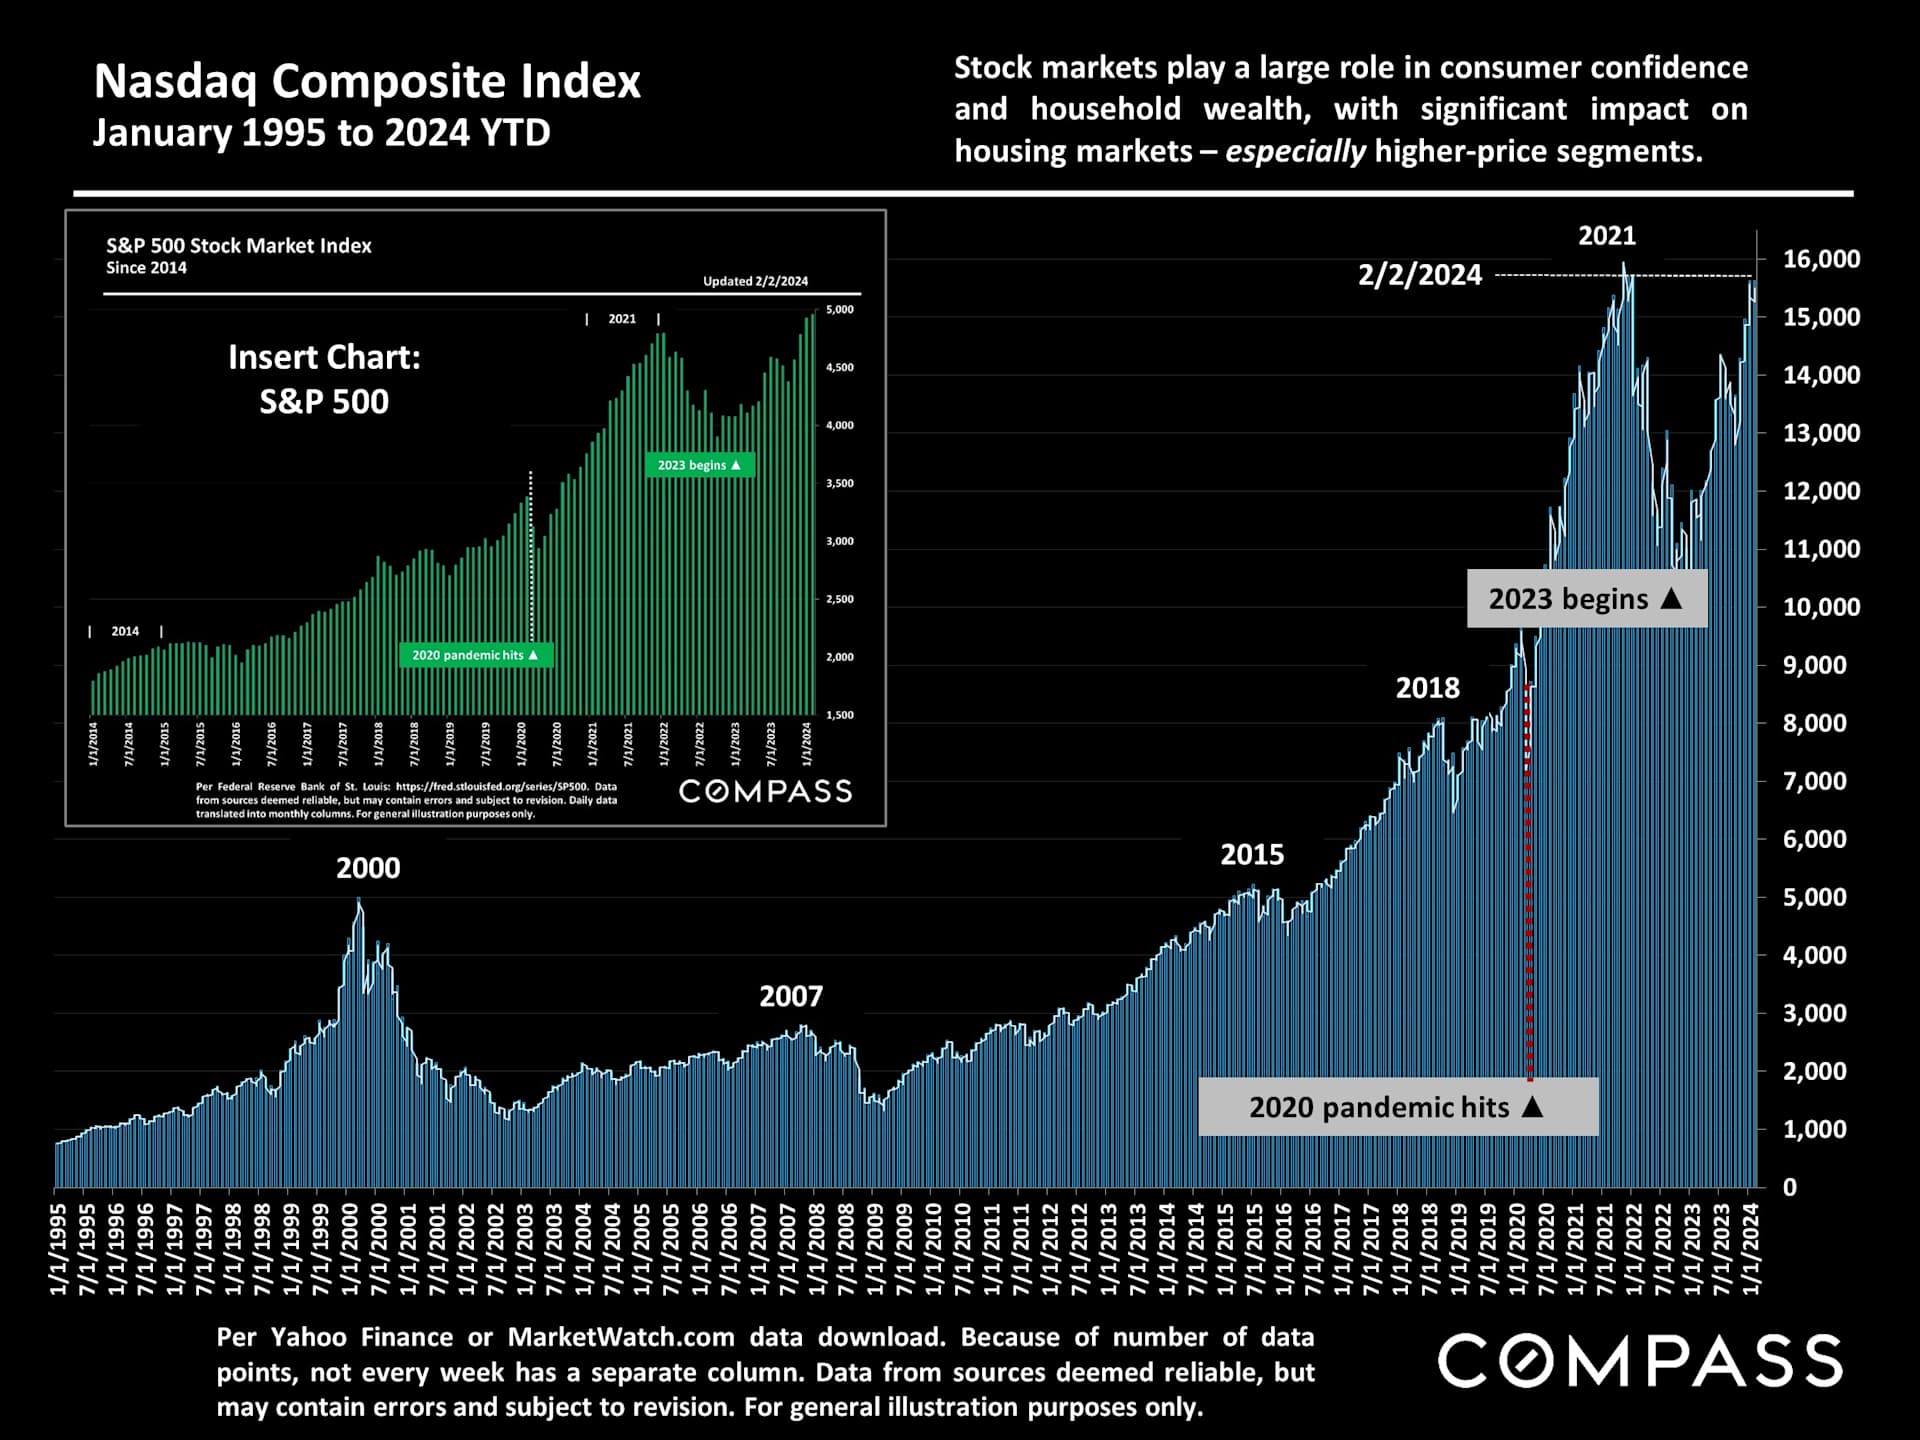
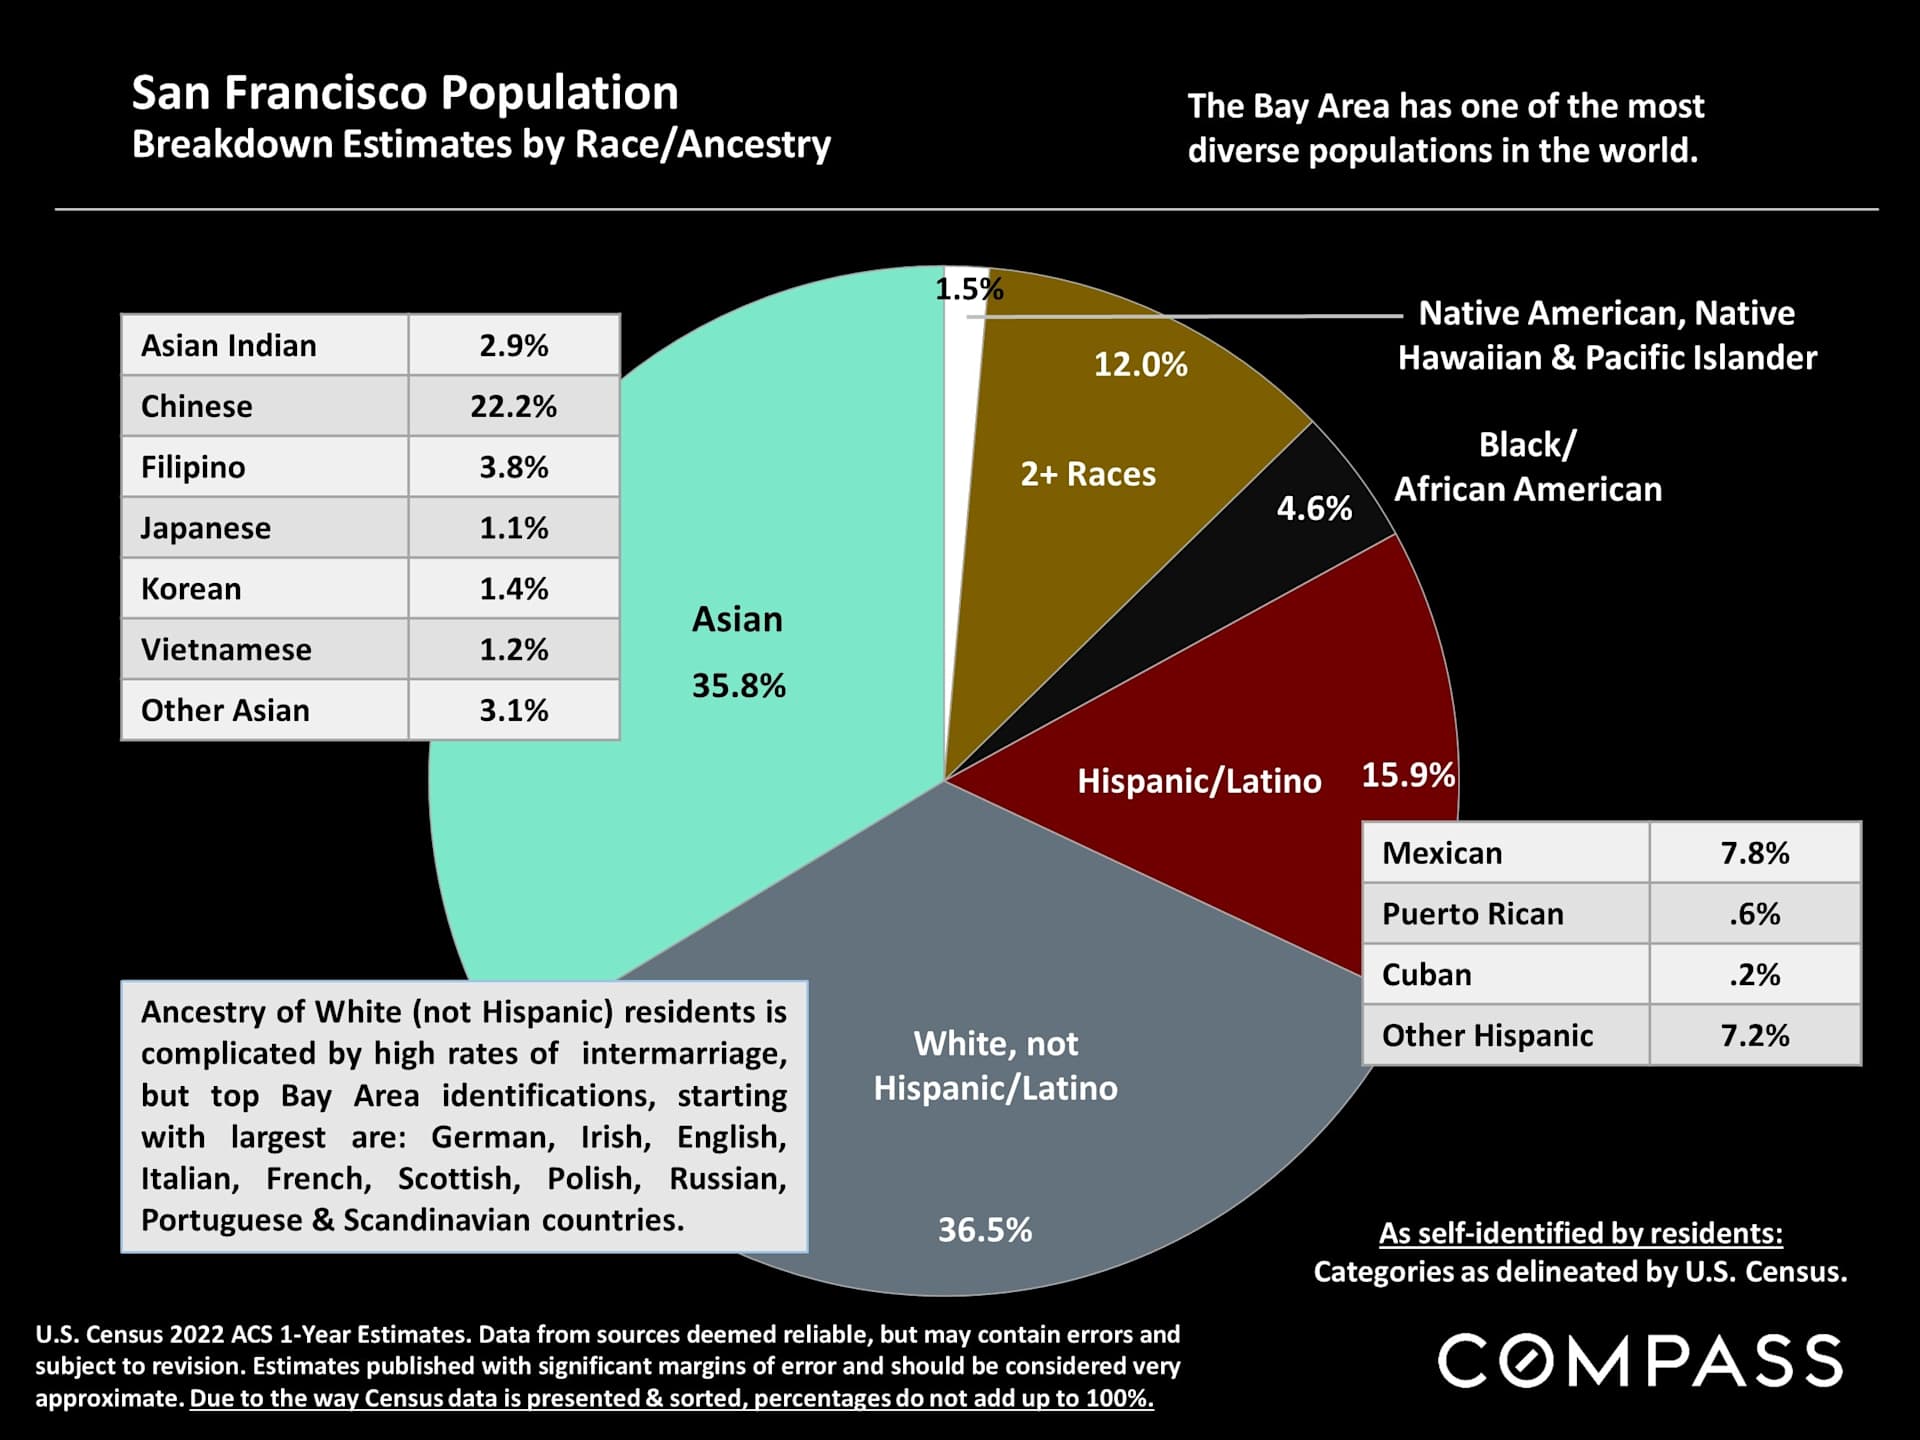
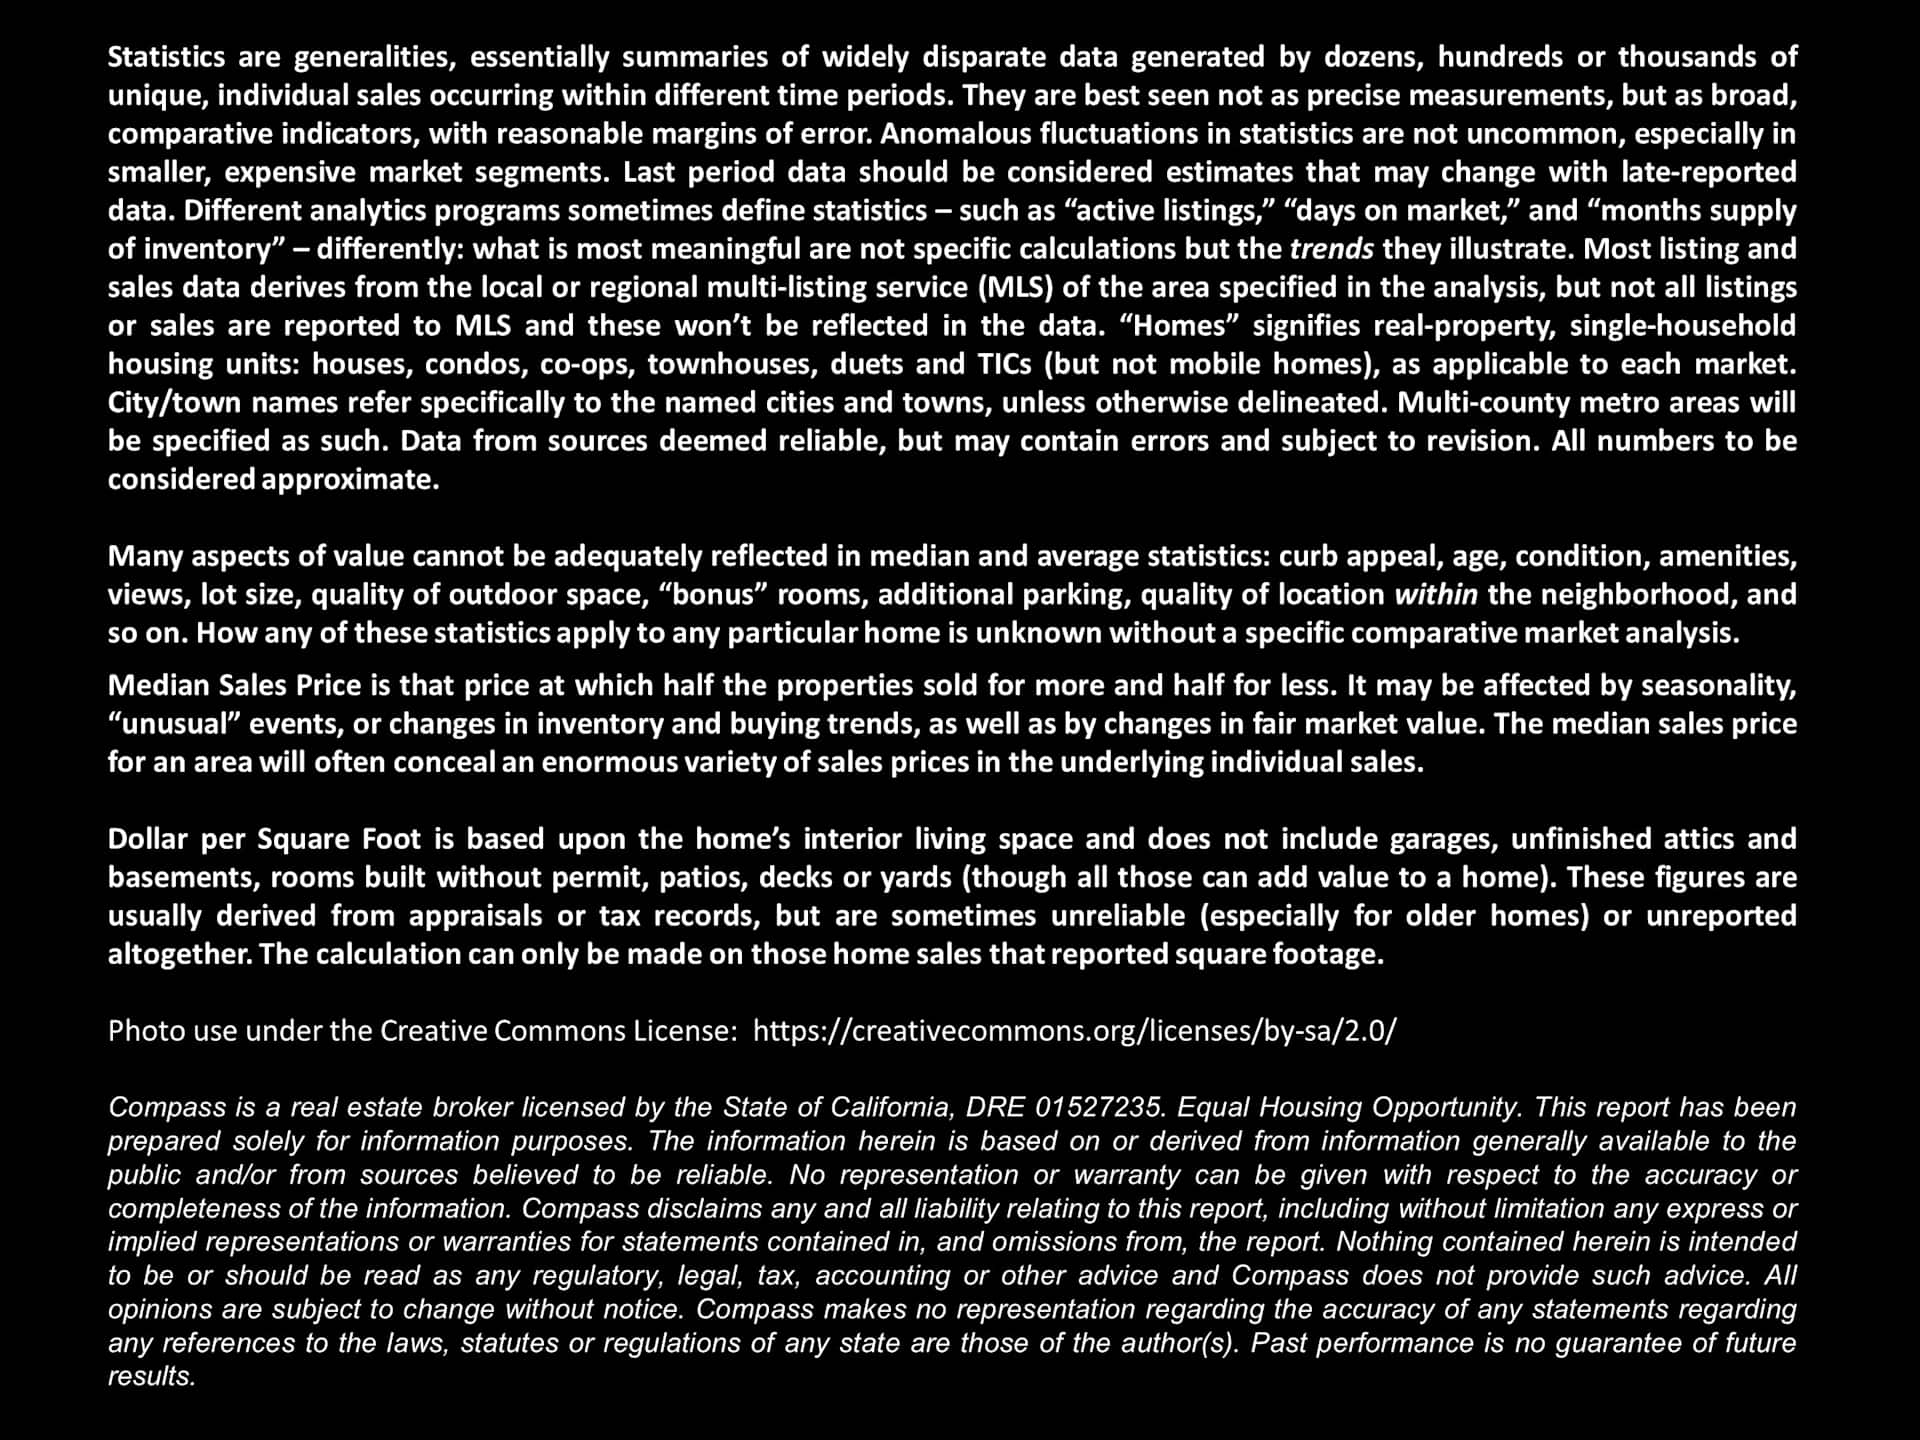
San Francisco real estate market report describing rising activity, low house inventory, and January sales statistics.Market outlook graphic with economic and California housing forecasts, including quotes from Freddie Mac and CAR.Chart of San Francisco monthly new listings from December 2019 to January 2024, showing seasonal peaks and December lows.Chart of San Francisco listings going under contract, showing seasonal peaks and lower activity through January 2024.Chart of San Francisco median house prices from 1990 to January 2024, with peaks near $2 million in 2022.Chart of San Francisco median condo prices from 2005 to January 2024, with a 2022 peak and recent decline.Chart comparing San Francisco condo prices downtown and elsewhere from 2005 through January 2024.Bar chart of San Francisco house sales by bedroom count and price segment.Bar chart compares San Francisco condo sales by bedroom count and price segment.San Francisco residential market table comparing February 2024 statistics by price range and property type.Bar chart of San Francisco active and coming-soon listings, February 2022–February 2024, with monthly totals and market notes.Chart of monthly San Francisco home sales, January 2020–January 2024, with green bars and seasonal annotations.Chart of San Francisco home sales over $3 million from 2020 to January 2024, split by price range.Chart comparing San Francisco house and condo sales by construction era, with house sales concentrated before 1960.Chart comparing San Francisco median home sizes and sale prices by construction era.Bar chart of San Francisco listing price reductions, with October peaks from 2018 to 2023 and a 2020 pandemic marker.Chart comparing San Francisco houses’ and condos’ average days on market from 2020 to January 2024.Chart of San Francisco home sales closing over list price, fluctuating from 2020 through January 2024.Chart comparing San Francisco house and condo sale prices against original list prices, 2020–January 2024.Bar chart of 2023–2024 mortgage rates, peaking near 7.8% in October before declining to about 6.6%.Nasdaq Composite chart from 1995 to 2024, with an inset S&P 500 chart and market event labels.Infographic of San Francisco population estimates by race and ancestry, with a pie chart and subgroup tables.Real estate market statistics definitions and Compass report disclaimers.

Work With Us

We will help you understand the complex aspects of the transaction and share our expertise so that you can make the best decisions possible. We are experienced, market savvy, and energetic. With both of us working for our clients, you get twice the amount of attention and insight.