
The SF Team, Eva + James, Compass

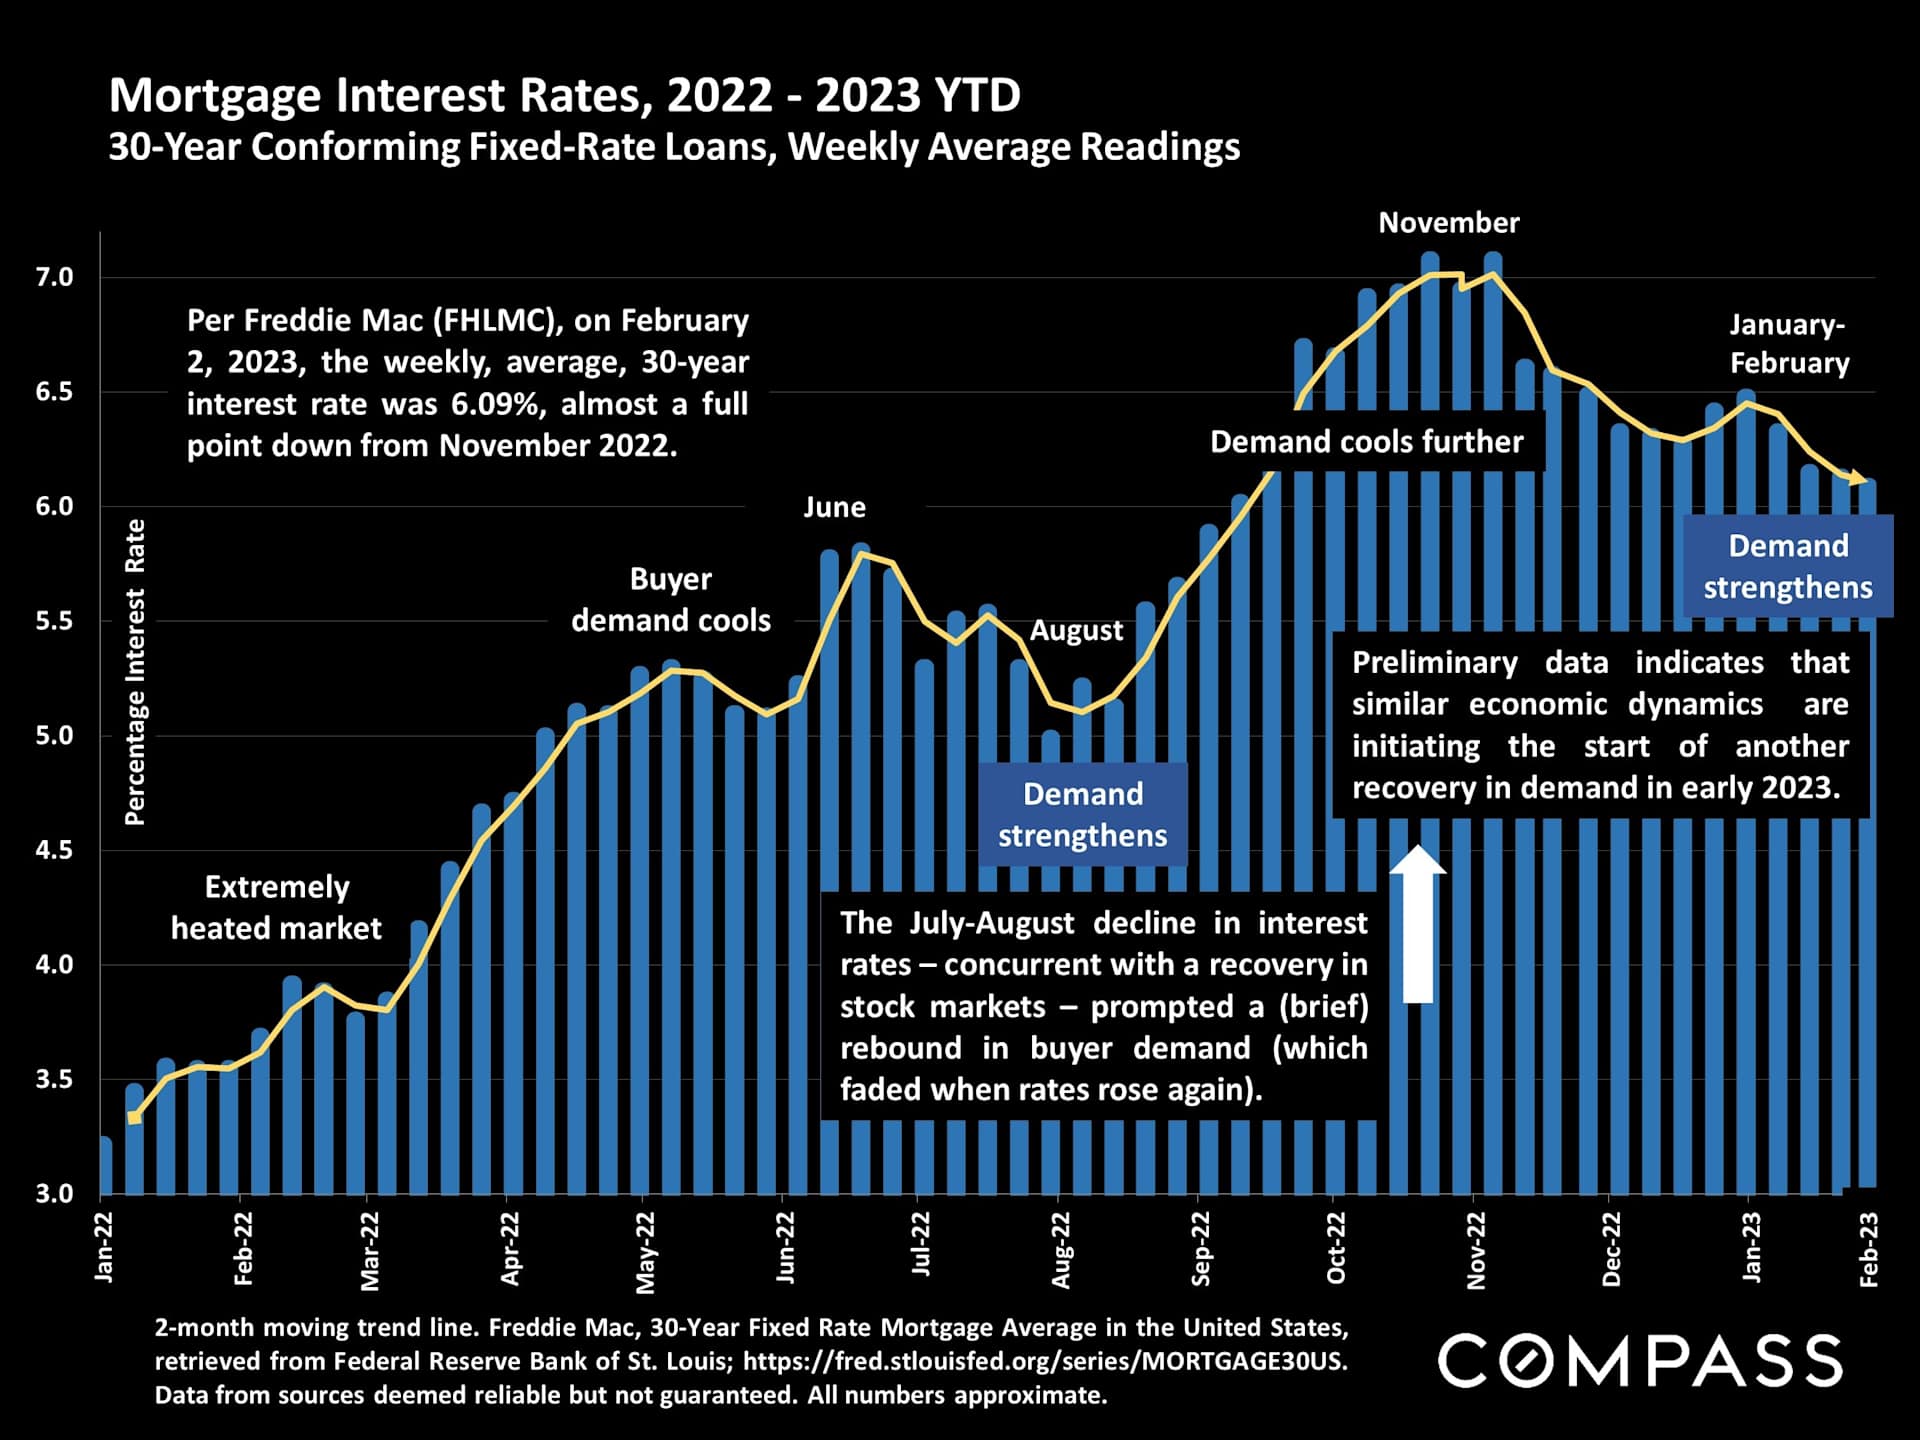
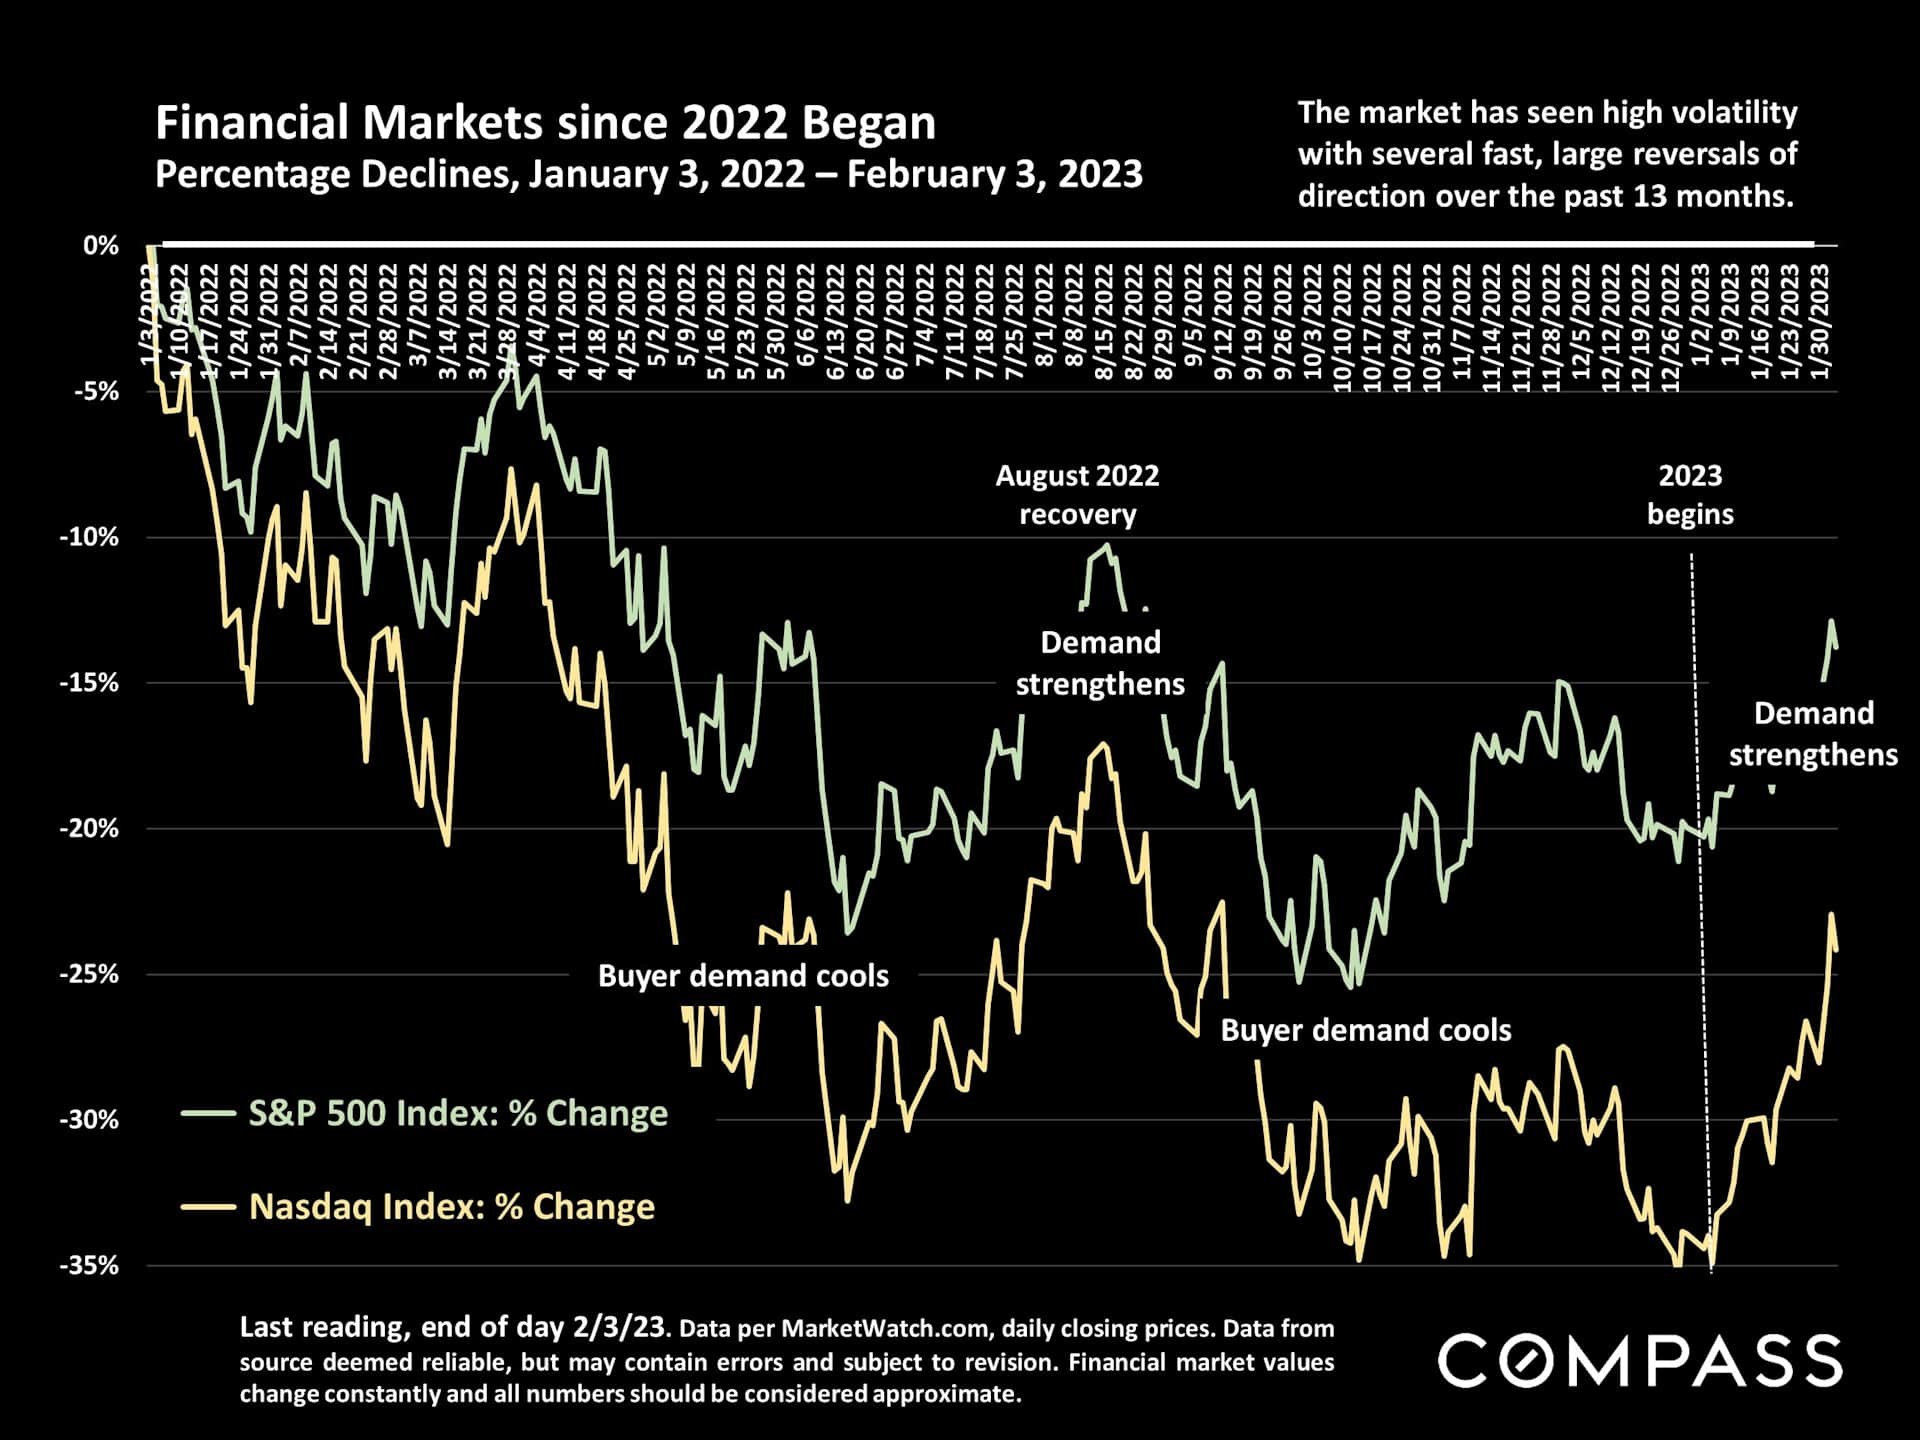
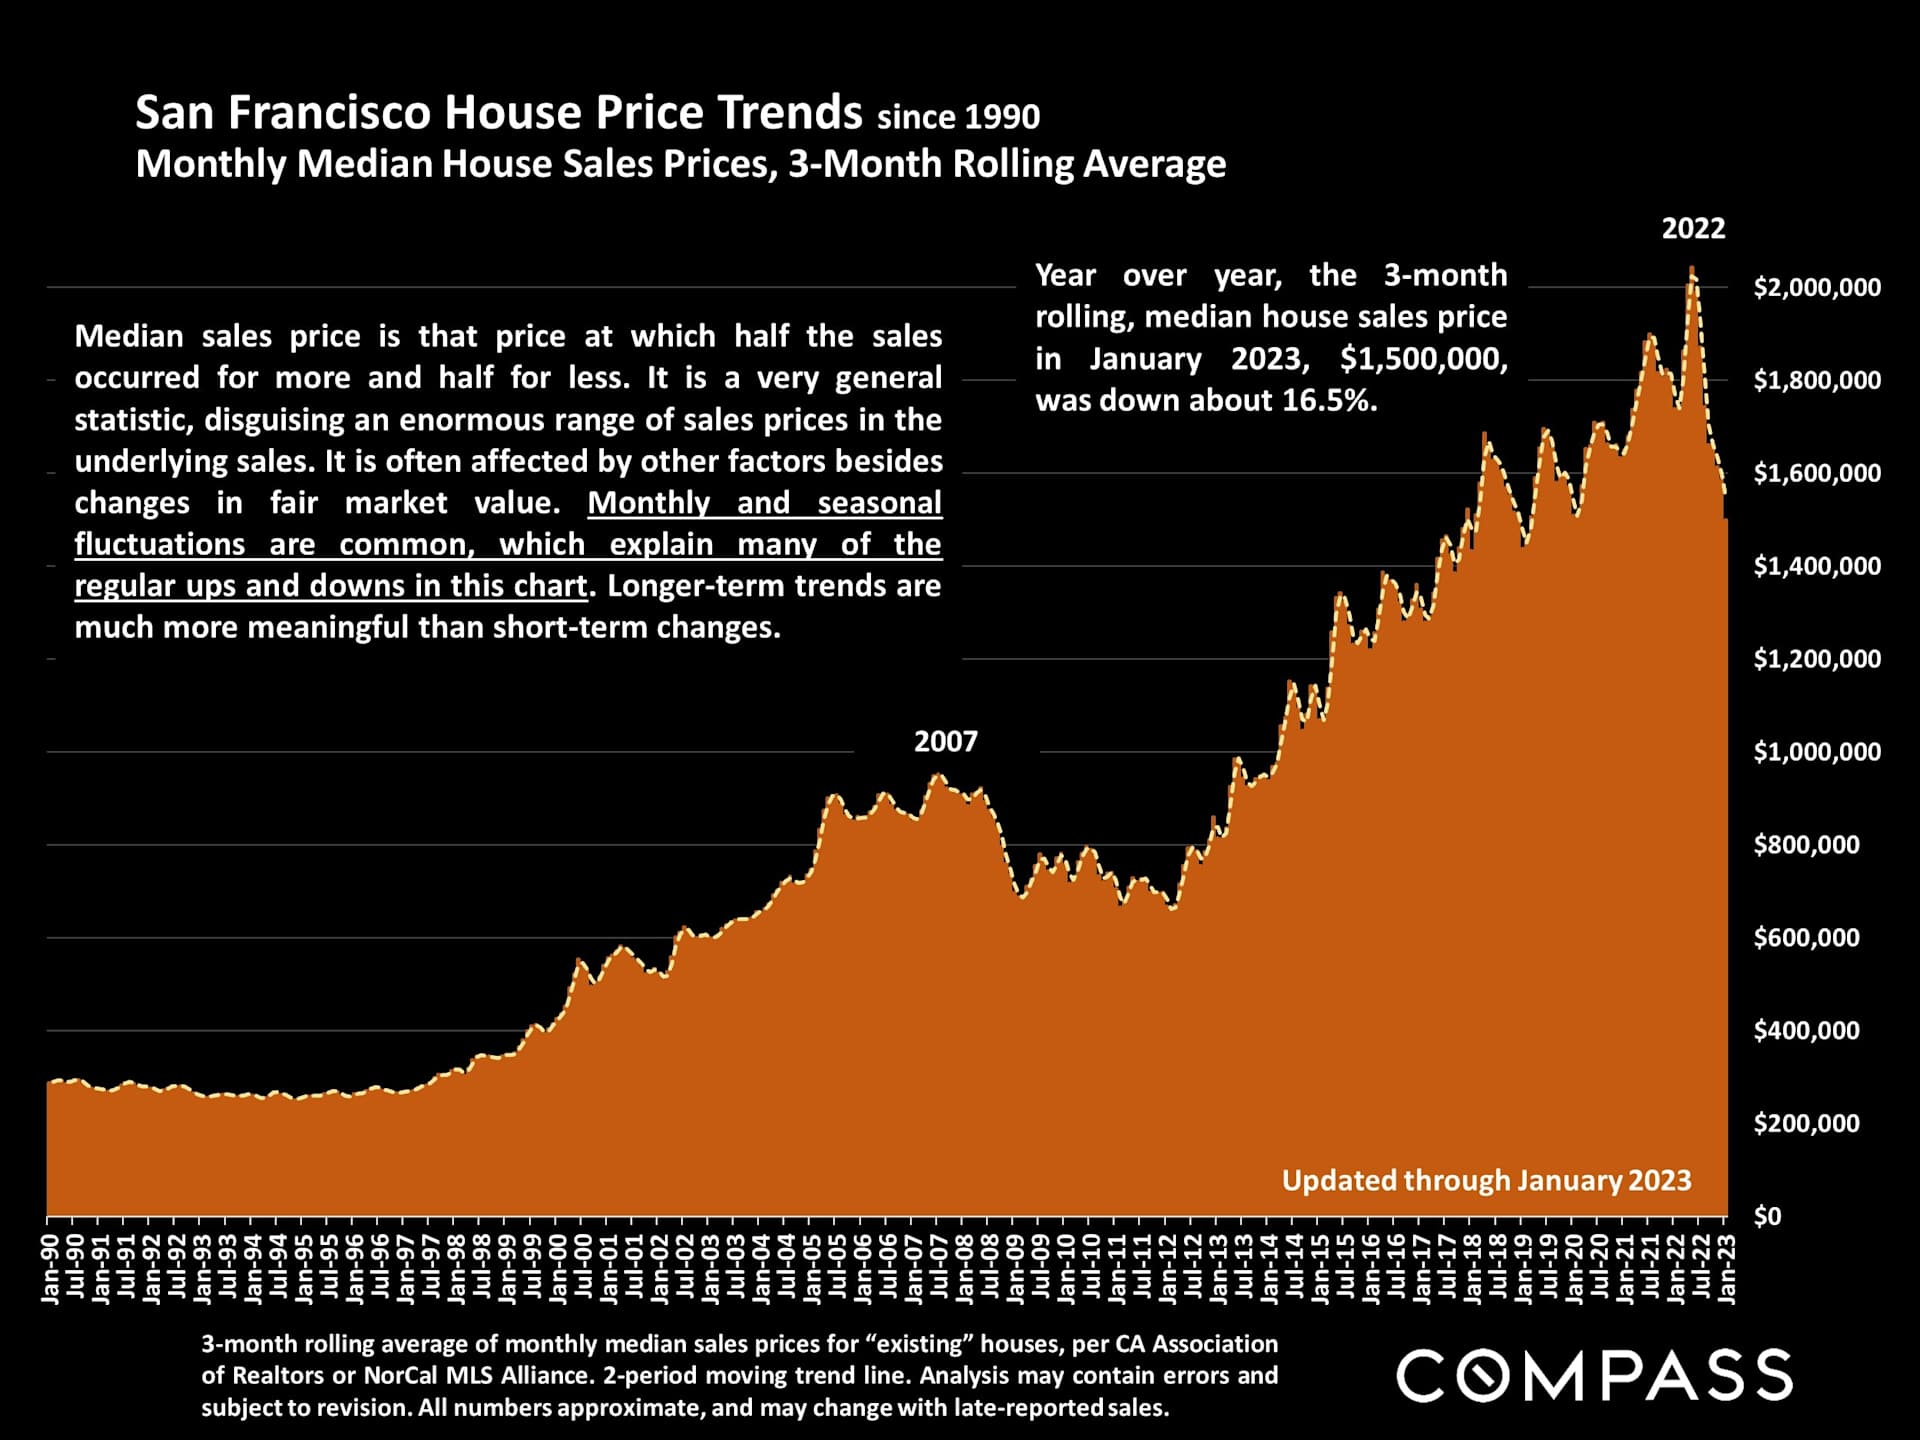
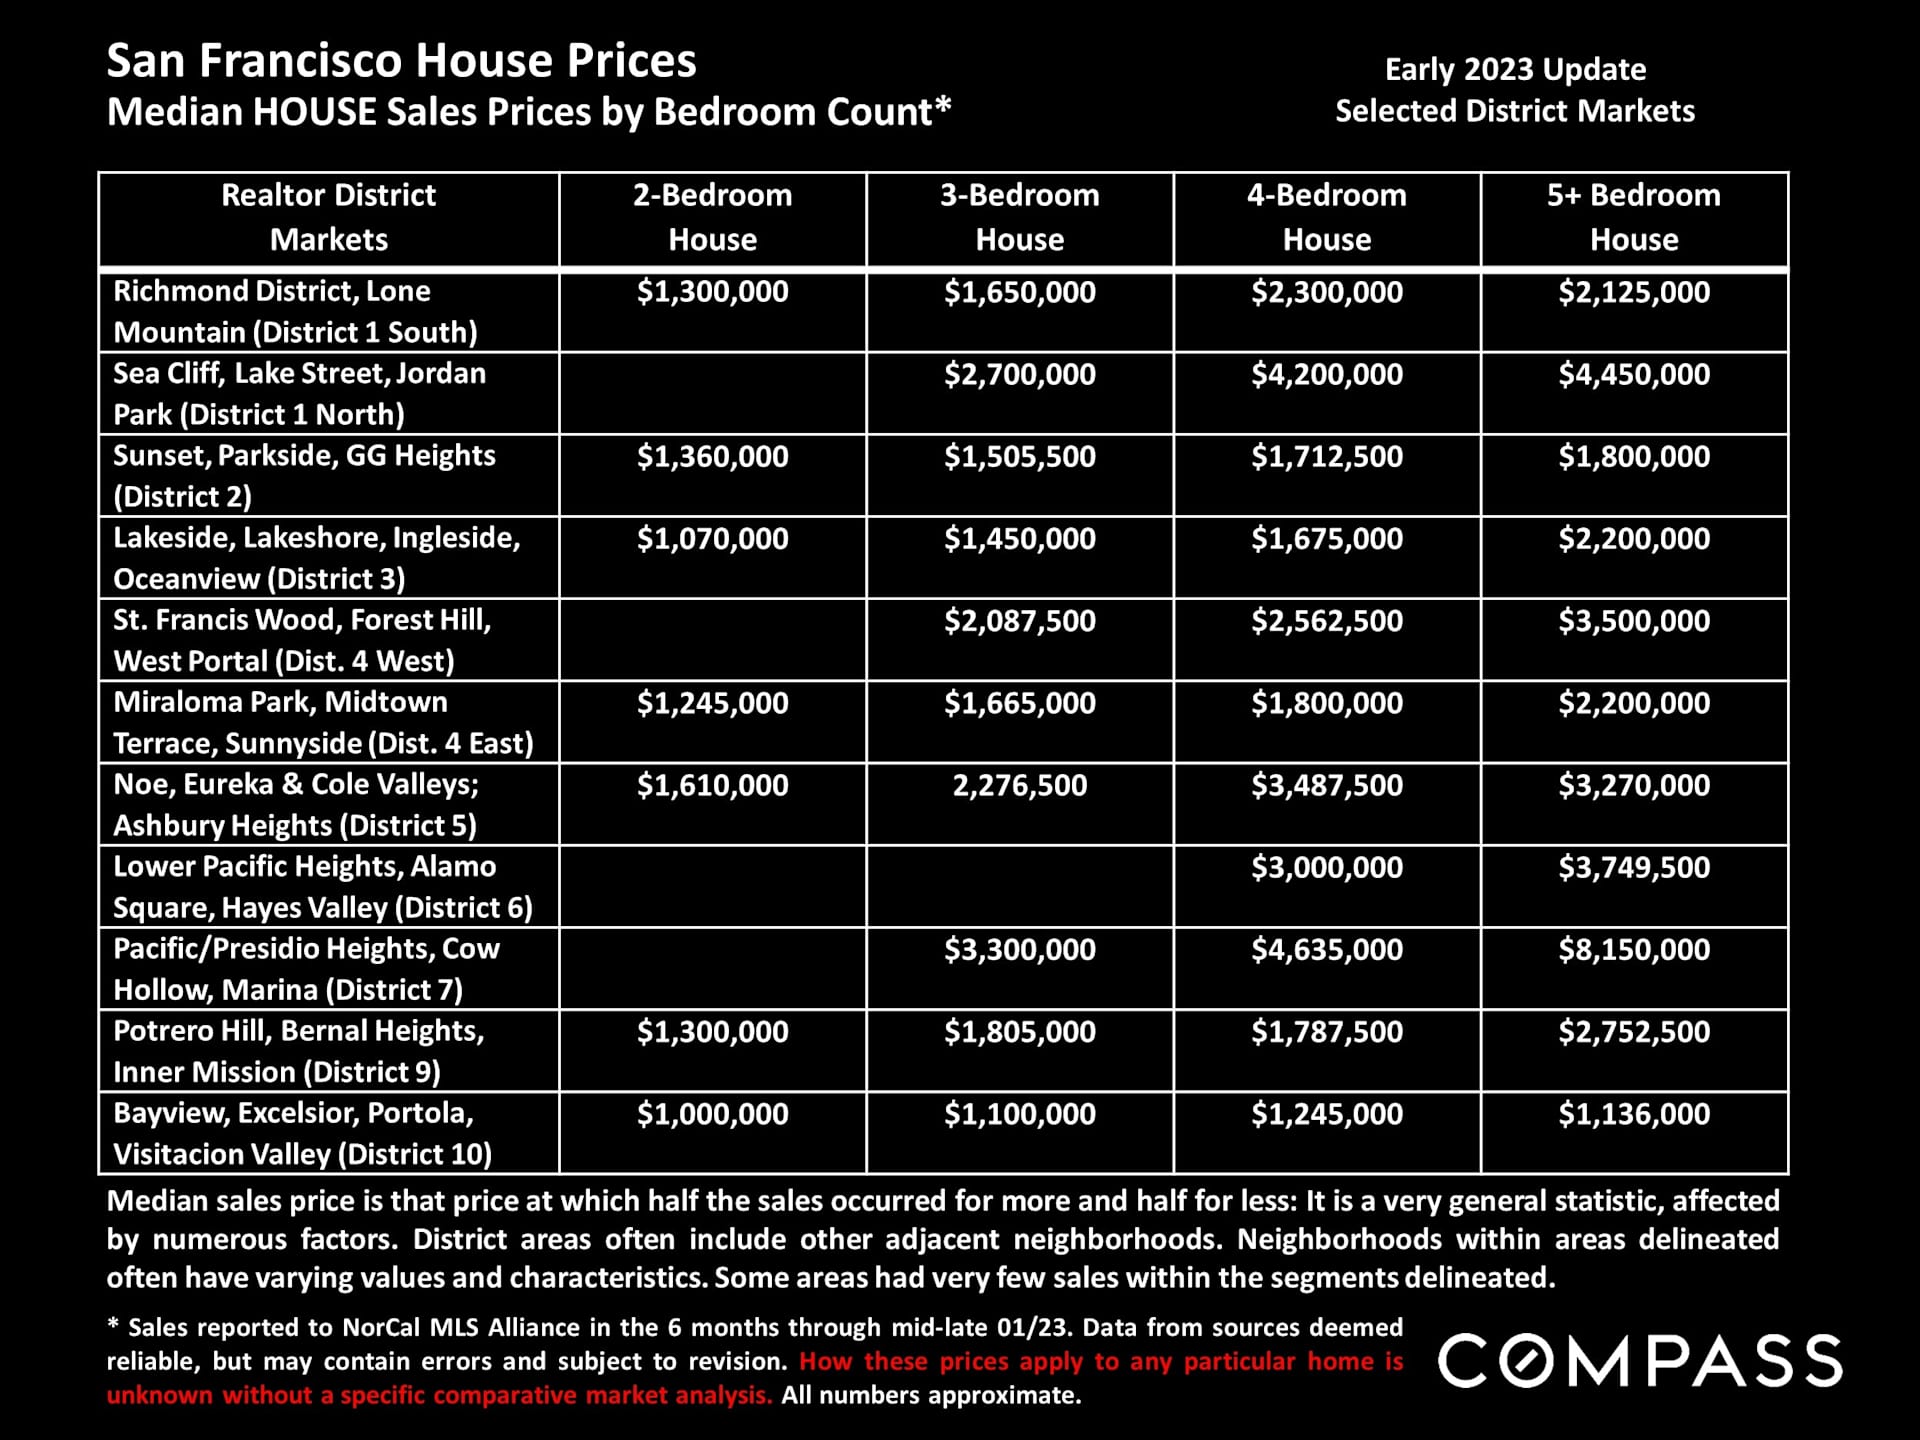
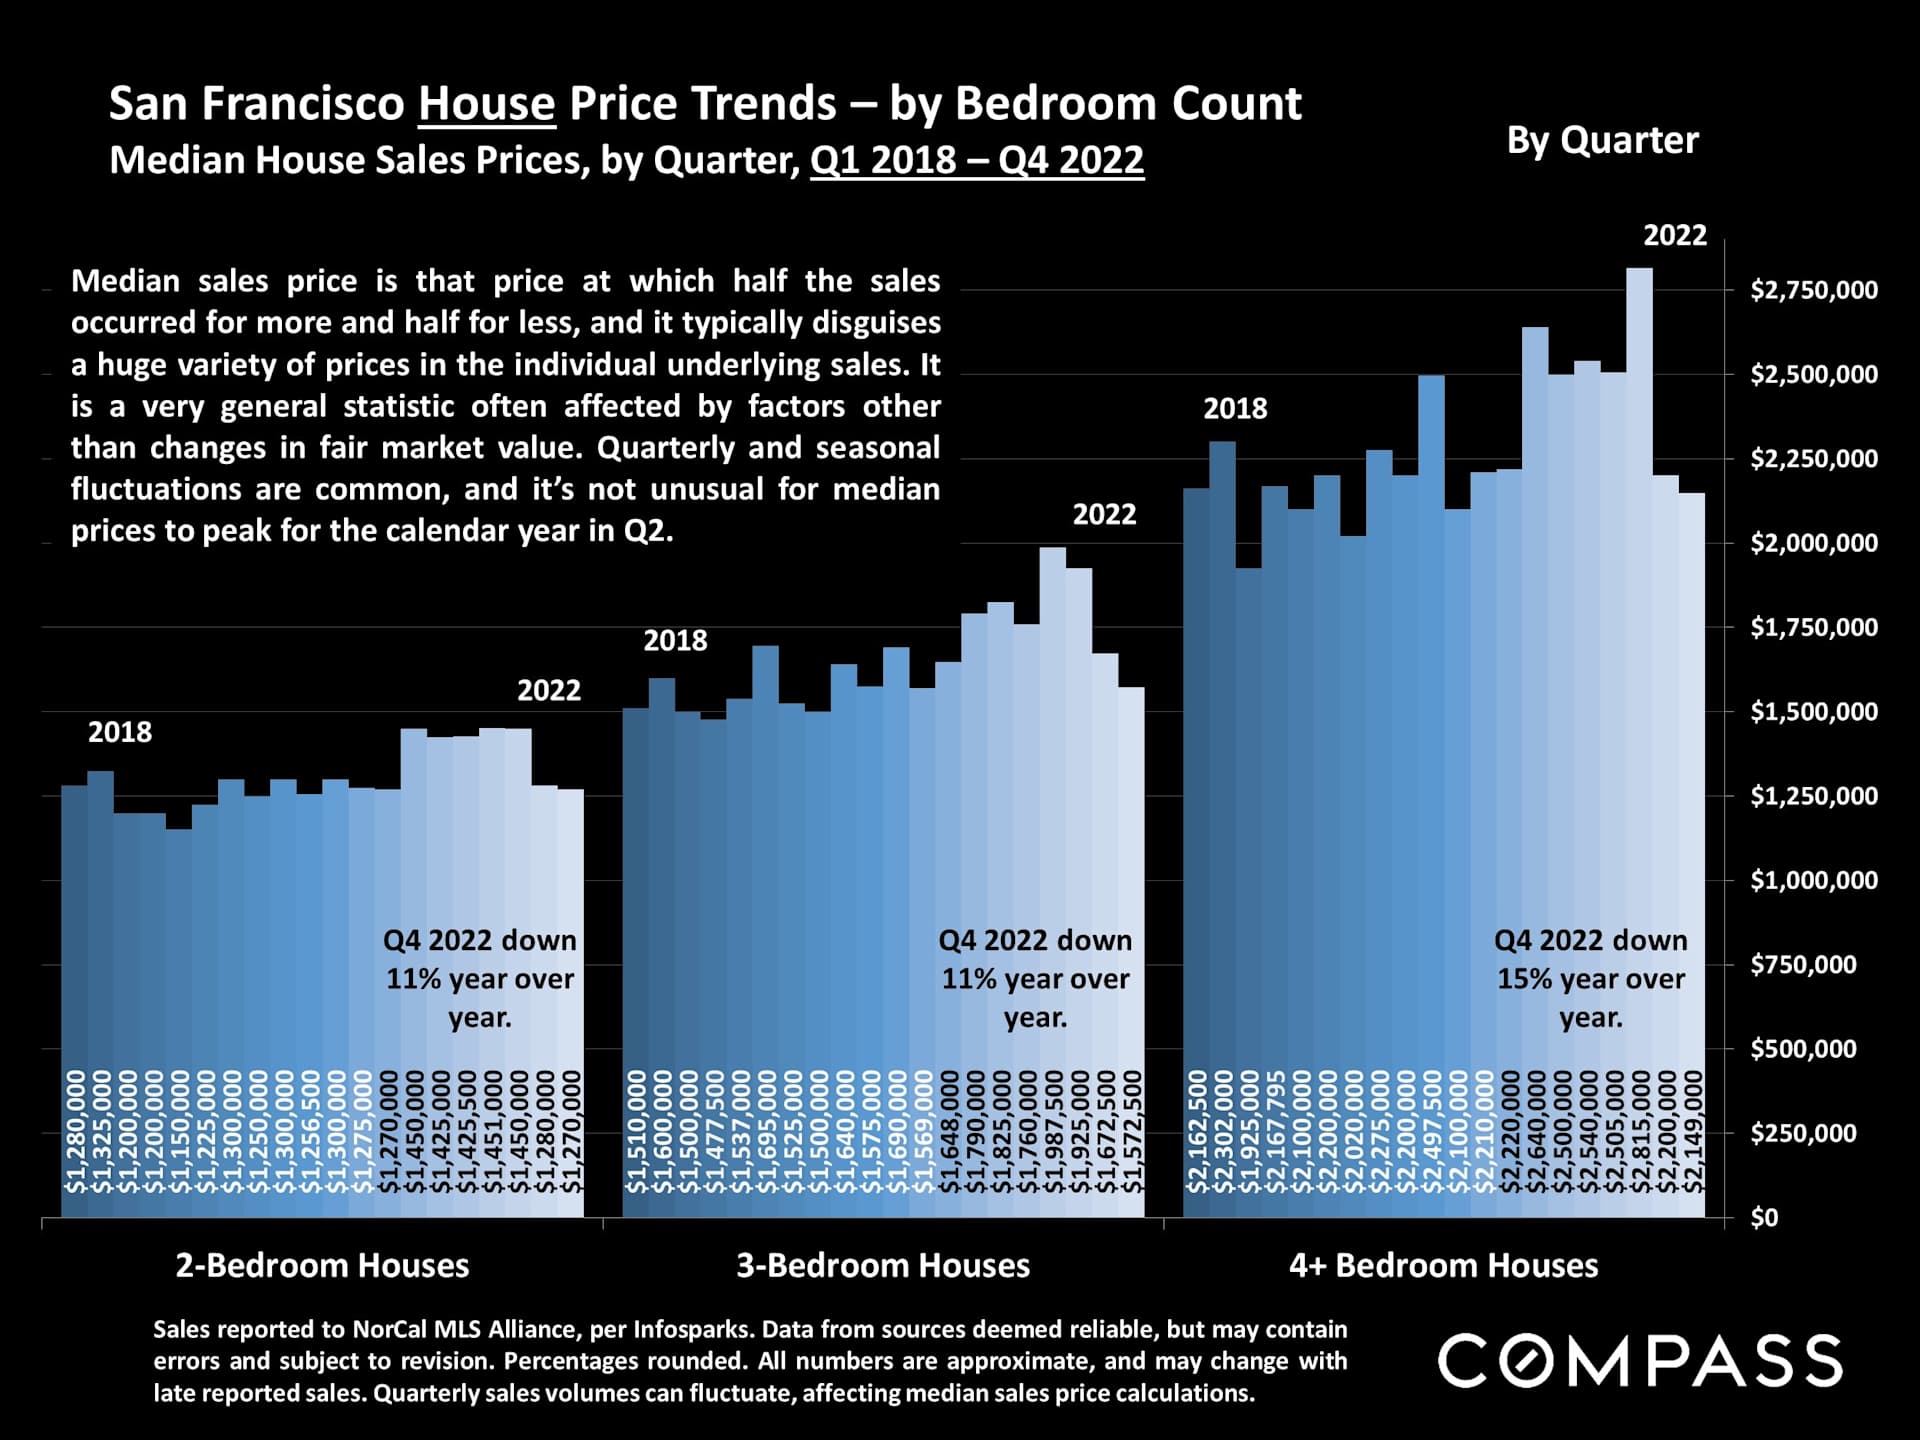
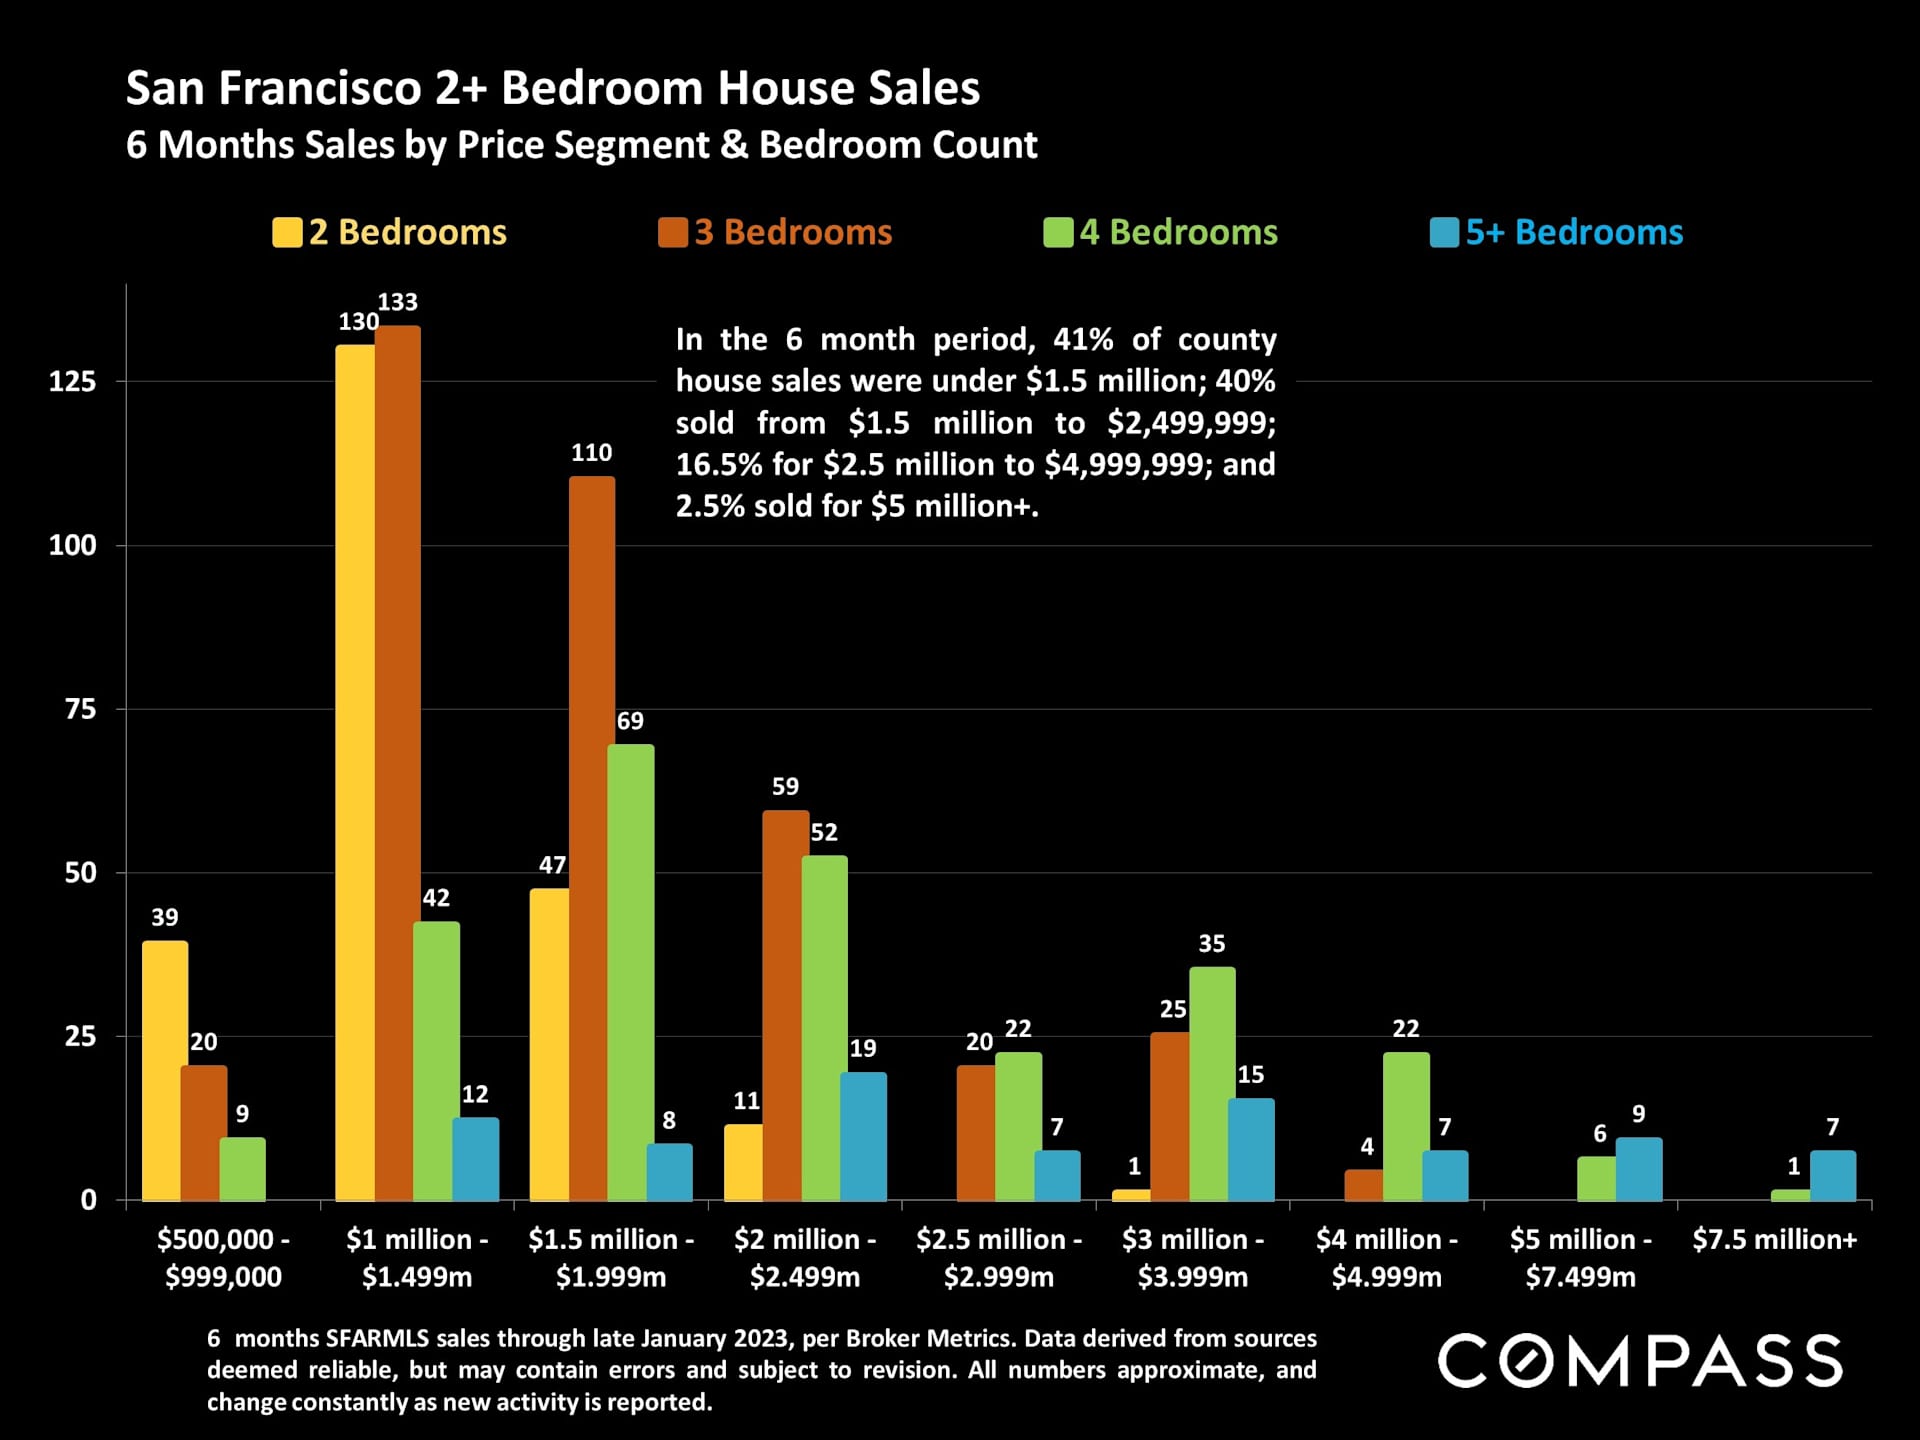
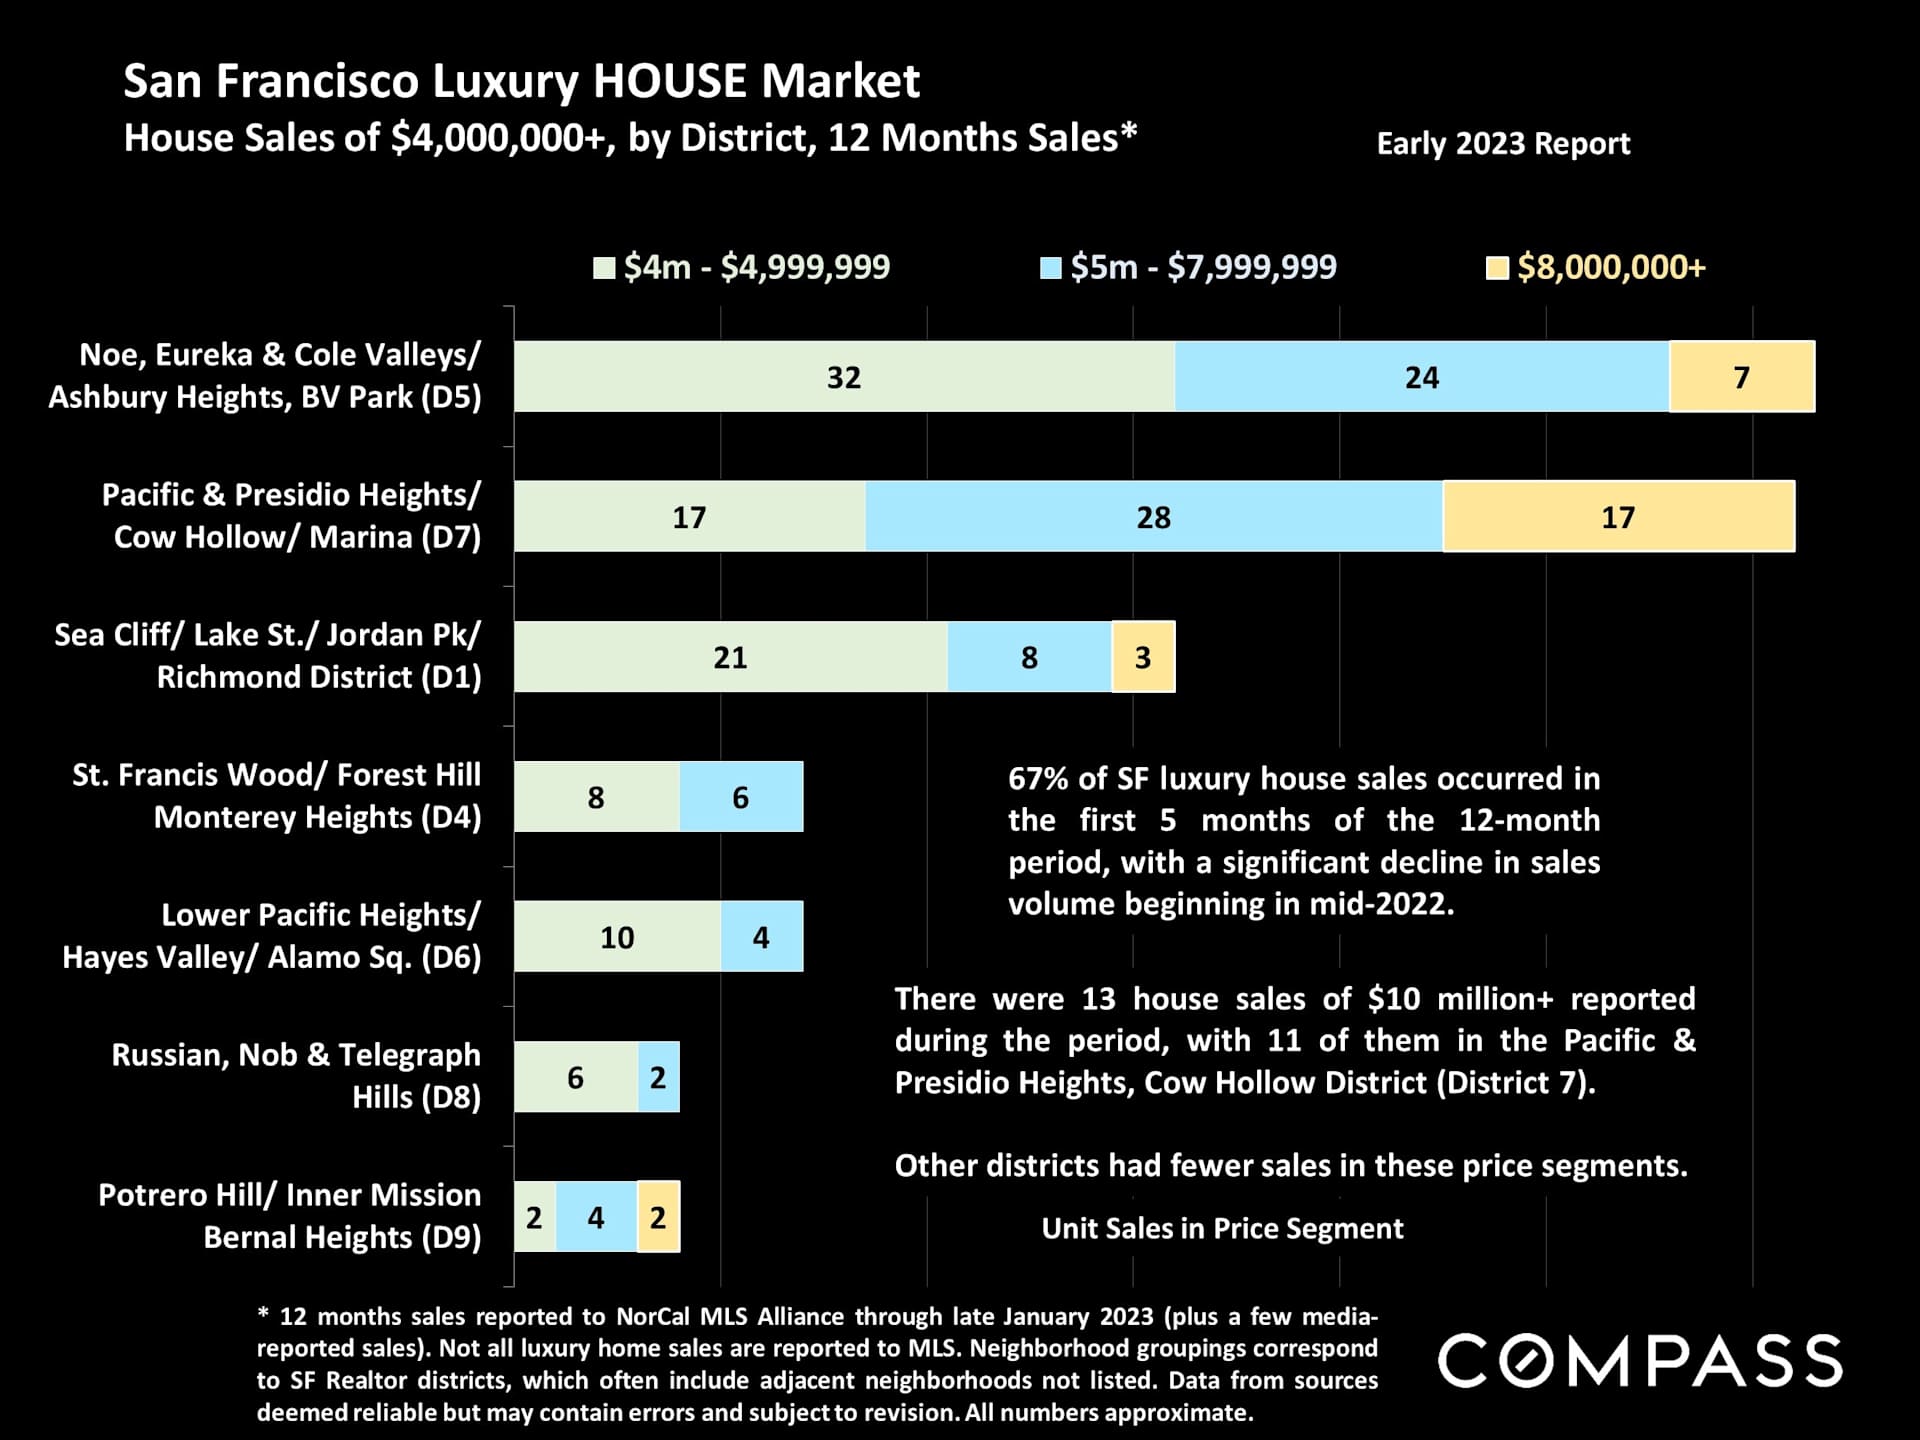
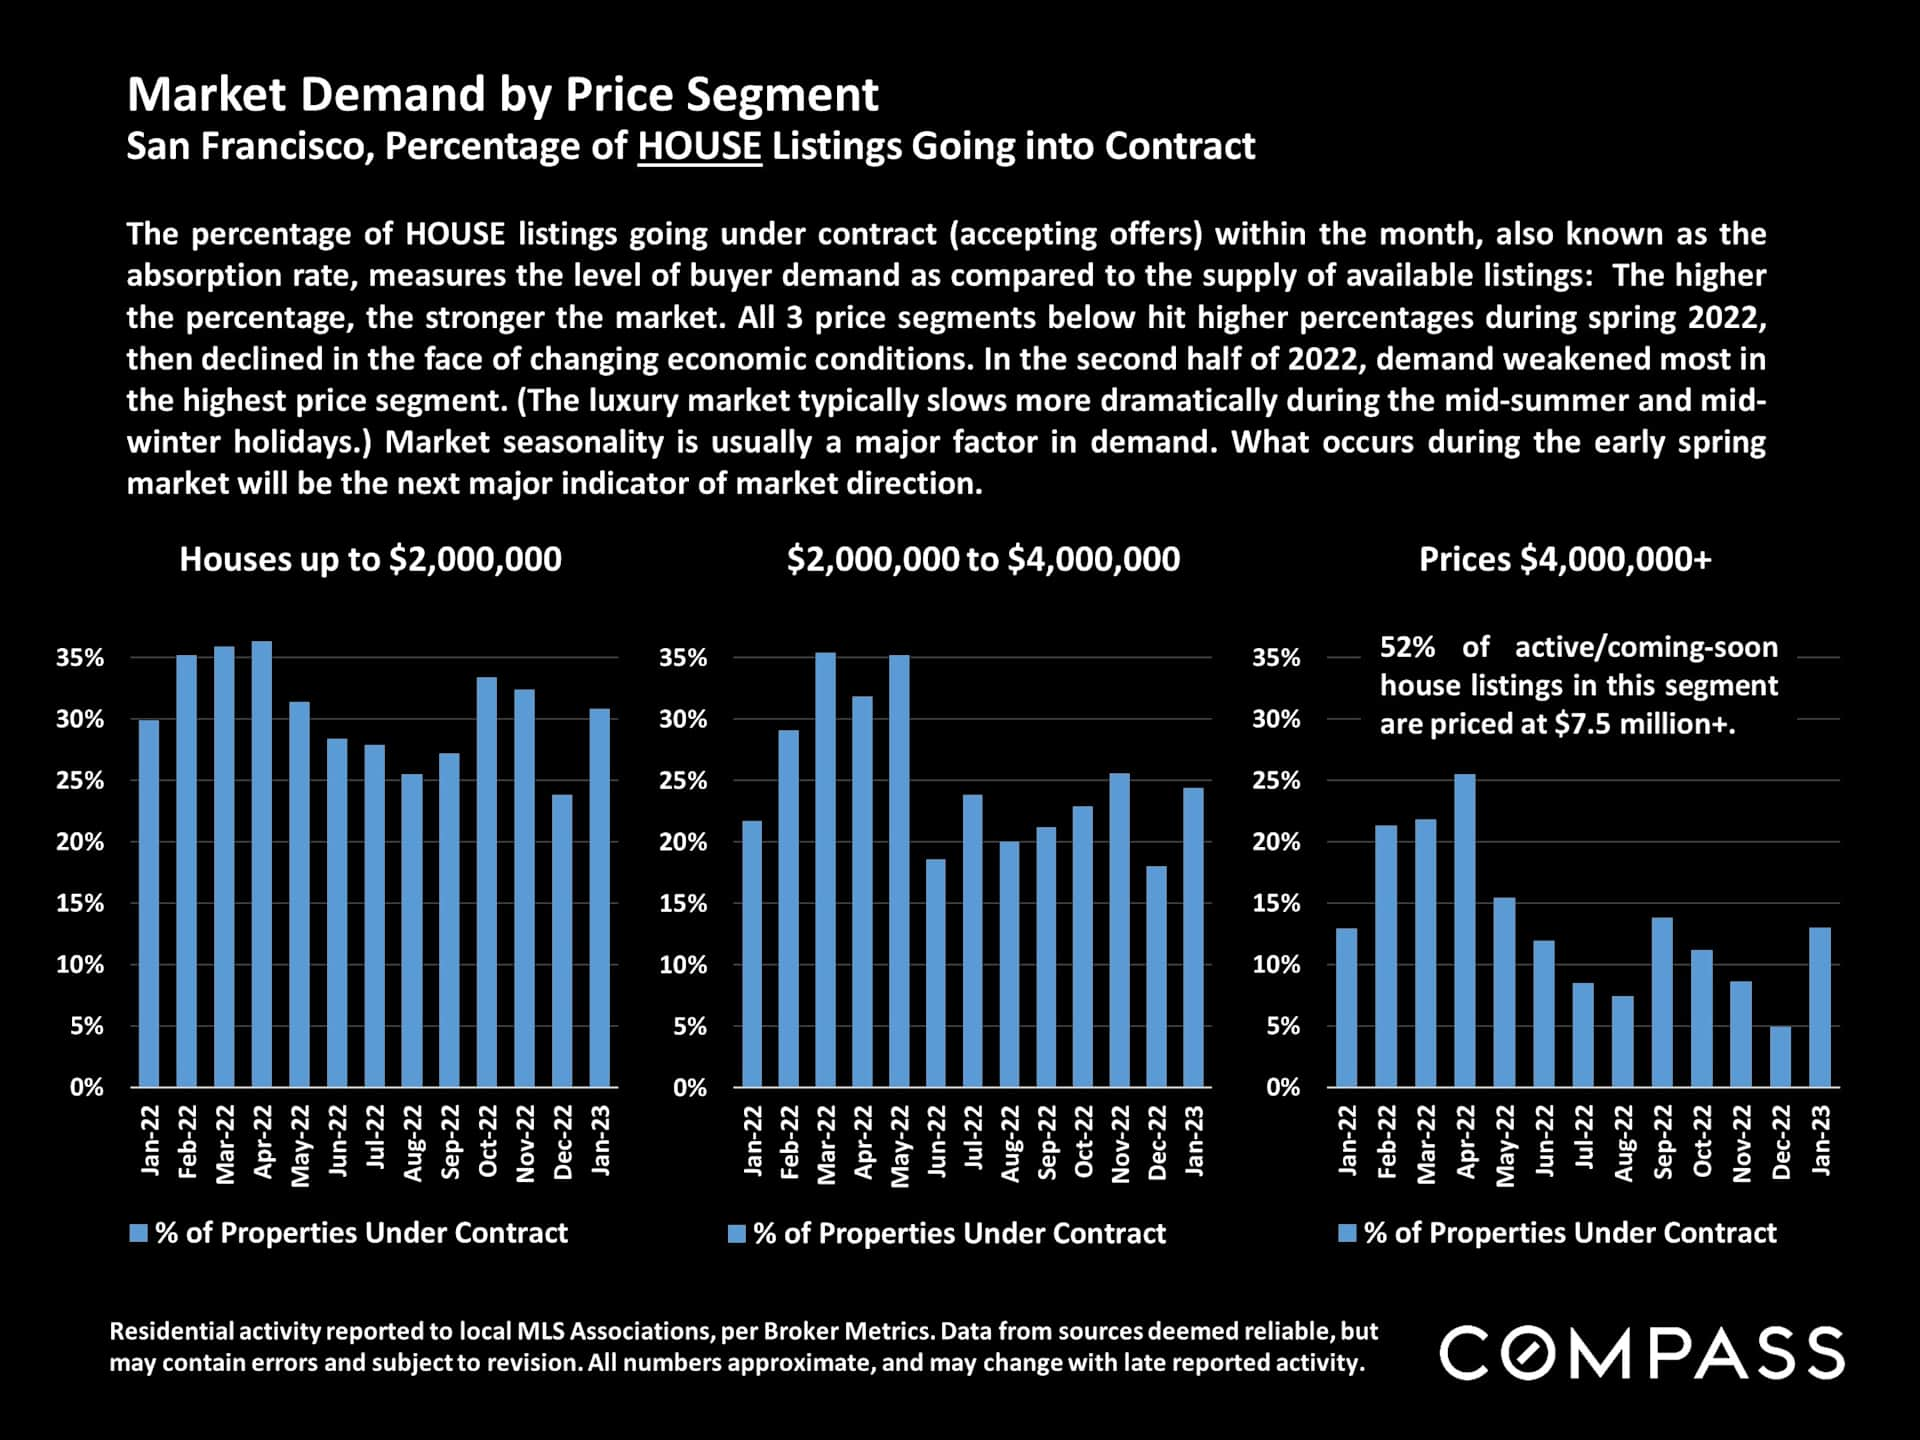
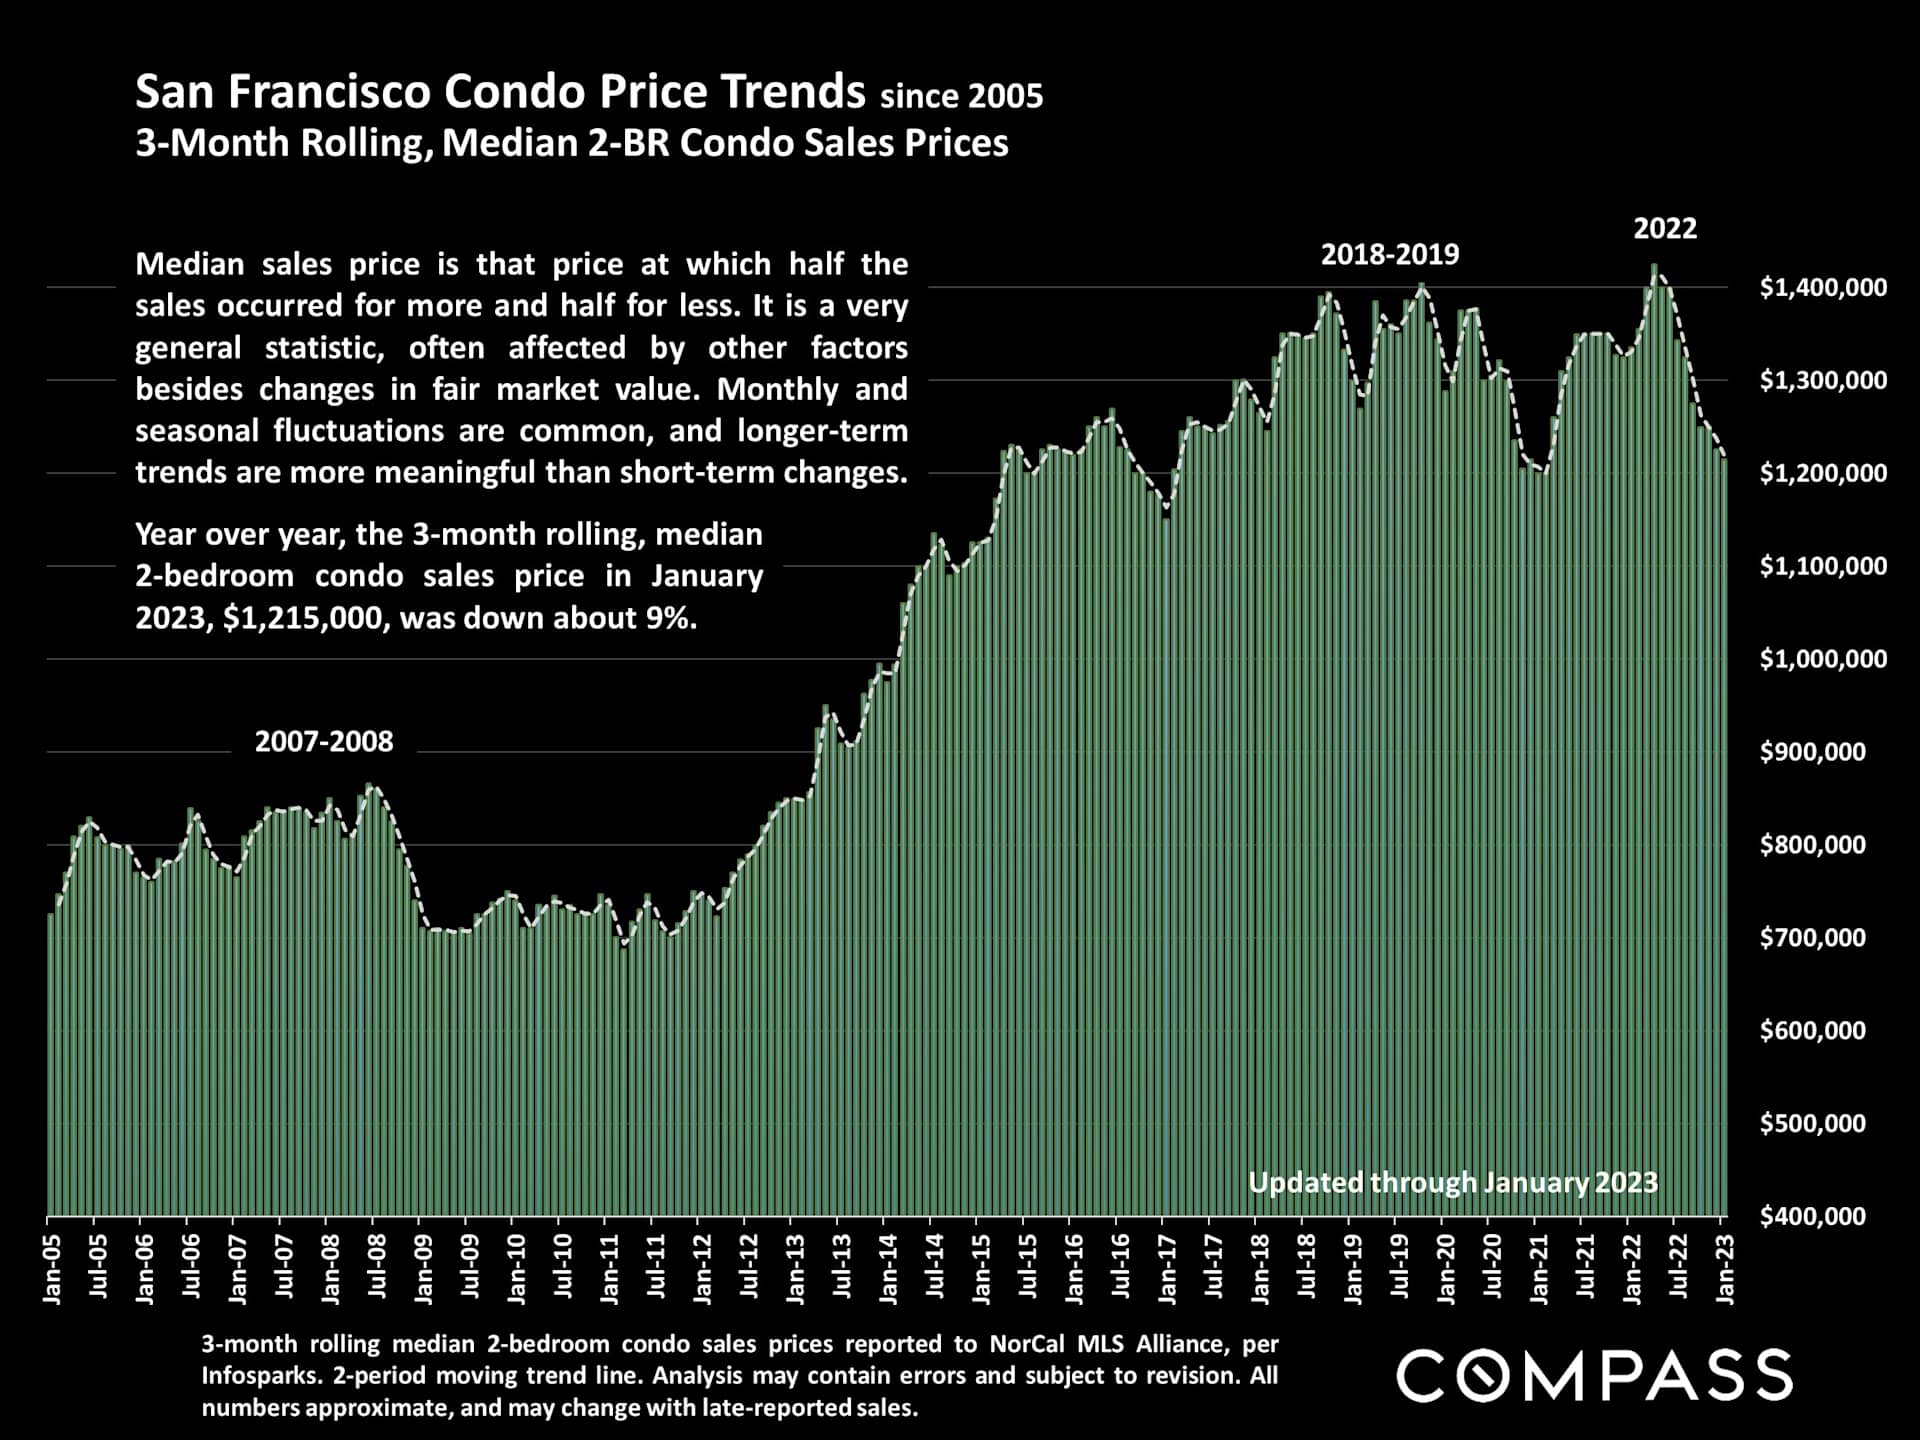
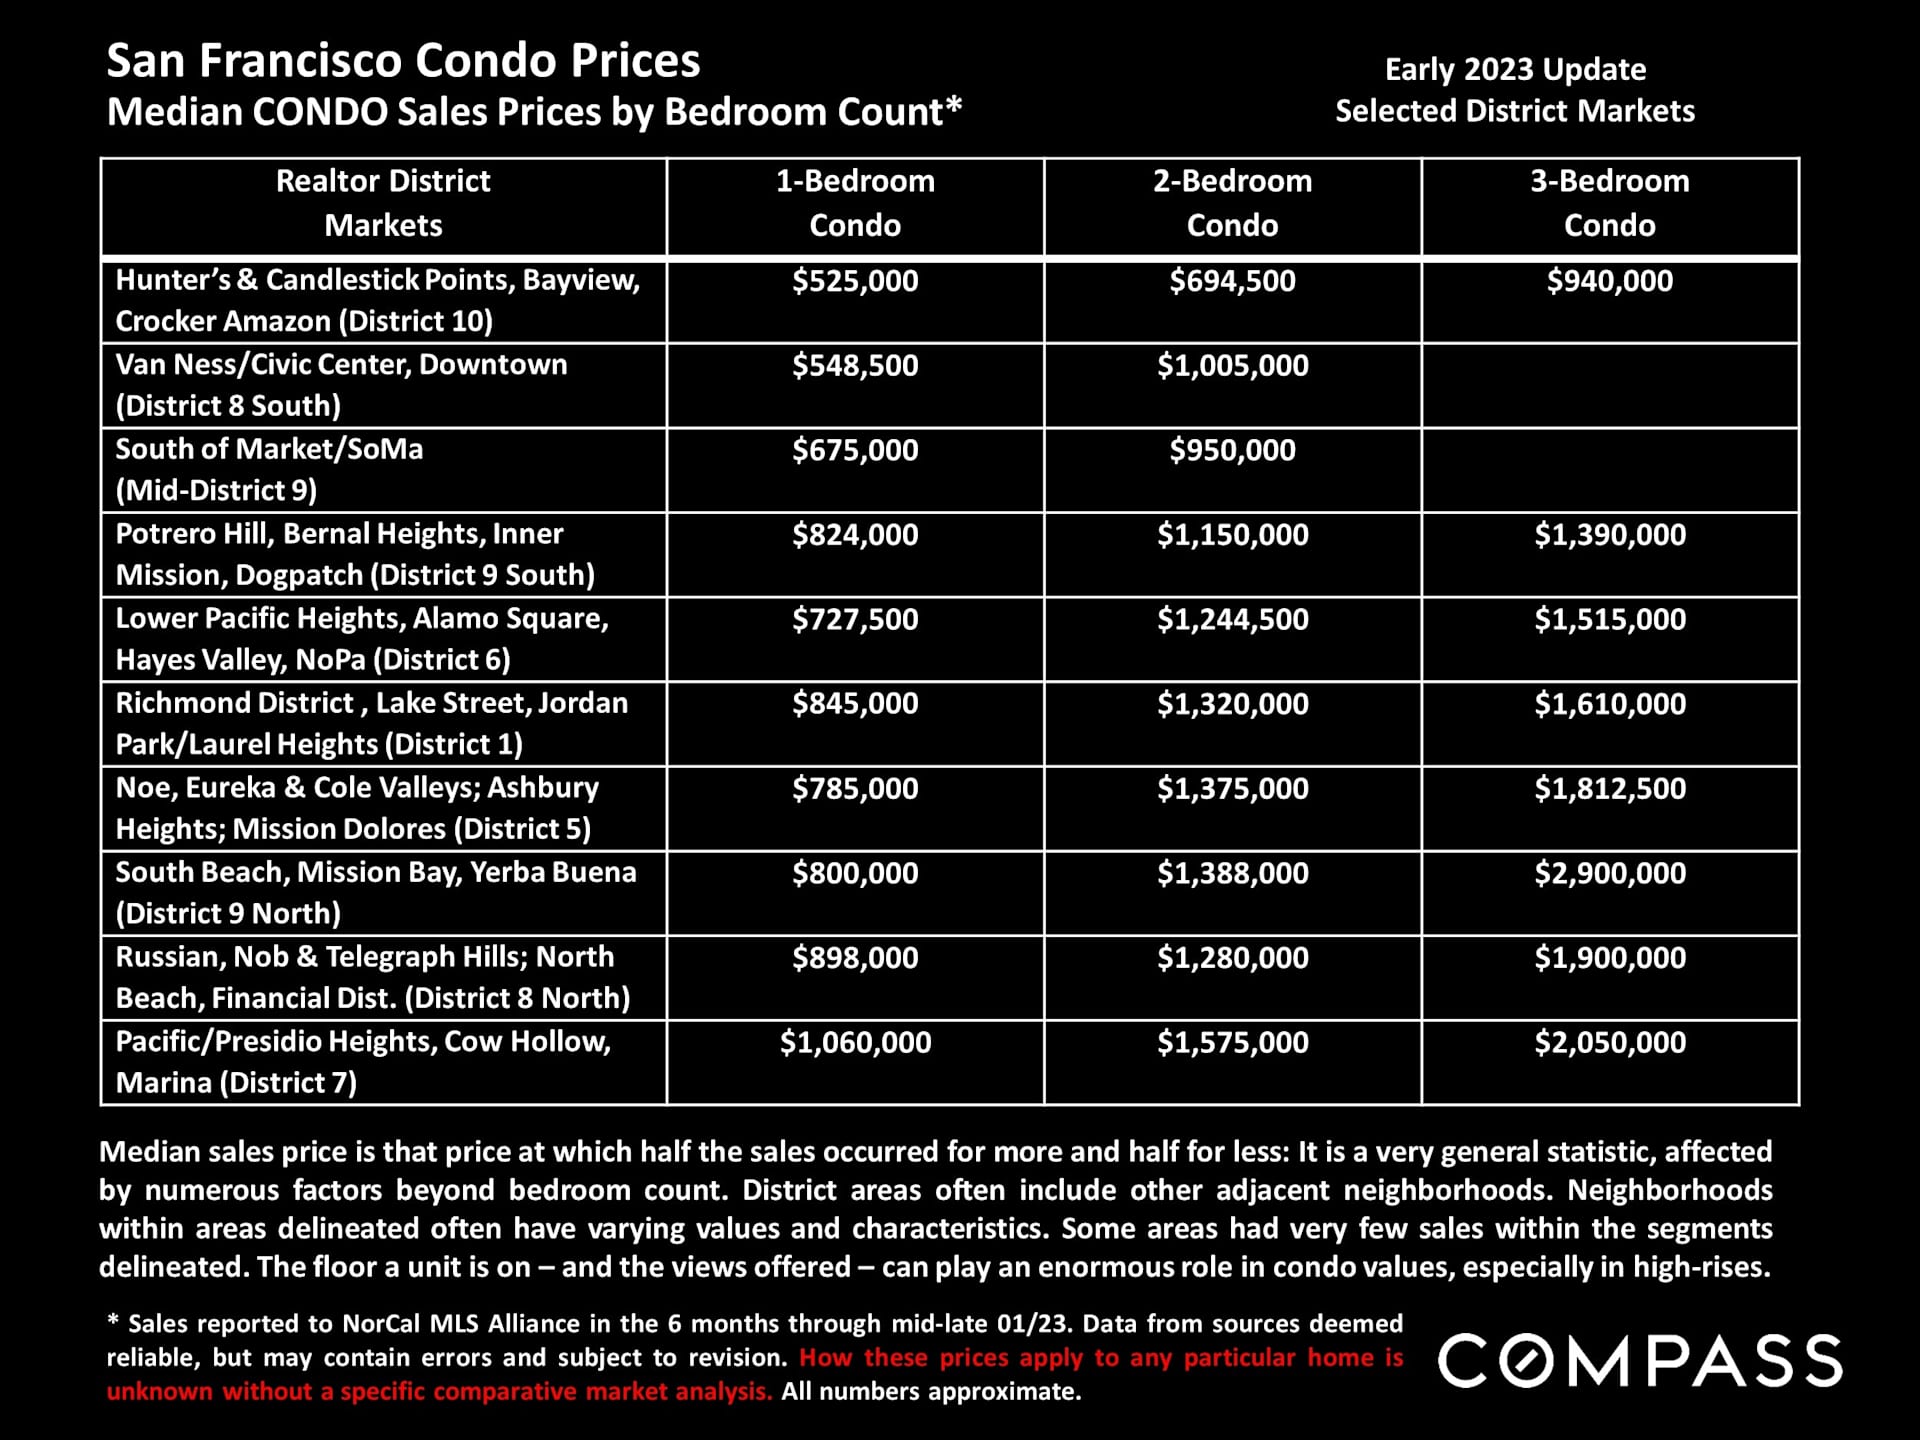
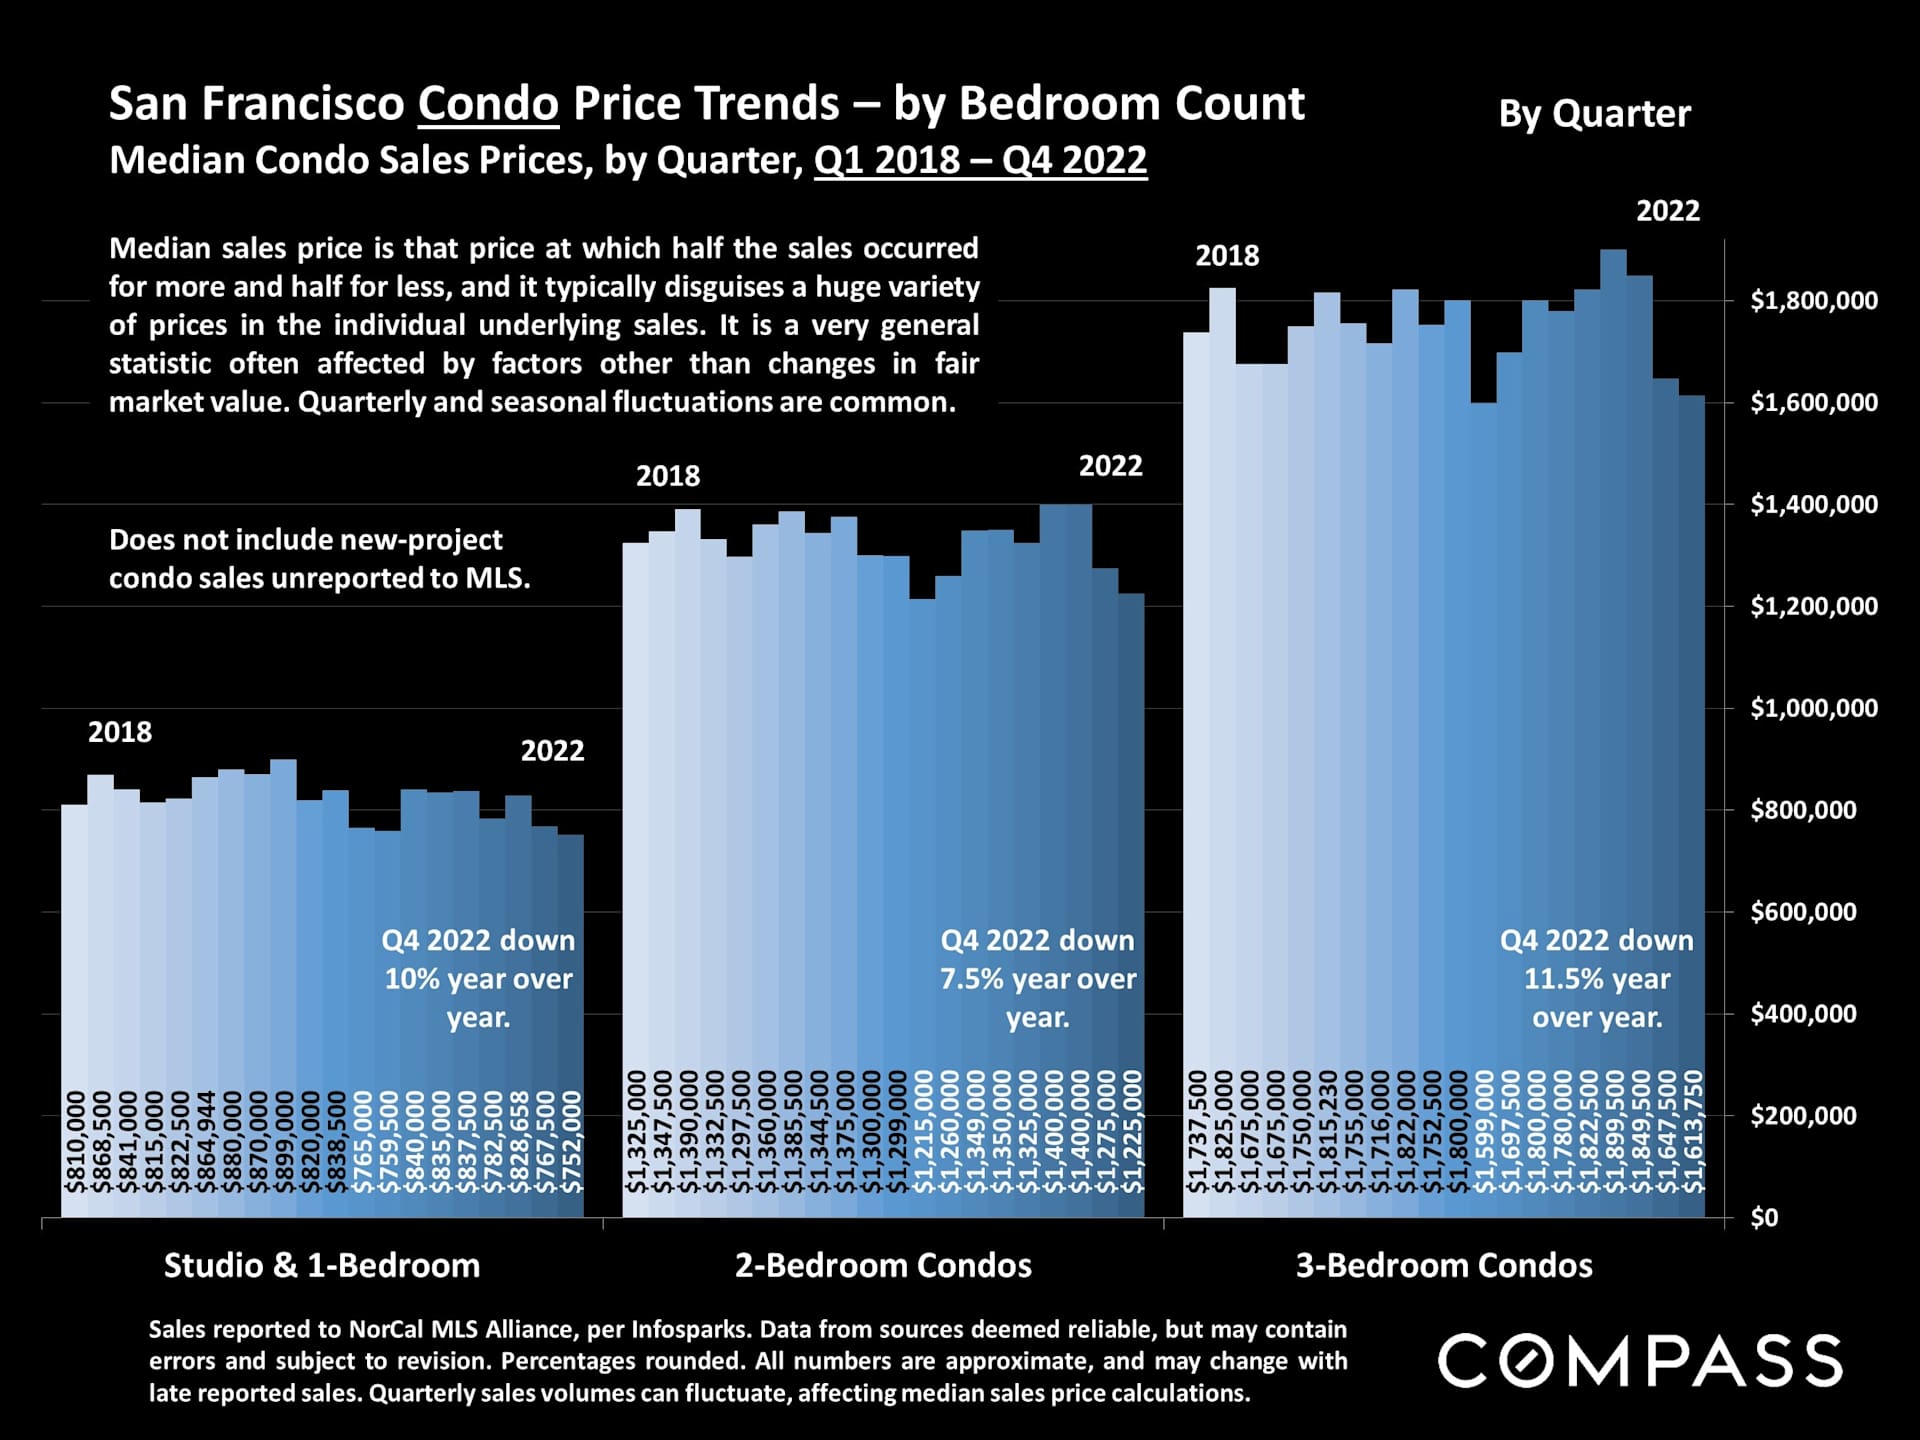
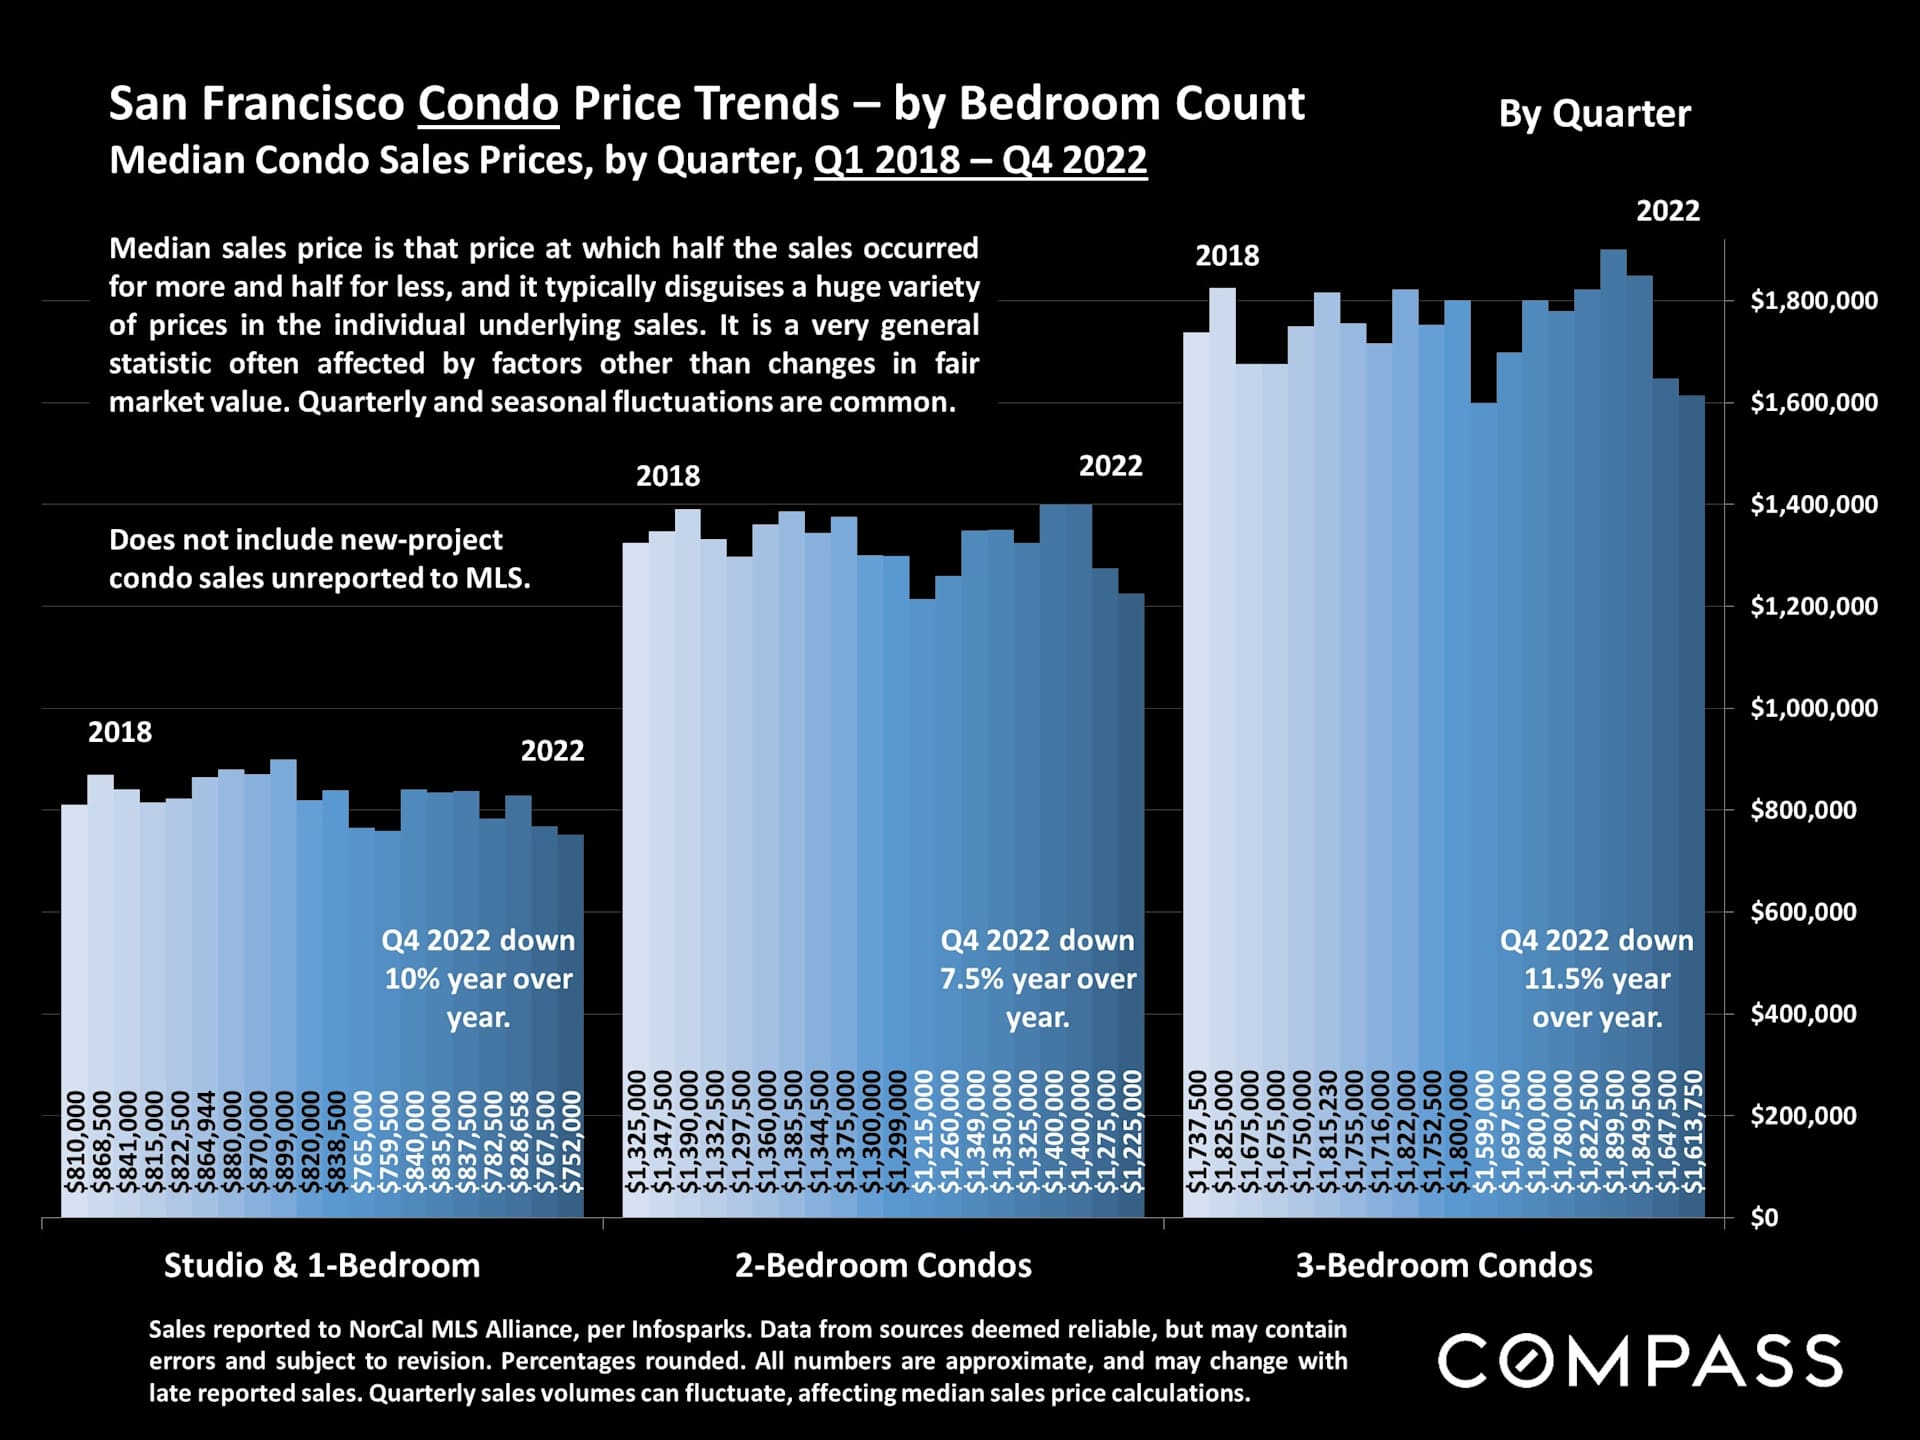
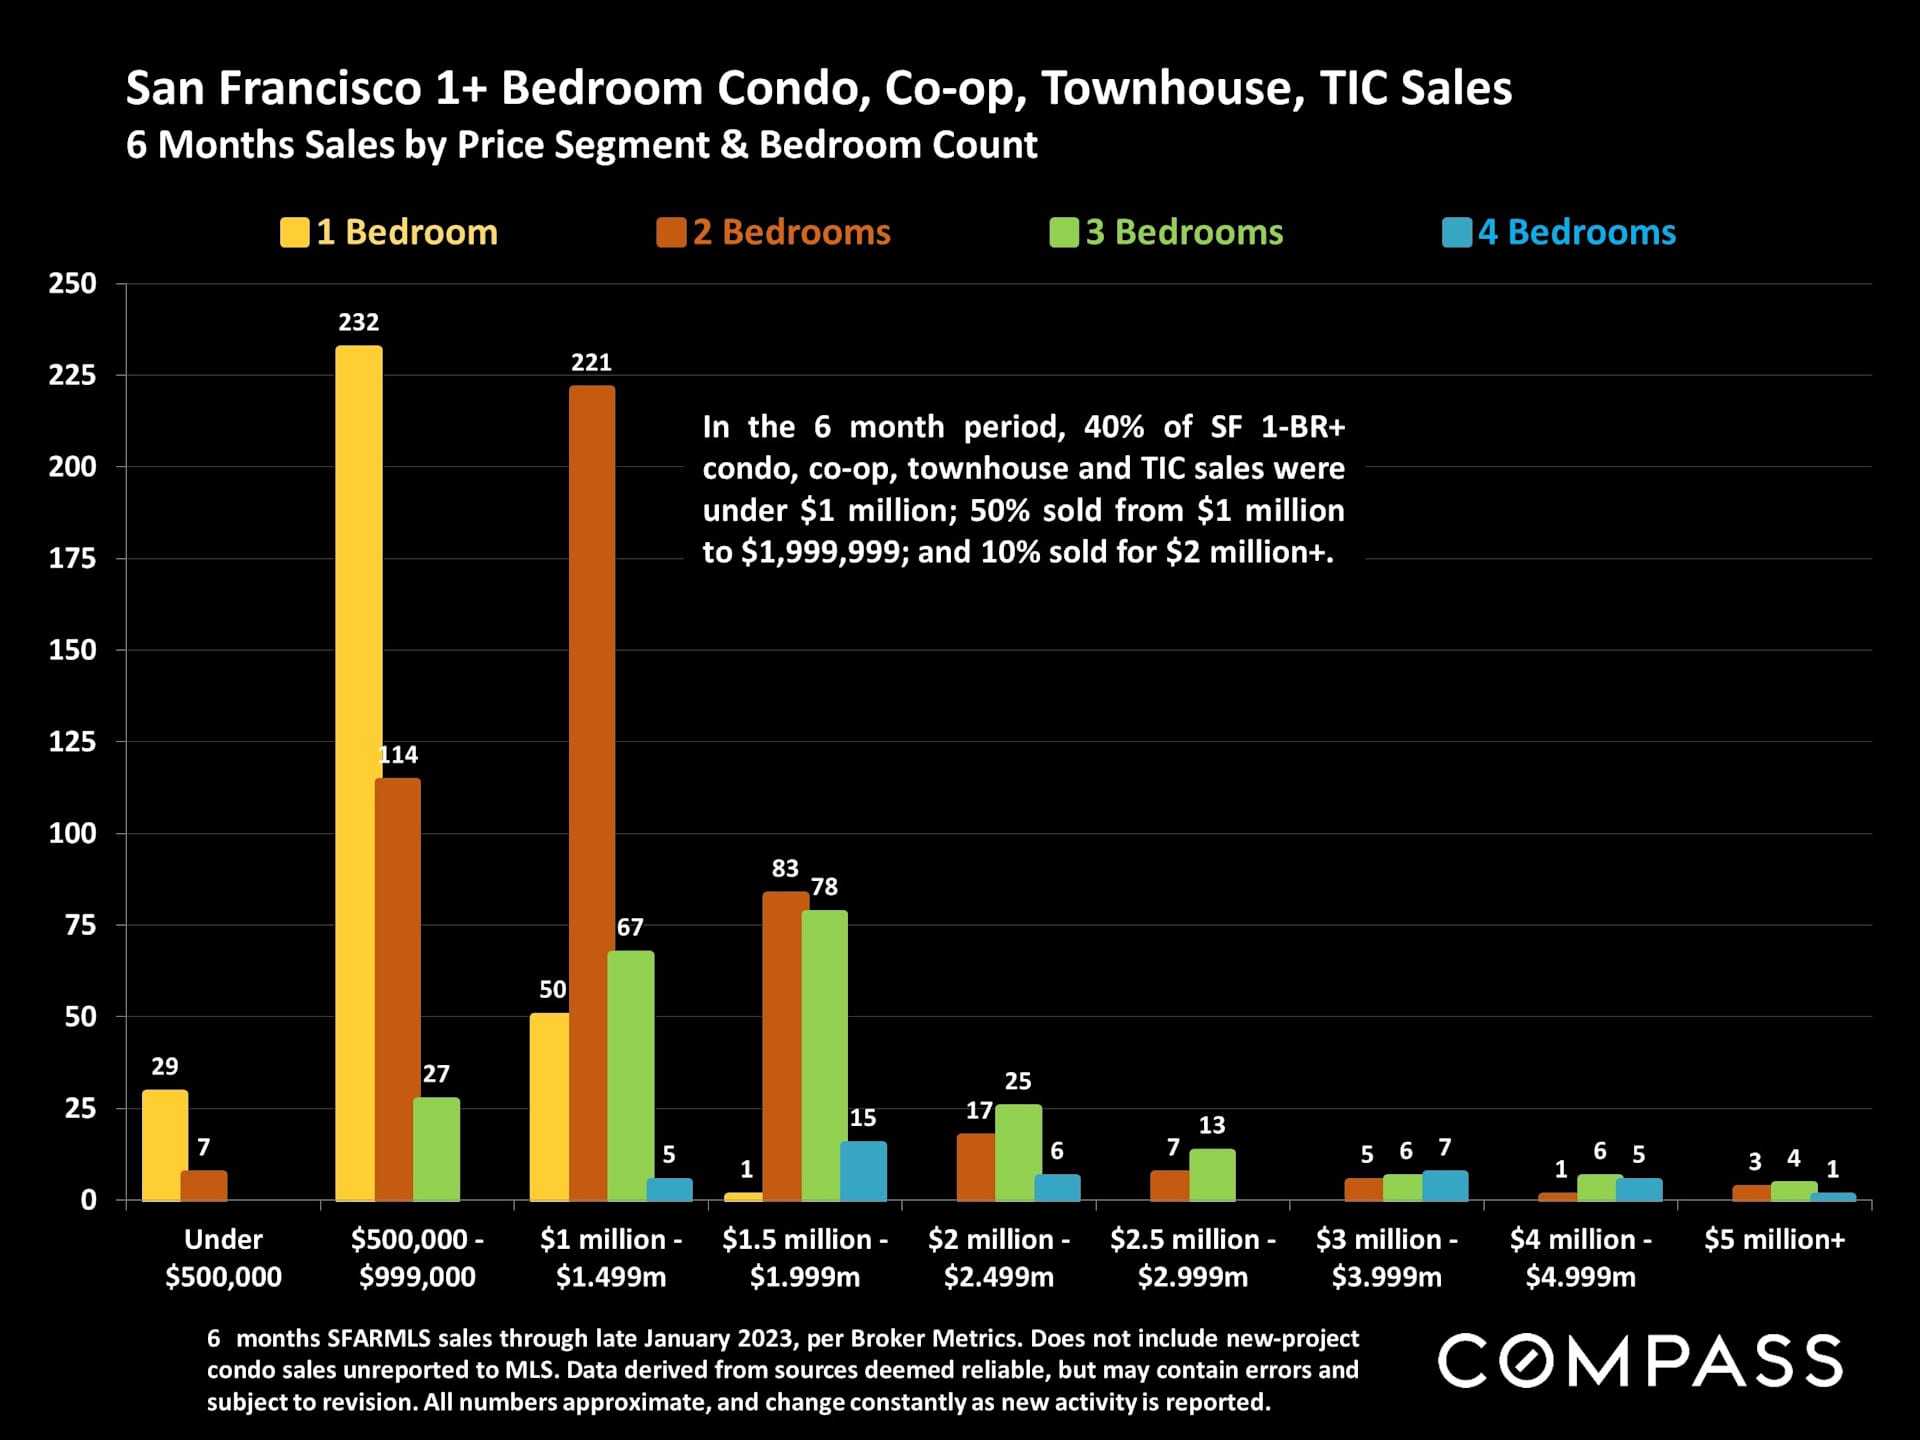
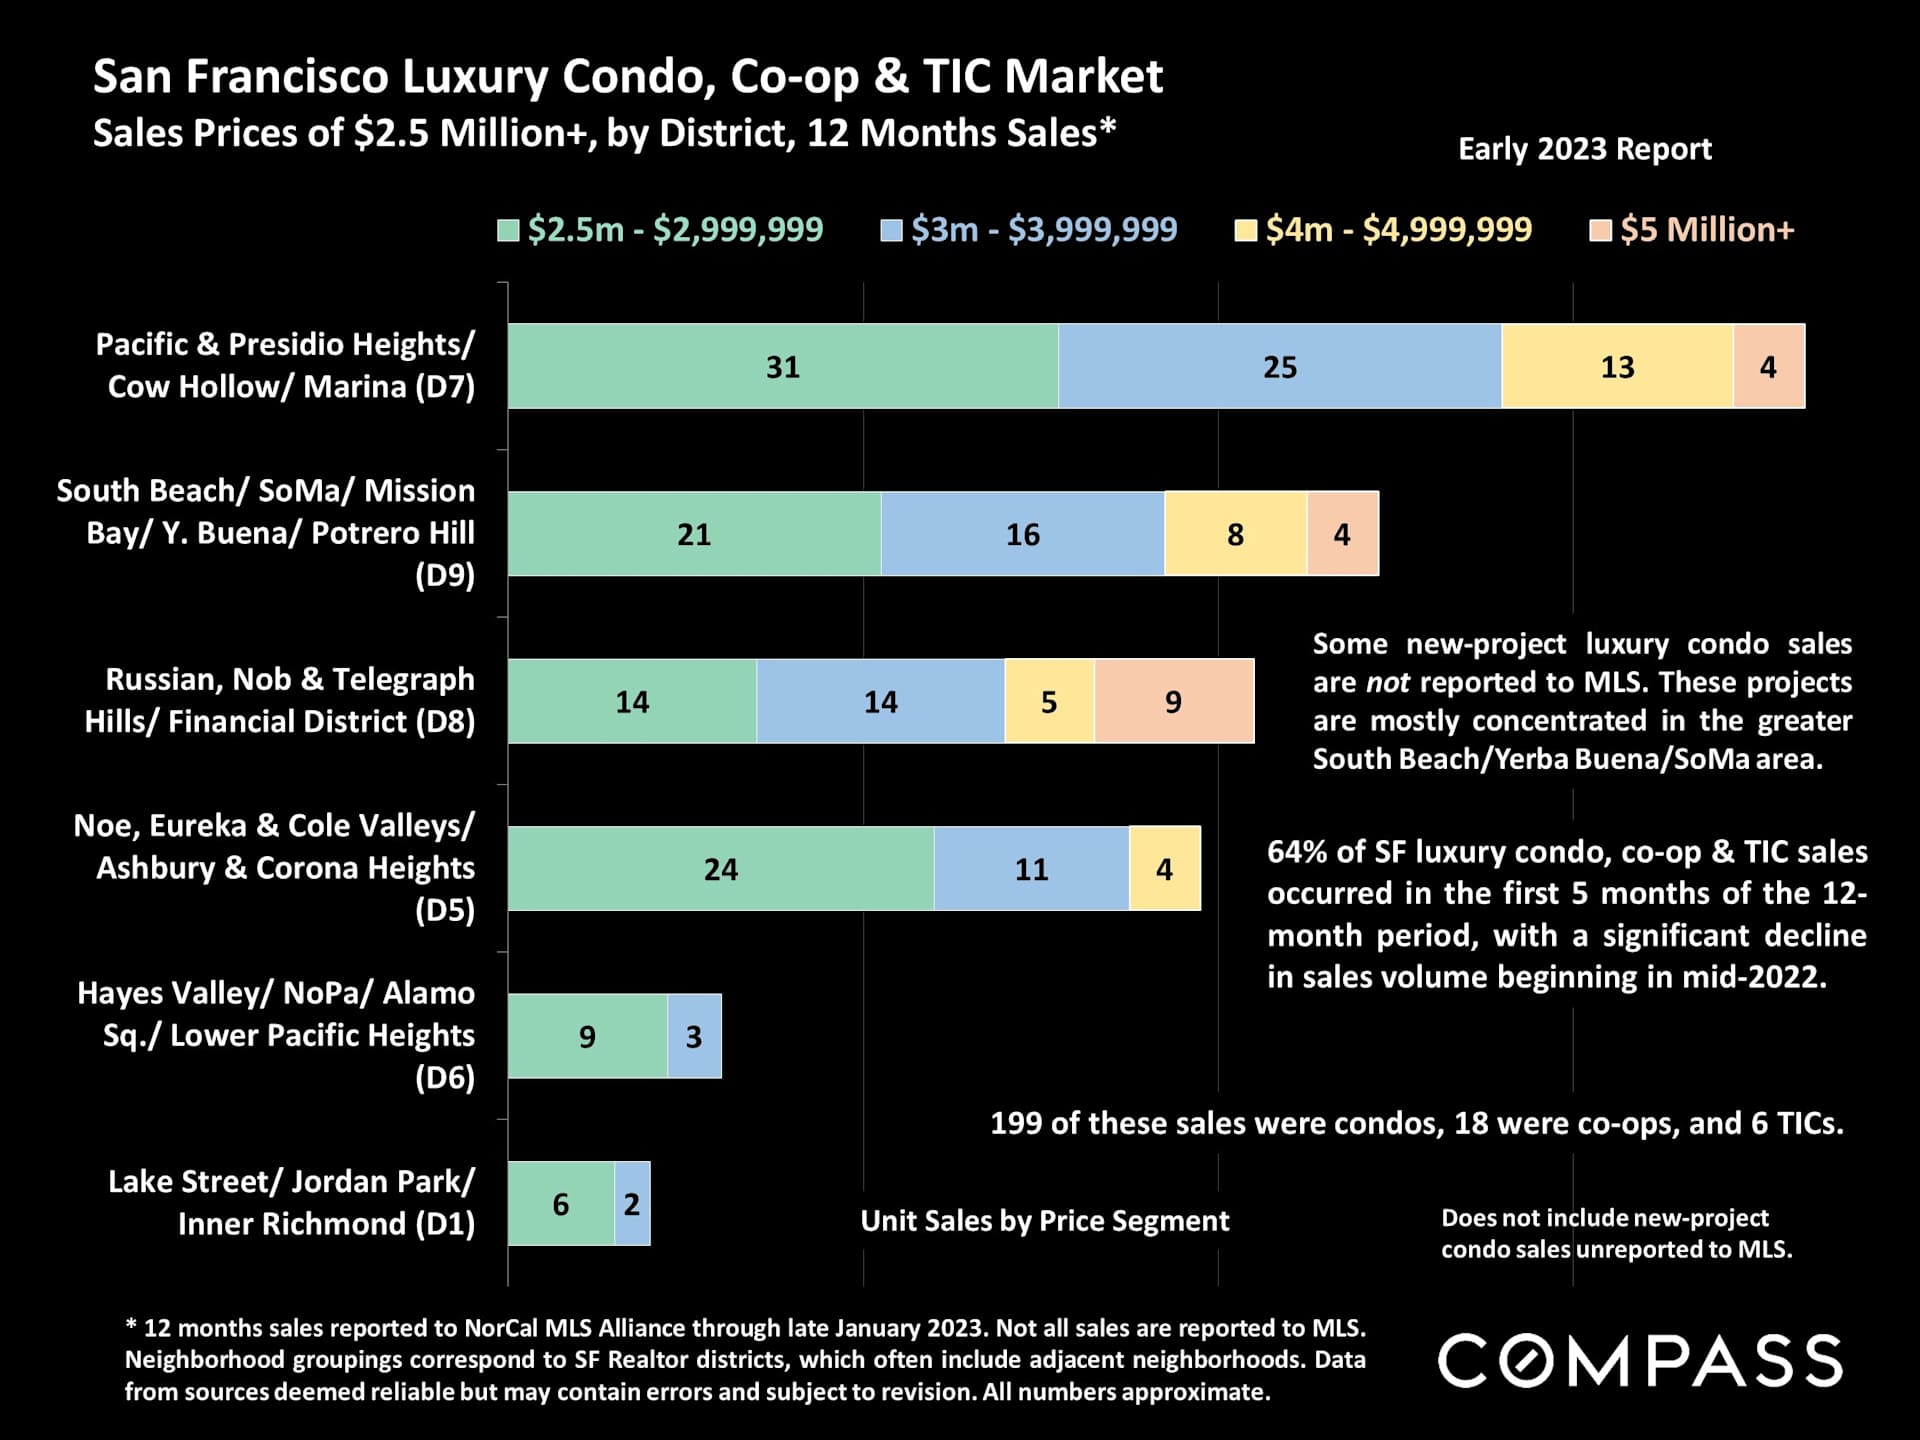
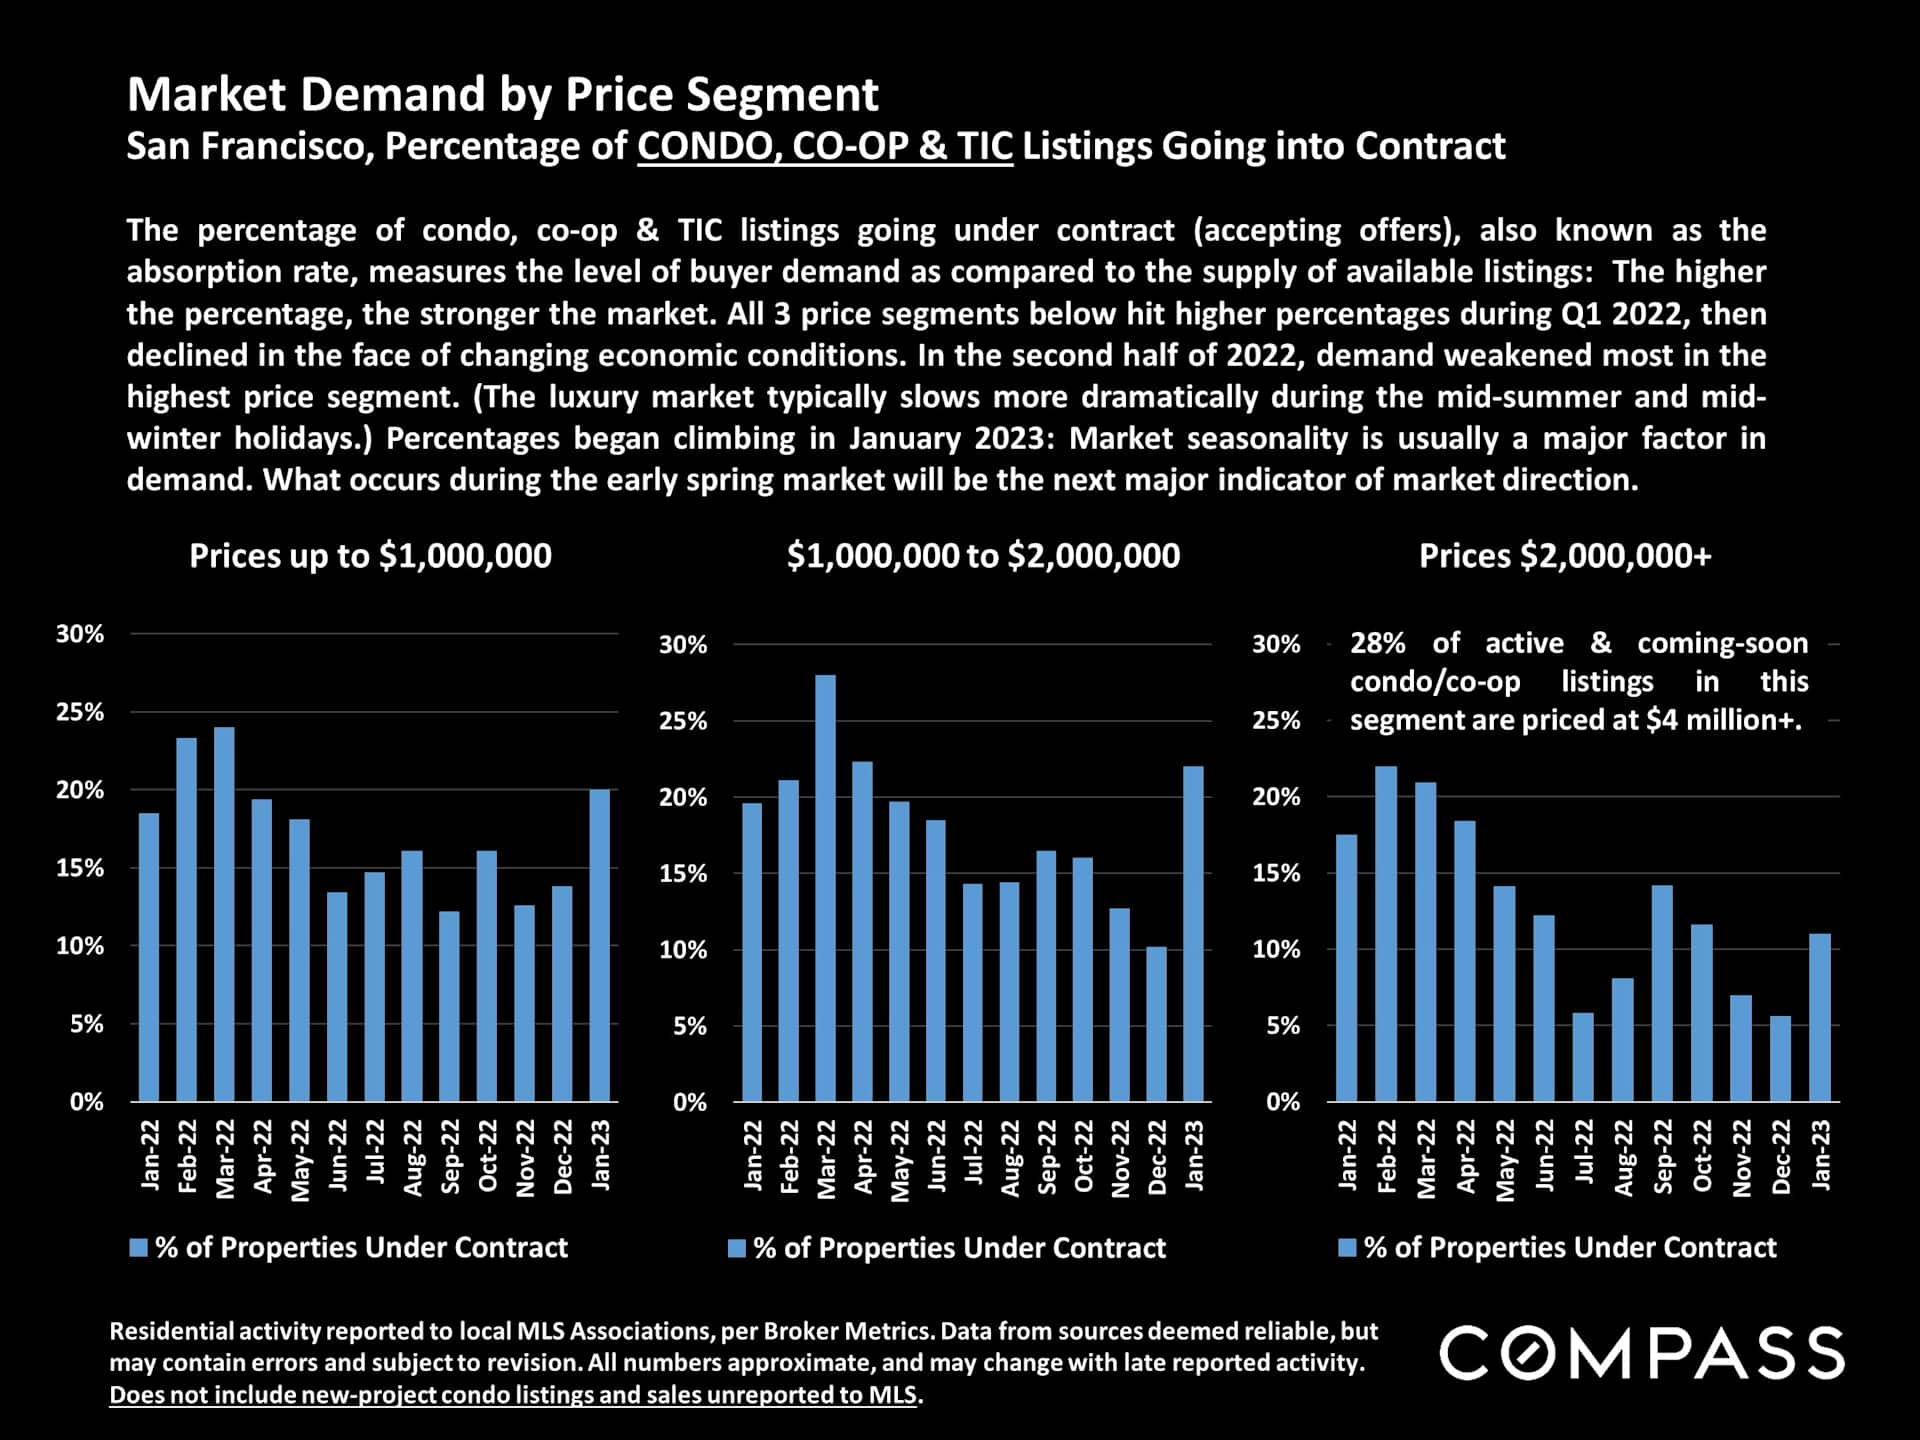
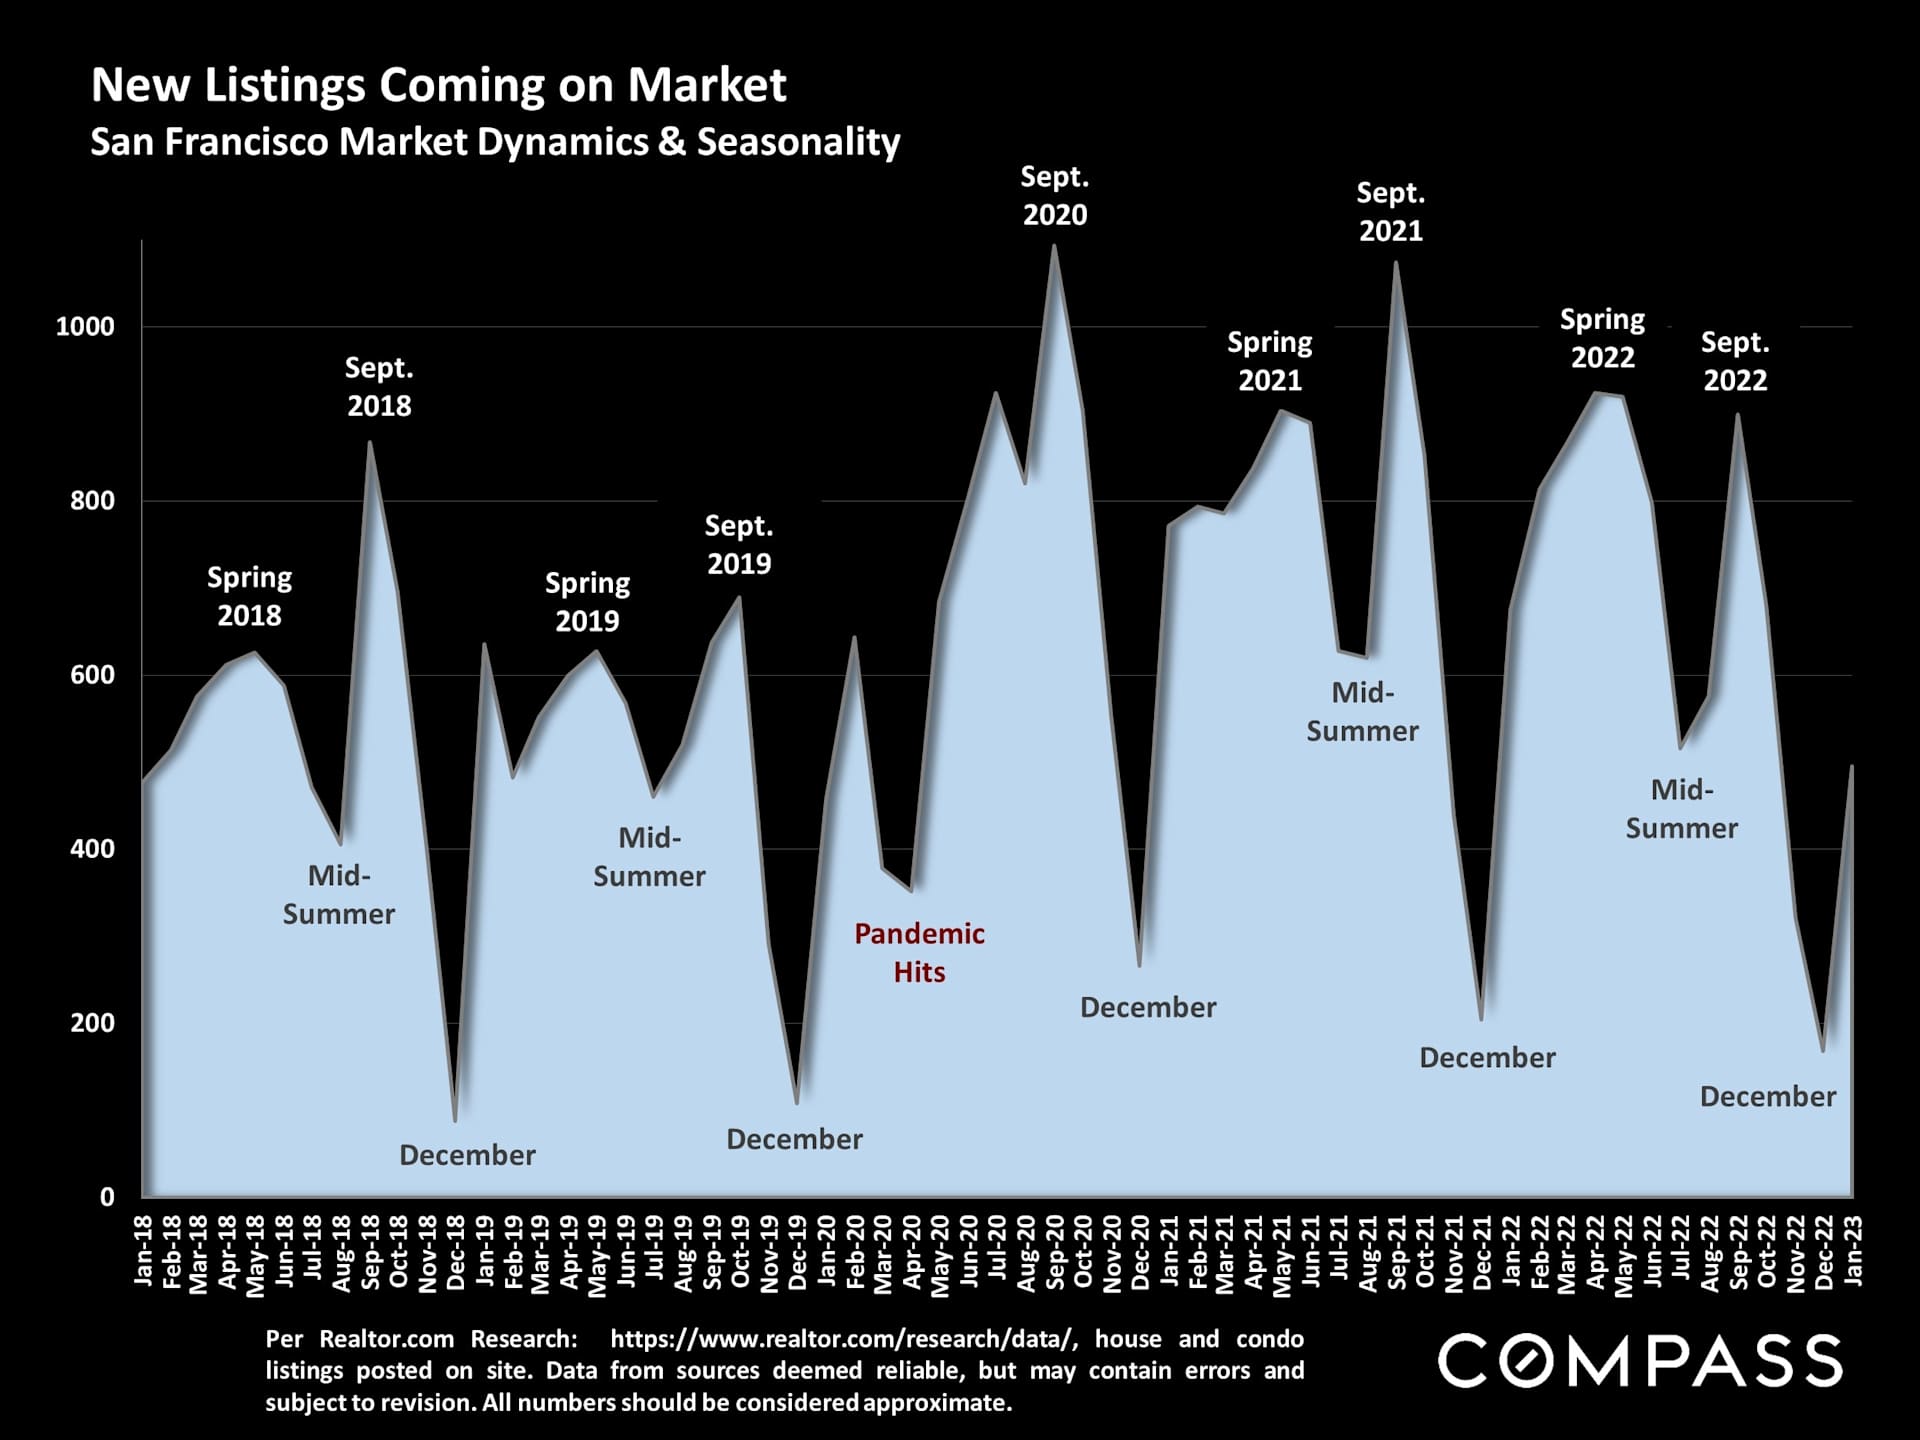
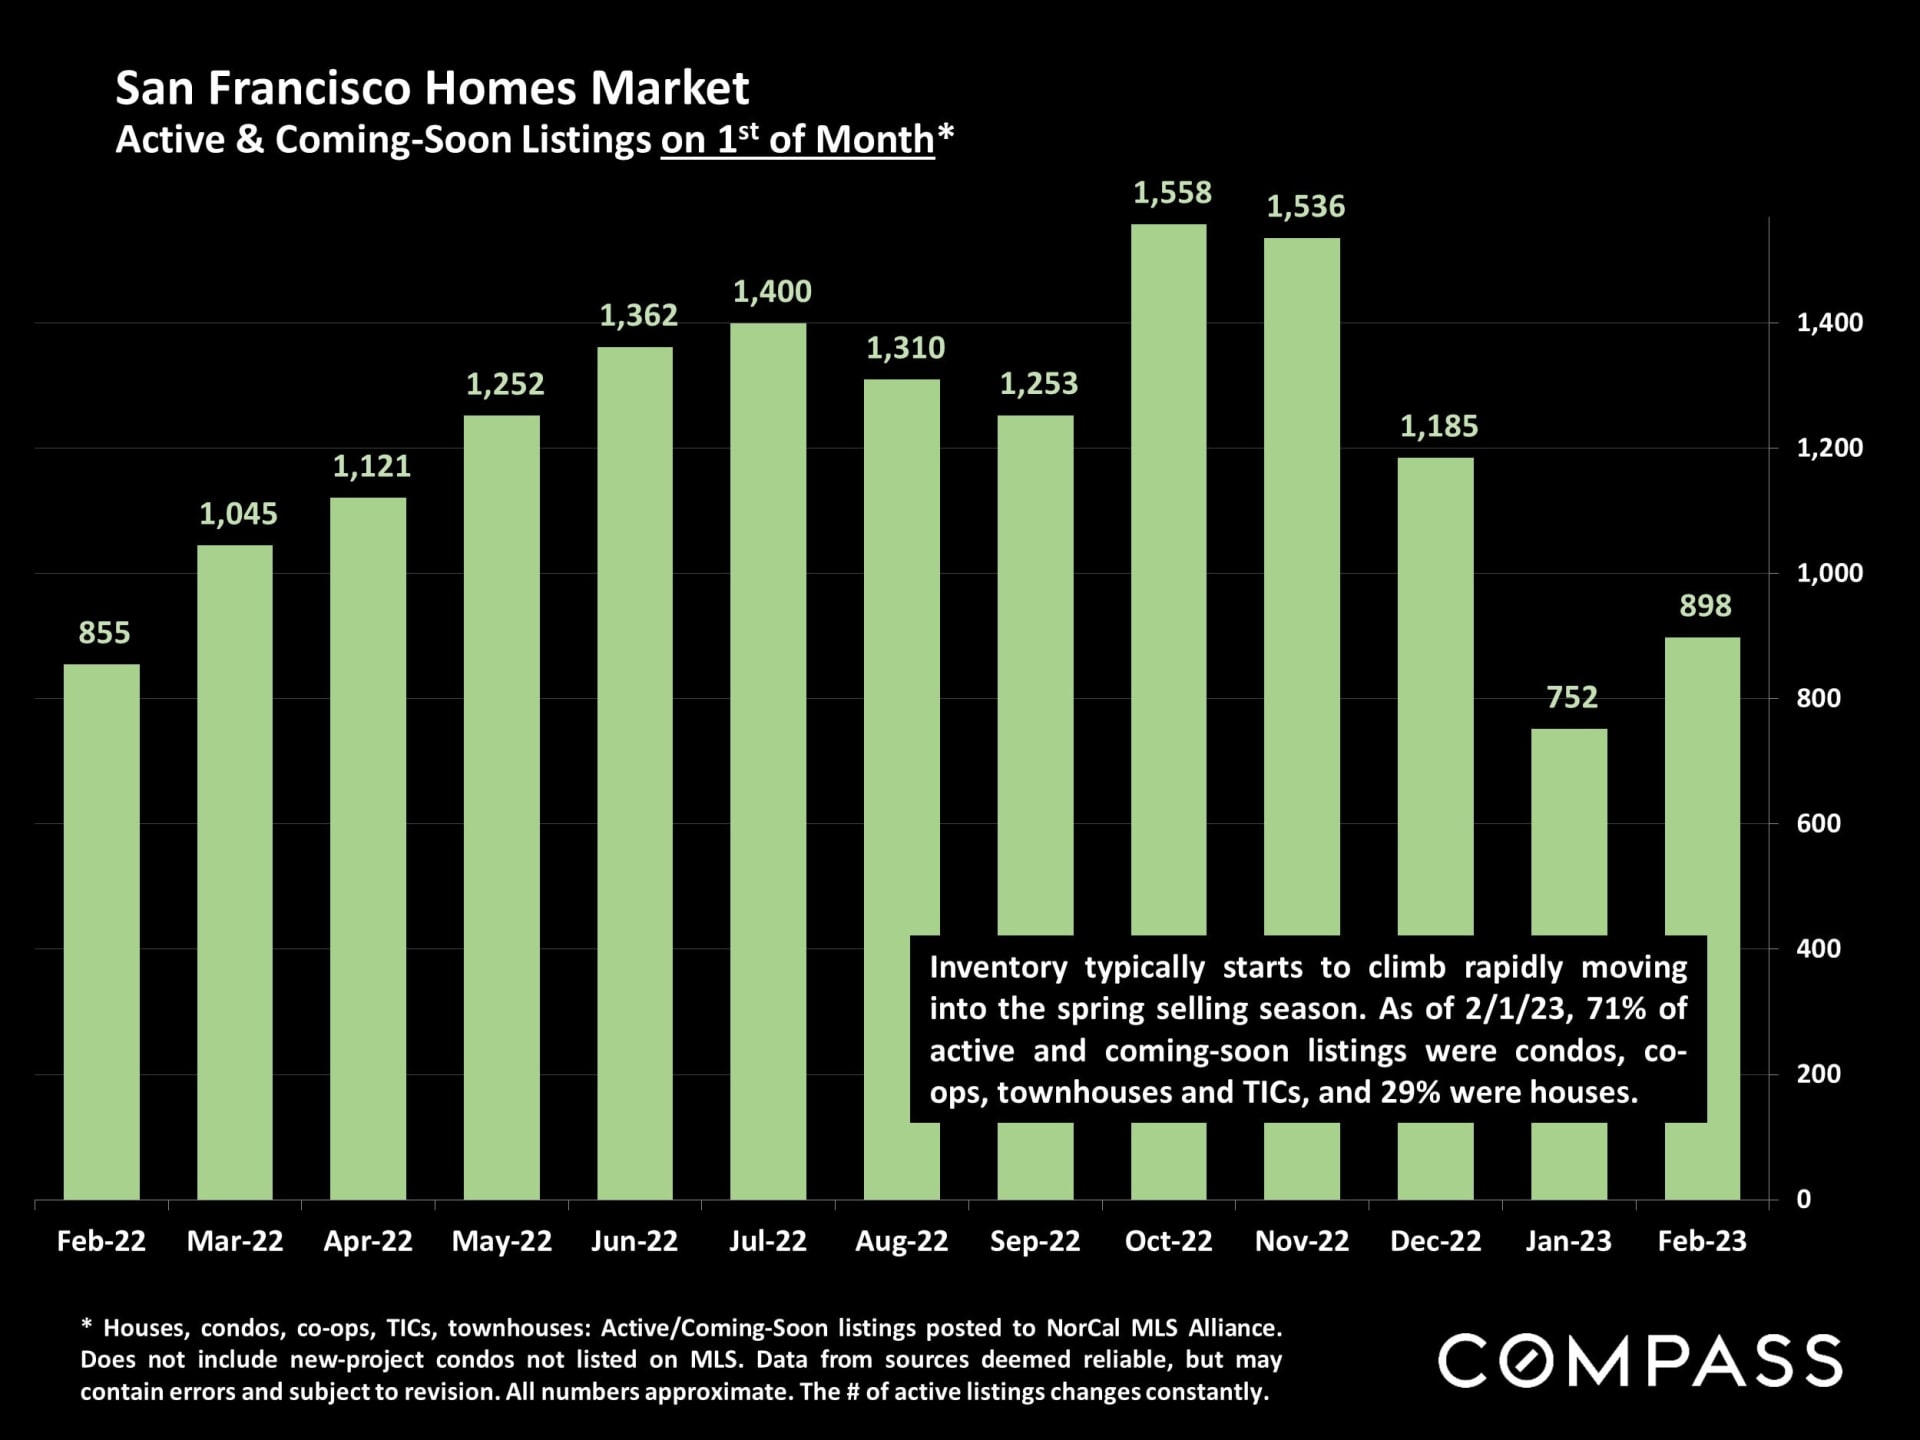
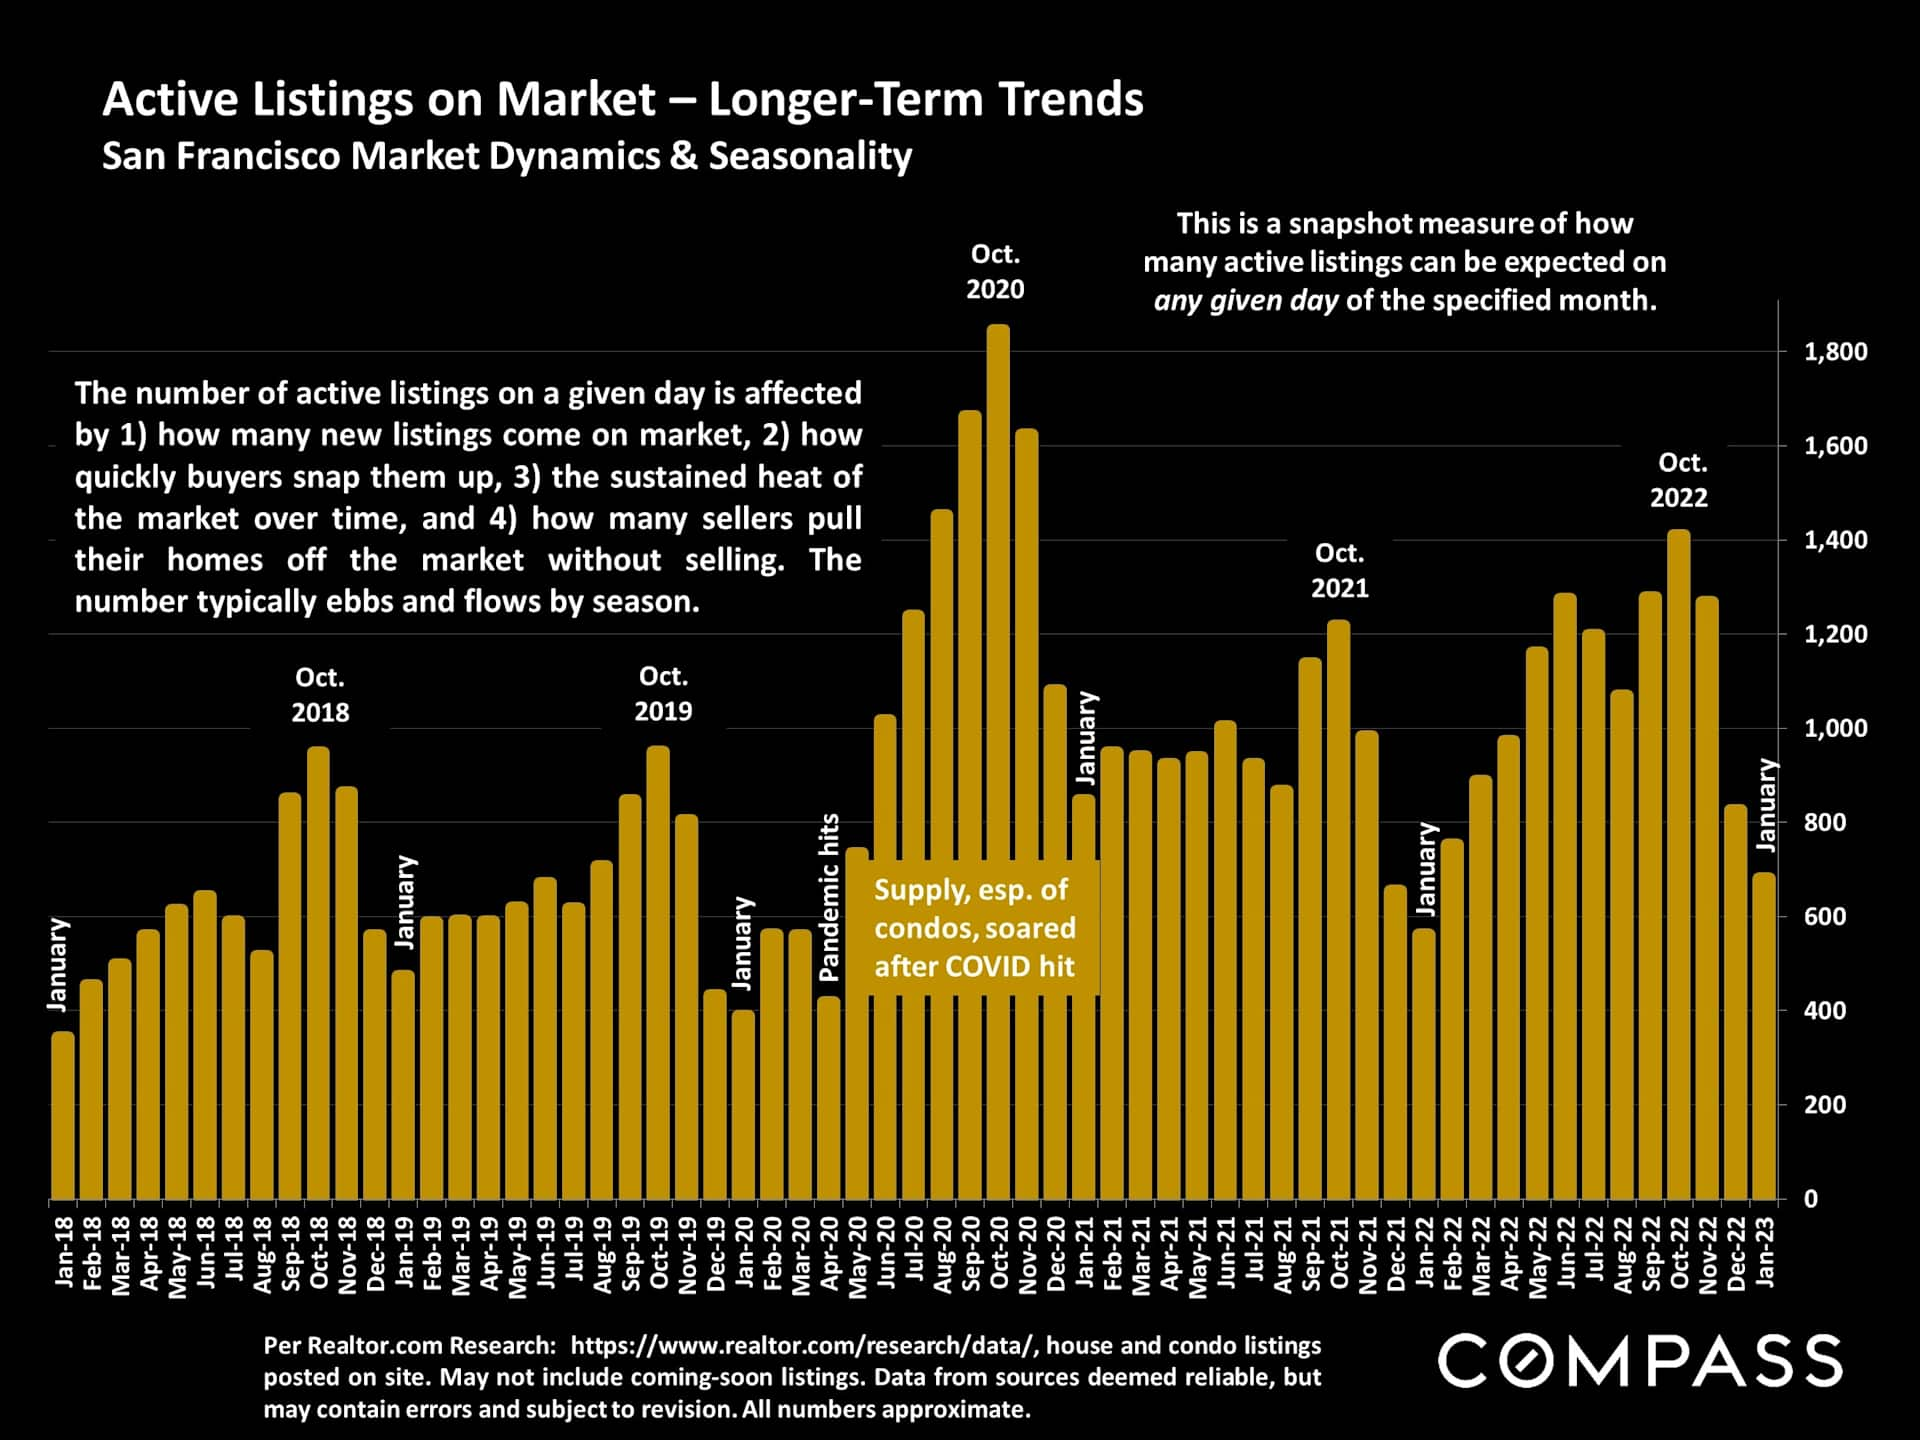
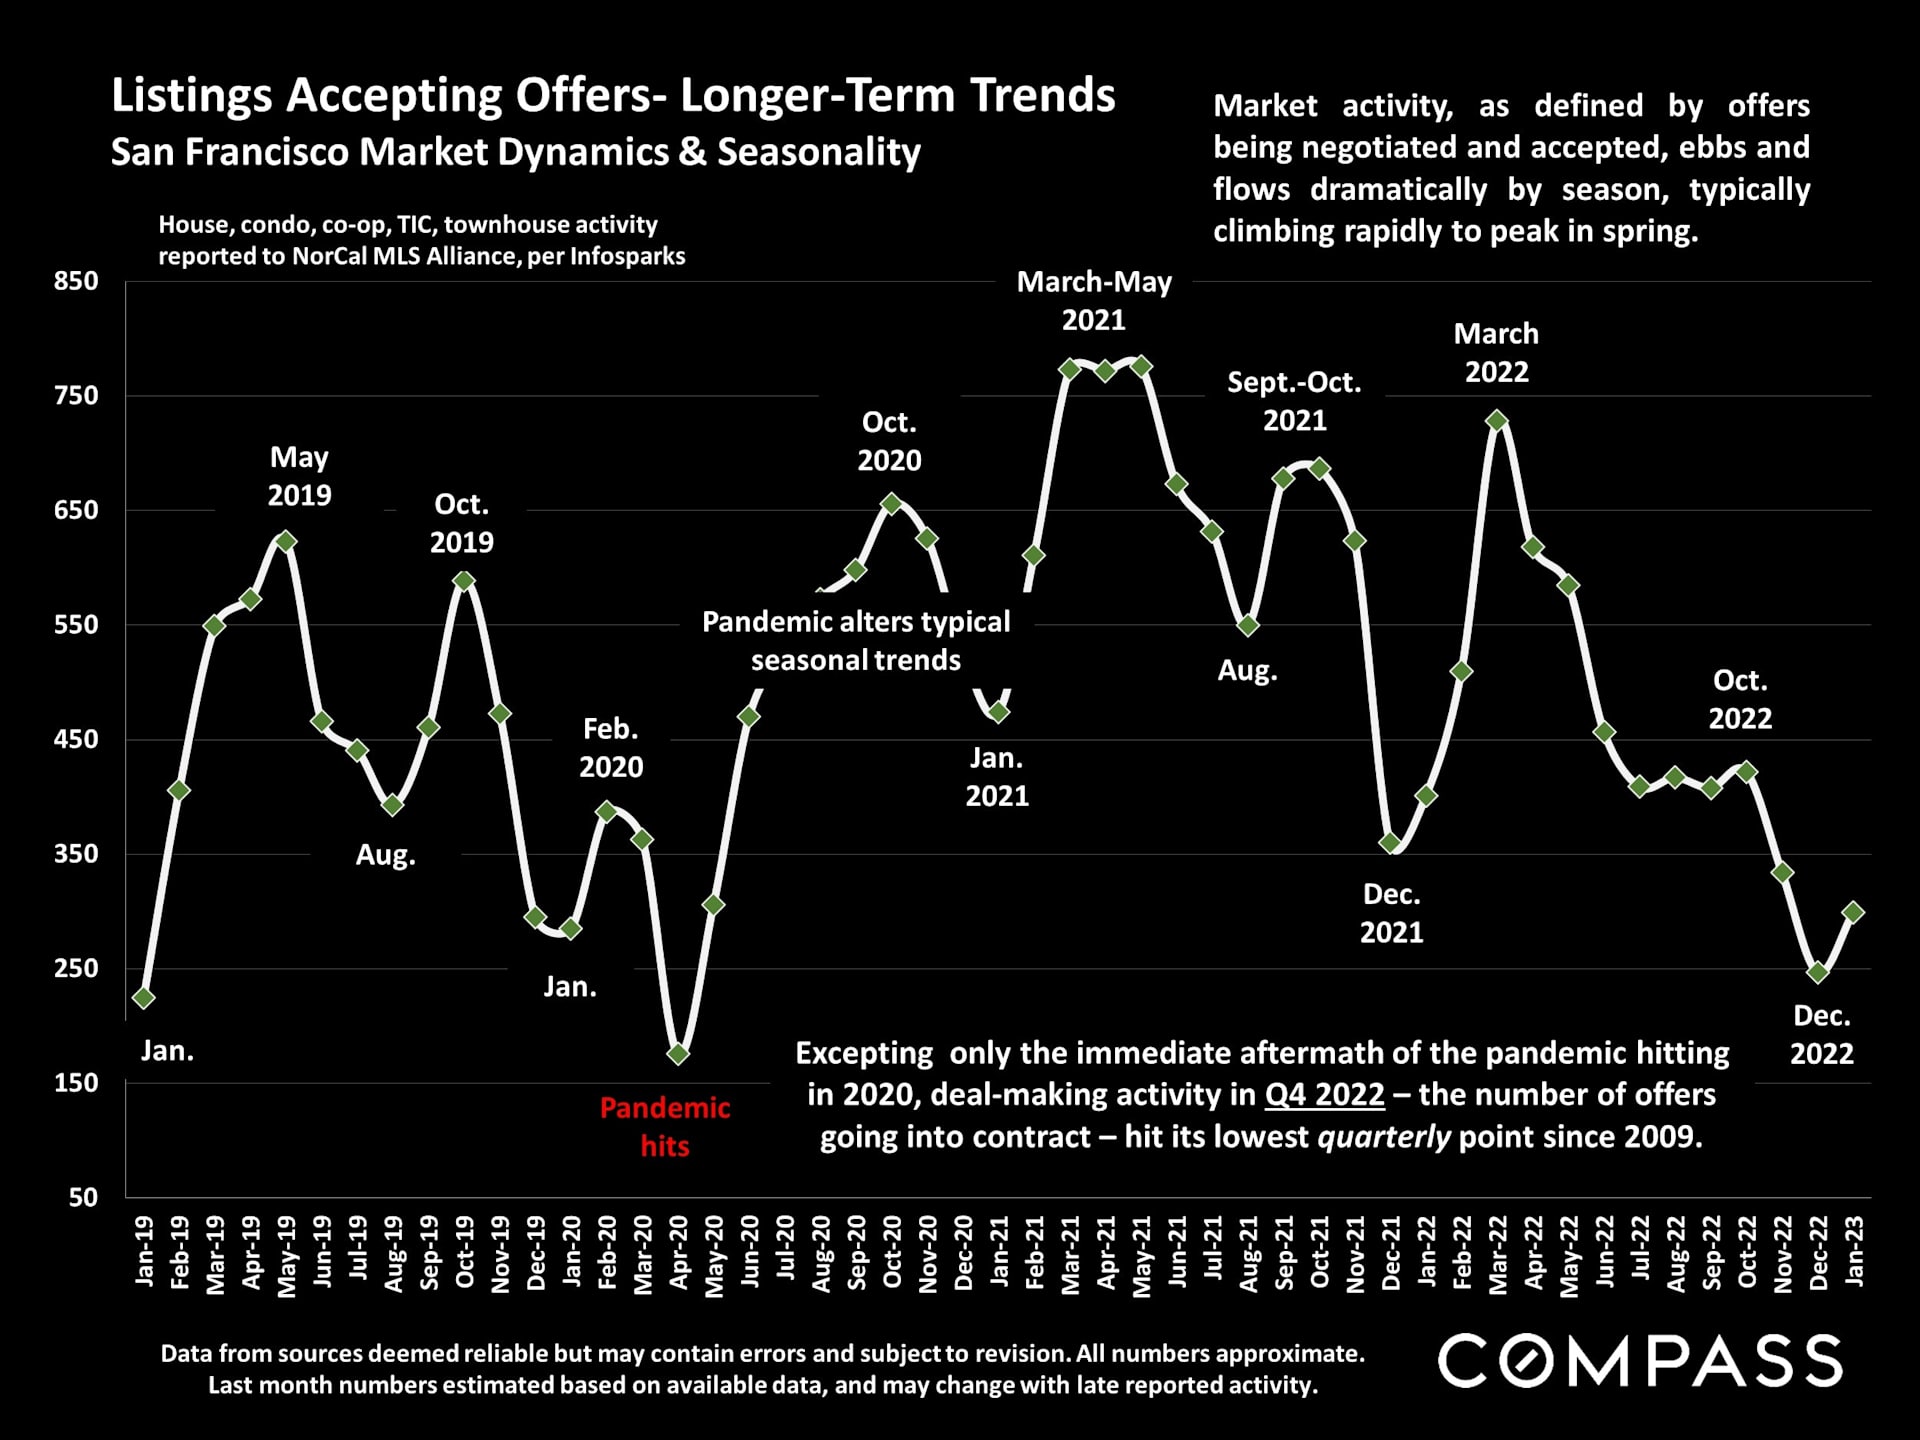
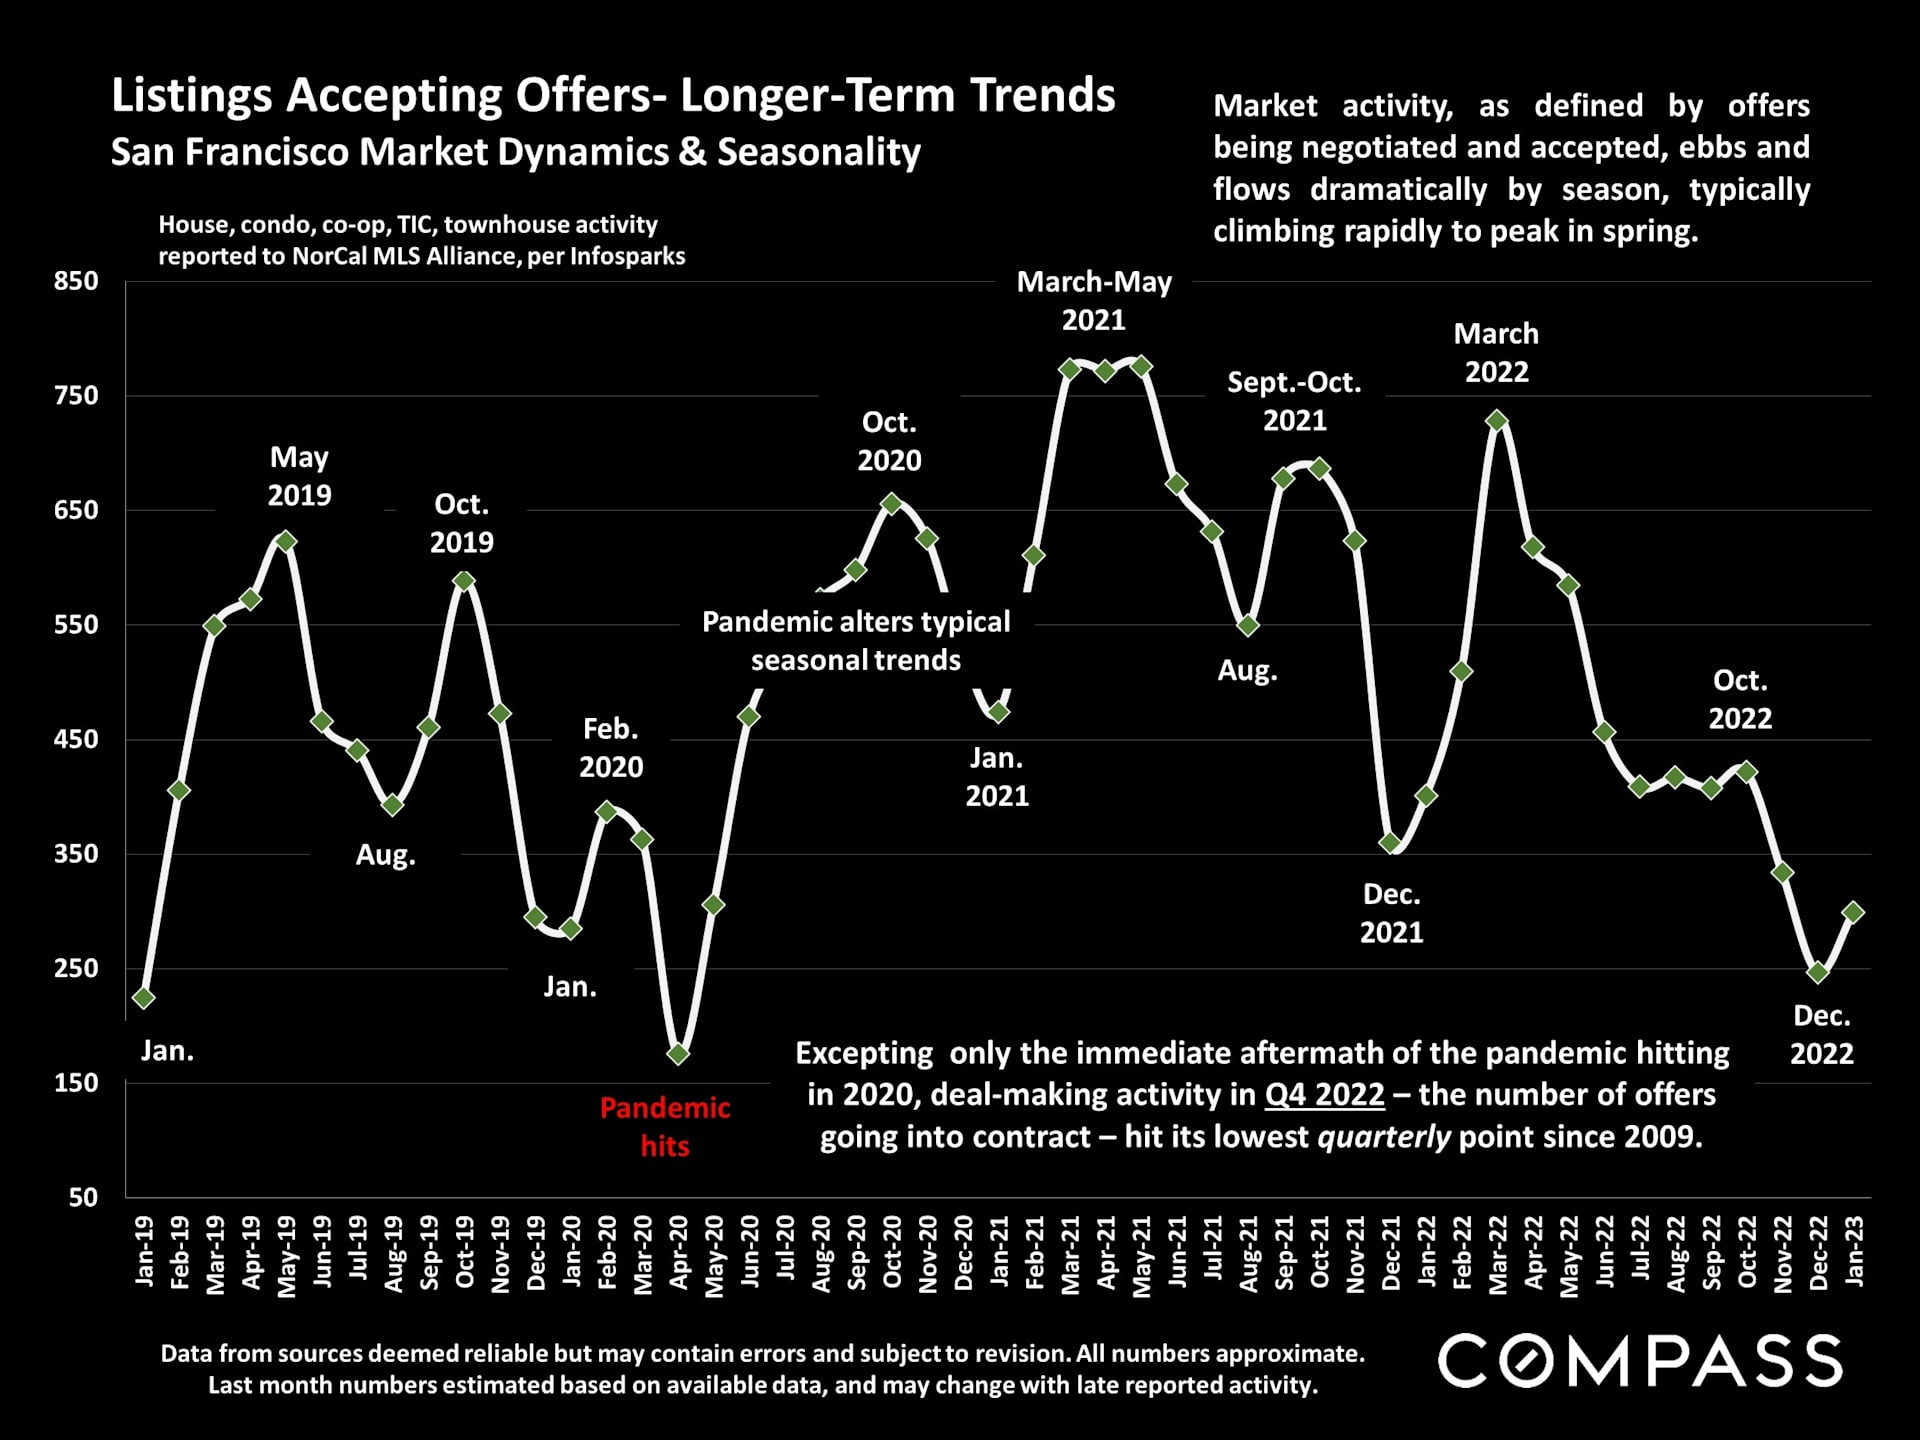
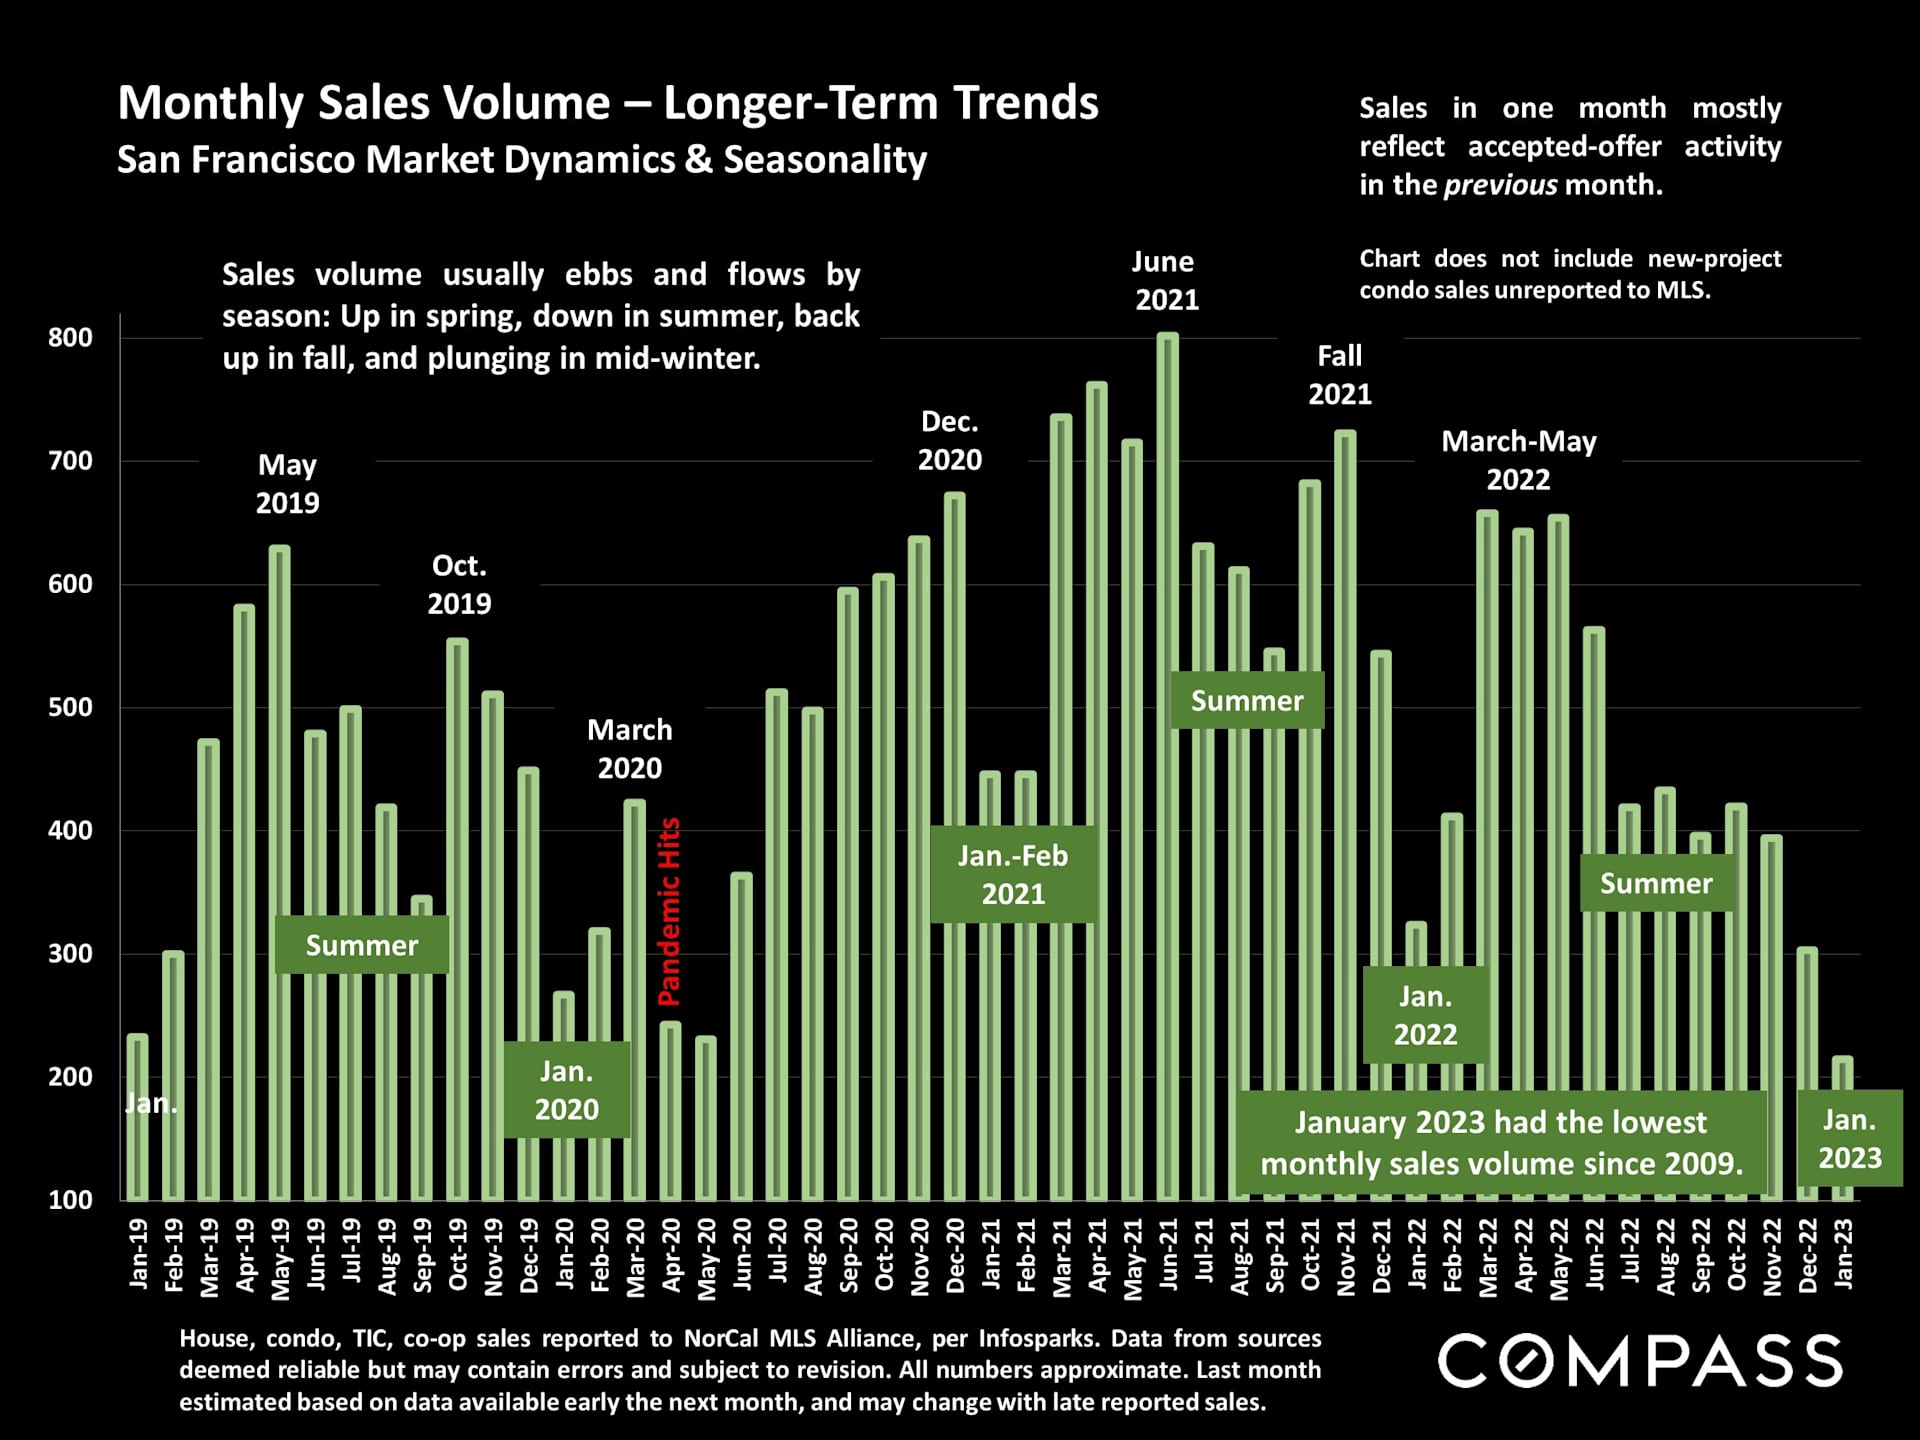
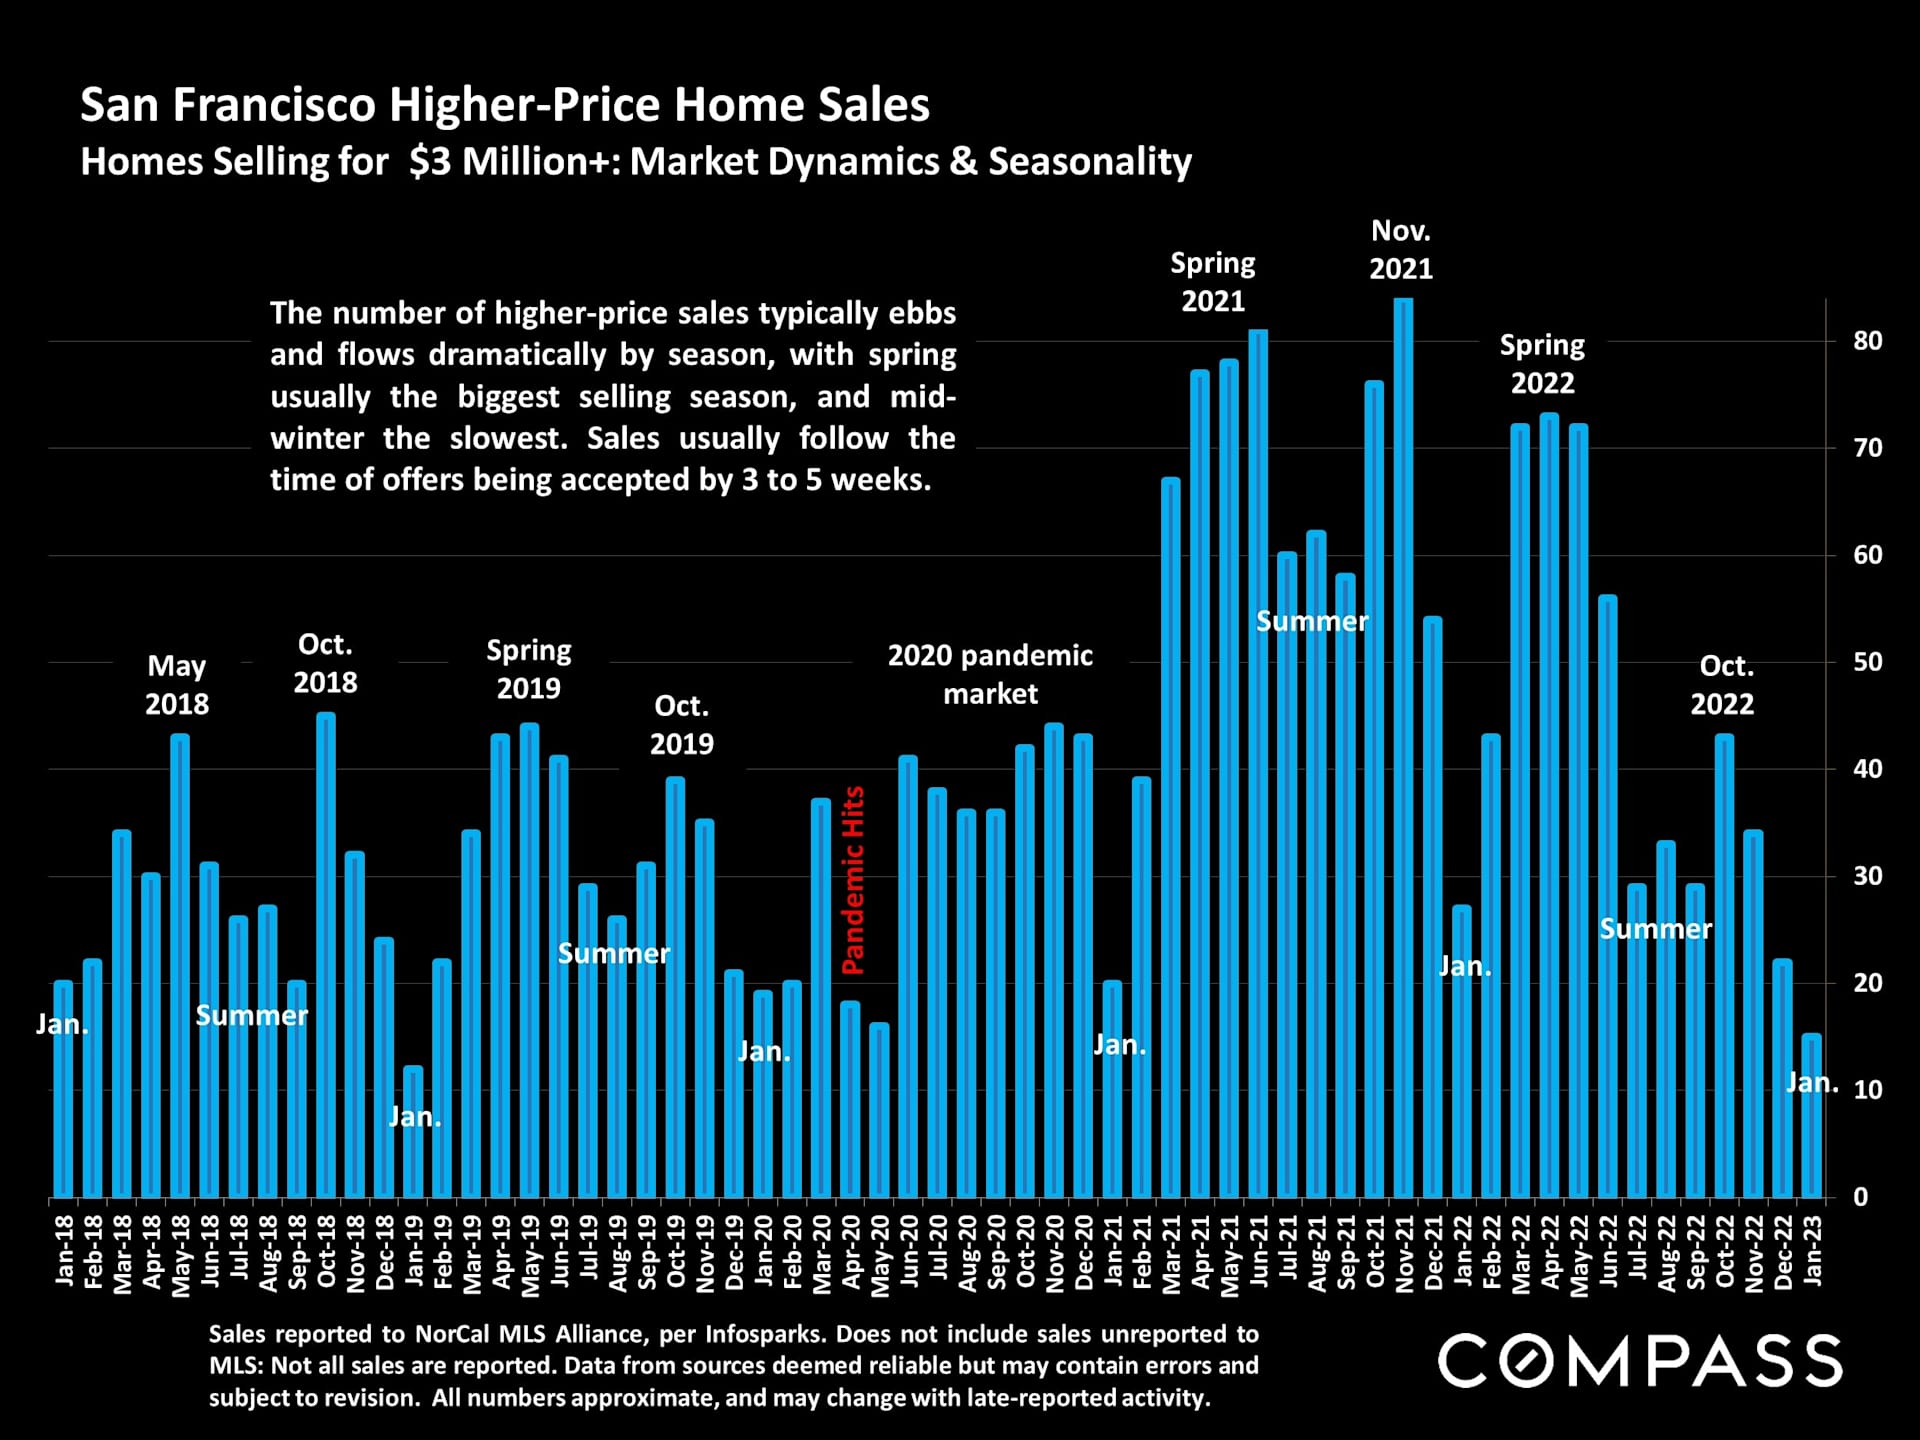
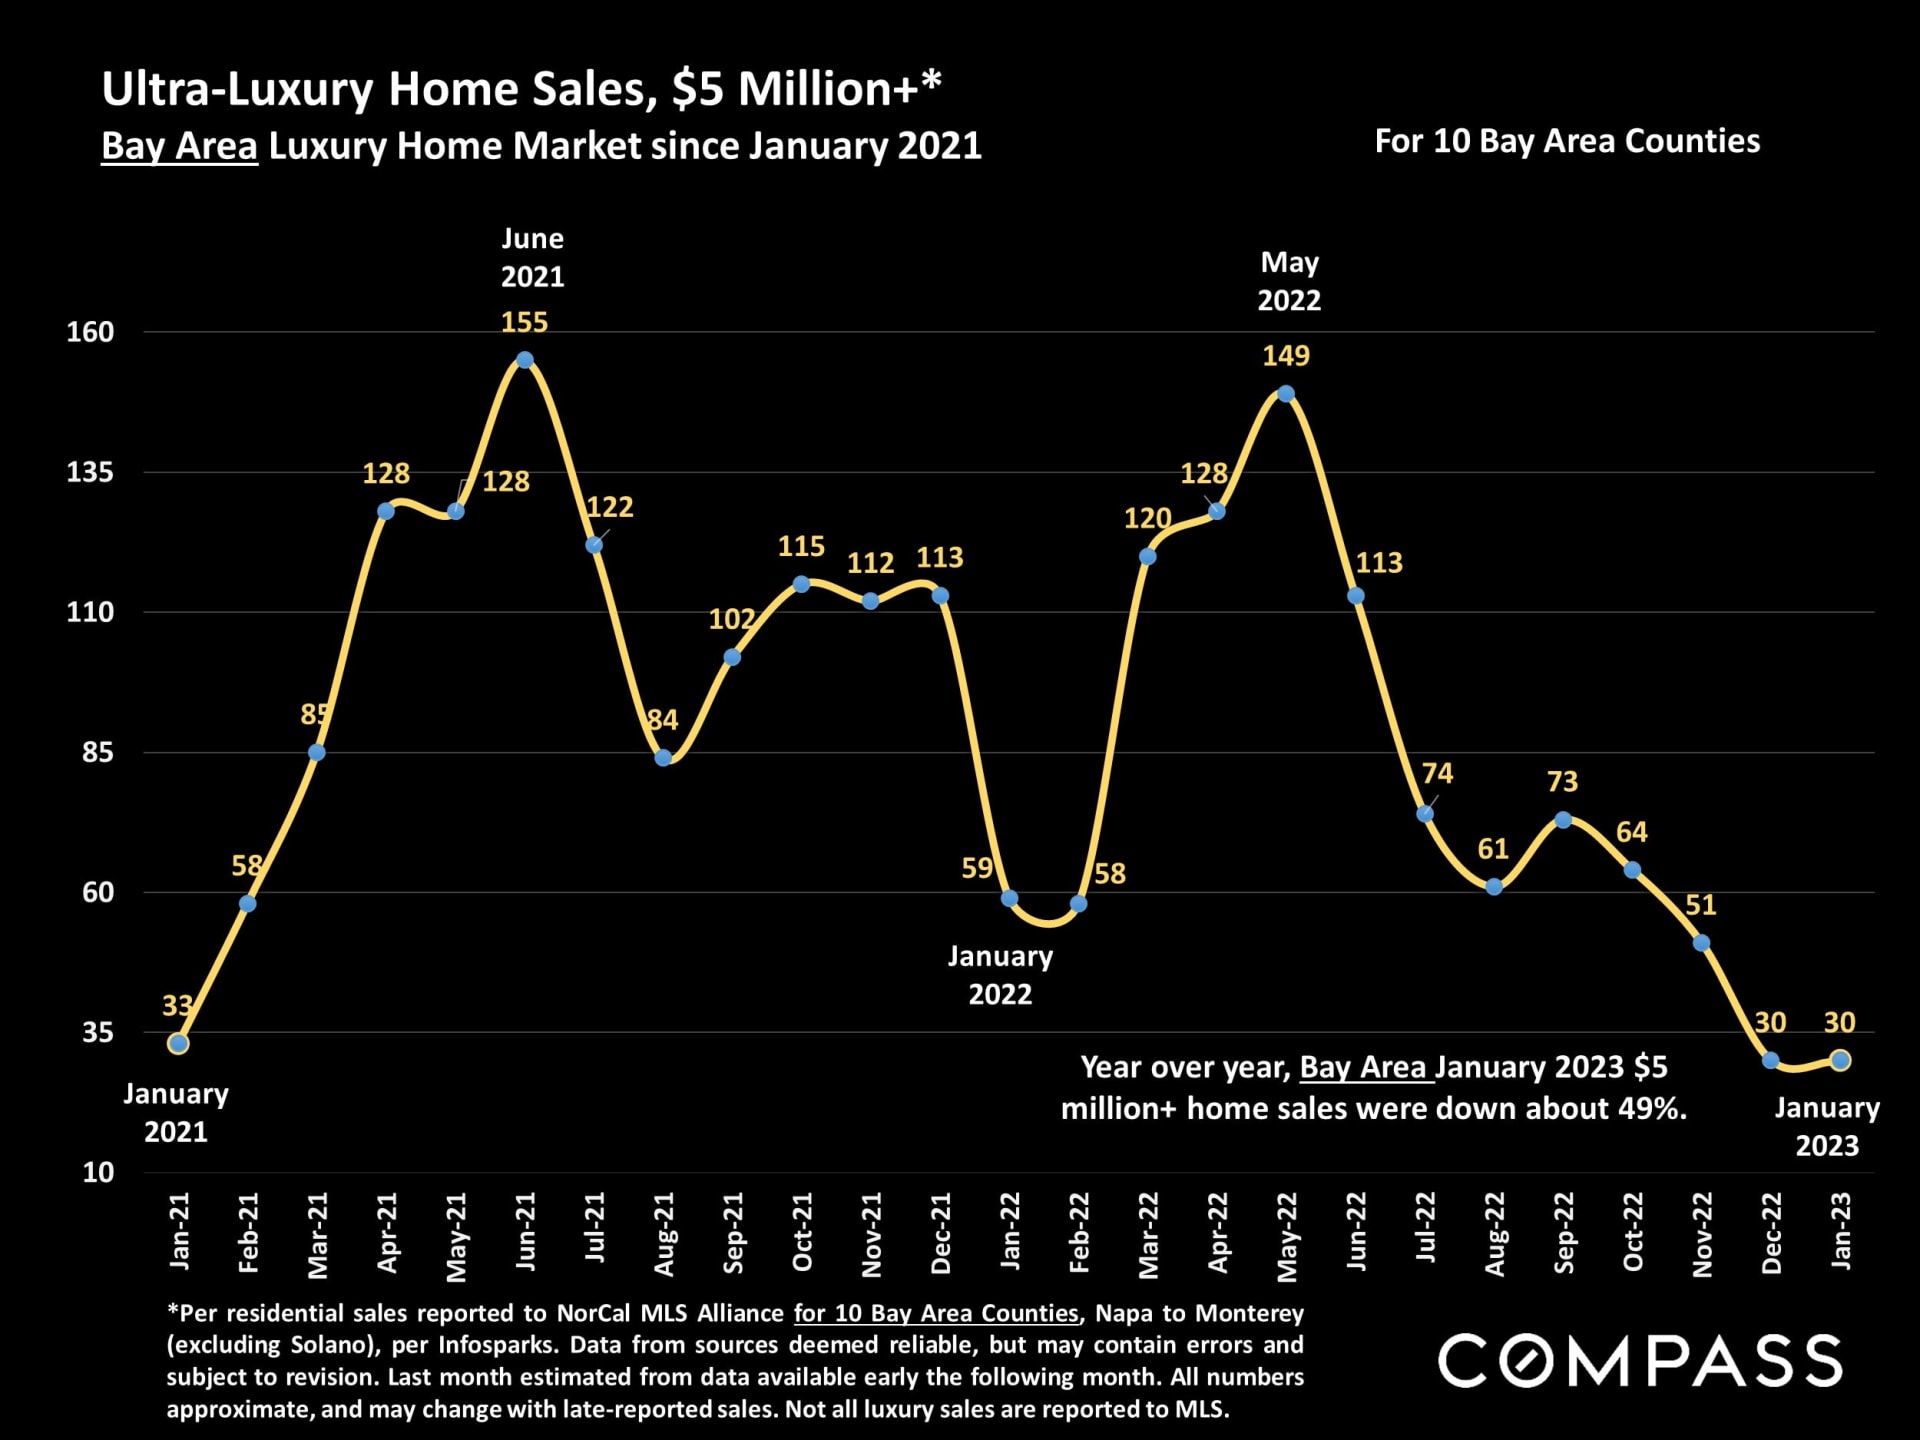
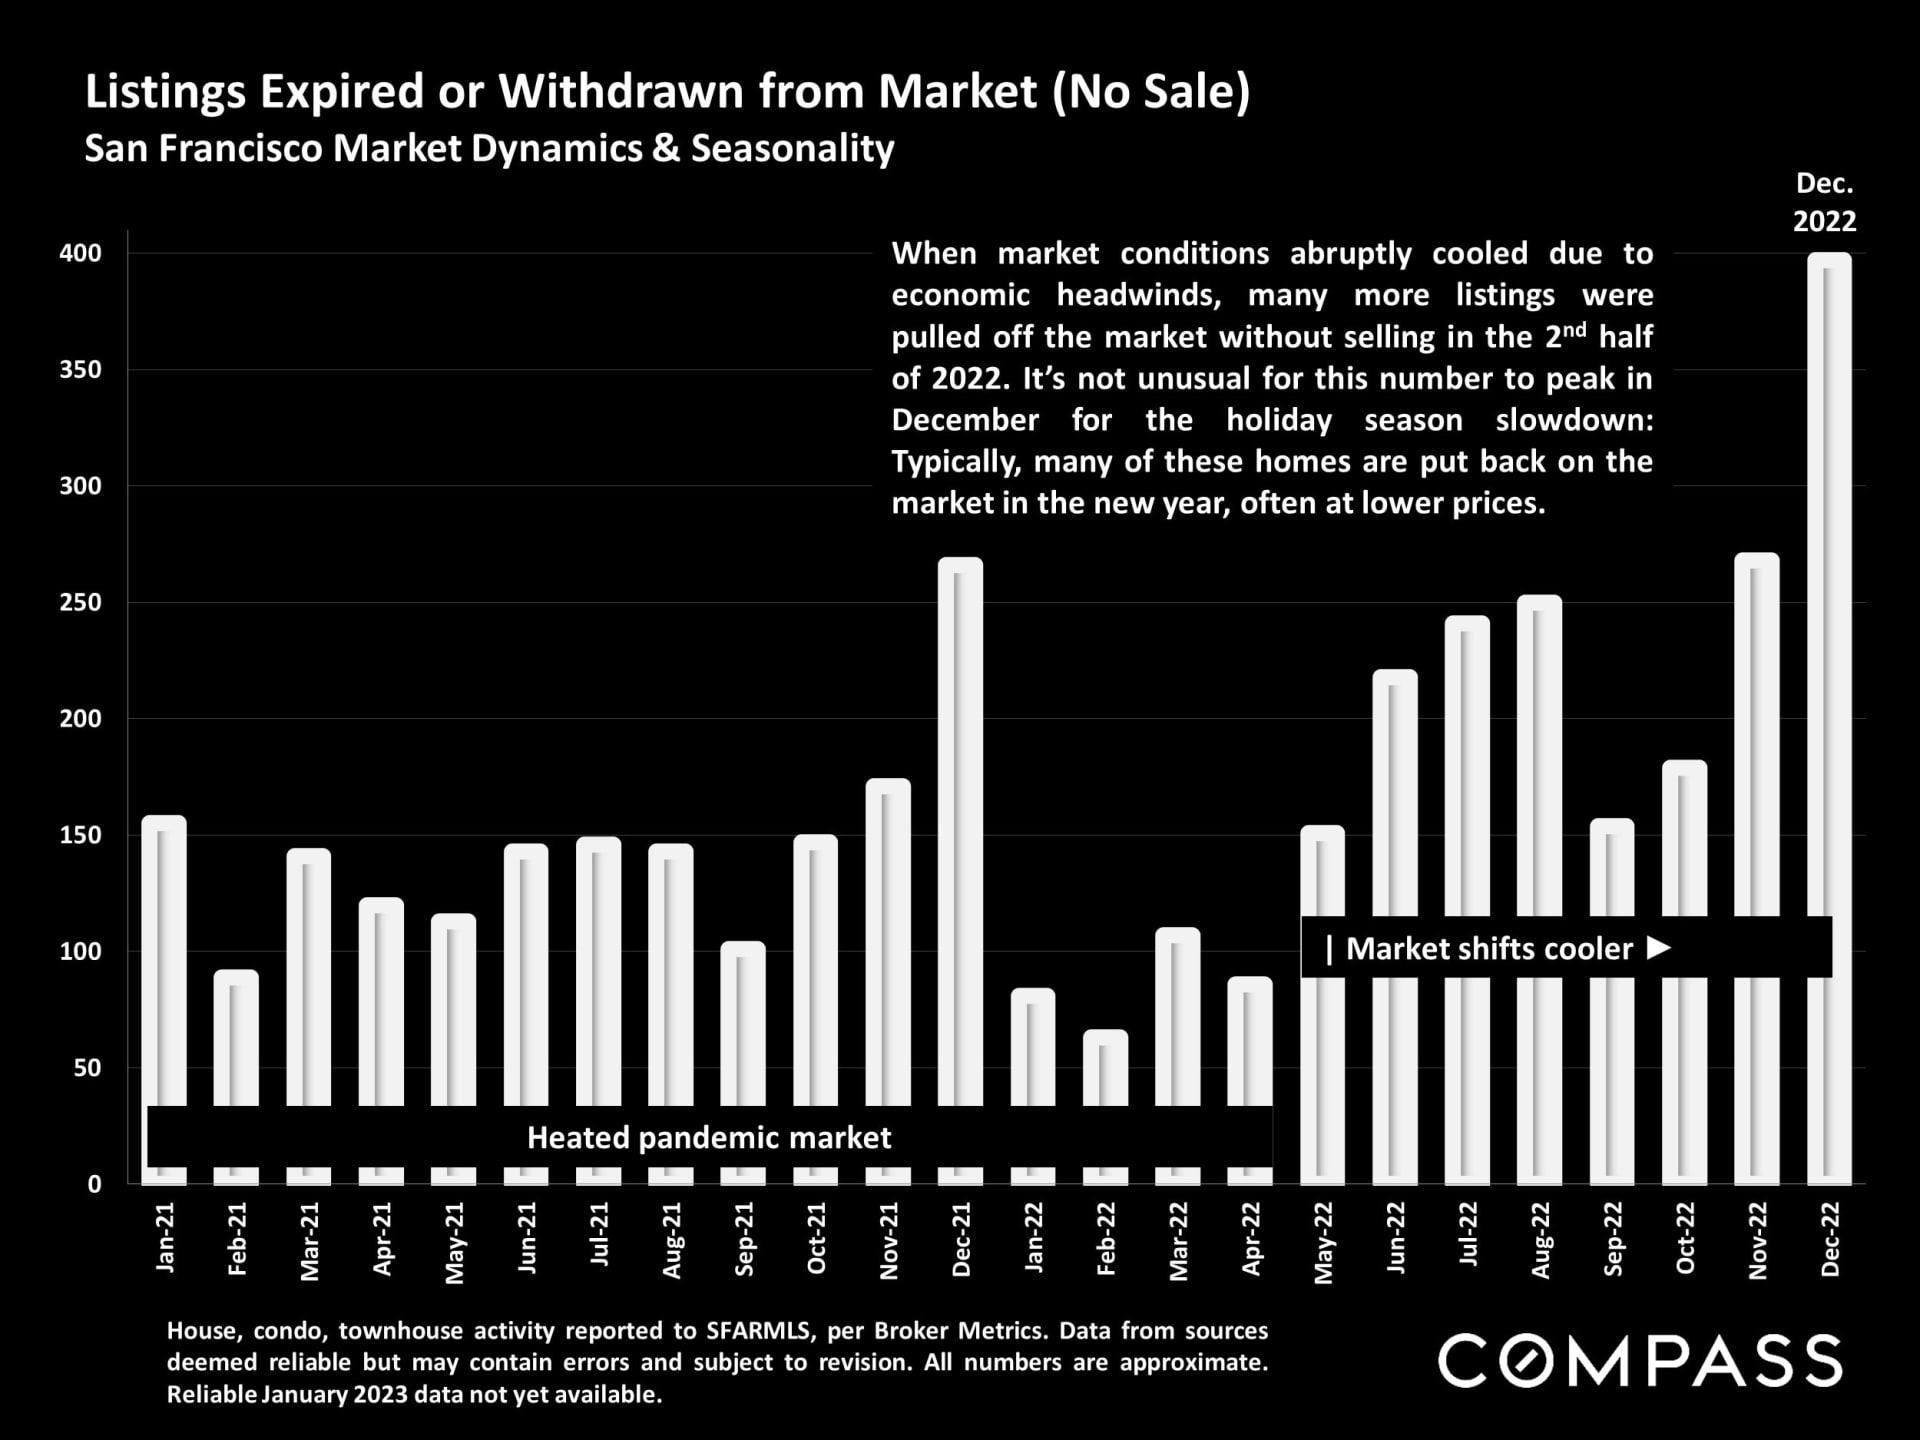
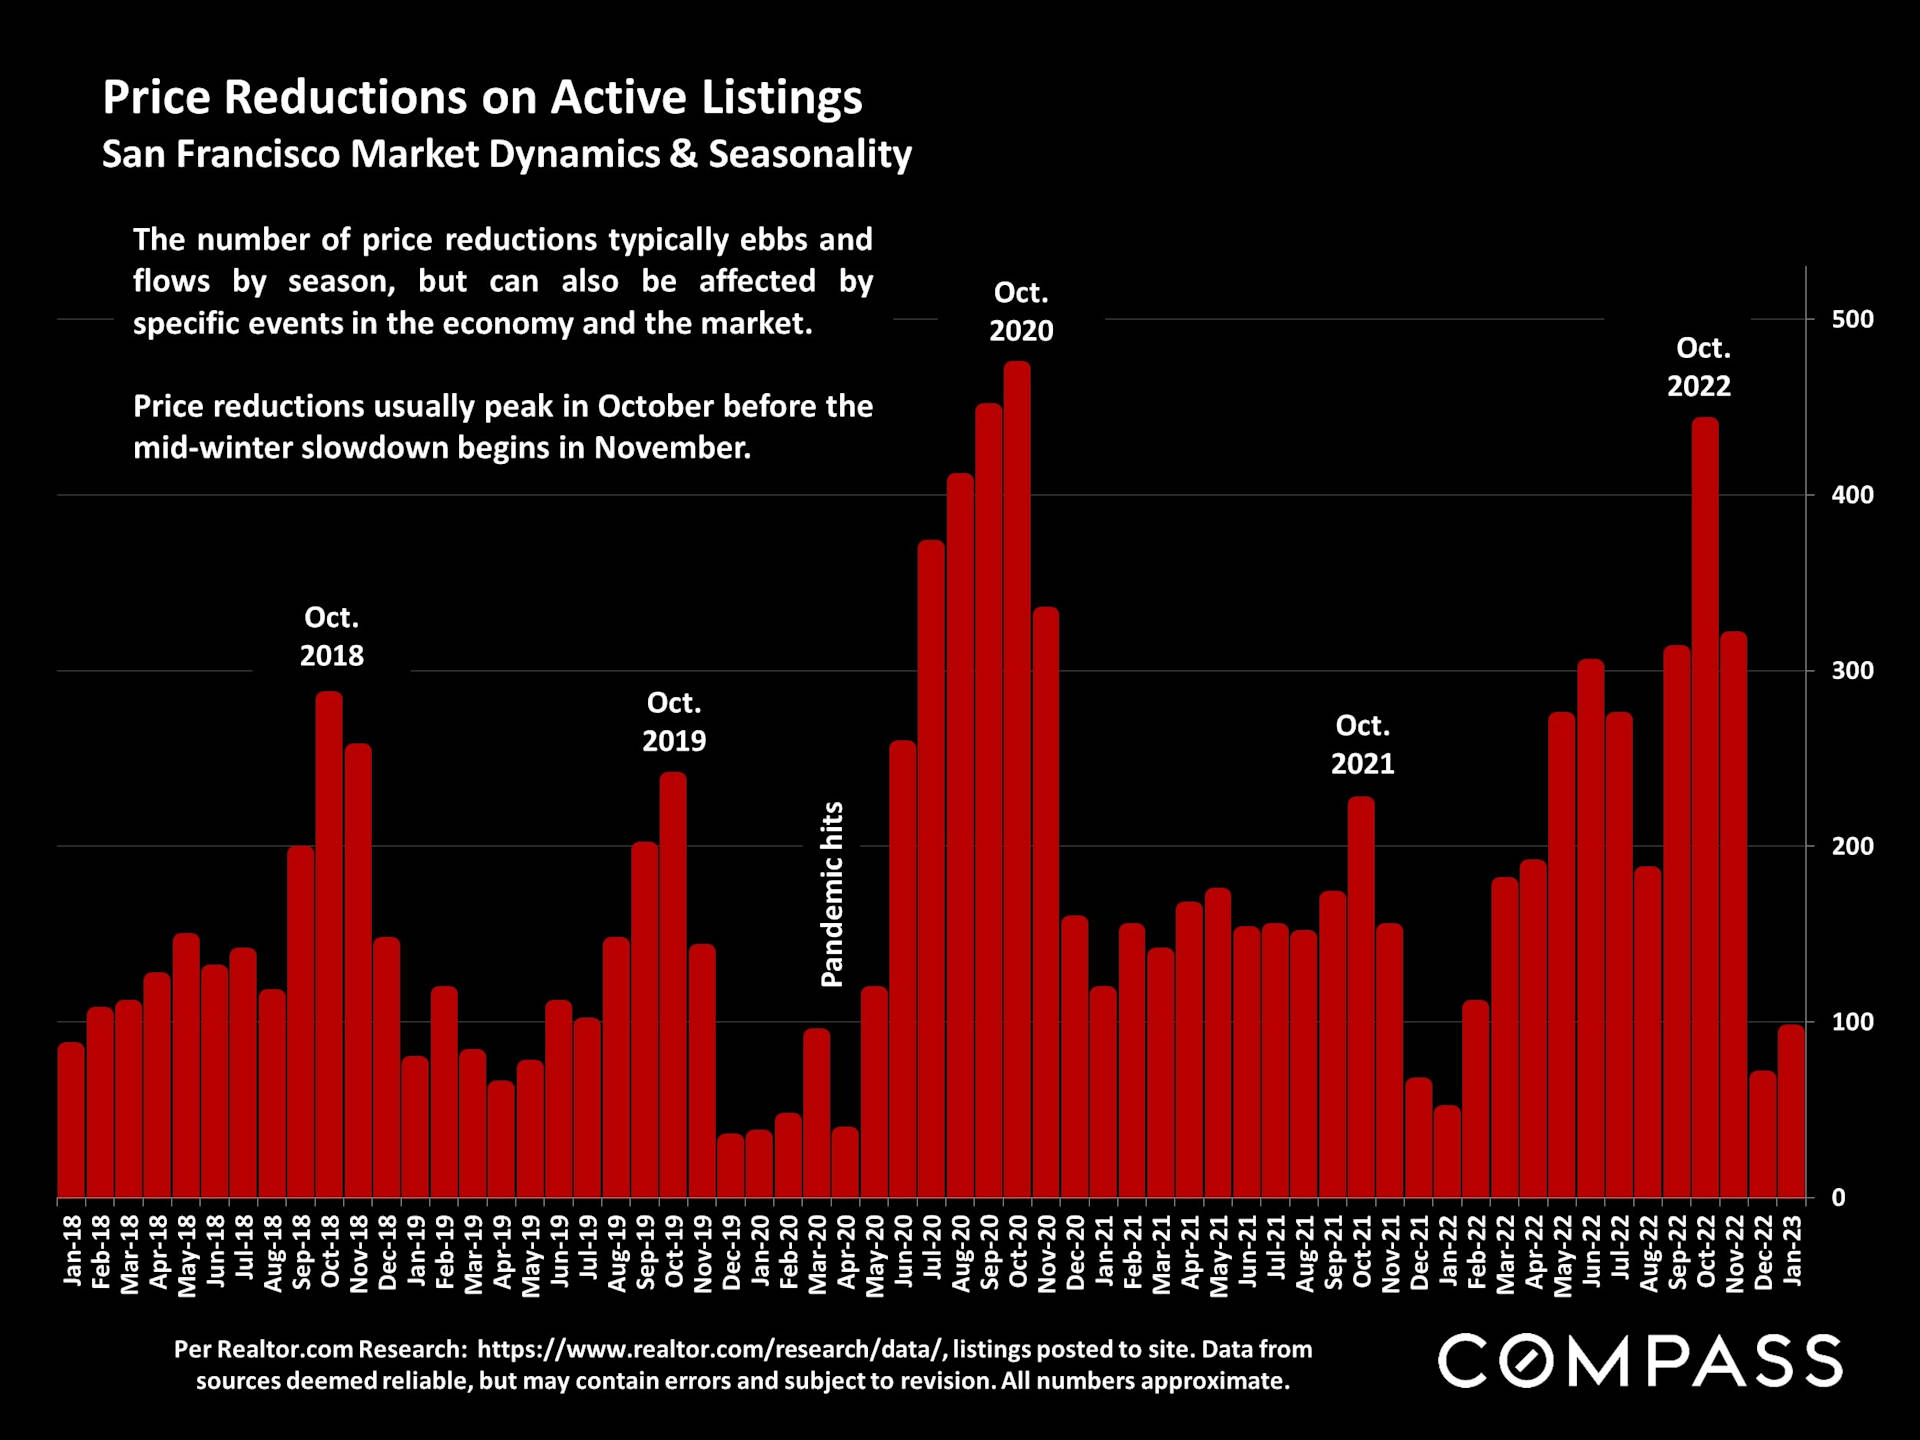
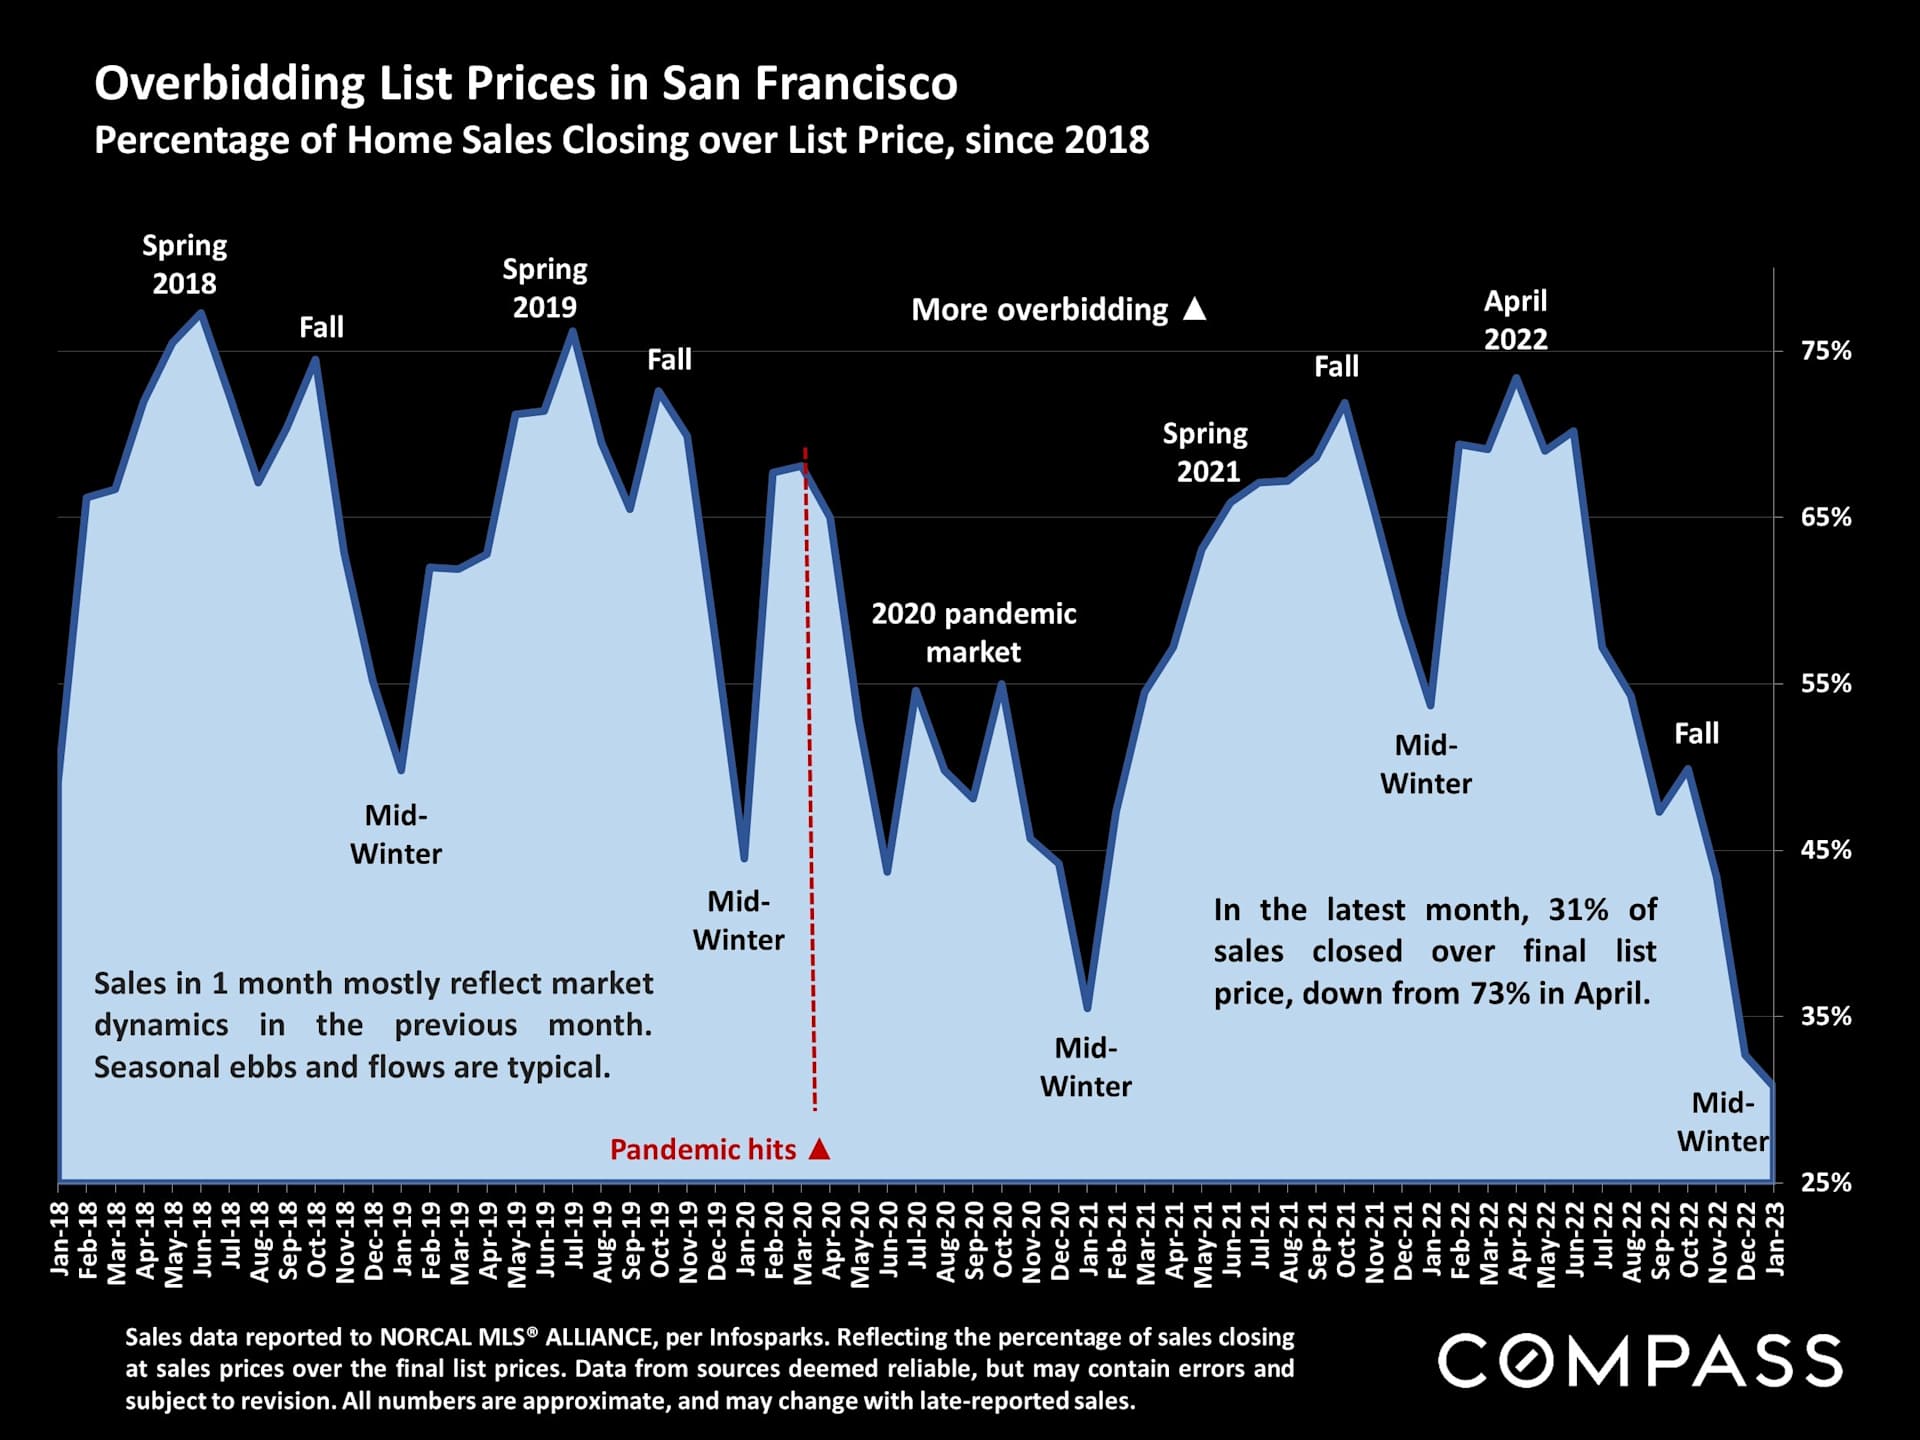
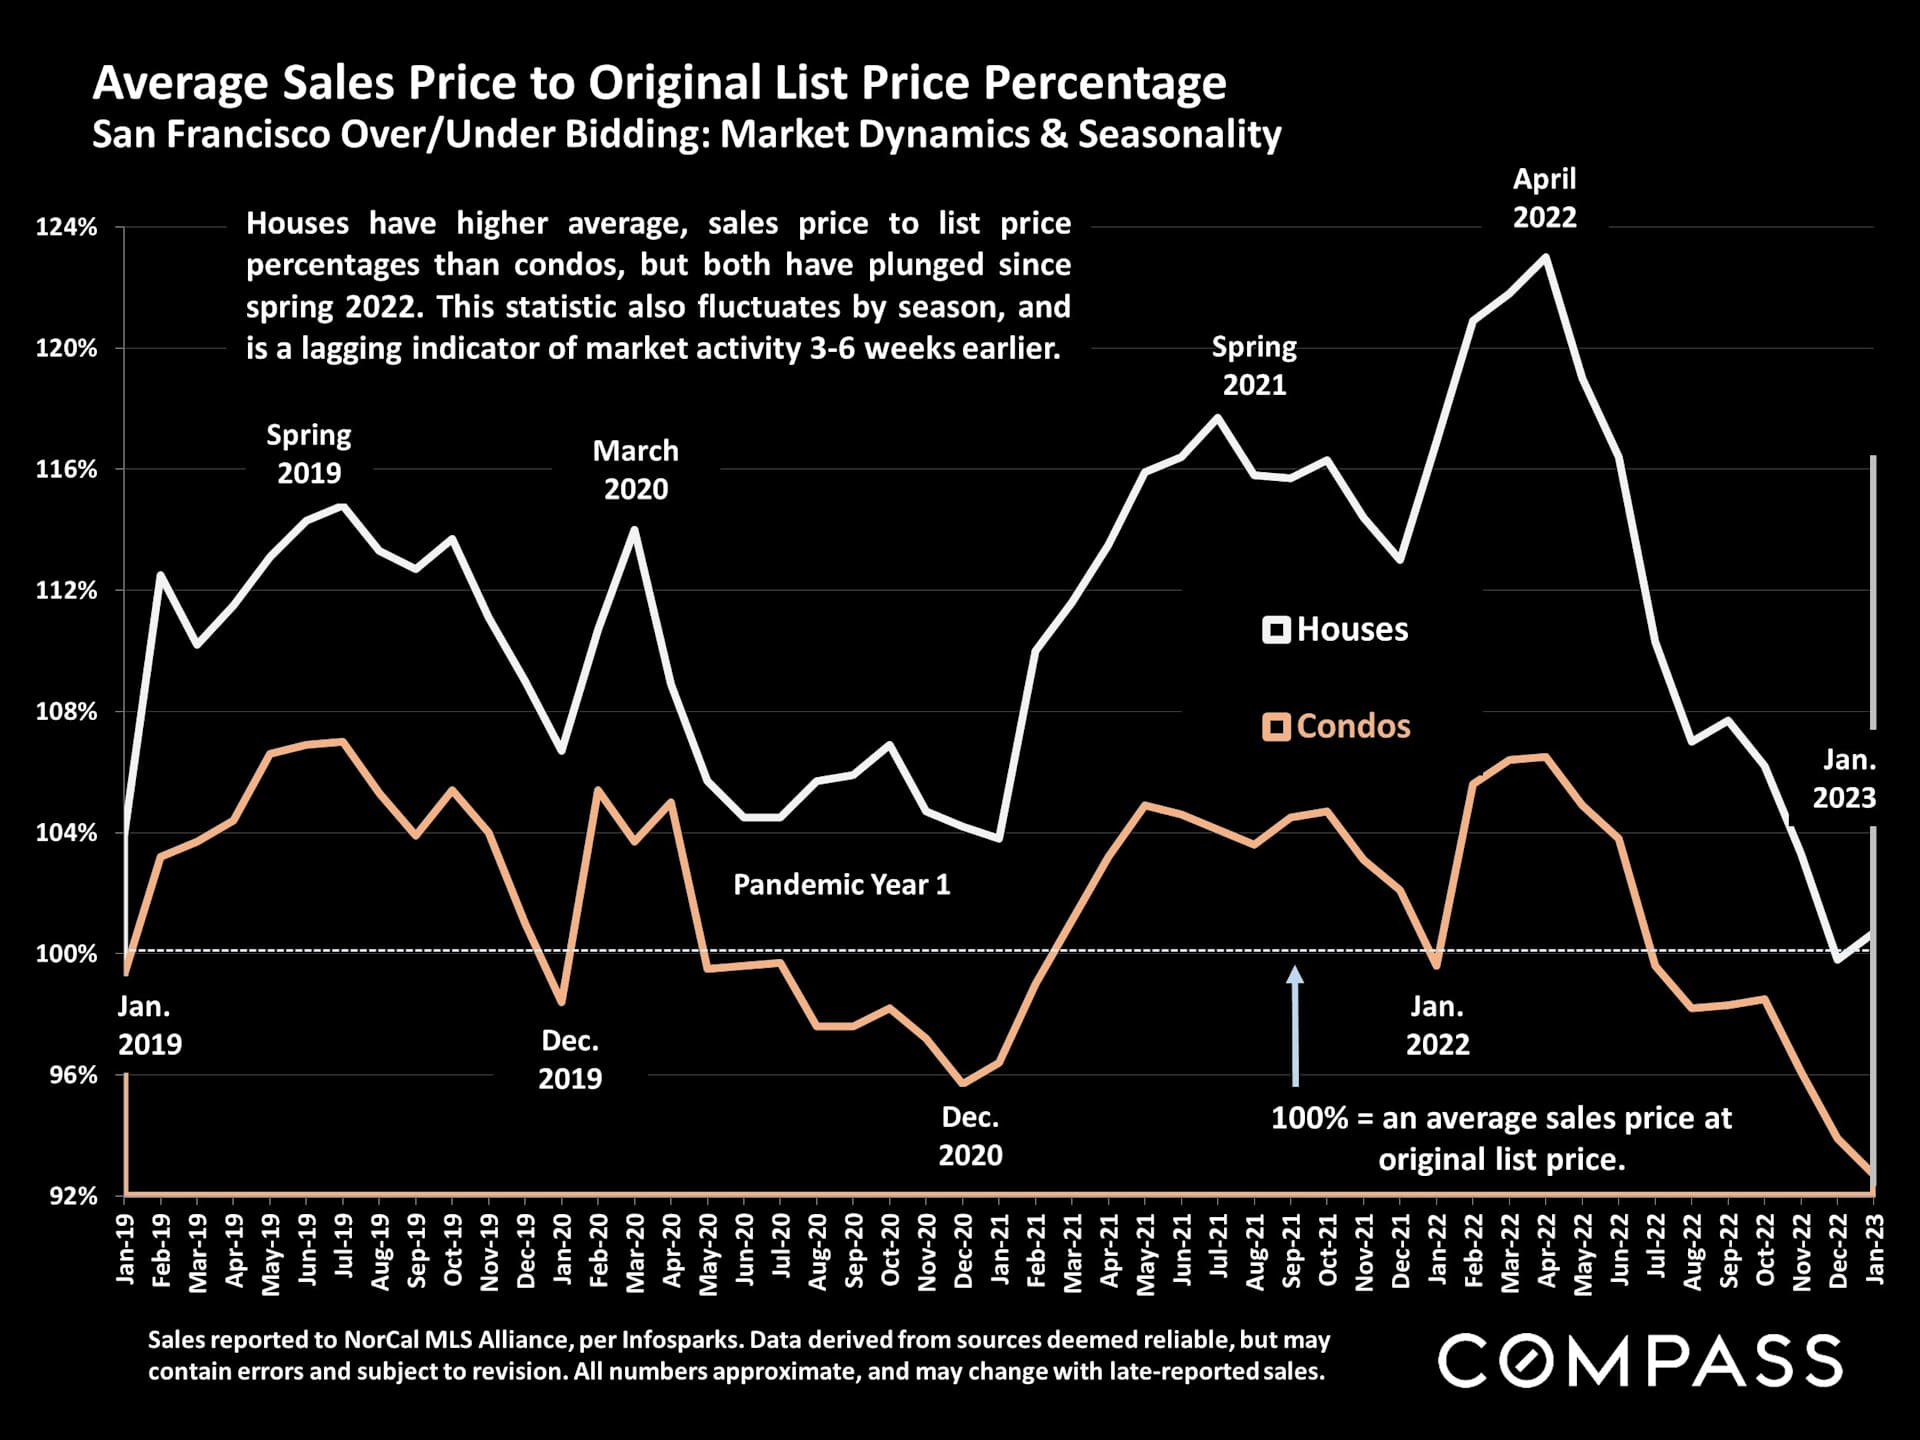
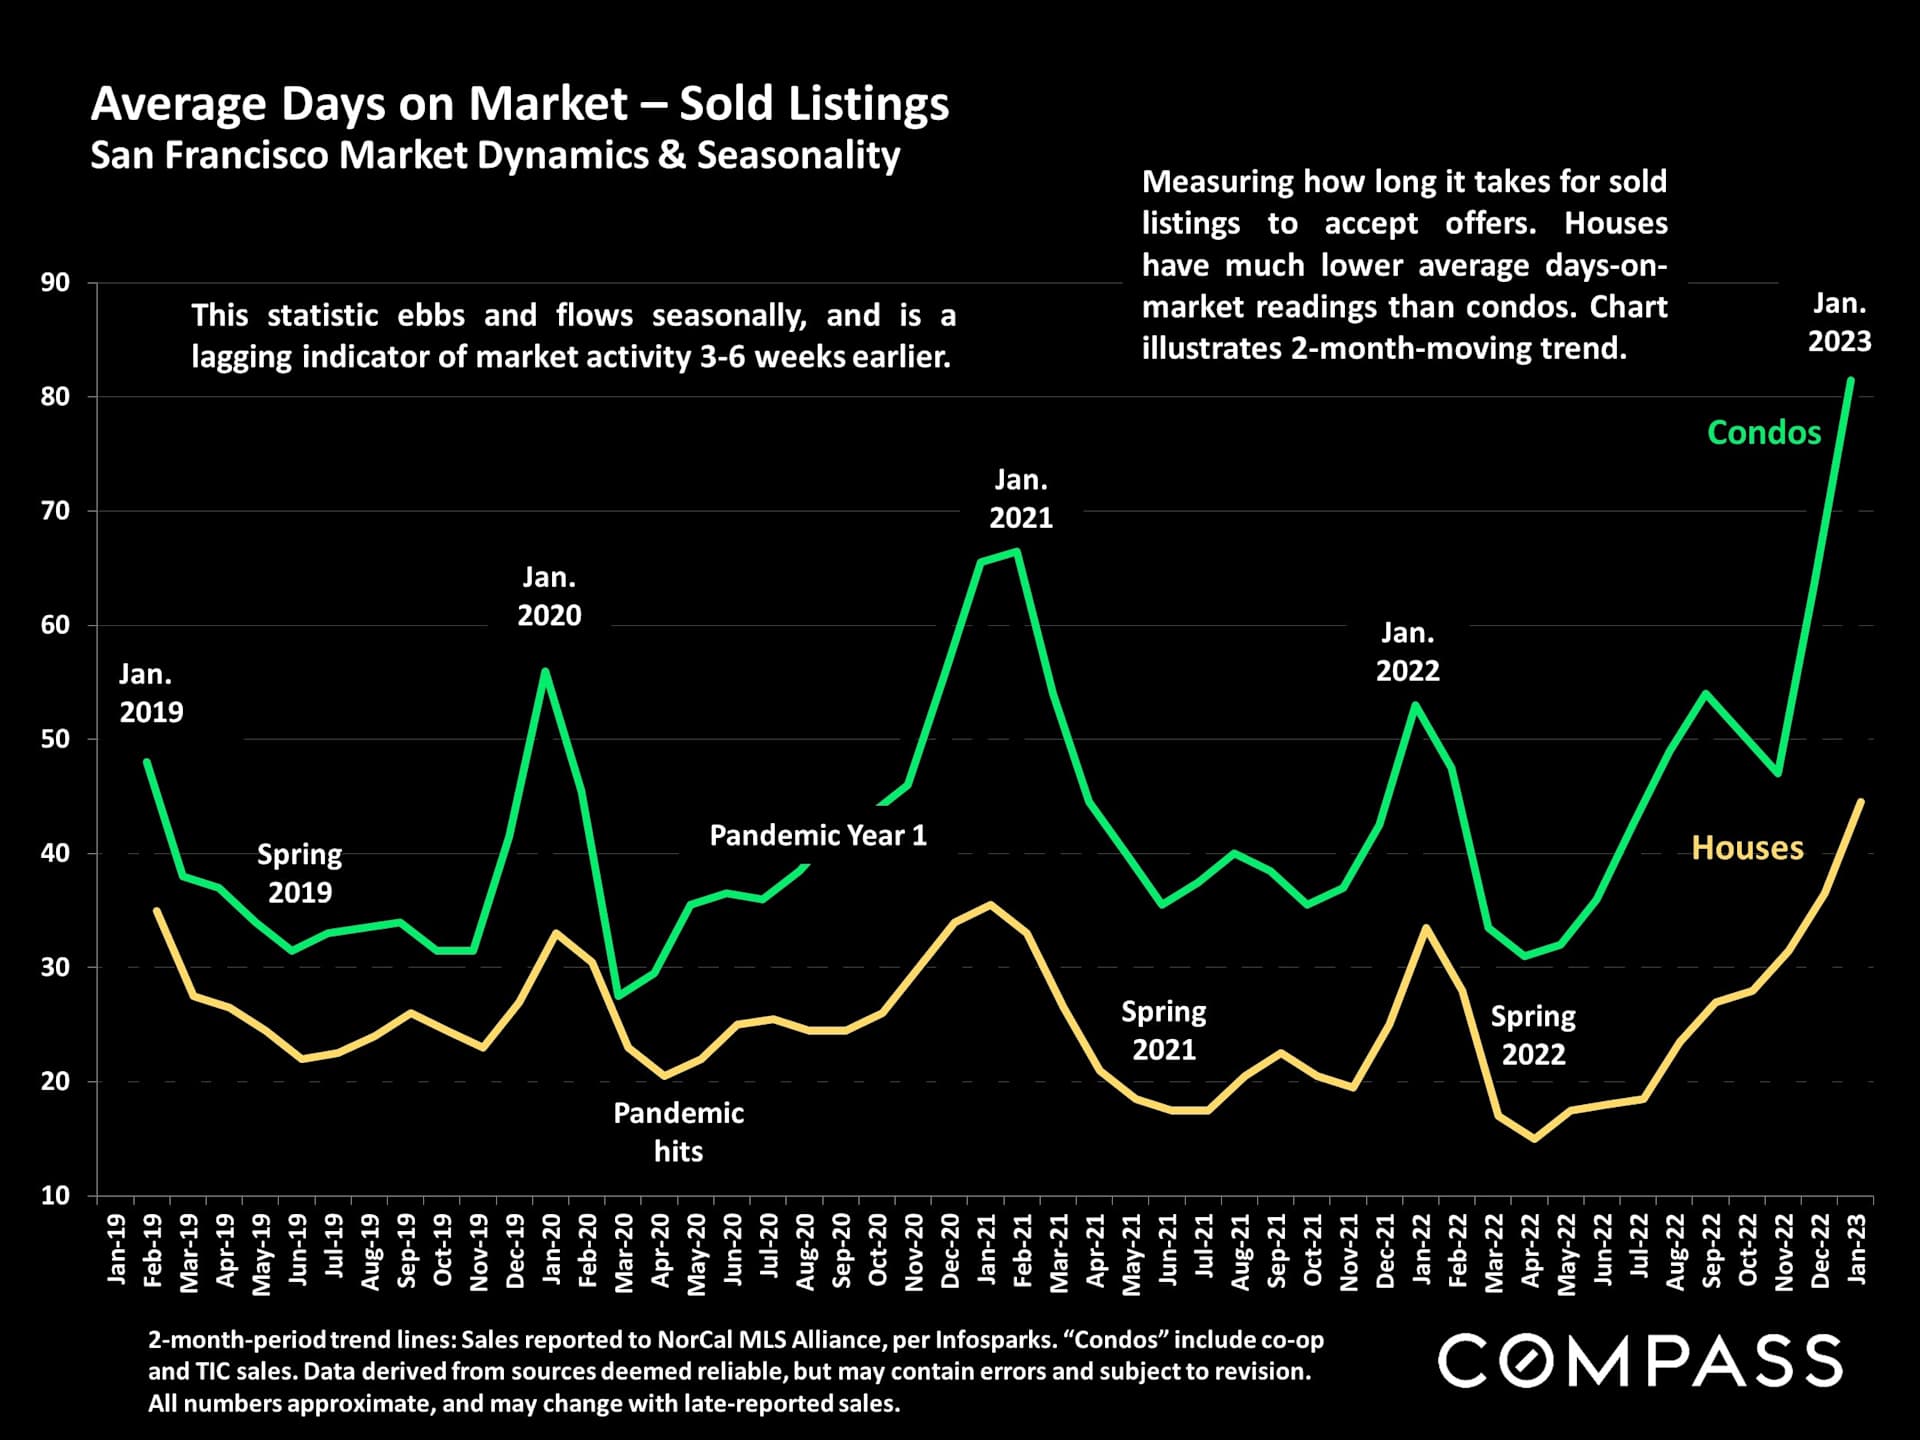
Early 2023 real estate report discusses rebounding buyer demand in San Francisco and the Bay Area.San Francisco real estate report discusses early 2023 market conditions and the spring selling season.Chart of 30-year mortgage rates from January 2022 to February 2023, peaking near 7% before declining to 6.09%.Chart comparing S&P 500 and Nasdaq percentage declines from January 2022 to February 2023.Chart of San Francisco house prices from 1990 to 2023, peaking above $2 million in 2022 before declining.San Francisco early 2023 median house prices by bedroom count and district, with the Compass wordmark.Chart of San Francisco house prices by bedroom count, showing quarterly median sales prices from 2018 to 2022.Bar chart of San Francisco house sales by price and bedroom count, with most sales between $1 million and $2 million.San Francisco luxury house sales infographic with district-by-district price ranges and sales counts.San Francisco housing market demand by price segment, with monthly contract rates from January 2022 to January 2023.Chart of San Francisco two-bedroom condo prices, showing a January 2023 median of $1.215 million, down 9% year over year.Table of median San Francisco condo prices by bedroom count and district, with an early 2023 update.Chart comparing quarterly San Francisco condo median sale prices by bedroom count from 2018 to 2022.Chart comparing quarterly median San Francisco condo sale prices by bedroom count from 2018 to 2022.San Francisco six-month home sales by price and bedroom count, shown in a colored bar chart.San Francisco luxury condo, co-op, and TIC sales by district and price segment in an Early 2023 report.San Francisco condo market demand bar charts by price segment, showing monthly contract rates from January 2022 to January 2023.San Francisco condo, co-op, and TIC market demand by price segment, January 2022–January 2023.Chart of San Francisco new listings from 2018 to 2023, showing recurring spring peaks and December lows.Bar chart of San Francisco active and coming-soon listings, rising from 752 in January to 898 in February 2023.Chart of San Francisco active listings, January 2018–January 2023, with gold bars and a 2020 peak.Chart of San Francisco real estate offers from 2019 to 2023, showing seasonal peaks and a late-2022 decline.Chart of San Francisco listings accepting offers from 2019 to 2023, showing seasonal peaks and a sharp pandemic-era dip.Chart of San Francisco monthly home sales, 2019–2023, highlighting January 2023’s lowest volume since 2009.Chart of San Francisco sales of homes priced over $3 million, with monthly blue bars from 2018 to January 2023.Chart of Bay Area $5 million-plus home sales, showing 30 sales in January 2023, down about 49% year over year.Bar chart of San Francisco listings withdrawn without sale, with a pronounced rise in the second half of 2022.San Francisco monthly active-listing price reductions, January 2018–January 2023, shown in a red bar chart.Chart of San Francisco home sales closing over list price, falling to 31% in January 2023.Chart comparing San Francisco house and condo sale prices to original list prices, January 2019–January 2023.San Francisco average days on market chart, comparing houses and condos from January 2019 to January 2023.Compass real estate report disclaimer and explanations of market statistics.

Work With Us

We will help you understand the complex aspects of the transaction and share our expertise so that you can make the best decisions possible. We are experienced, market savvy, and energetic. With both of us working for our clients, you get twice the amount of attention and insight.