
The SF Team, Eva + James, Compass

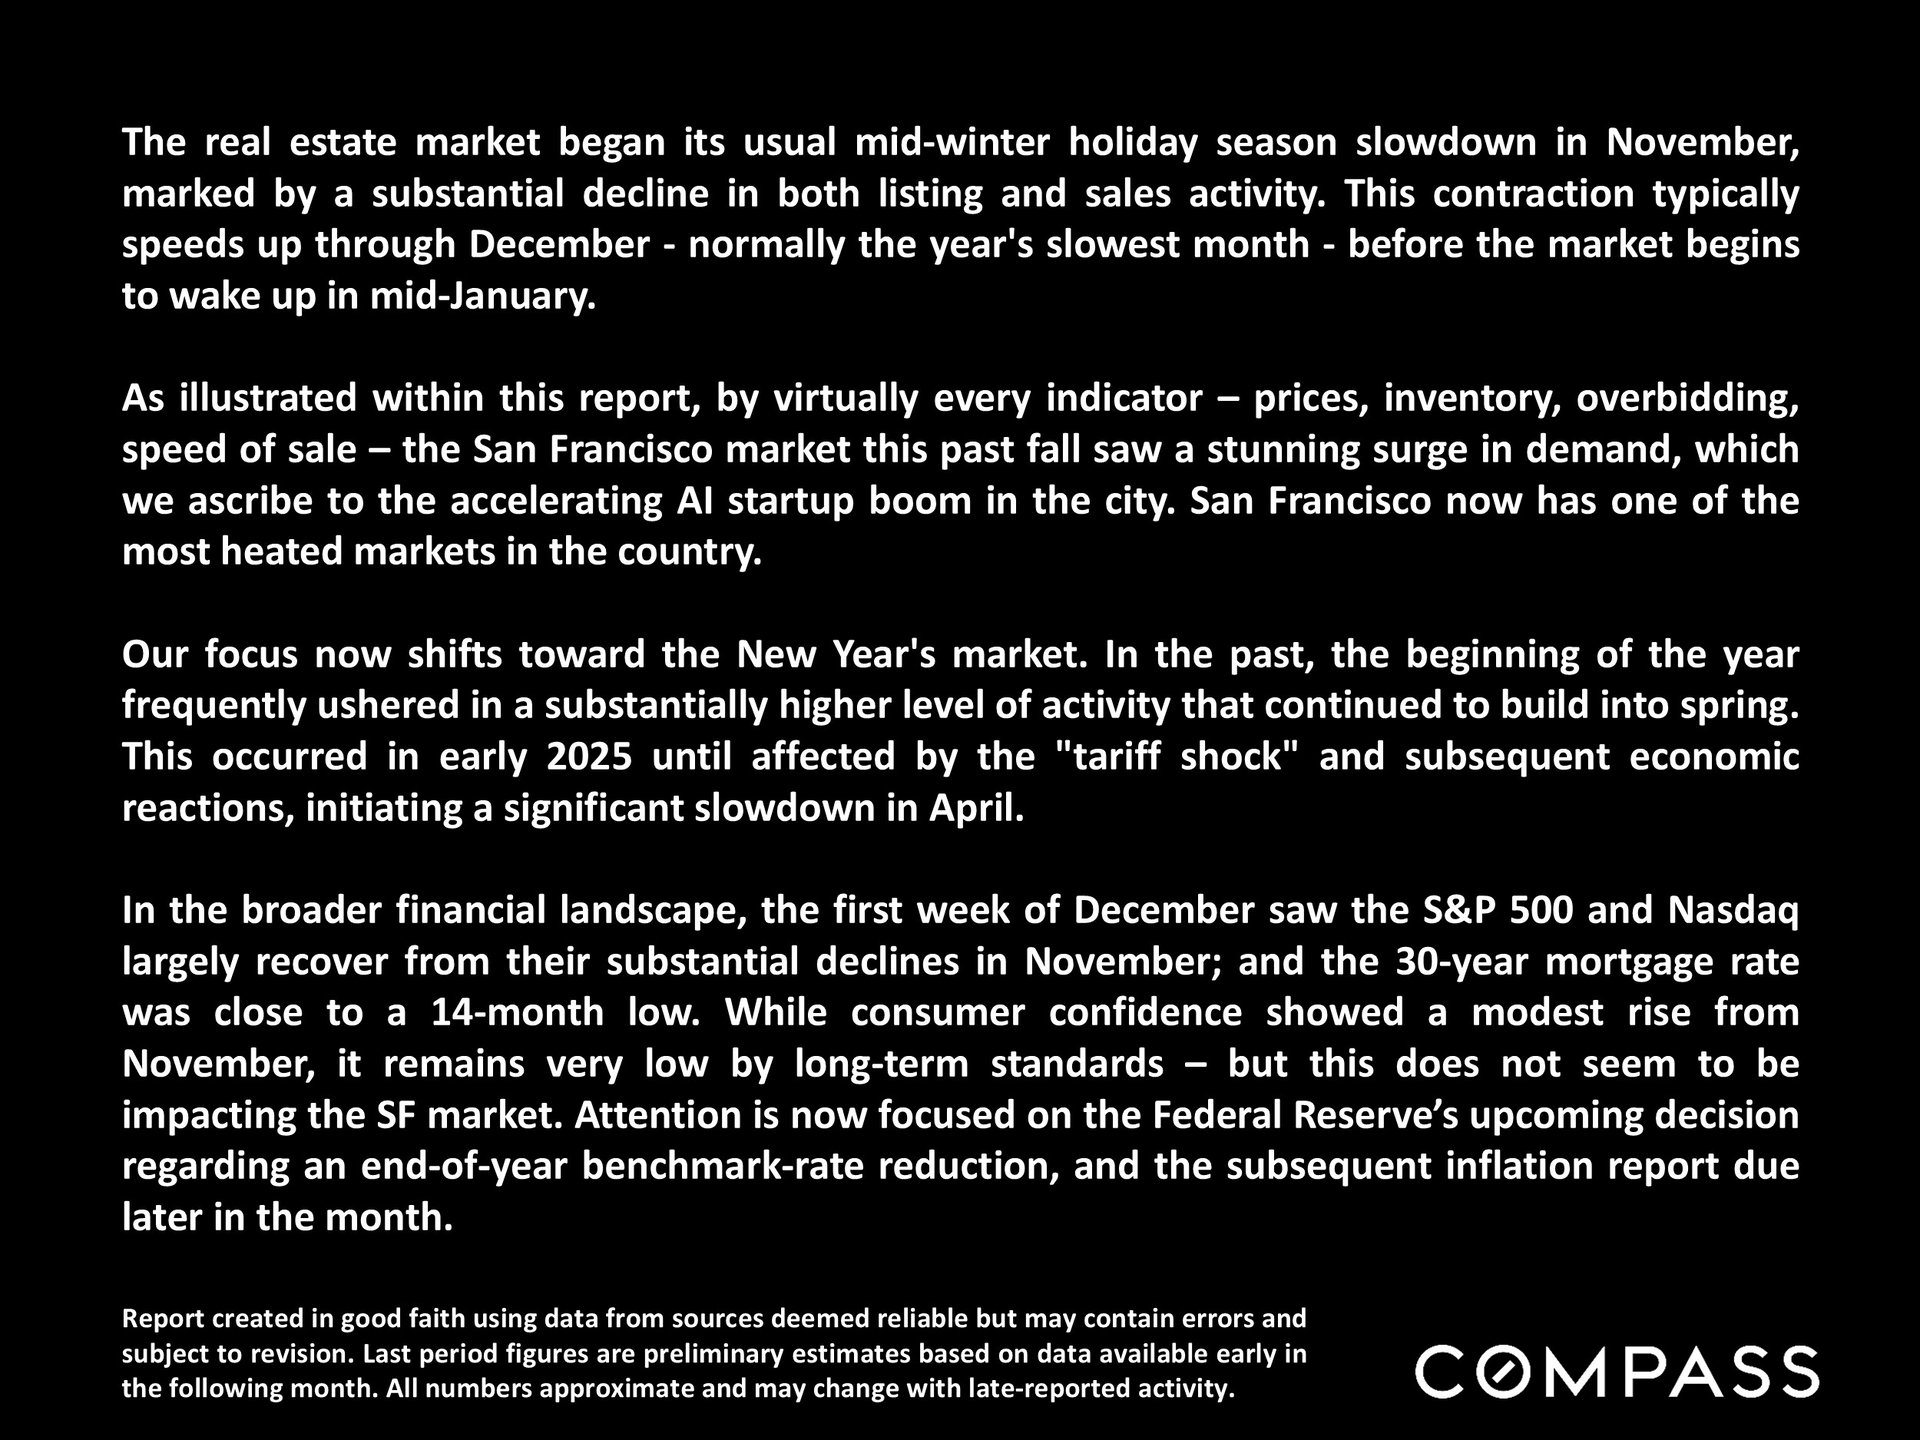
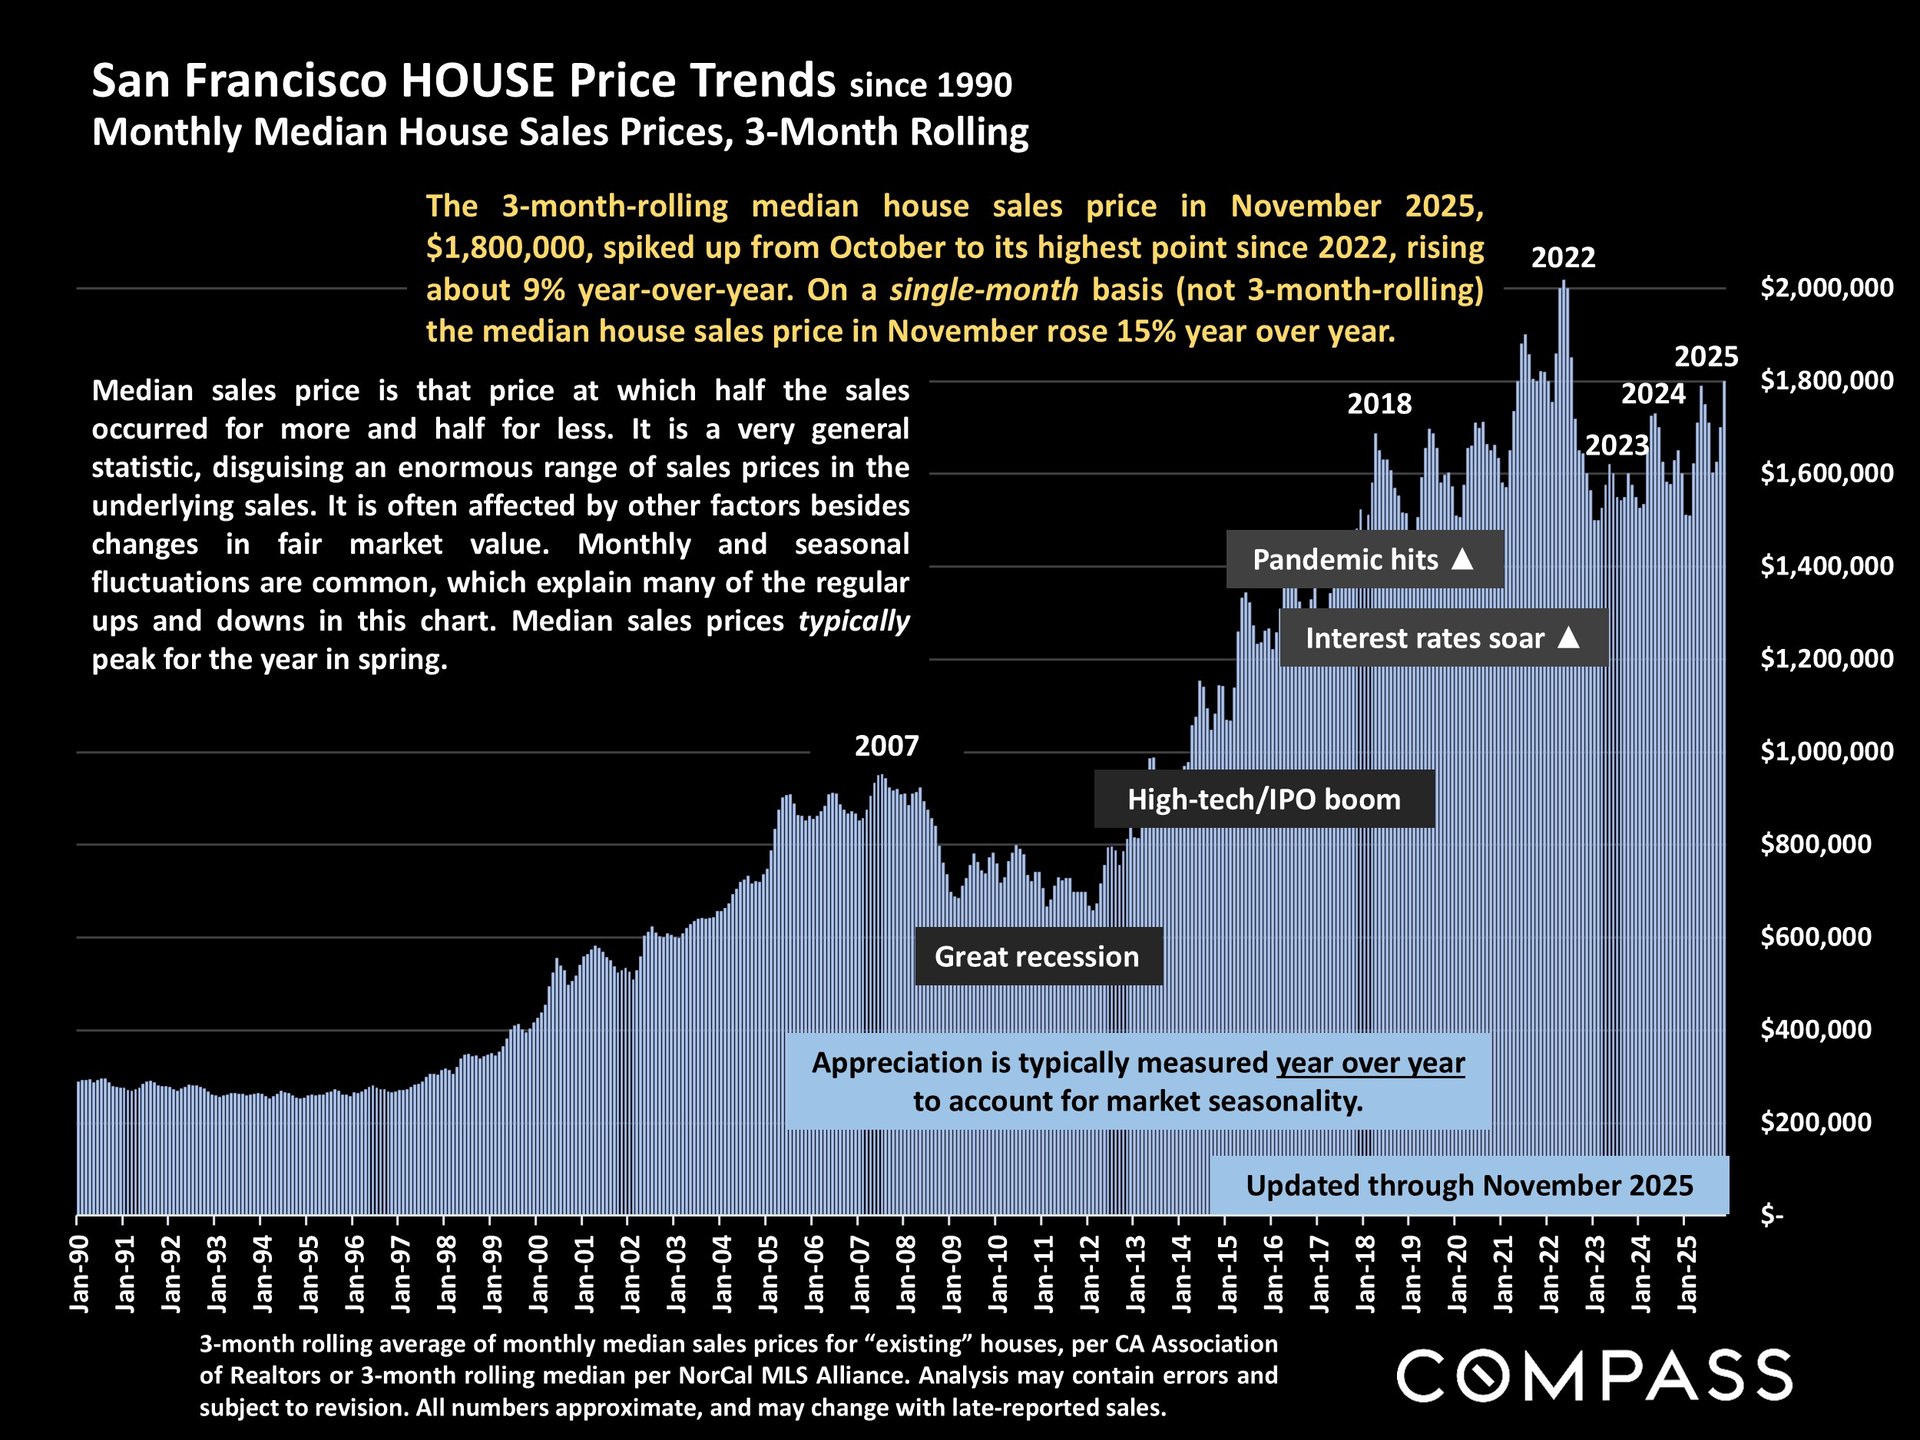
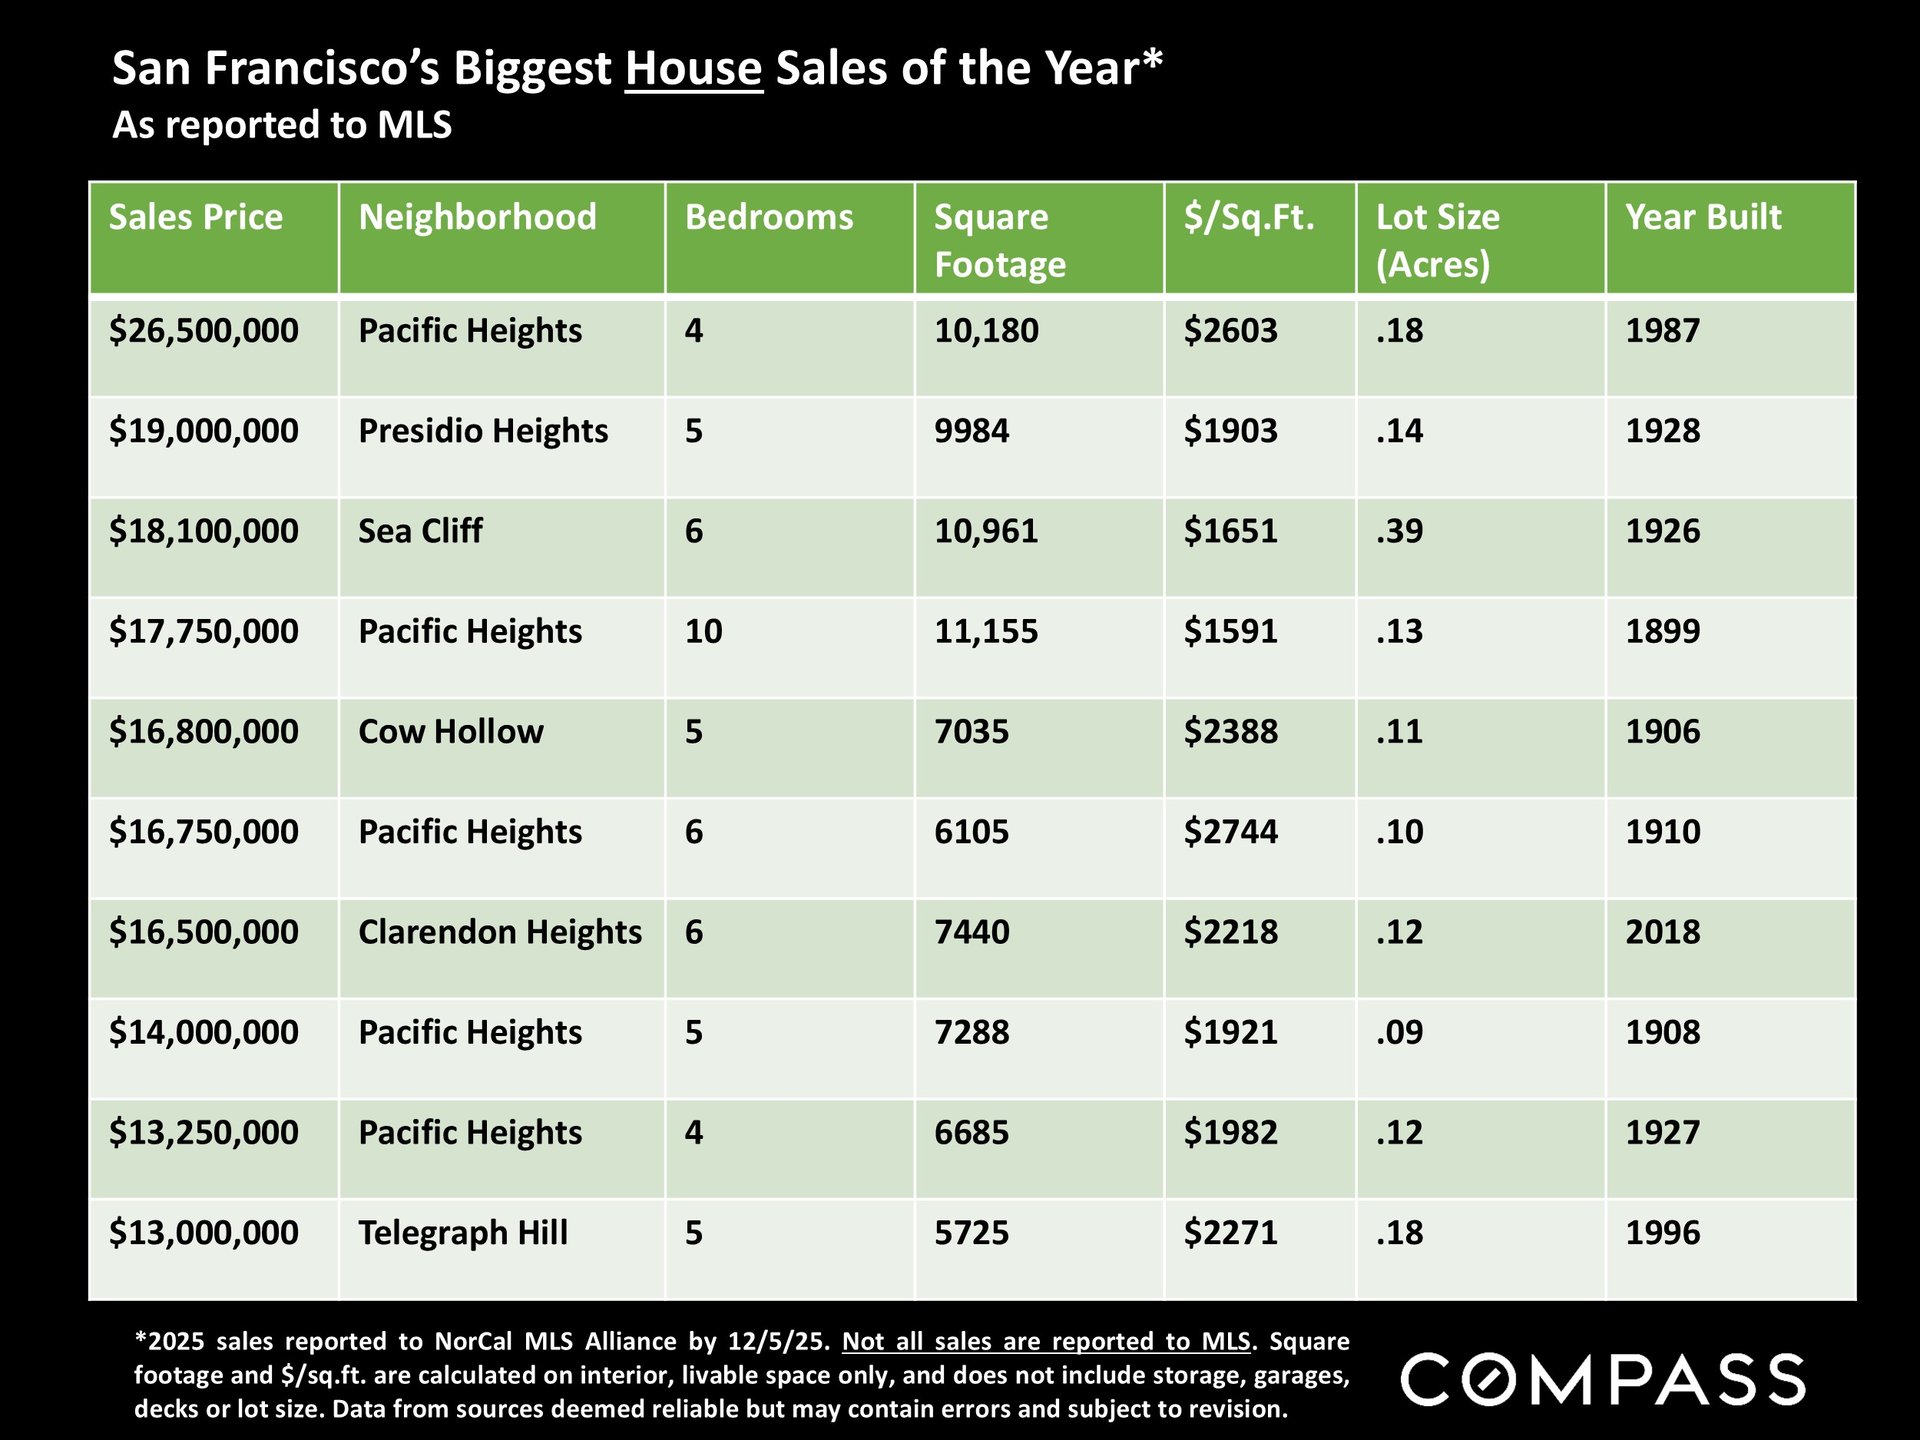
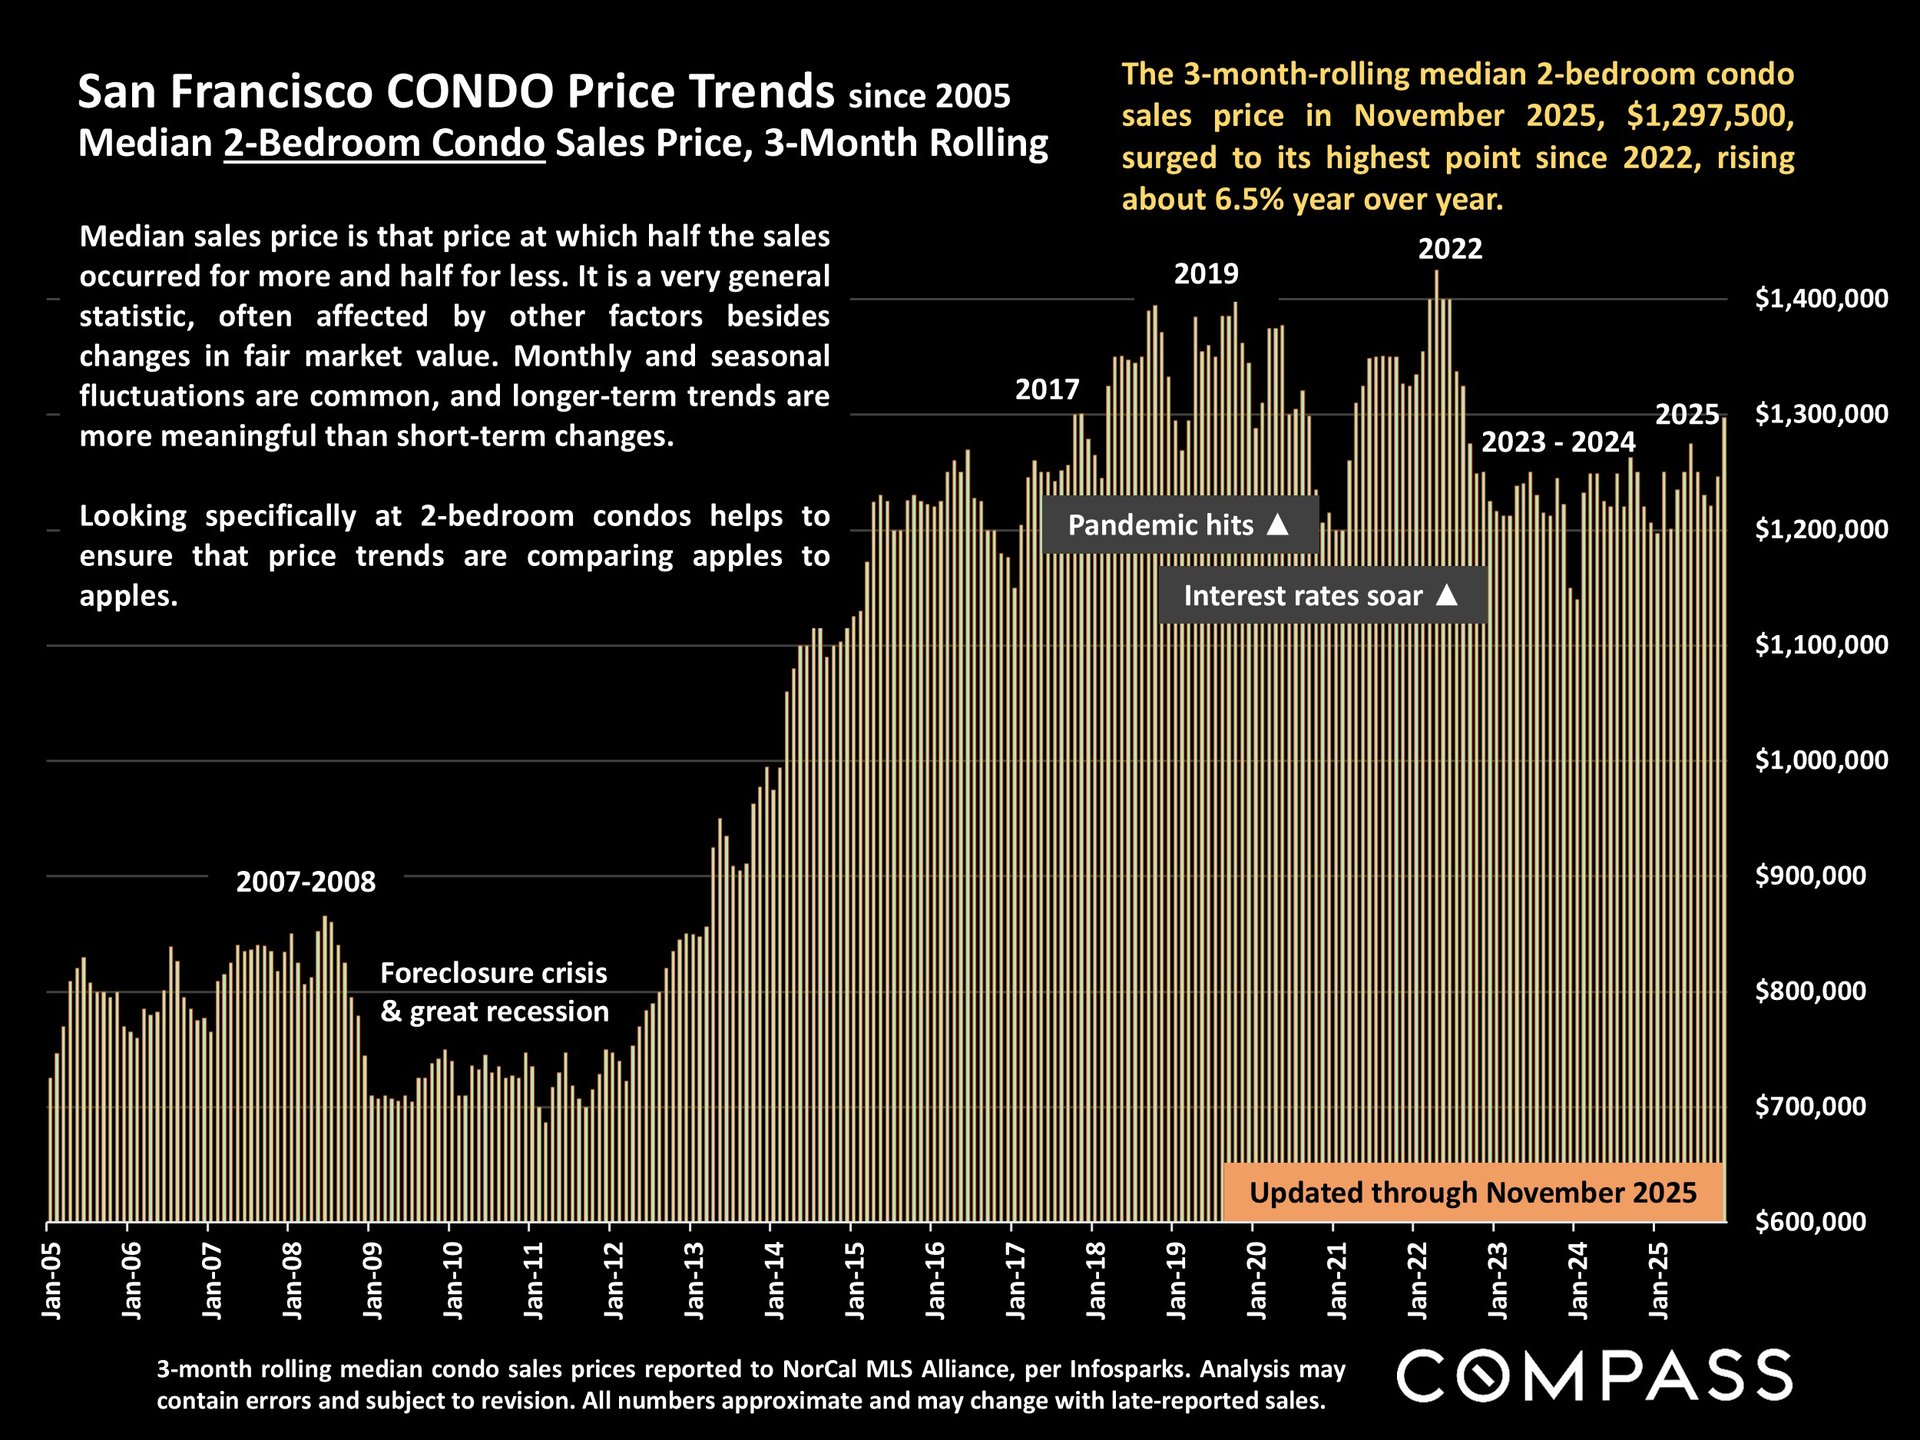
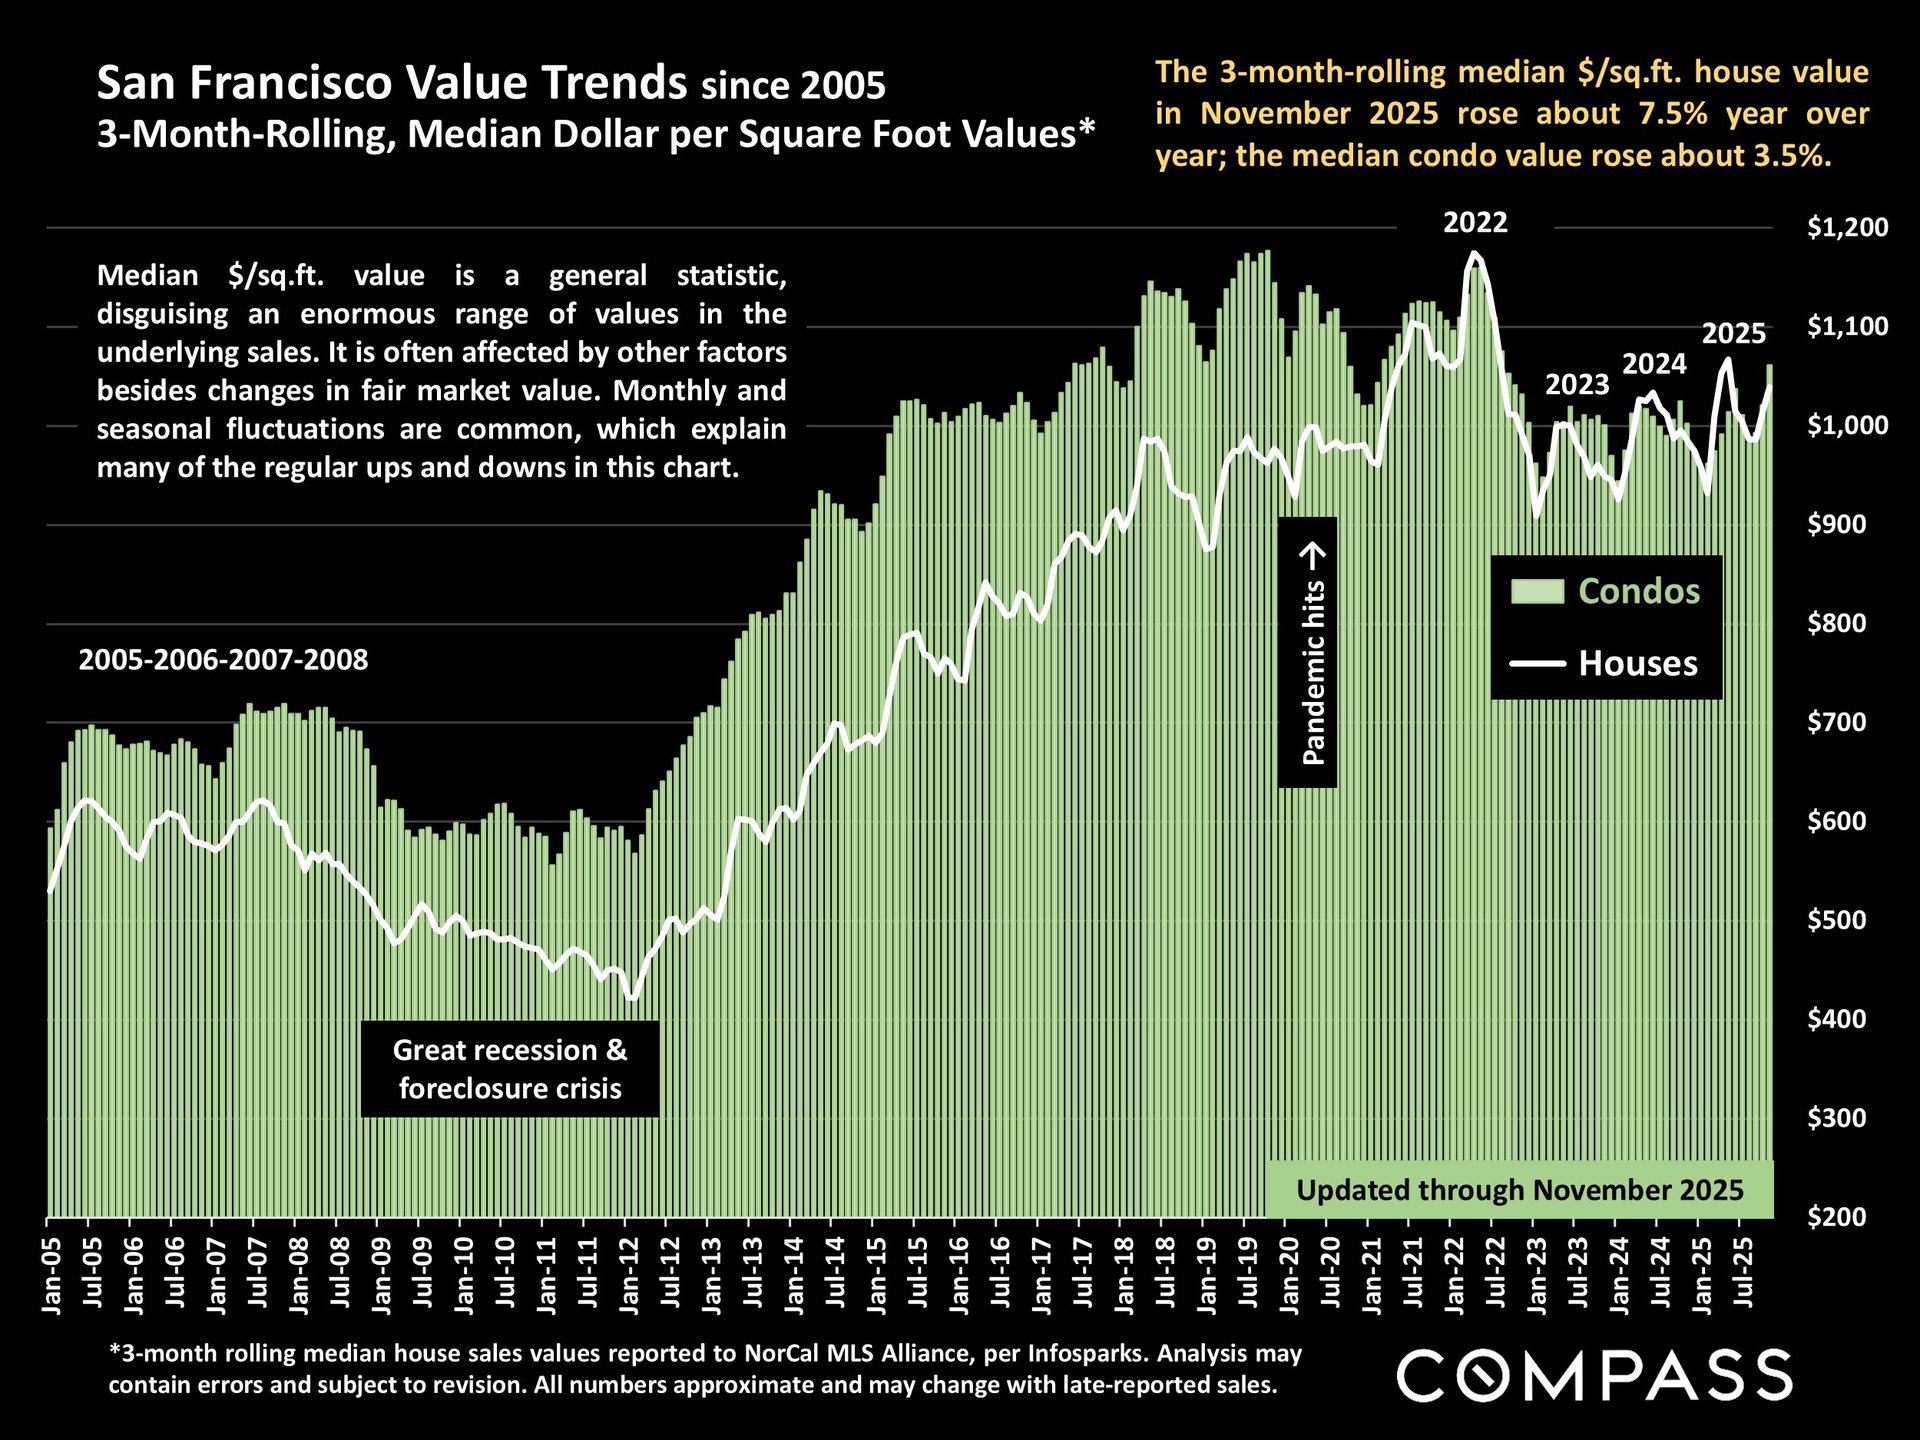
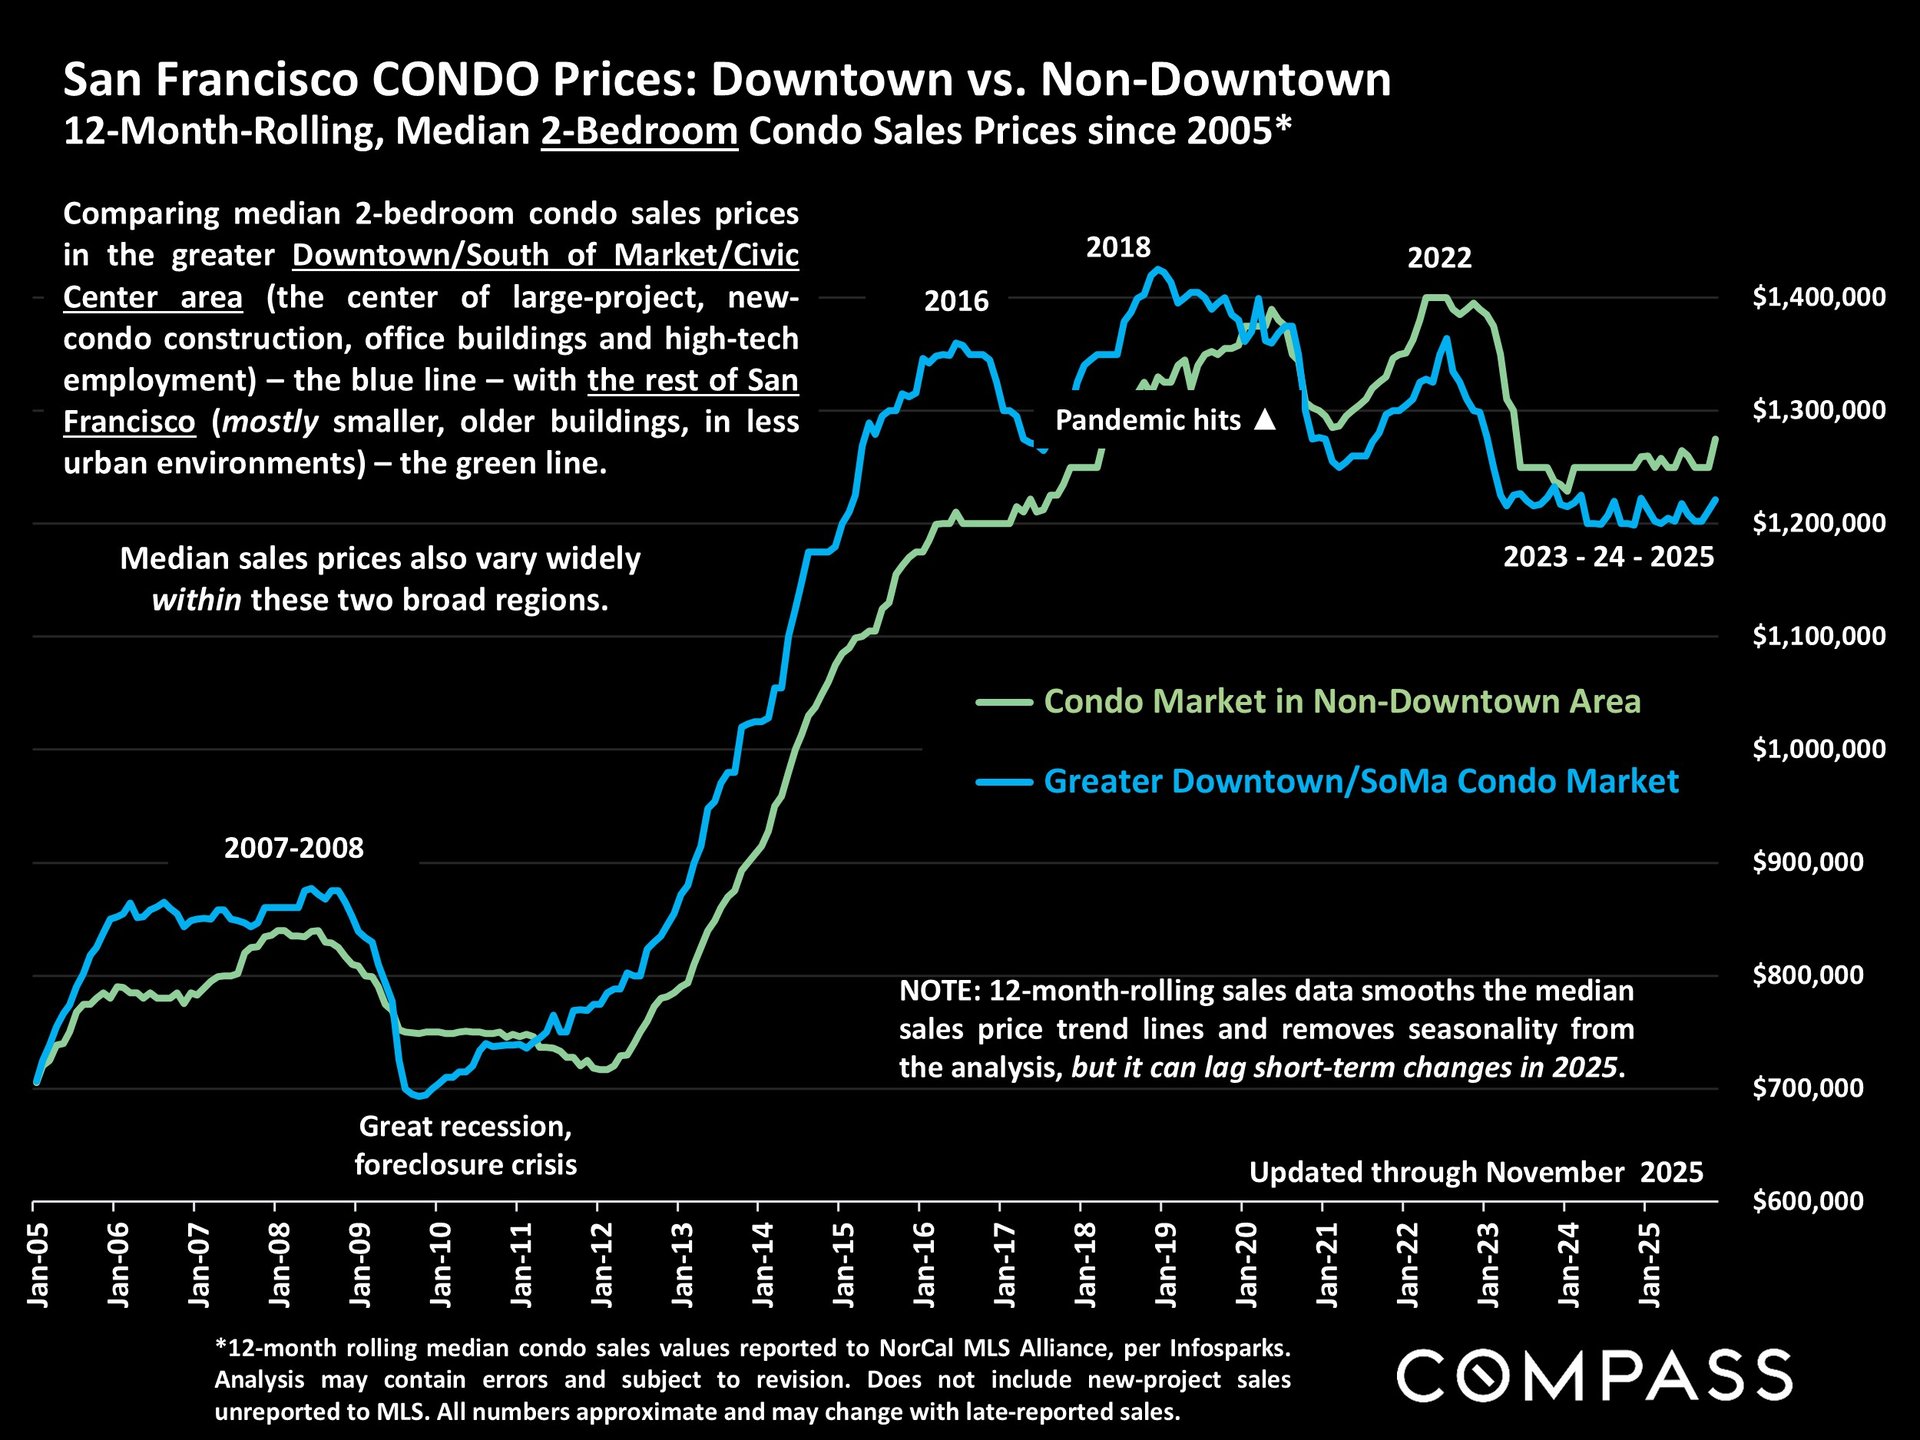
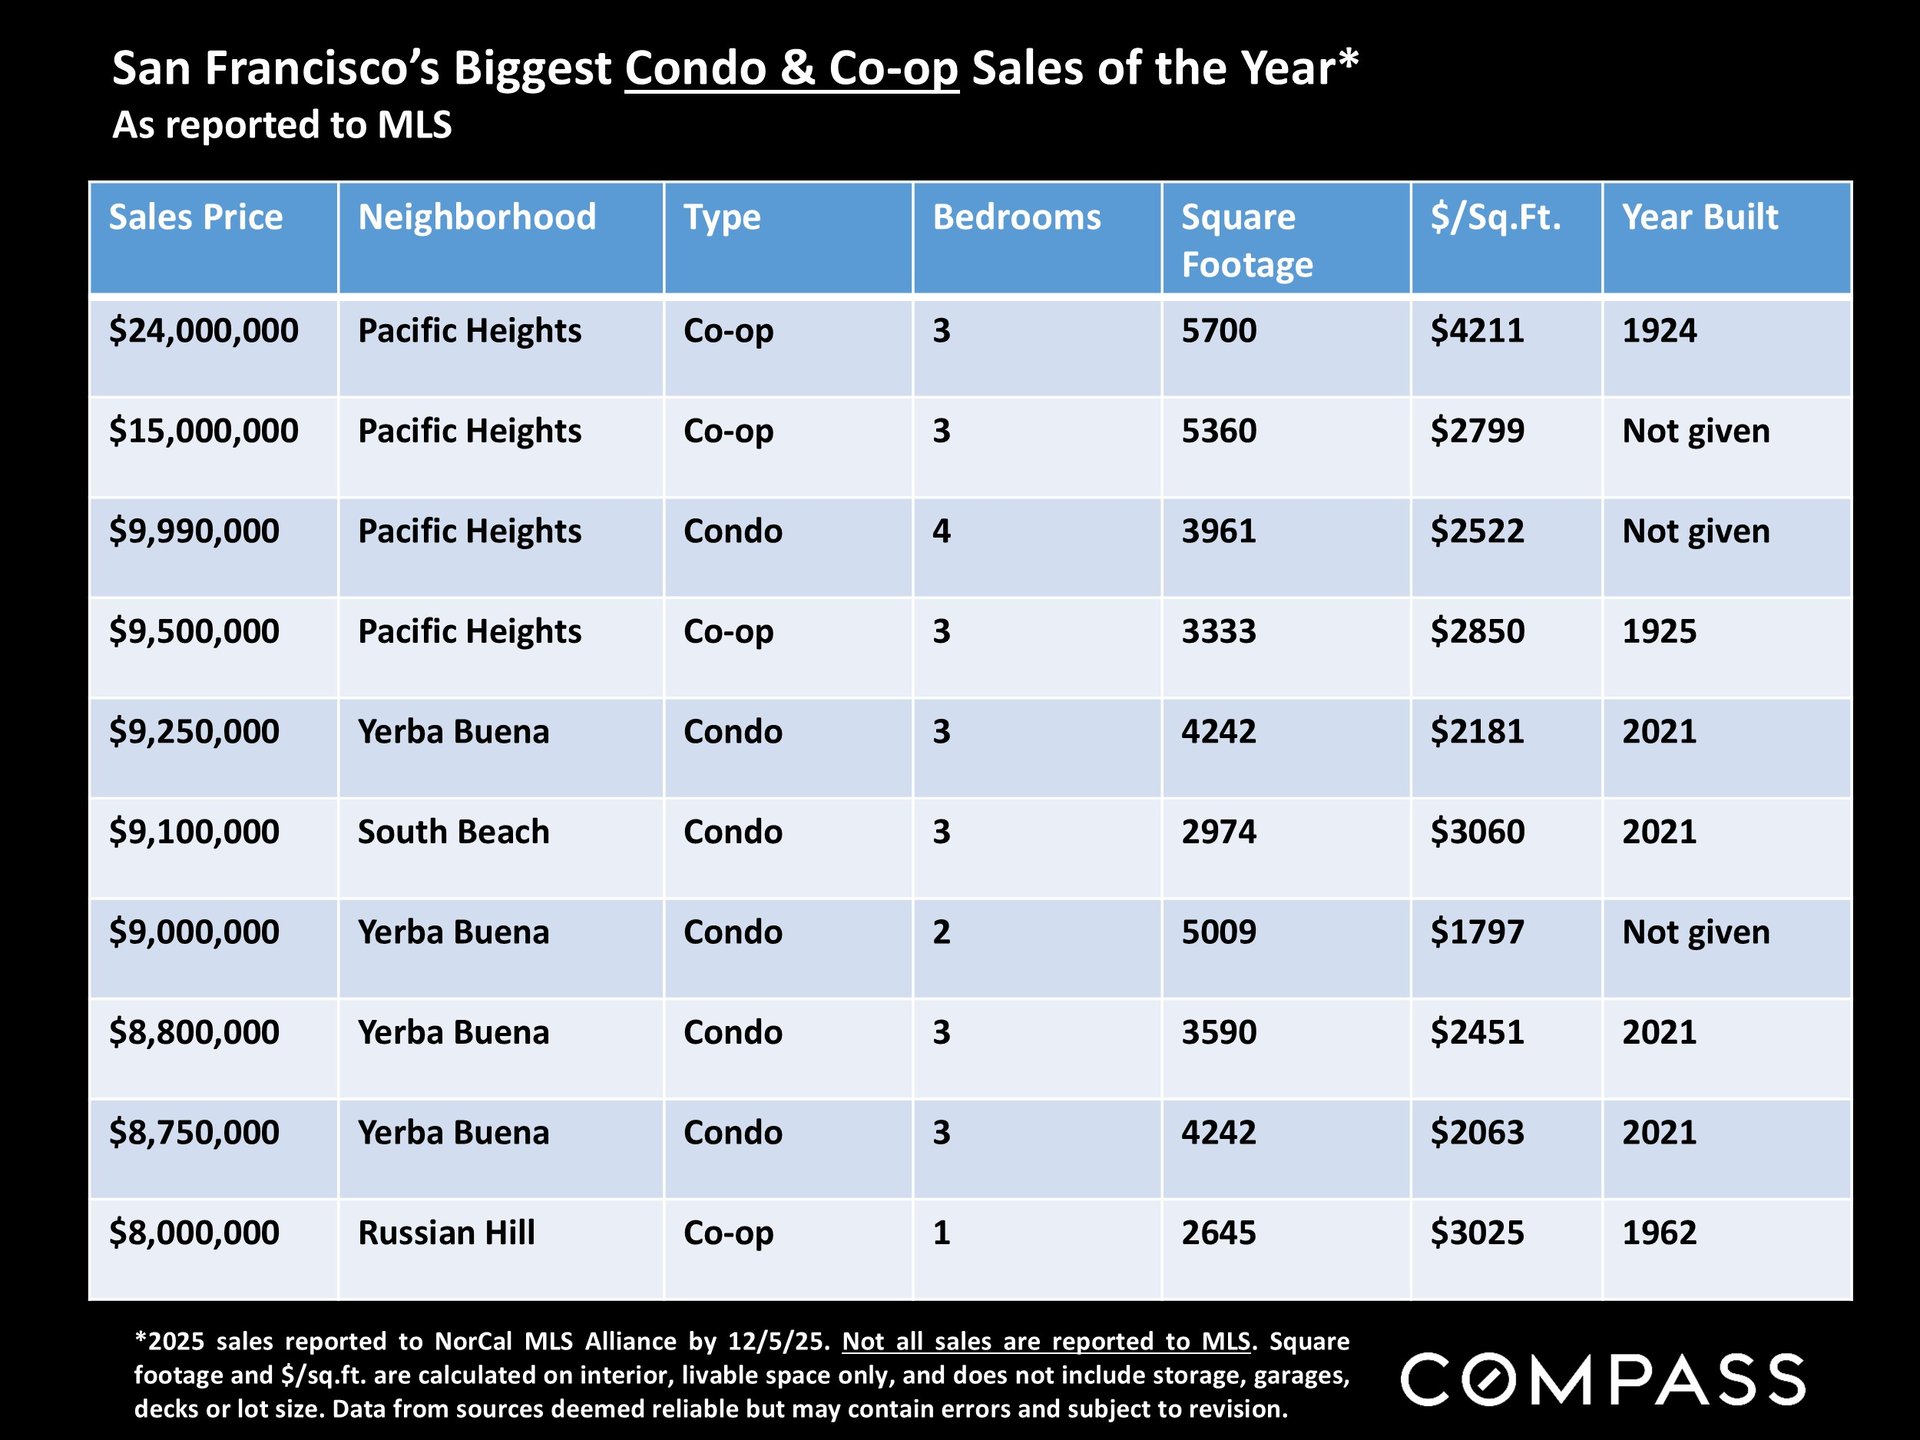
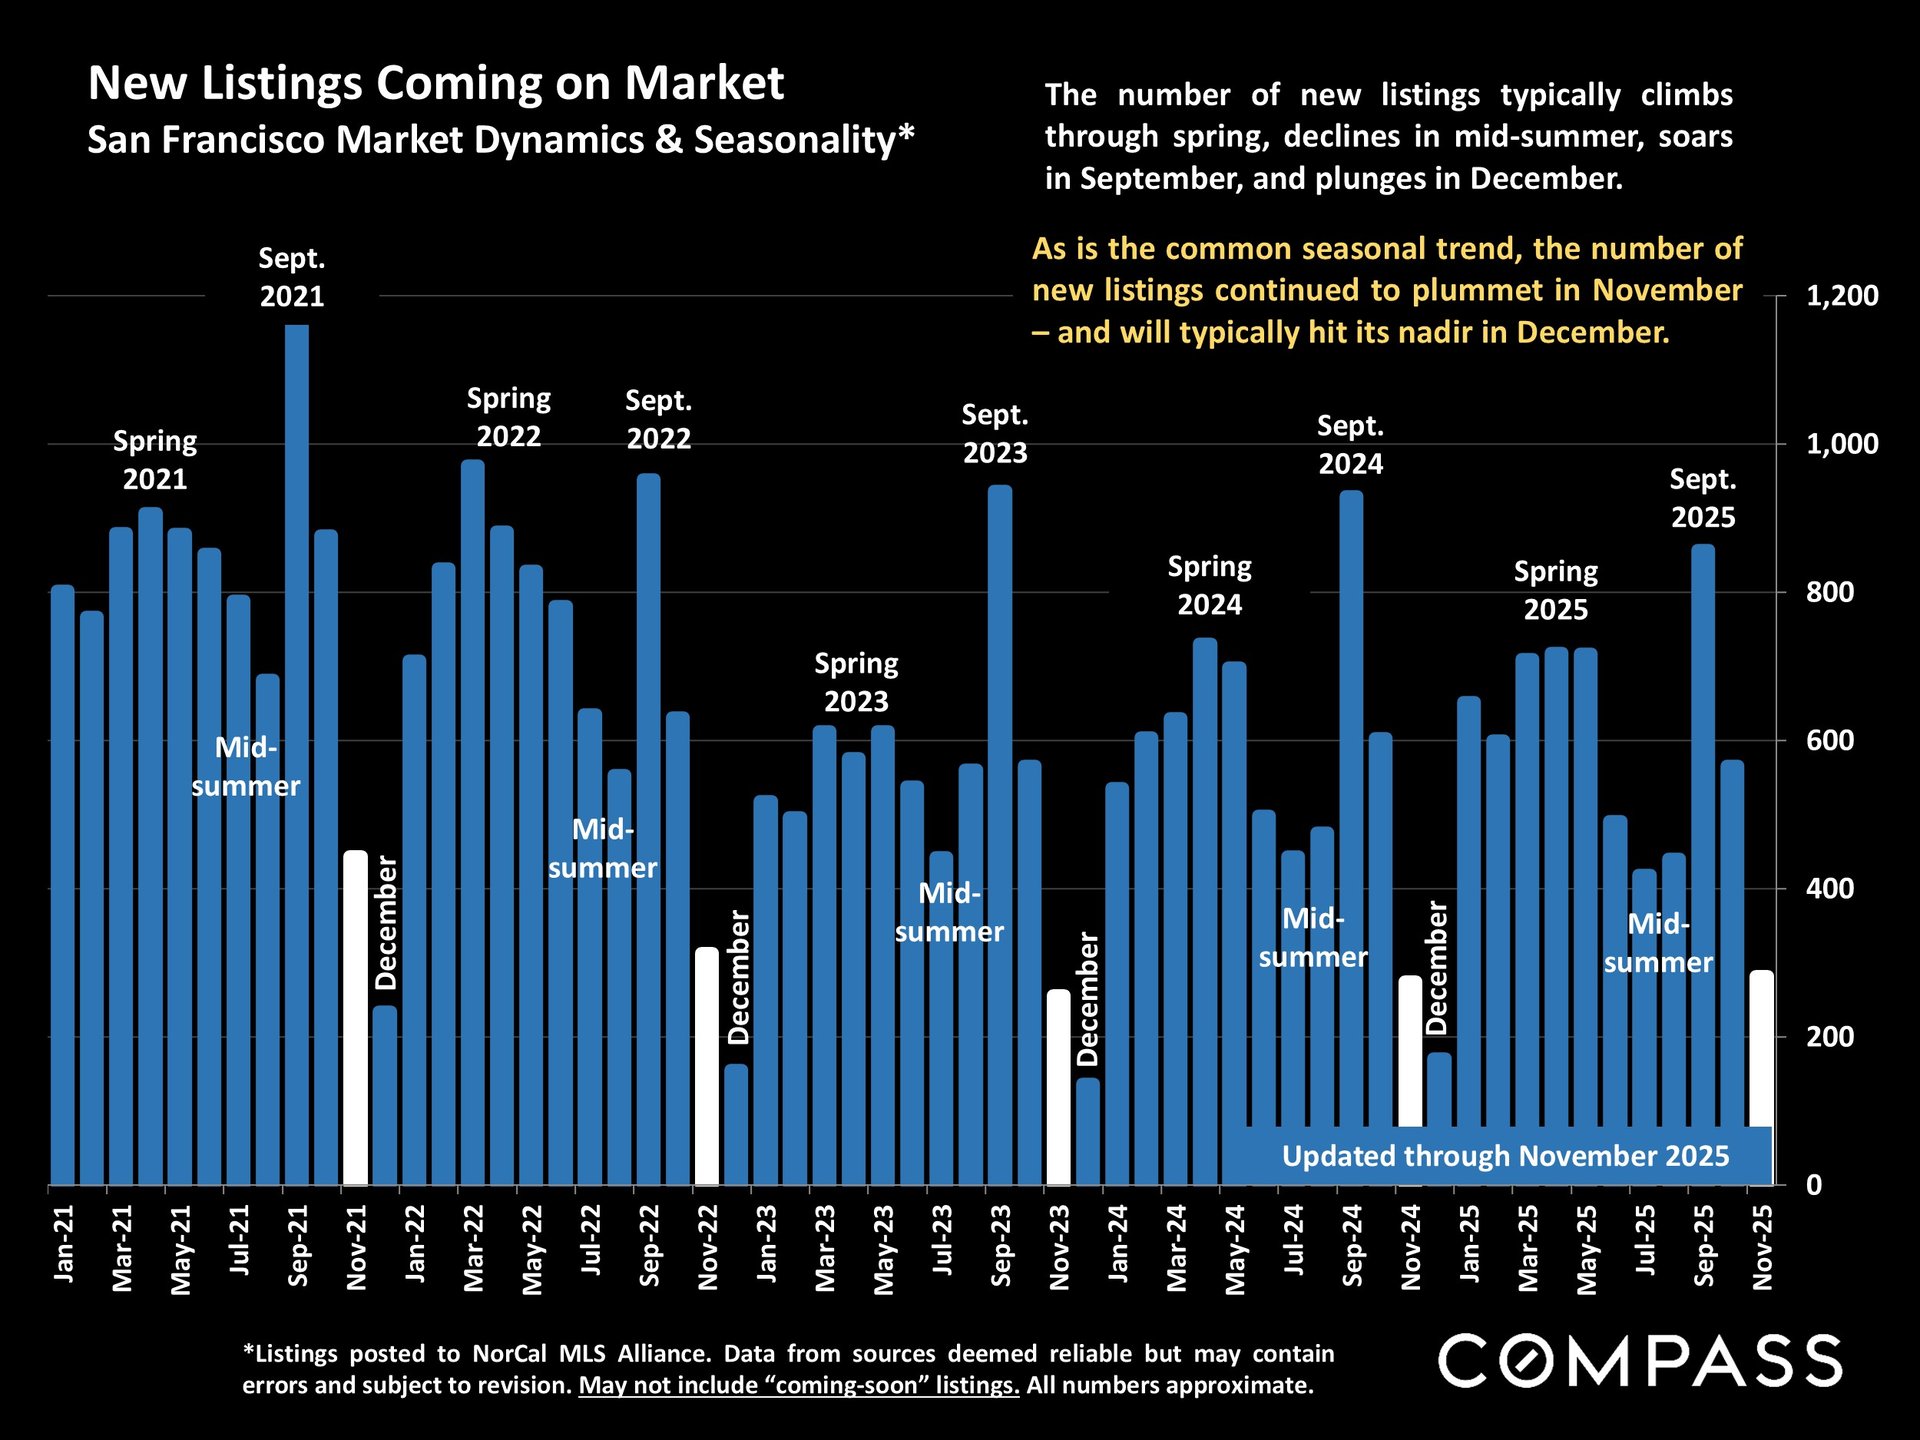
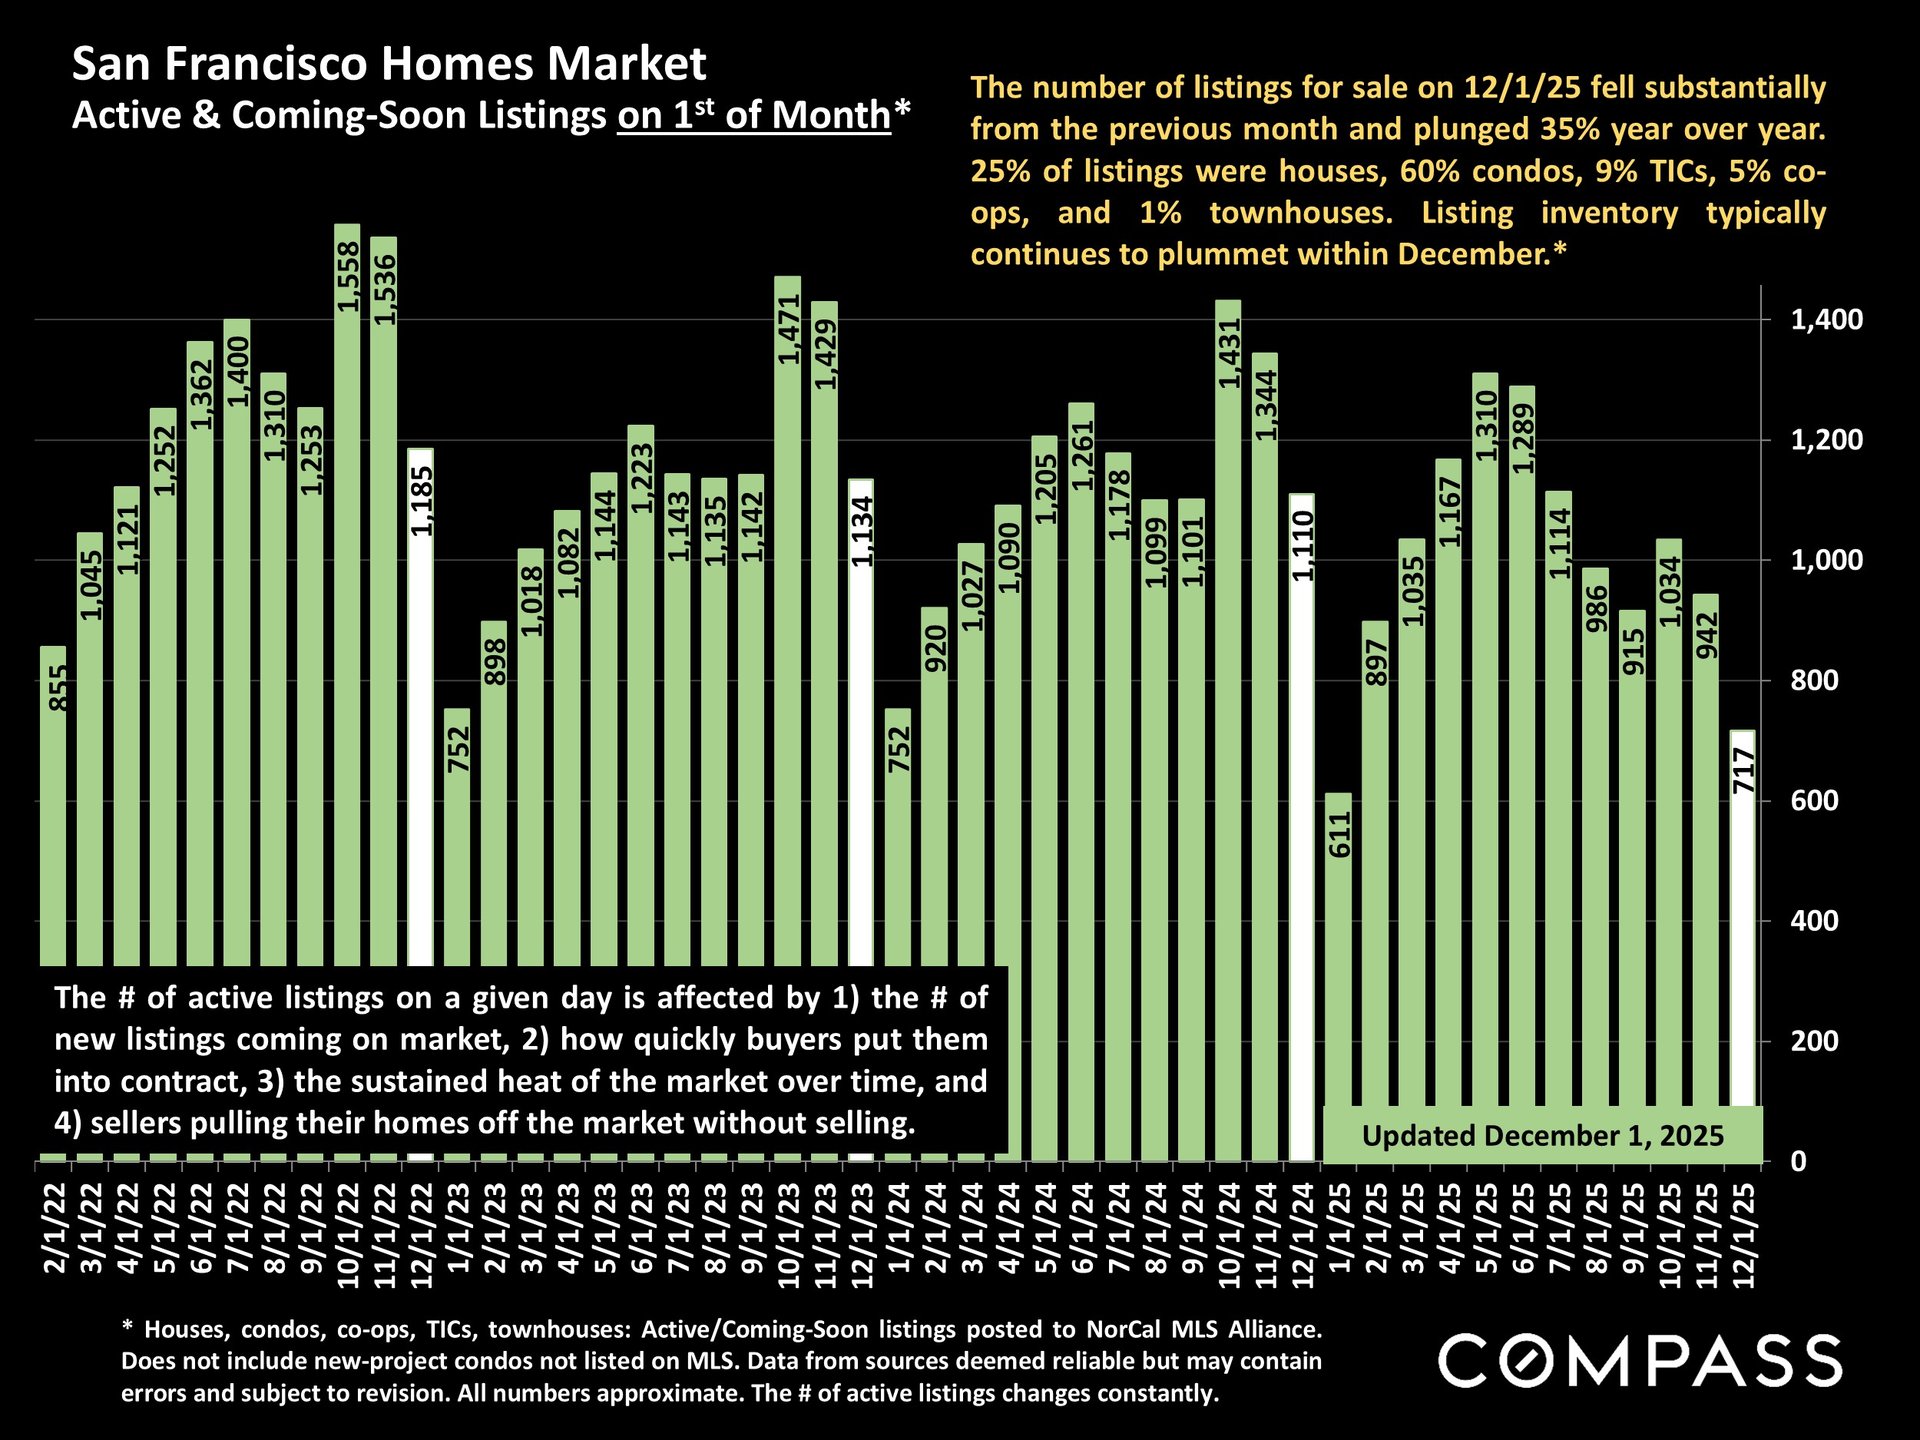
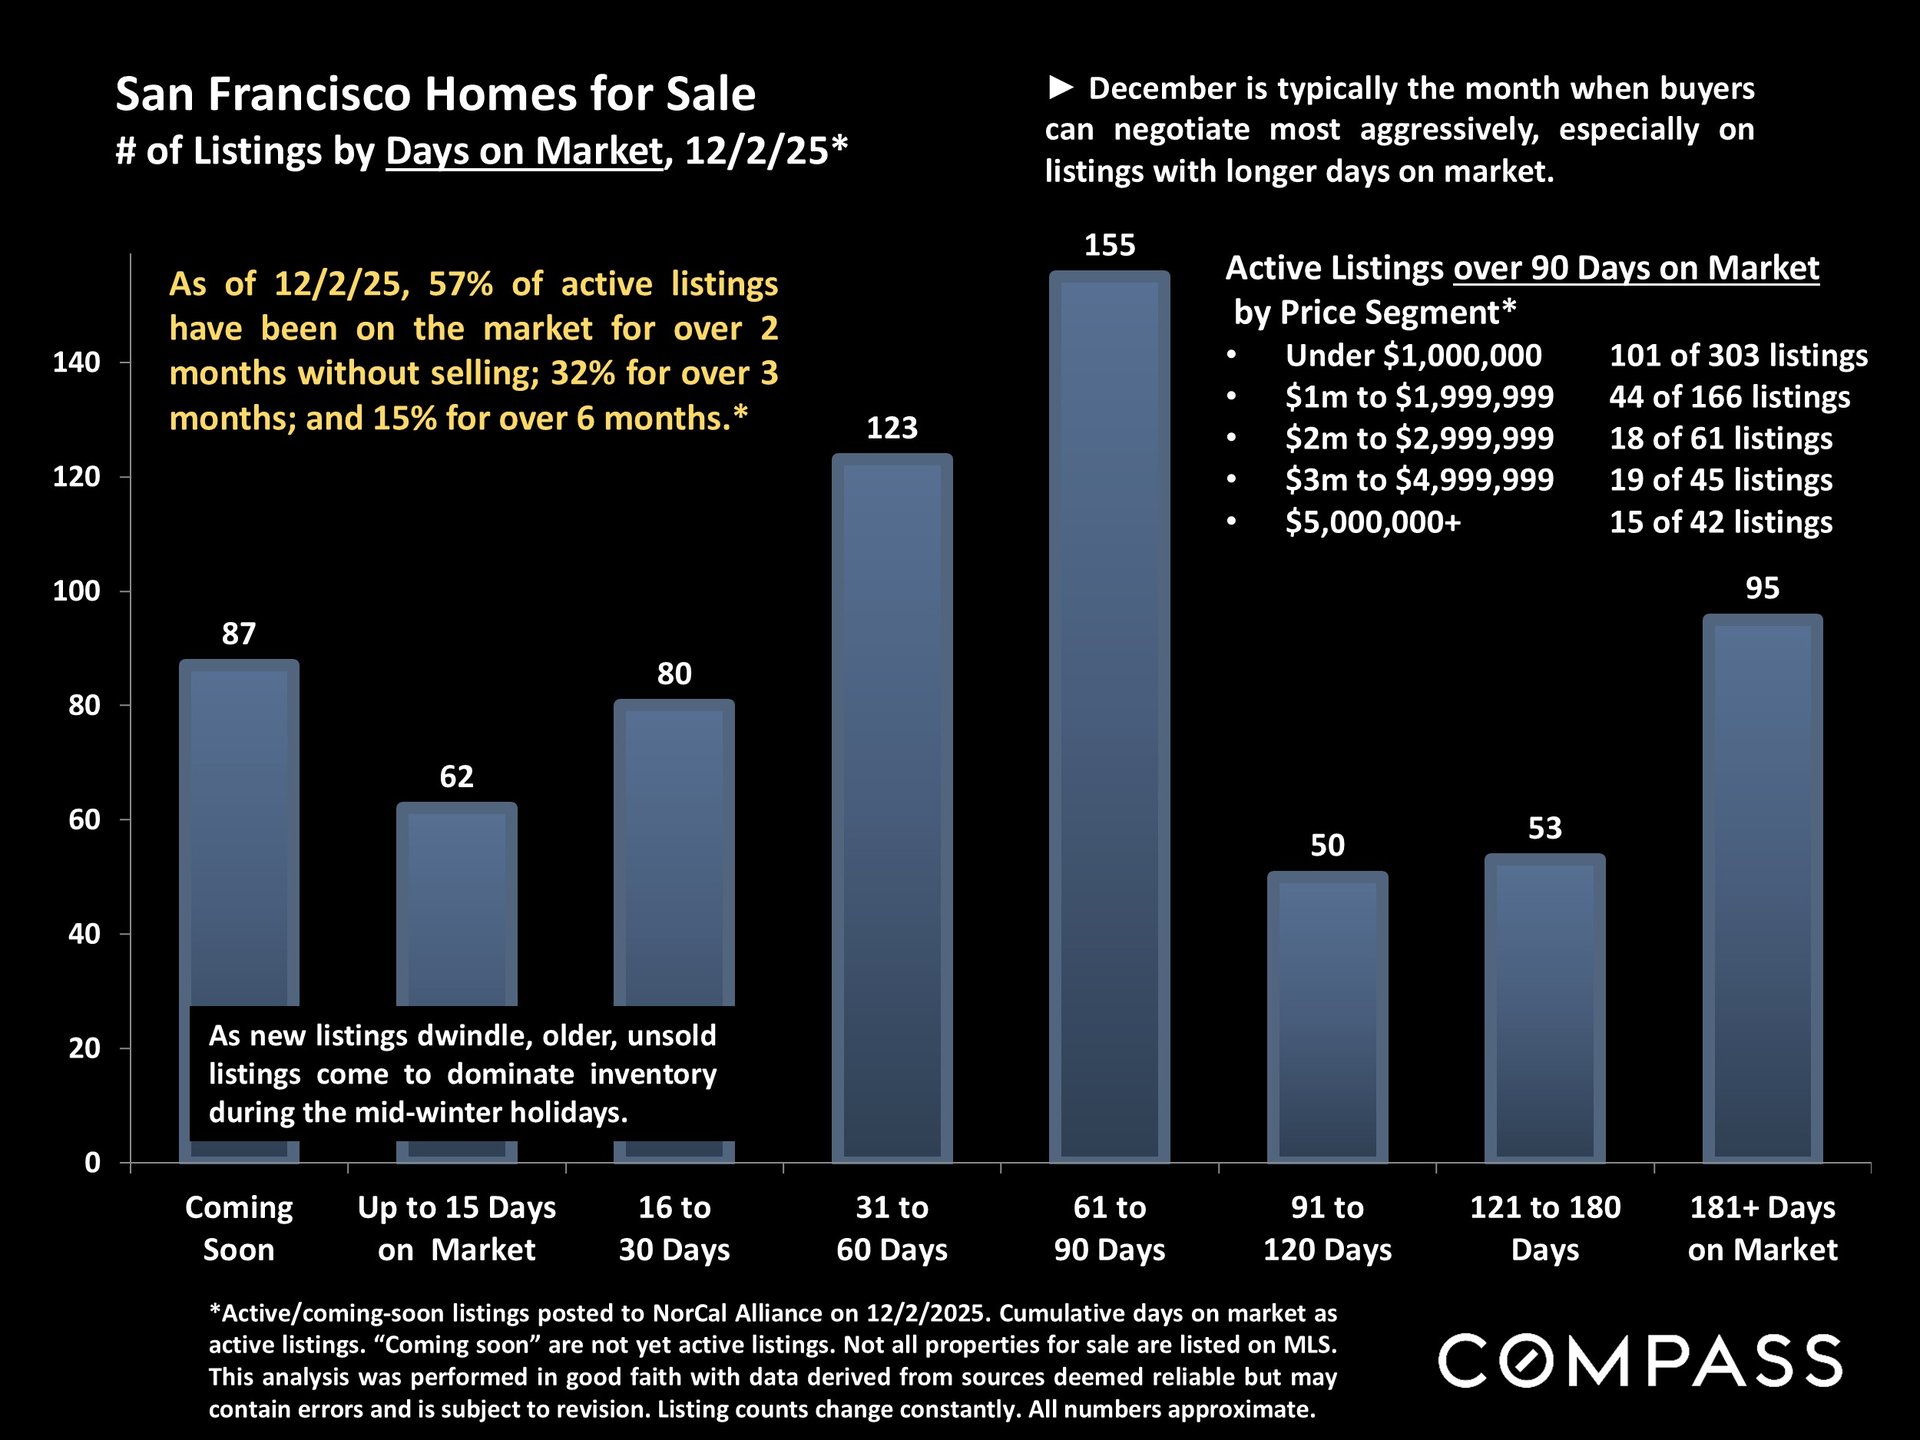
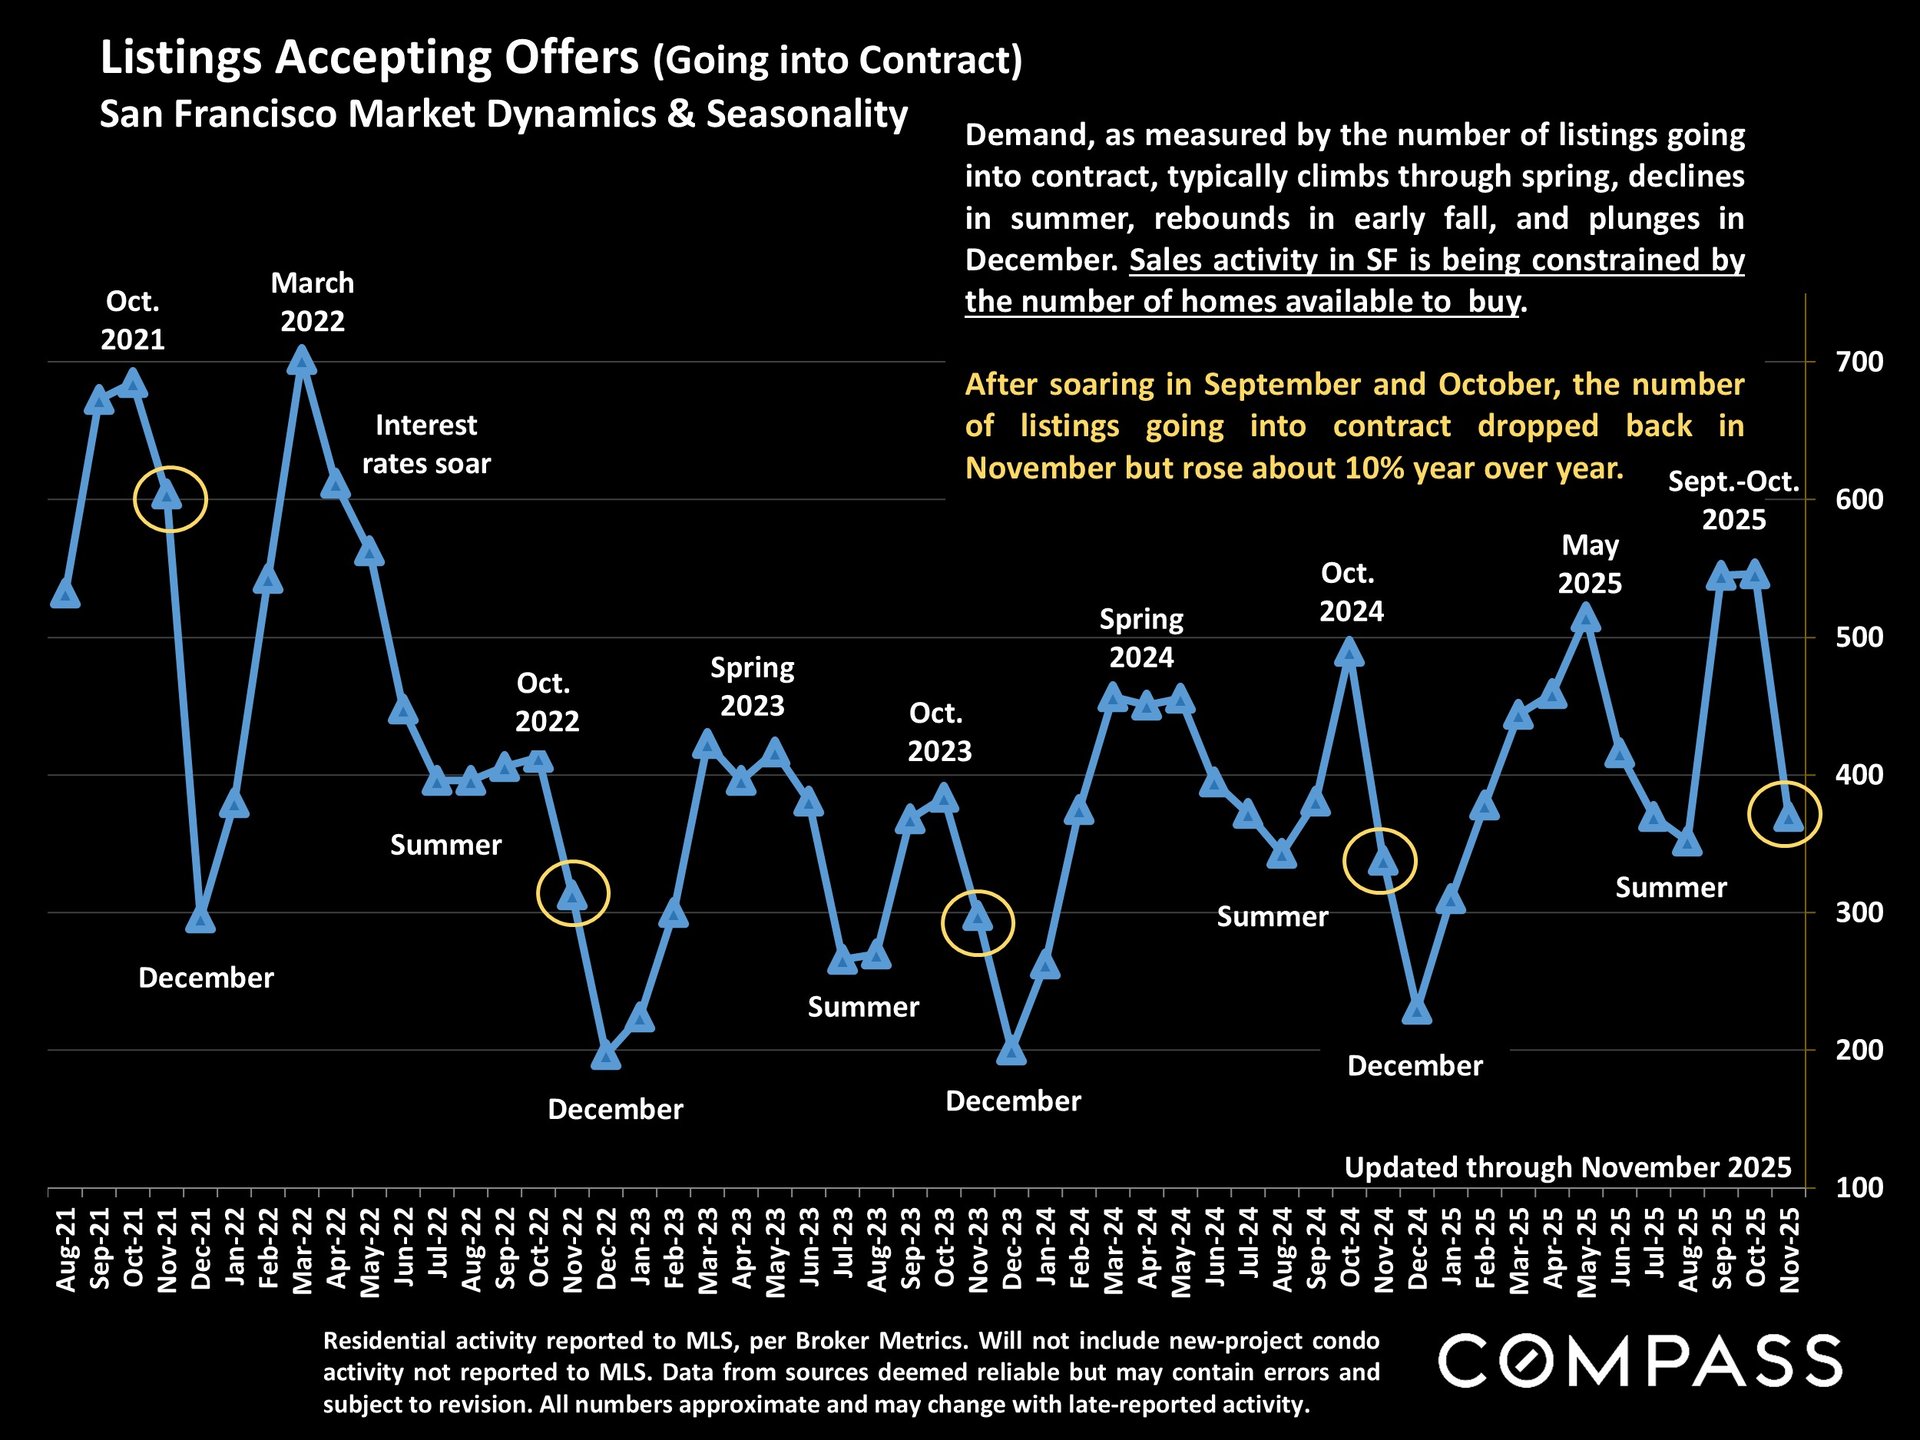
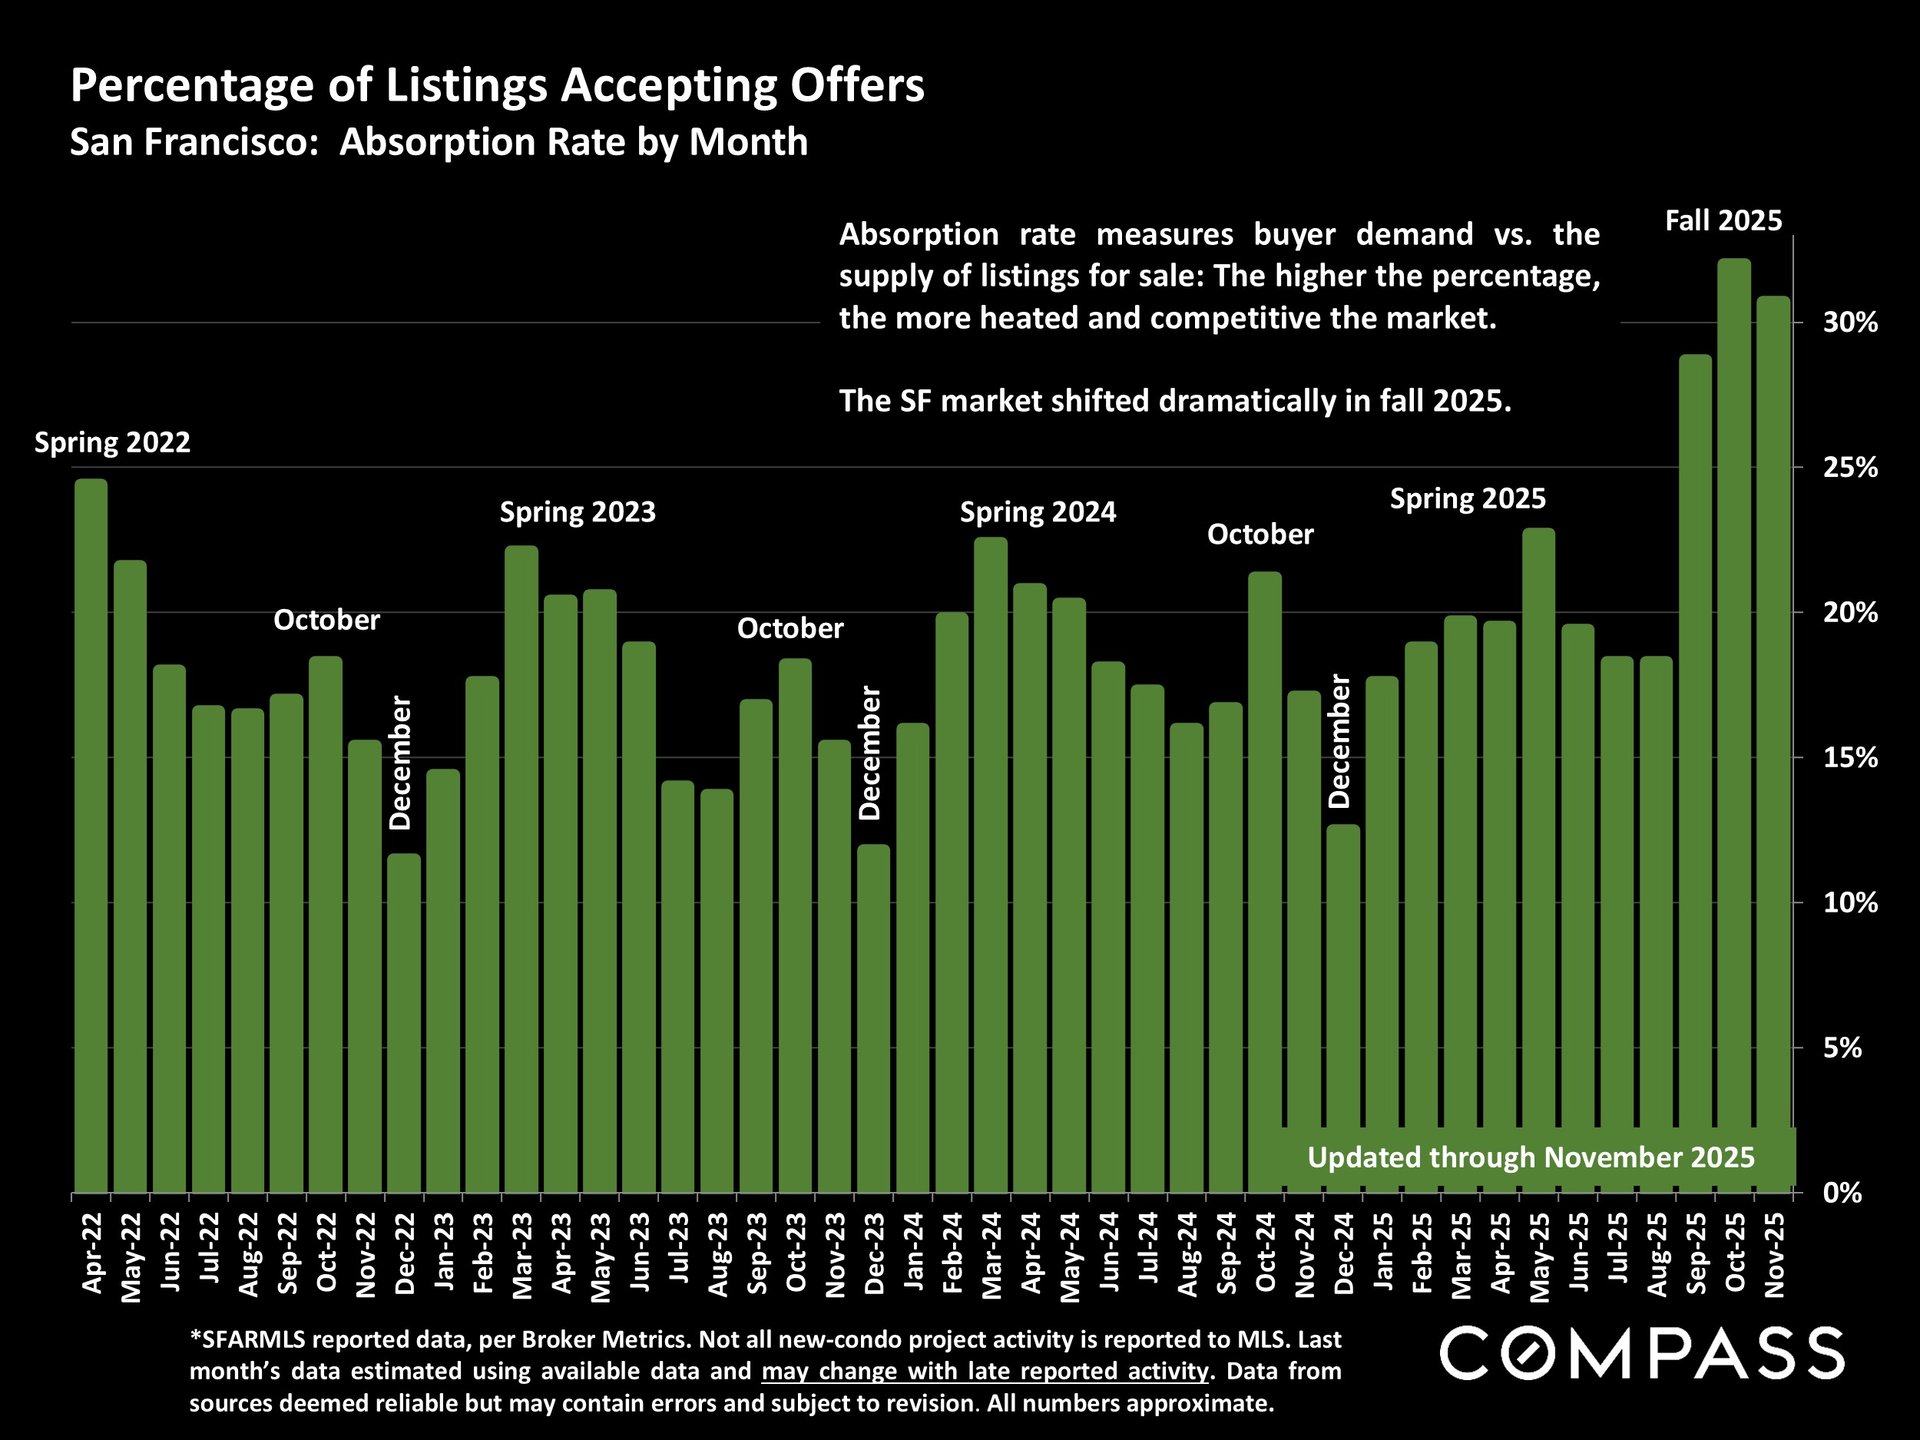
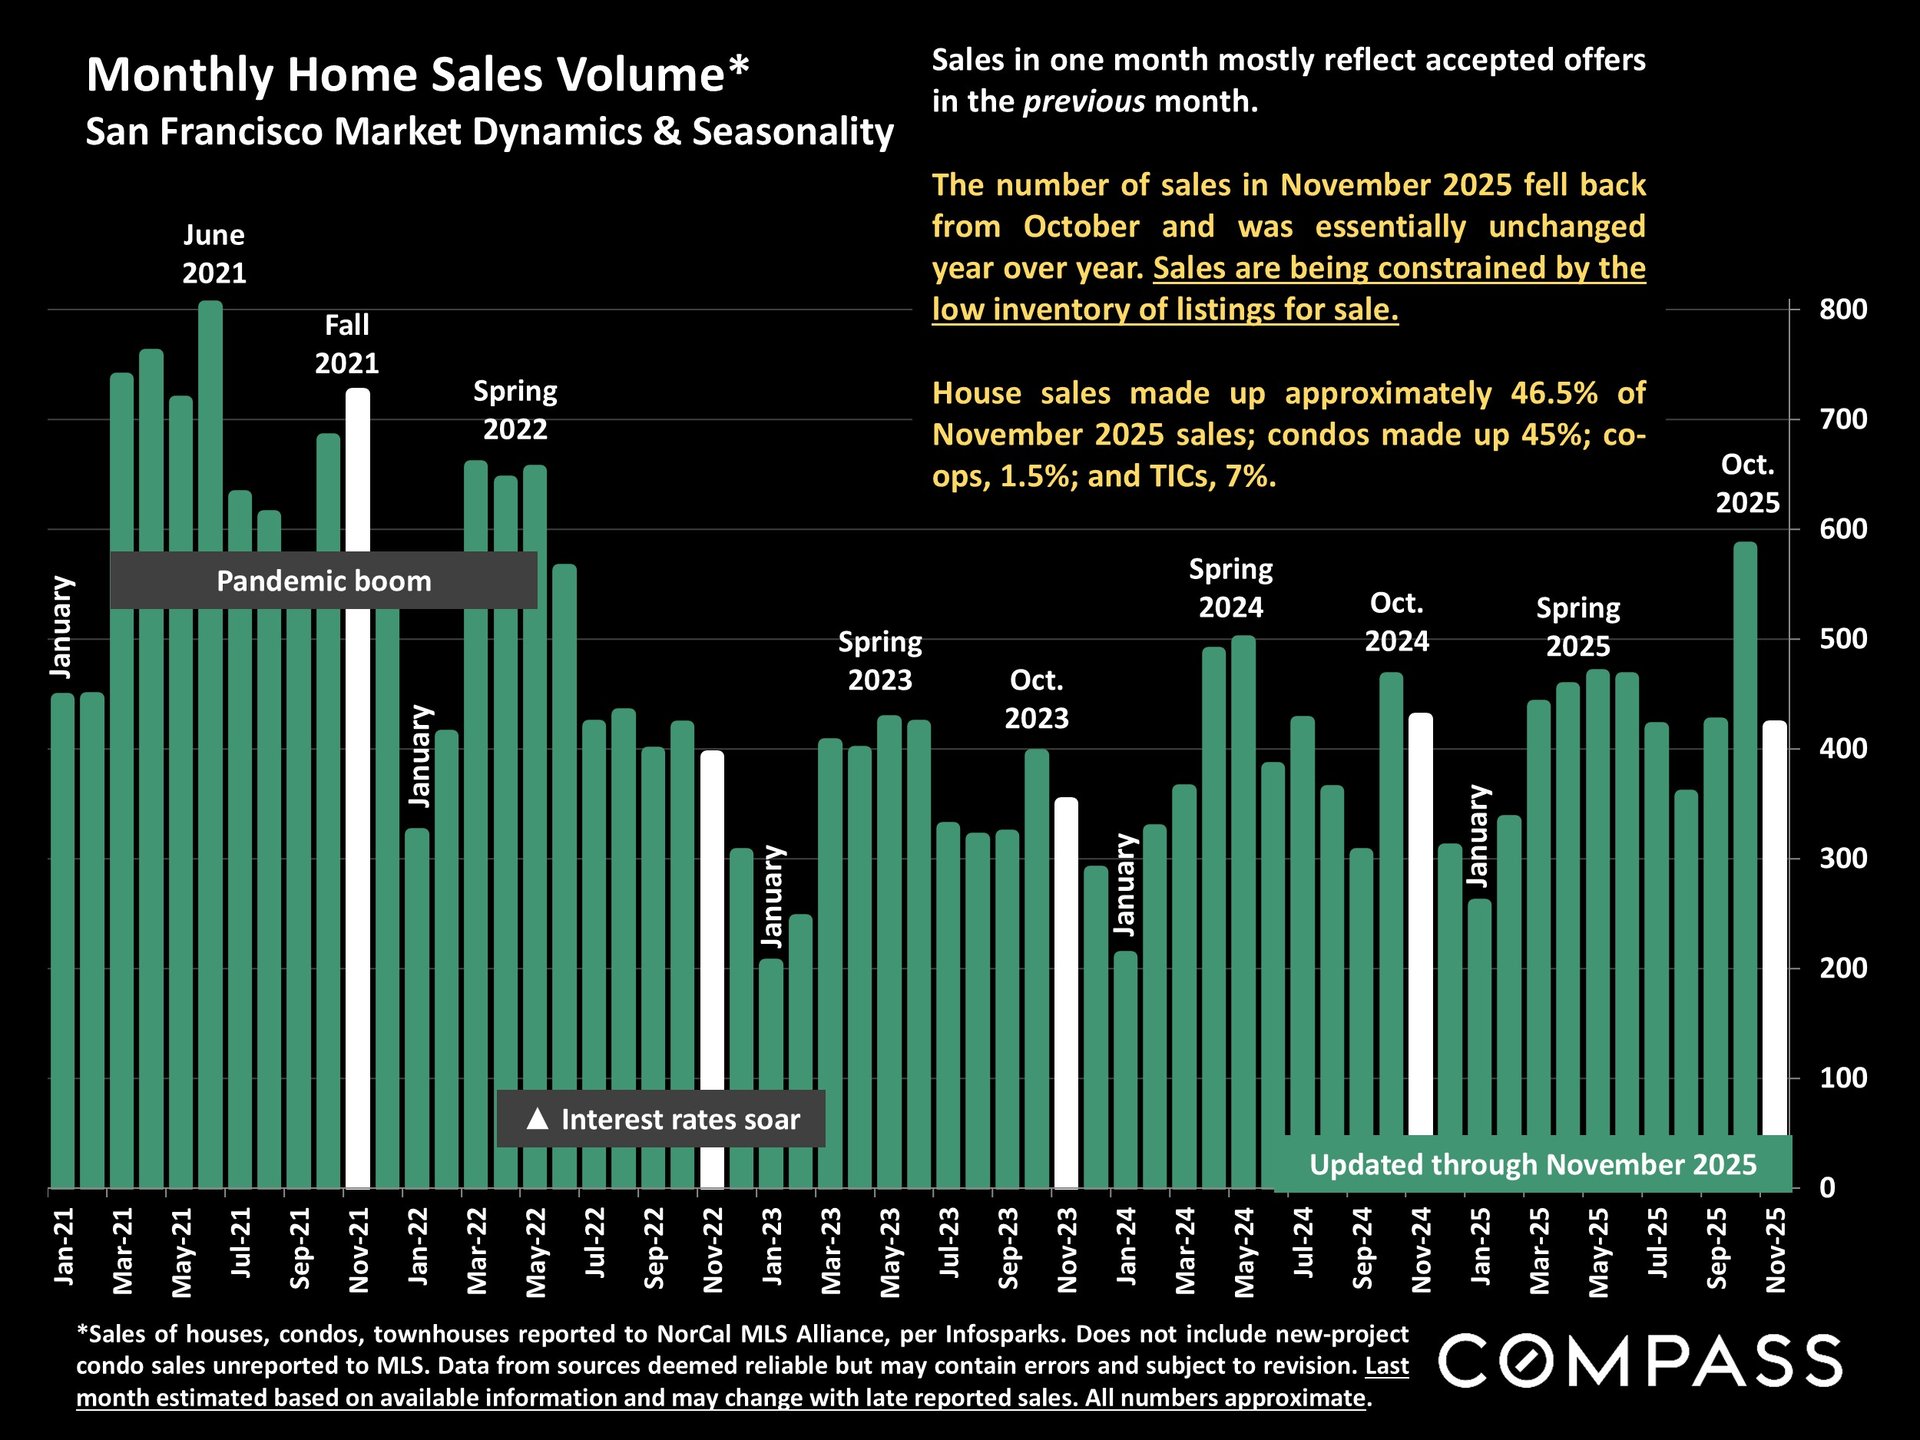
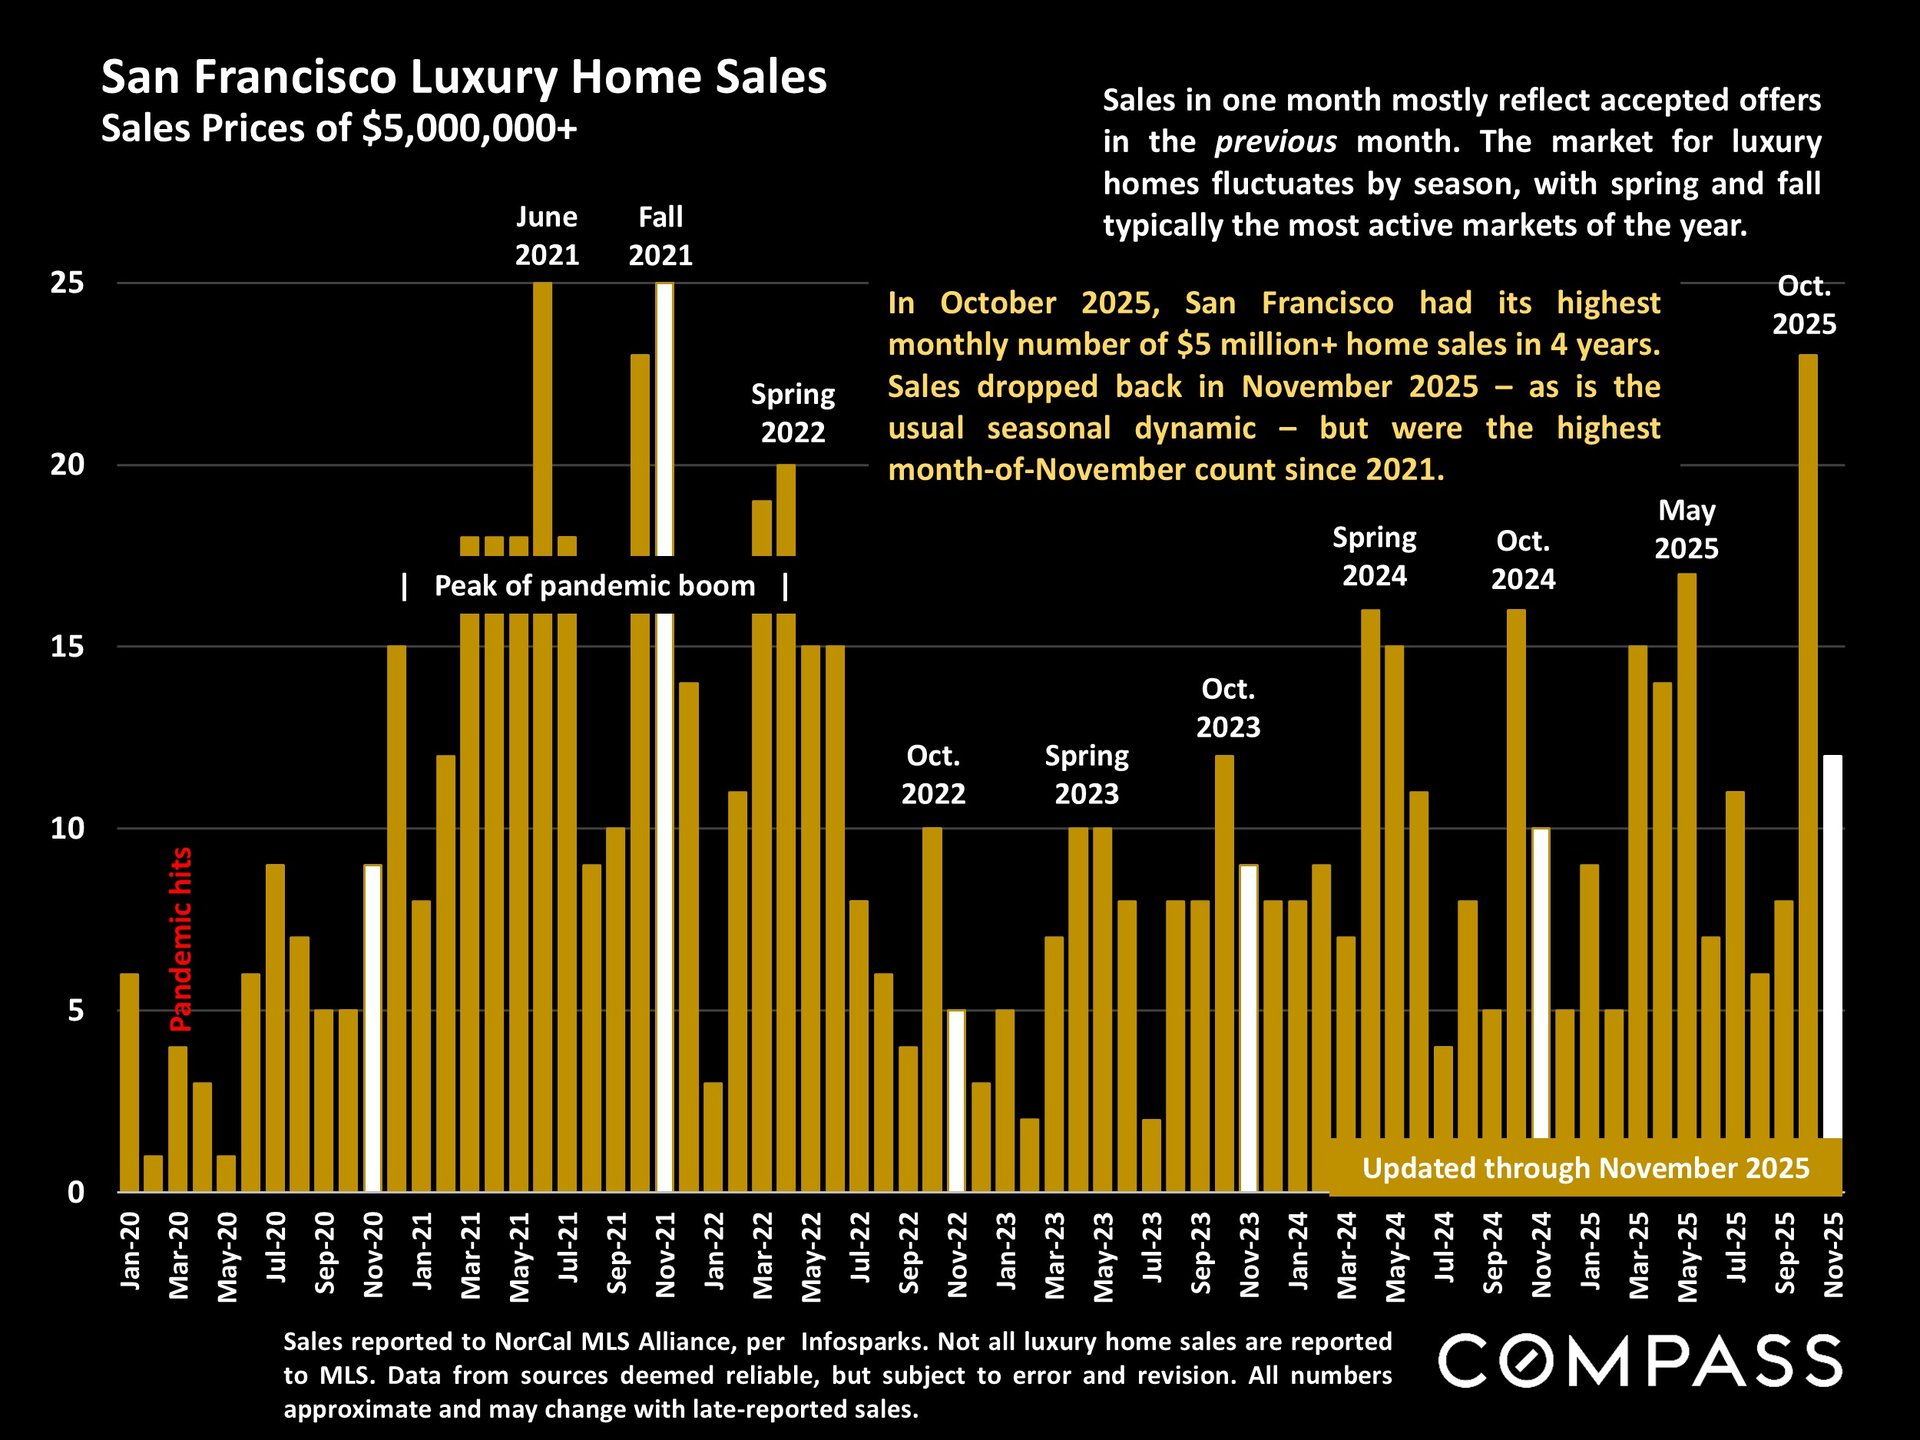
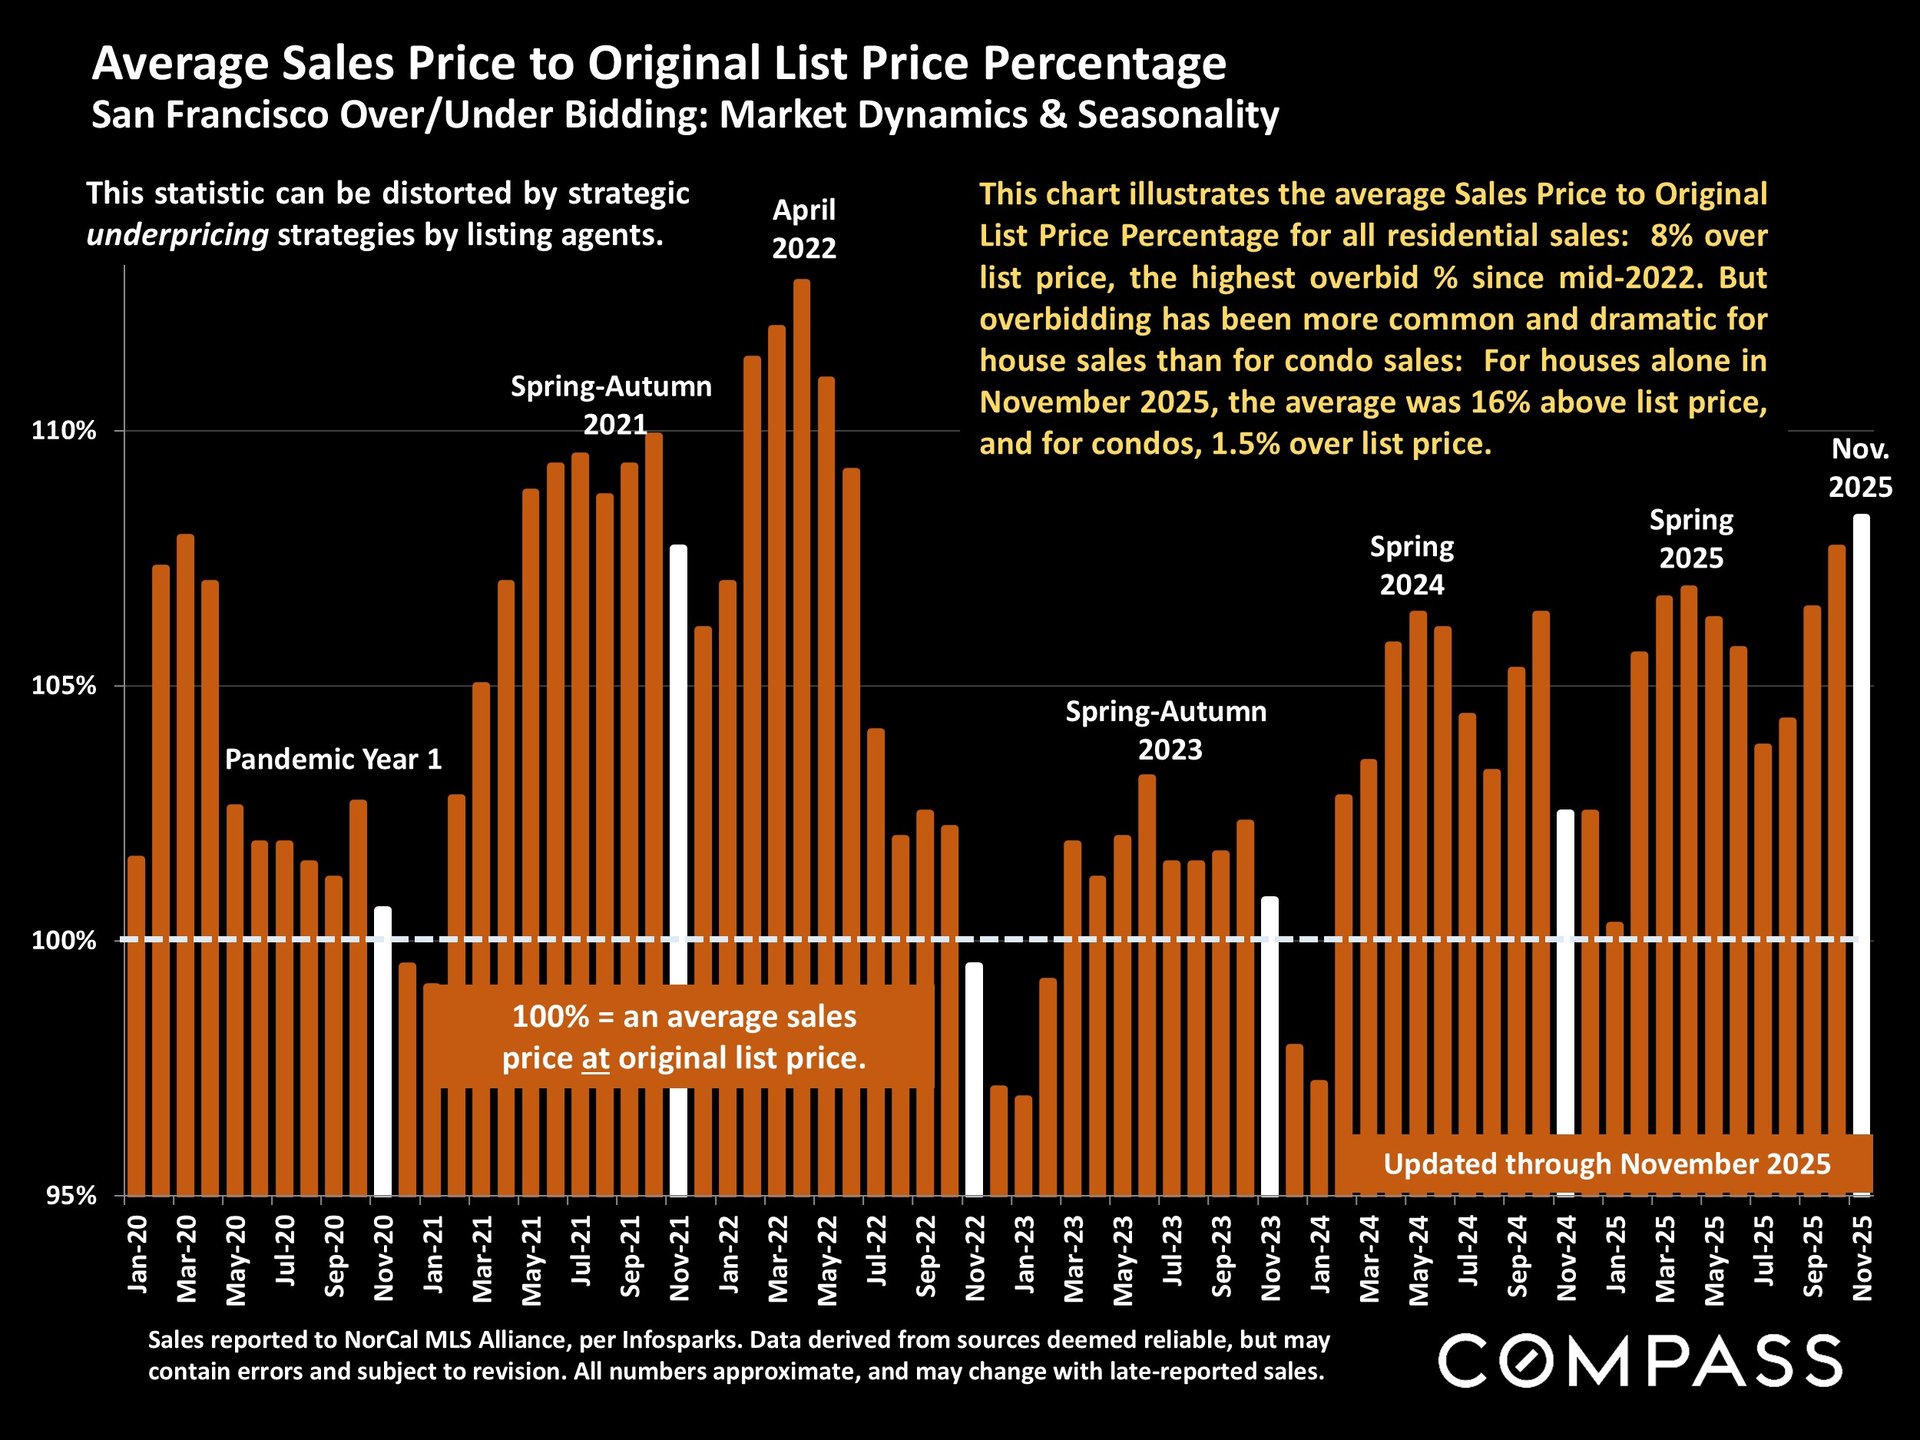
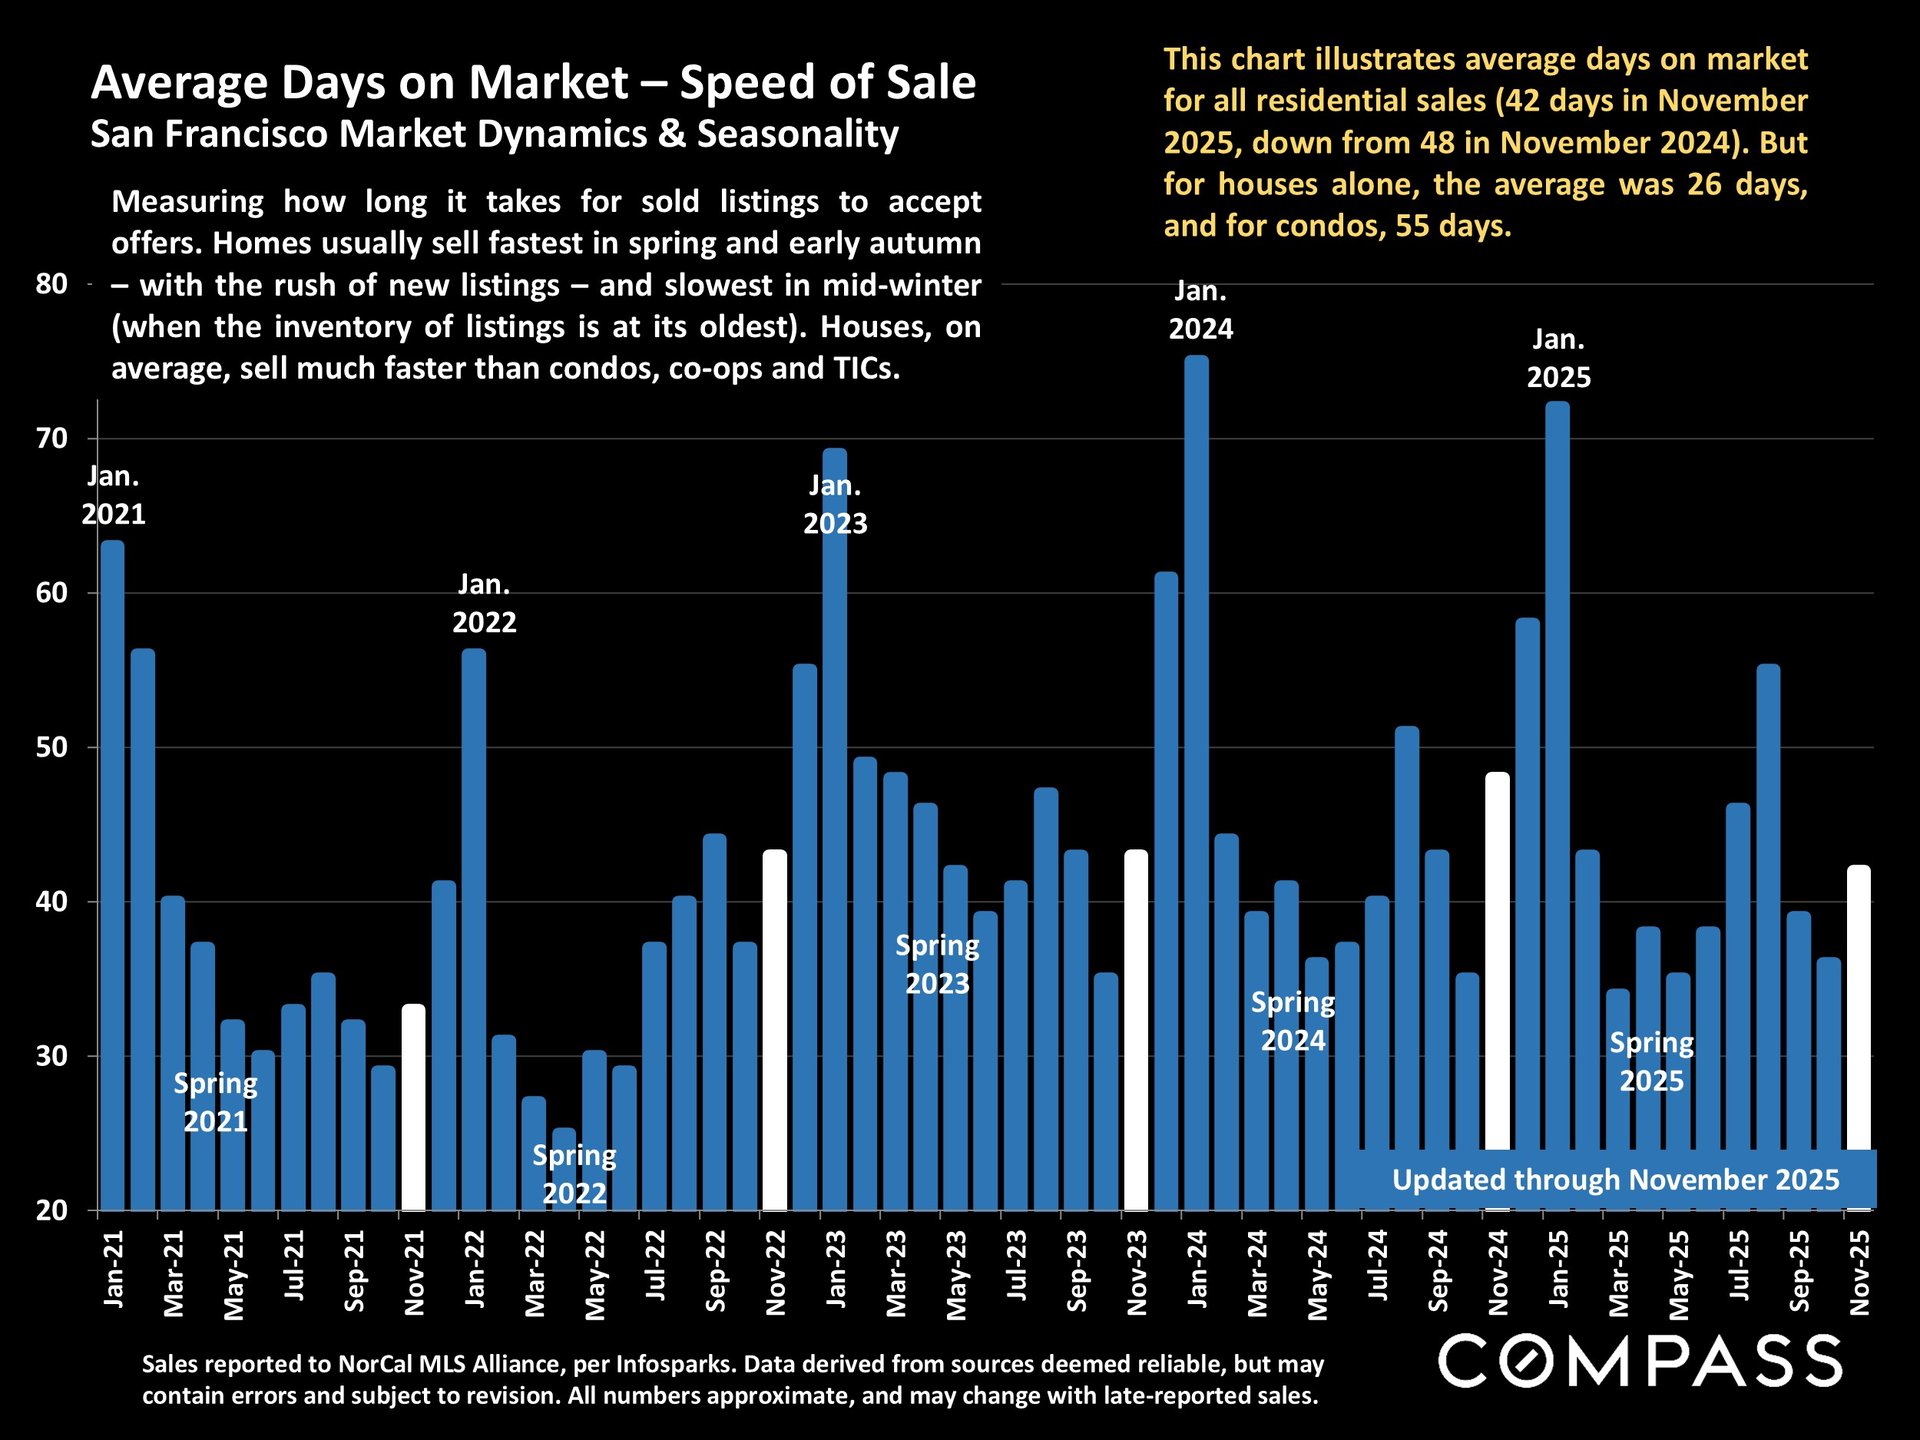
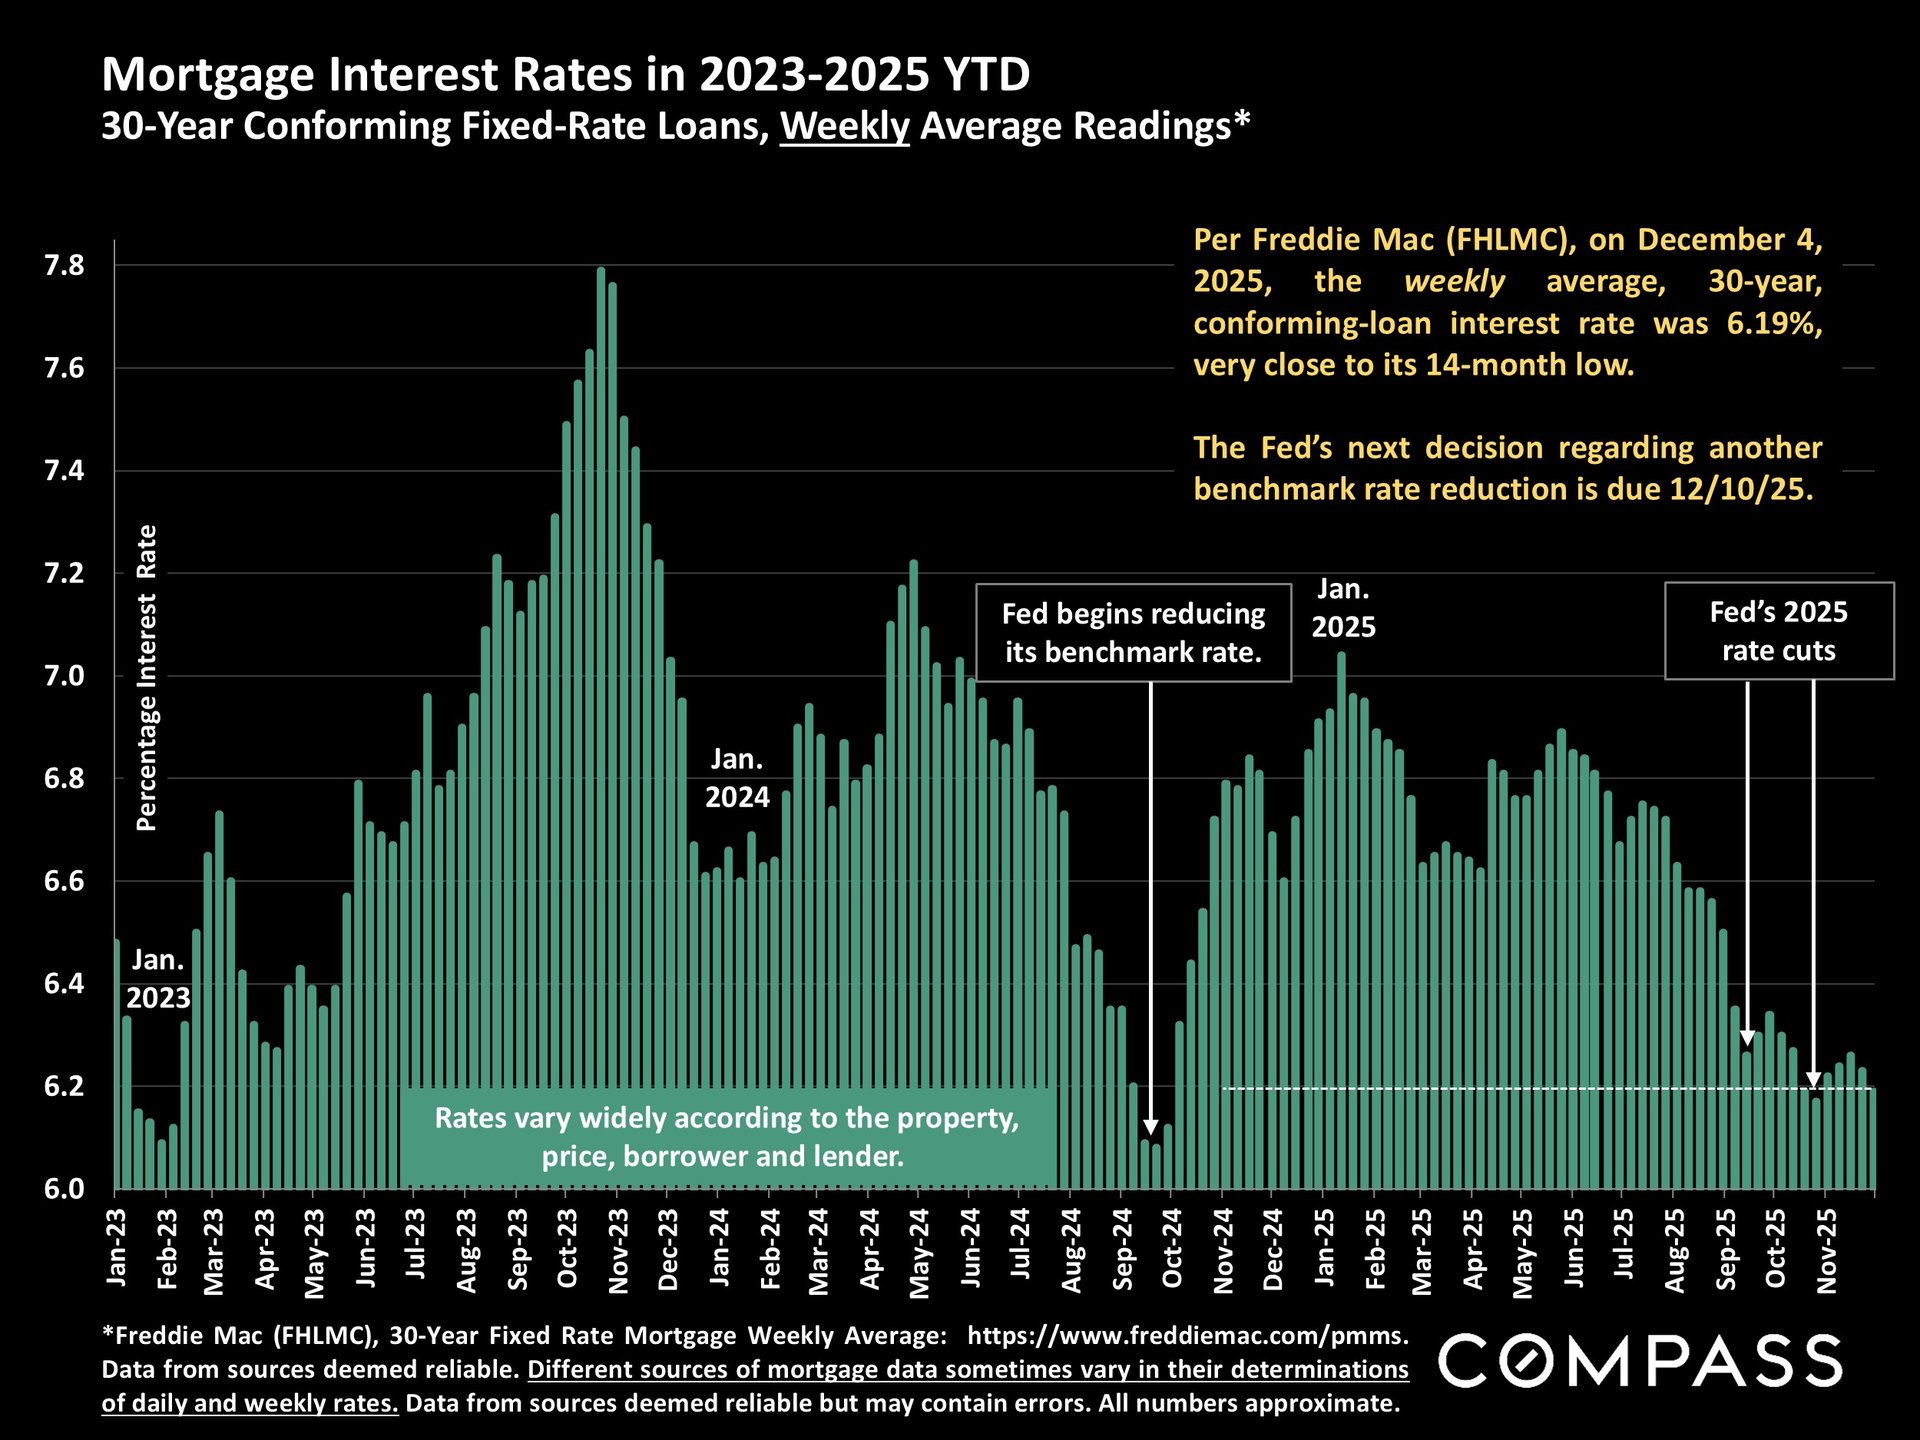
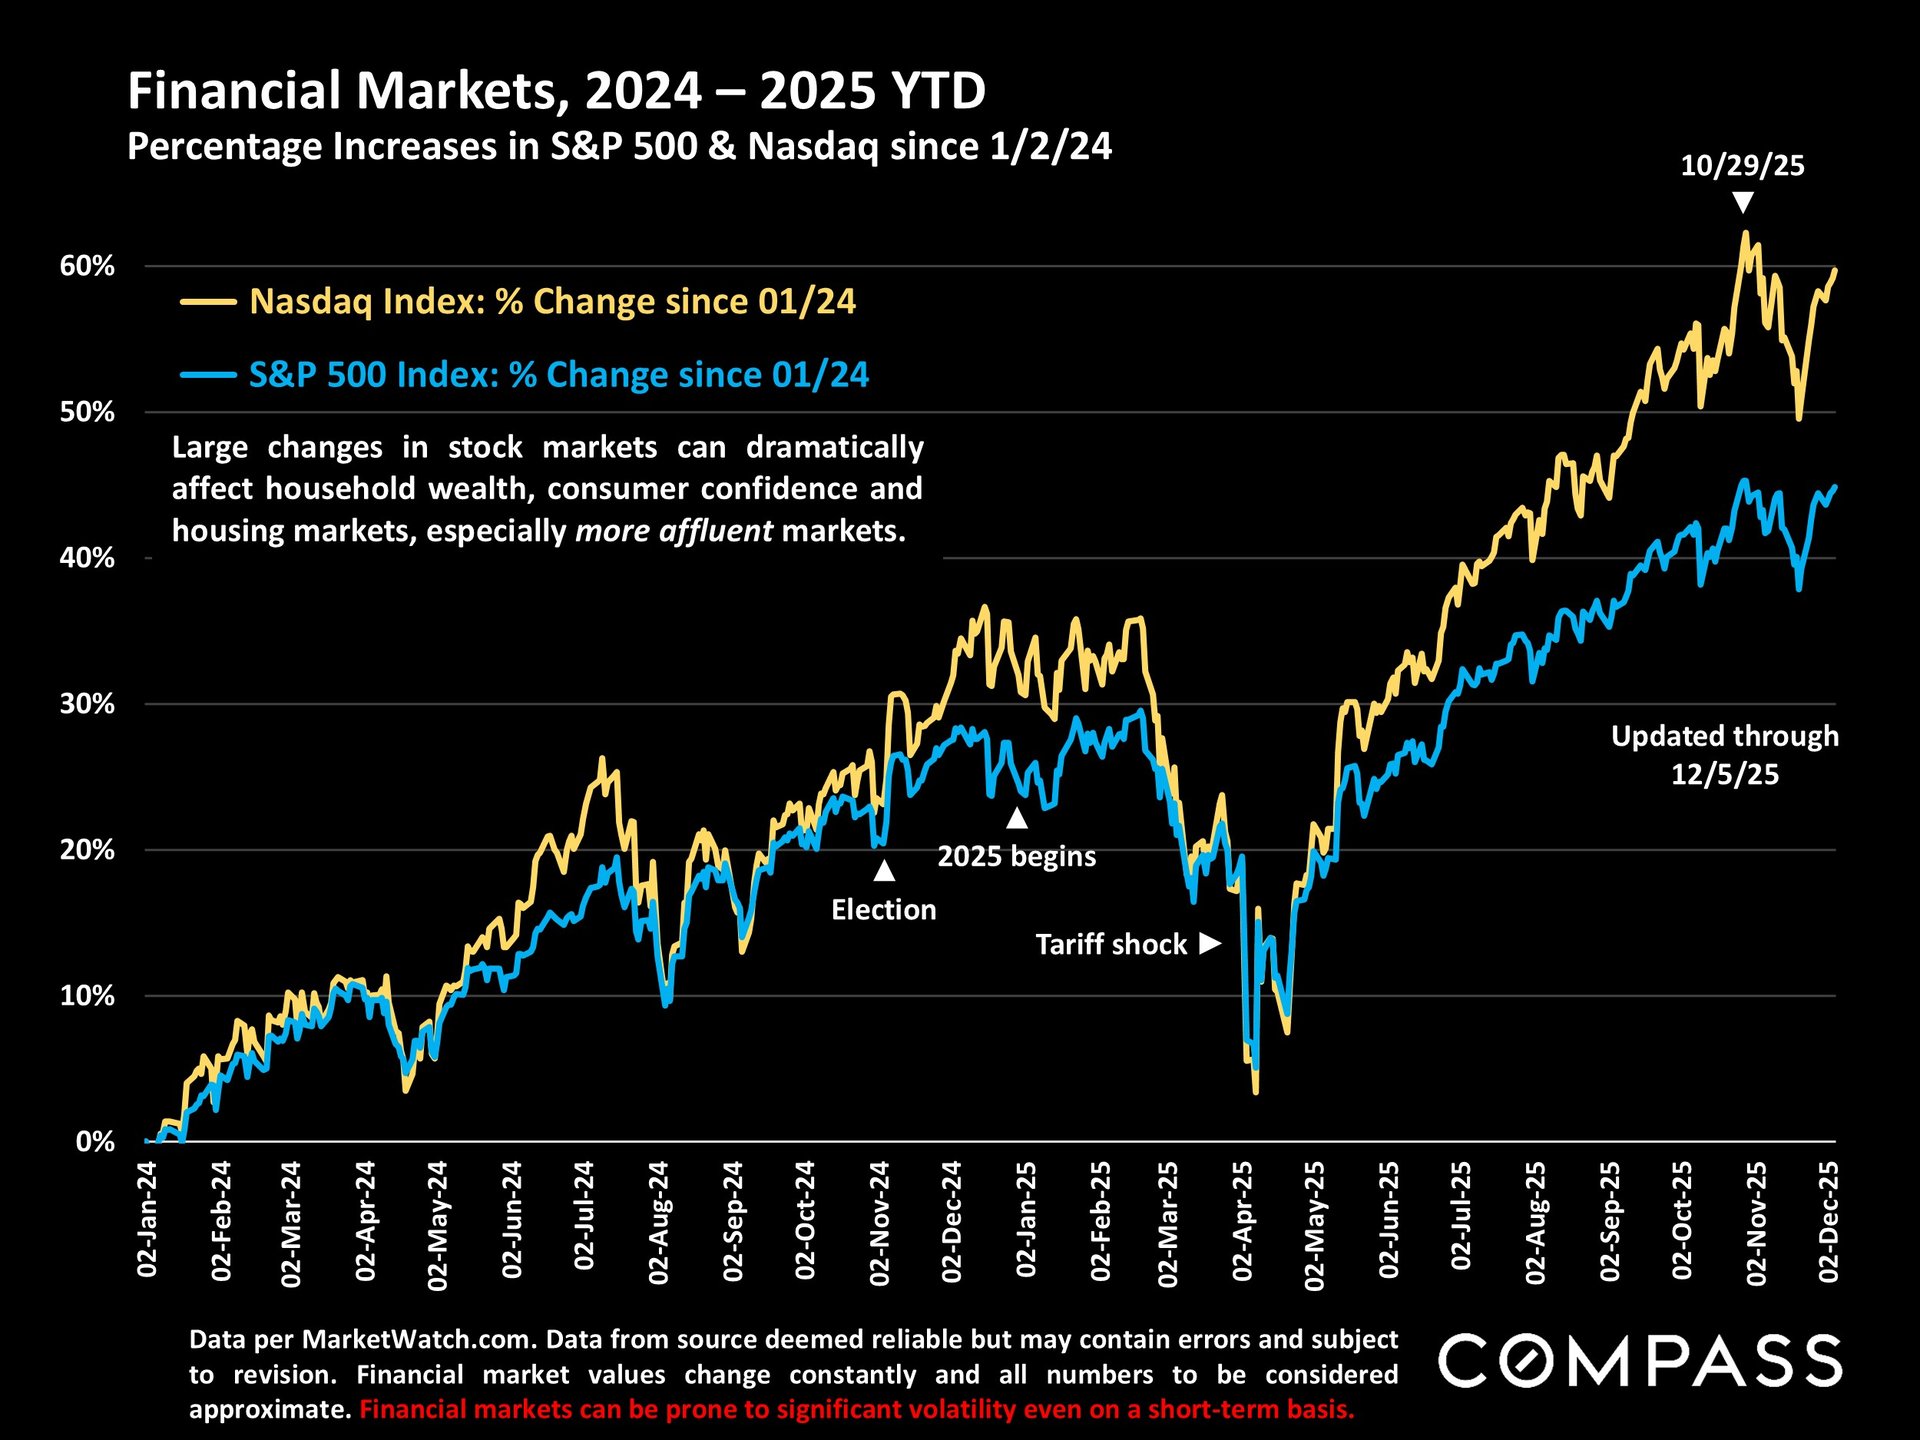
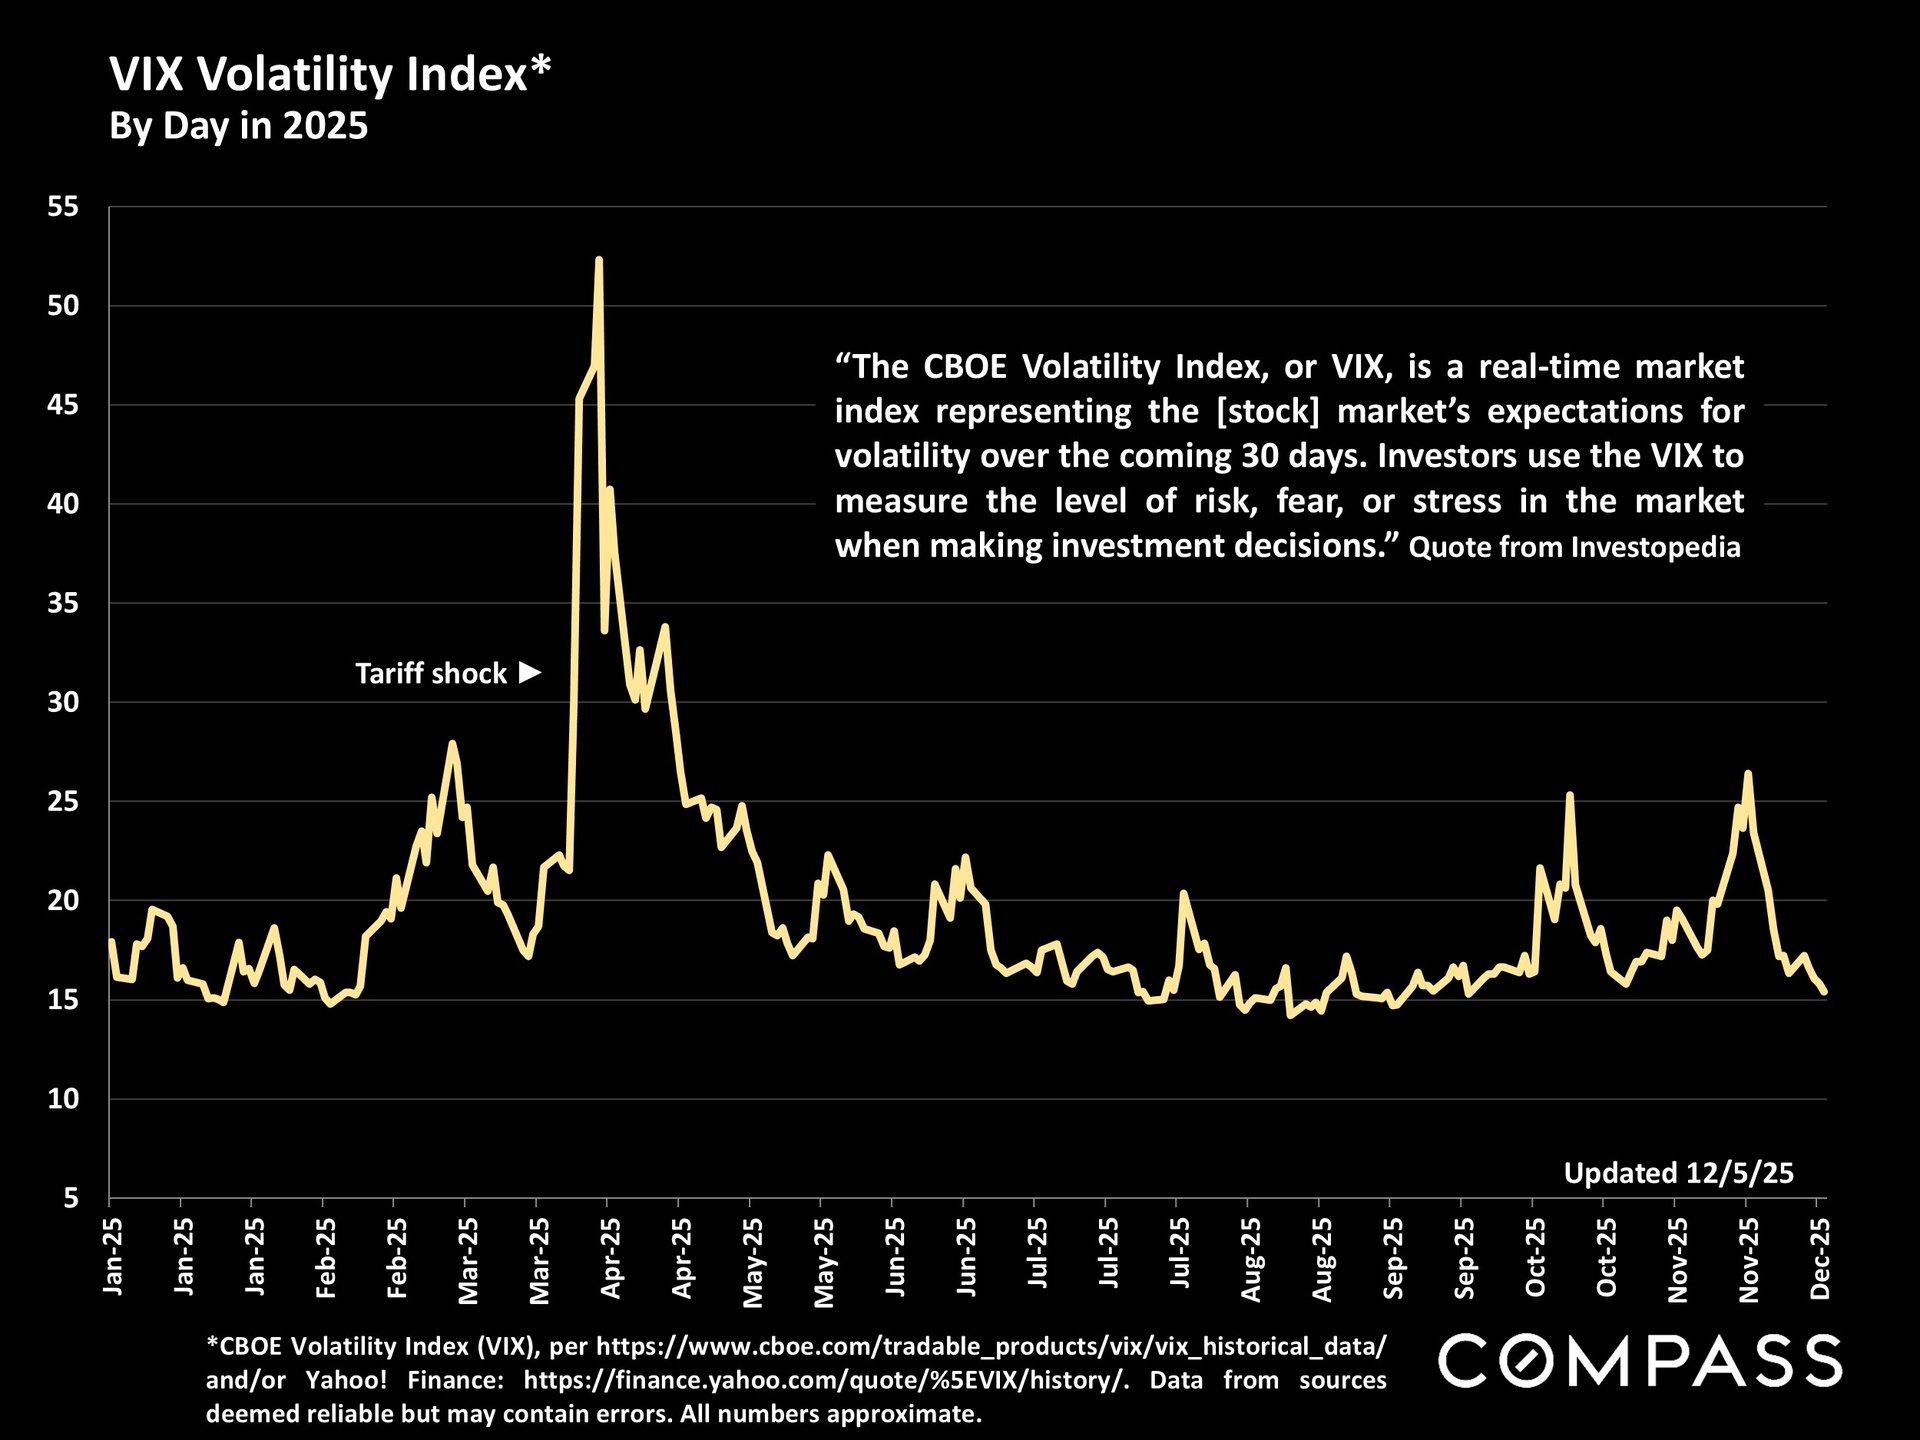
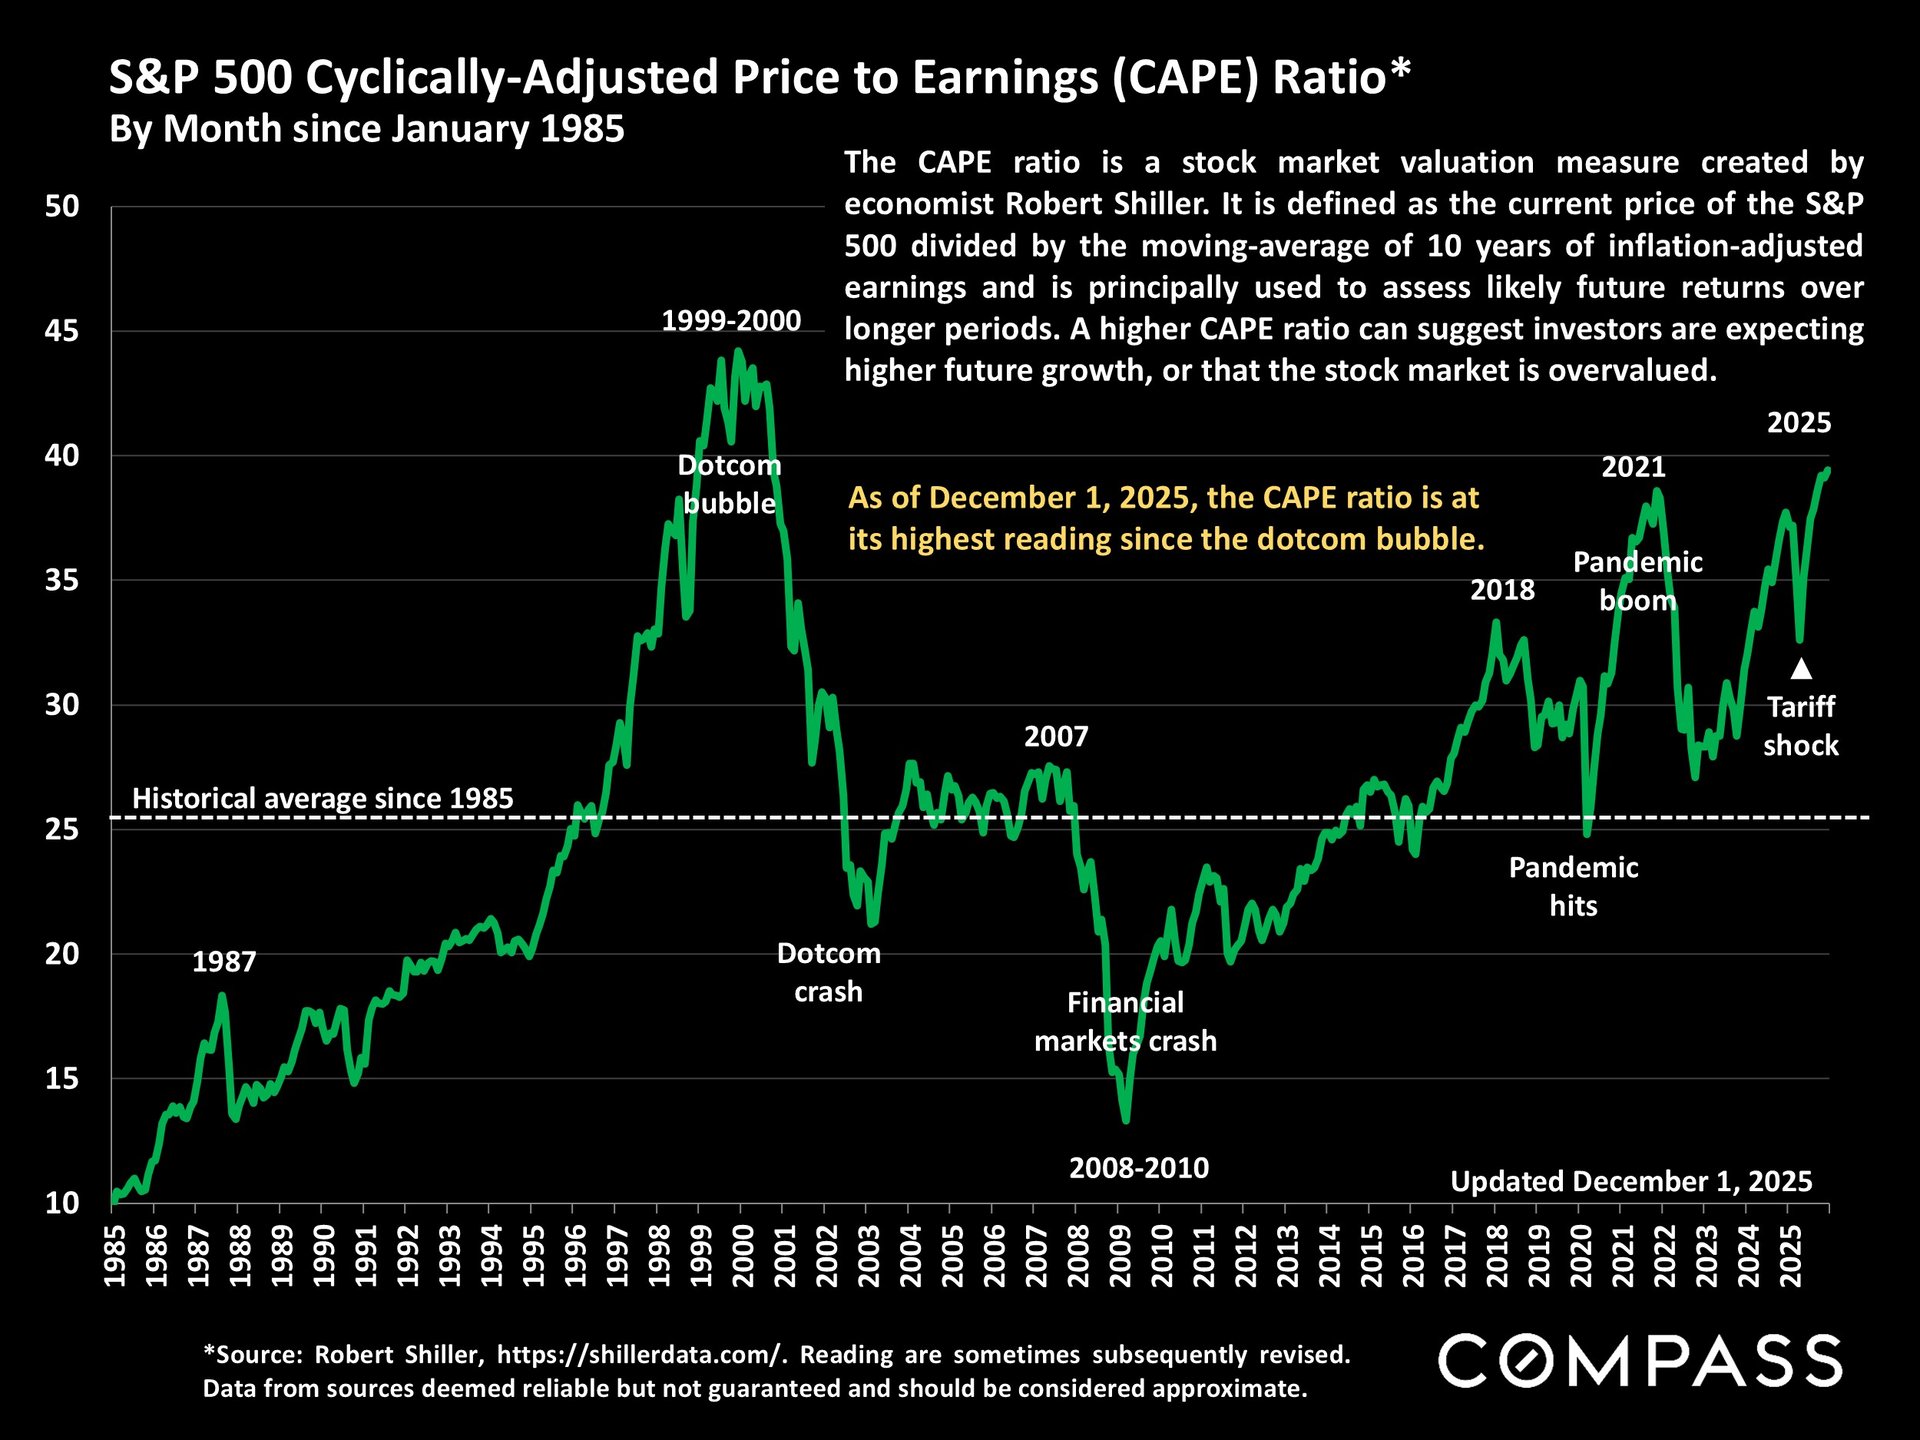
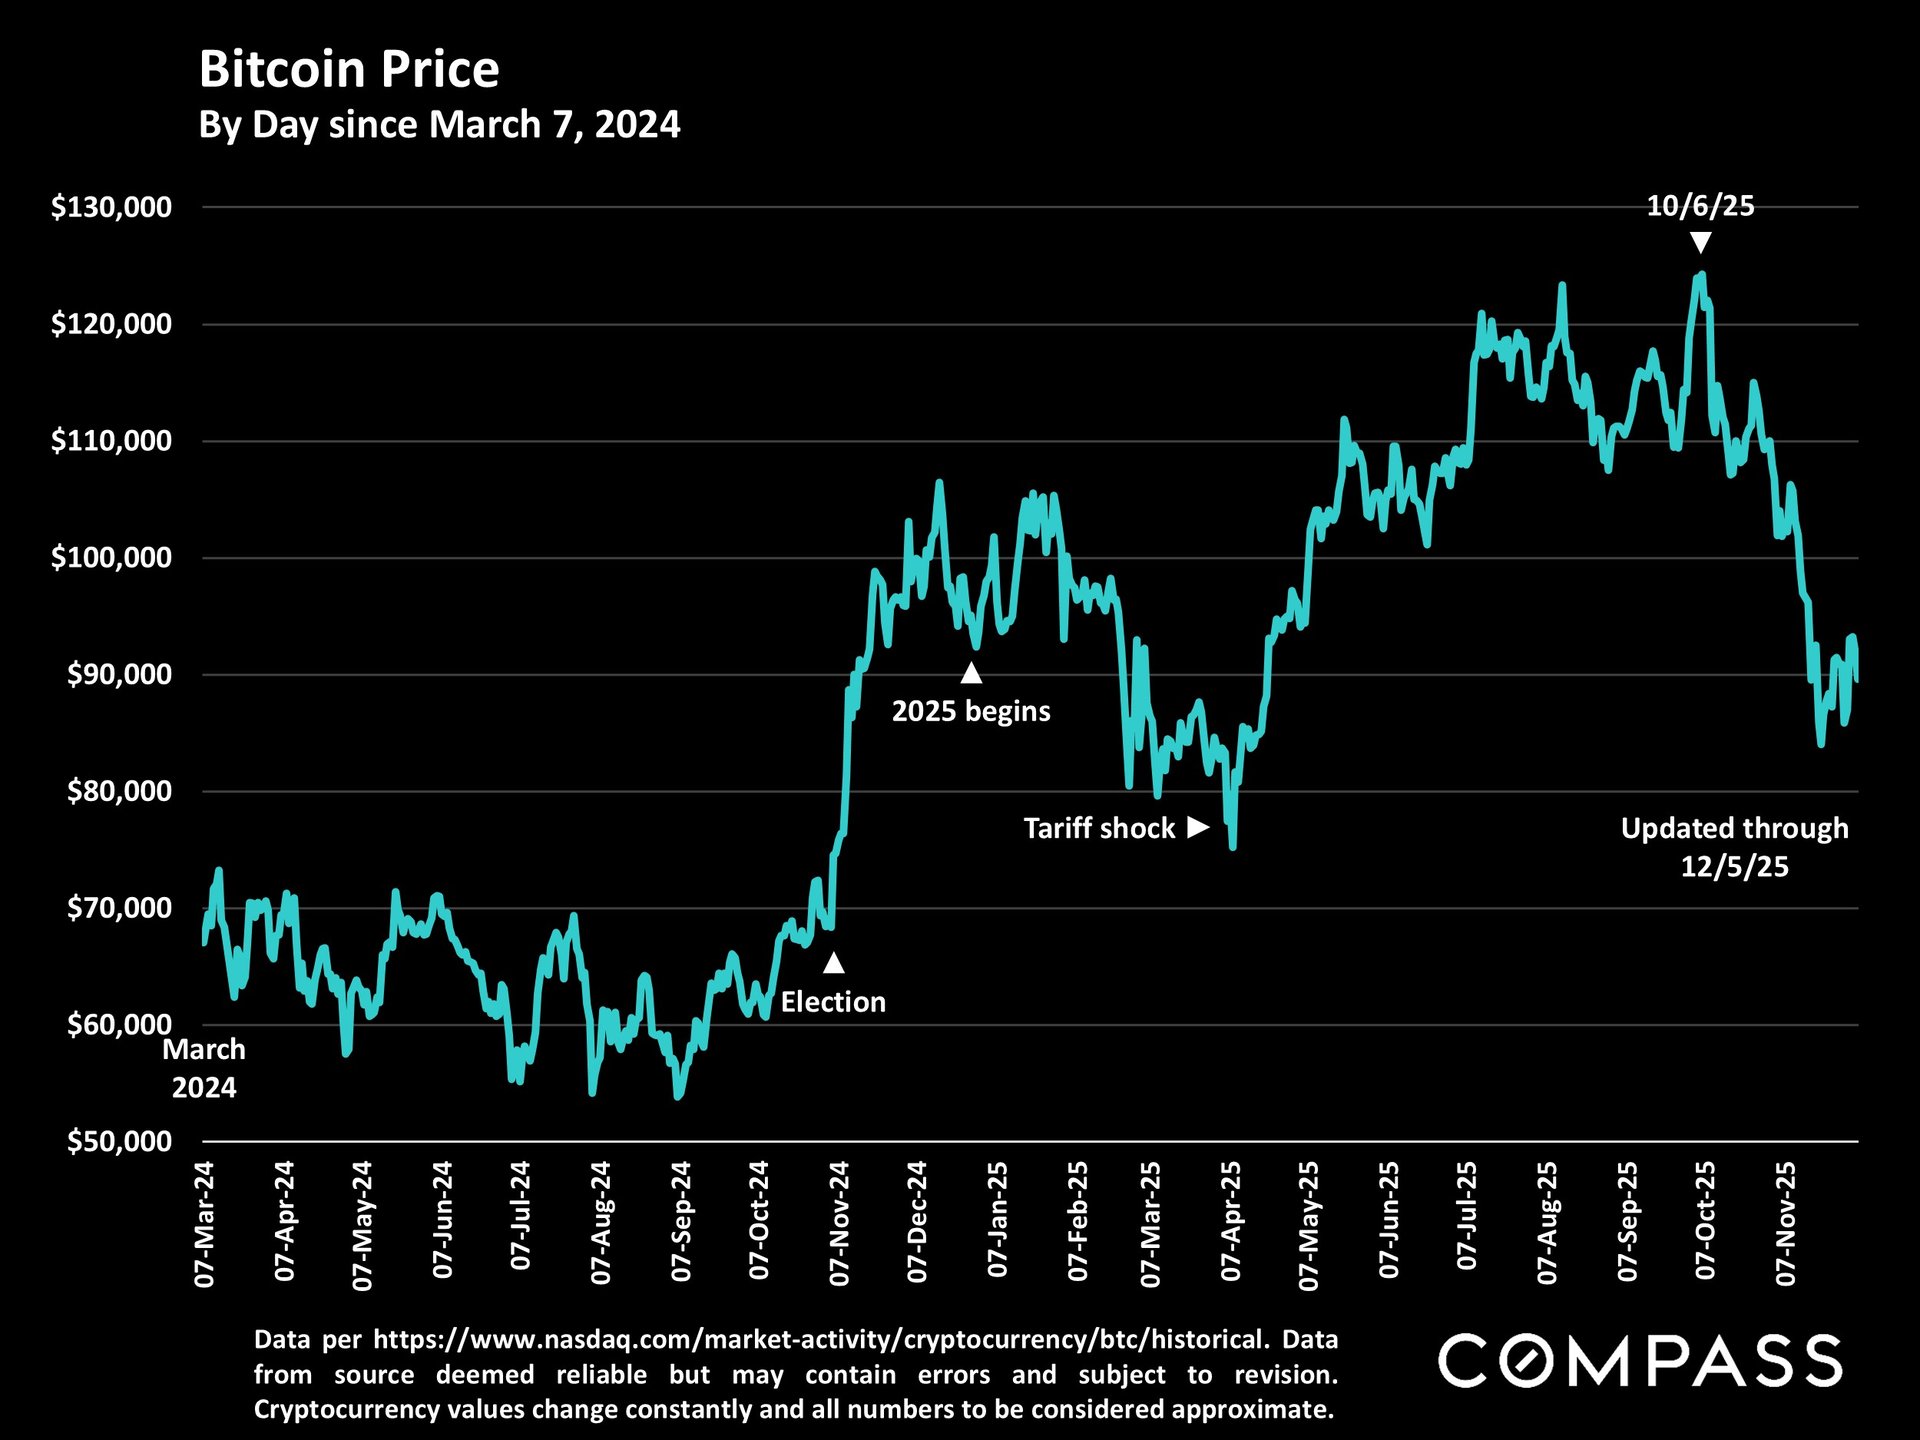
San Francisco real estate market report on seasonal activity, fall demand, and financial conditions, with Compass branding.San Francisco home sales chart showing sales counts by property type and bedroom count, with median prices; two-bedroom condos lead.San Francisco house price trends chart, 1990–2025, with median prices reaching $1.8 million in November 2025.Table of San Francisco’s biggest reported 2025 home sales, led by a $26.5 million Pacific Heights sale.San Francisco two-bedroom condo price chart, showing a November 2025 median of $1,297,500.Chart tracks San Francisco median house and condo values per square foot from 2005 through November 2025.Chart comparing San Francisco two-bedroom condo prices downtown and elsewhere from 2005 through November 2025.Table of San Francisco’s biggest condo and co-op sales, led by a $24 million Pacific Heights co-op.Bar chart of San Francisco new listings from 2021 to 2025, showing recurring September peaks and December declines.Bar chart showing San Francisco active and coming-soon listings from February 2022 to December 2025.San Francisco listing counts by days on market, with the largest group at 61–90 days and a breakdown of listings over 90 days.Chart of San Francisco listings going into contract, showing seasonal trends from August 2021 through November 2025.San Francisco monthly absorption-rate chart, with green bars peaking above 30% in fall 2025.Chart of monthly San Francisco home sales, January 2021–November 2025, with seasonal peaks and market notes.Chart of San Francisco $5 million-plus home sales, showing a four-year monthly high in October 2025.Chart of monthly San Francisco home sales closing above list price, January 2020–November 2025.San Francisco sale-to-list price chart, with monthly bars from 2020–2025 and a dashed 100% benchmark.Chart of San Francisco average days on market, with monthly bars from 2021 to November 2025 and seasonal labels.Selected Economic IndicatorsChart of weekly 30-year mortgage rates from 2023 to 2025, peaking near 7.8% and ending around 6.2%.Chart comparing Nasdaq and S&P 500 gains from January 2024 through December 2025.2025 daily VIX chart with a sharp early-April spike labeled “Tariff shock.”Chart of the S&P 500 CAPE ratio from 1985 to 2025, with a dashed historical-average line and market-event annotations.Bitcoin price chart from March 2024 to December 2025, with election, tariff shock, and October 2025 peak marked.Report notes explain real estate statistics, median sales price, square-foot calculations, and Compass legal disclaimers.

Work With Us

We will help you understand the complex aspects of the transaction and share our expertise so that you can make the best decisions possible. We are experienced, market savvy, and energetic. With both of us working for our clients, you get twice the amount of attention and insight.