


The SF Team, Eva + James, Compass

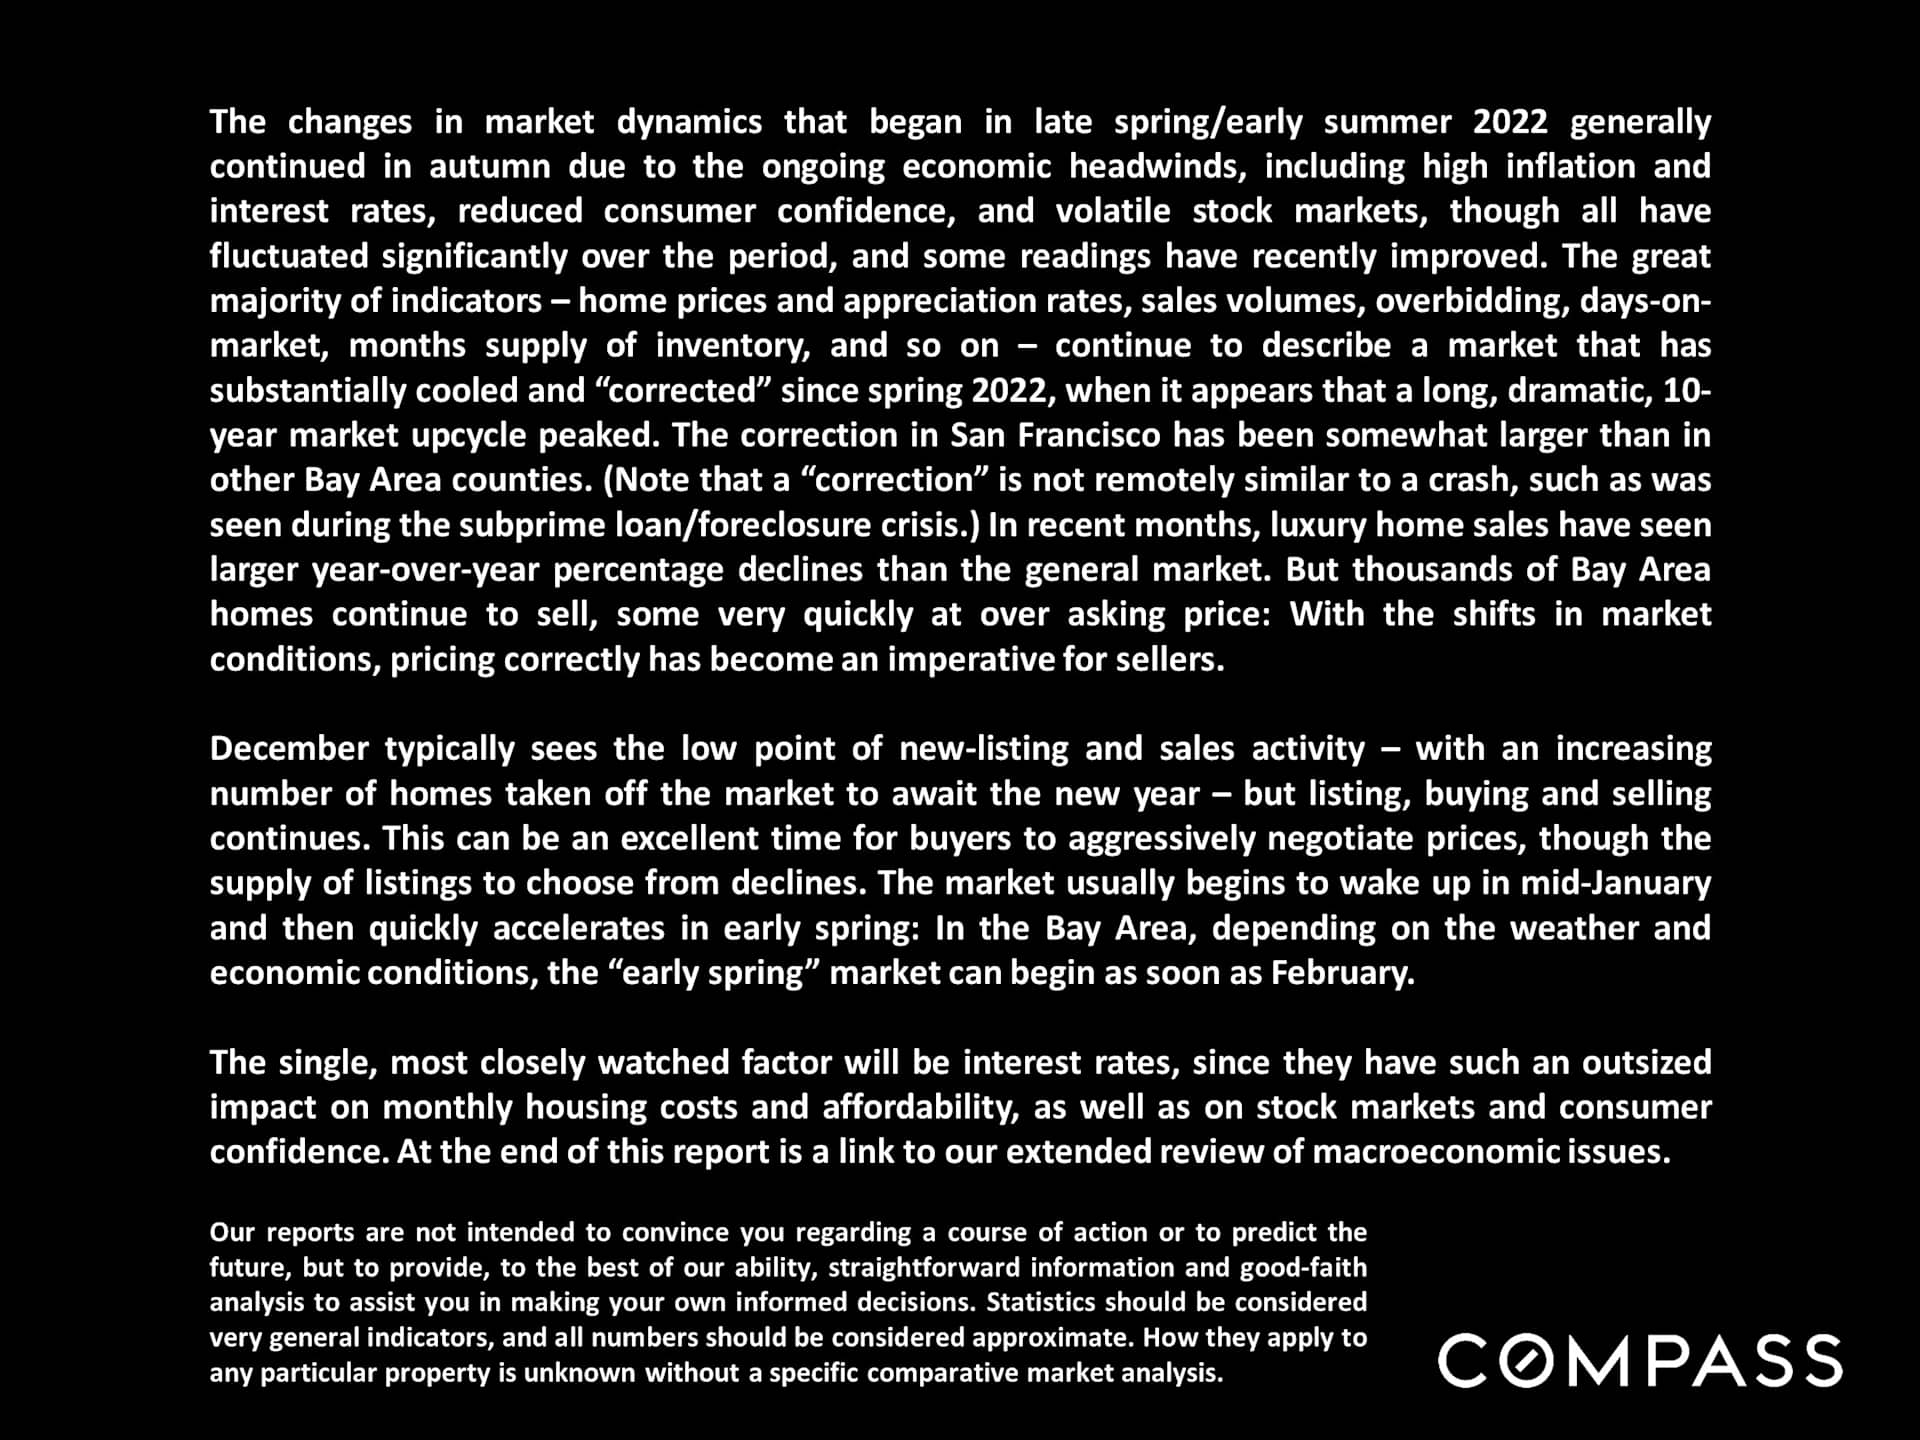
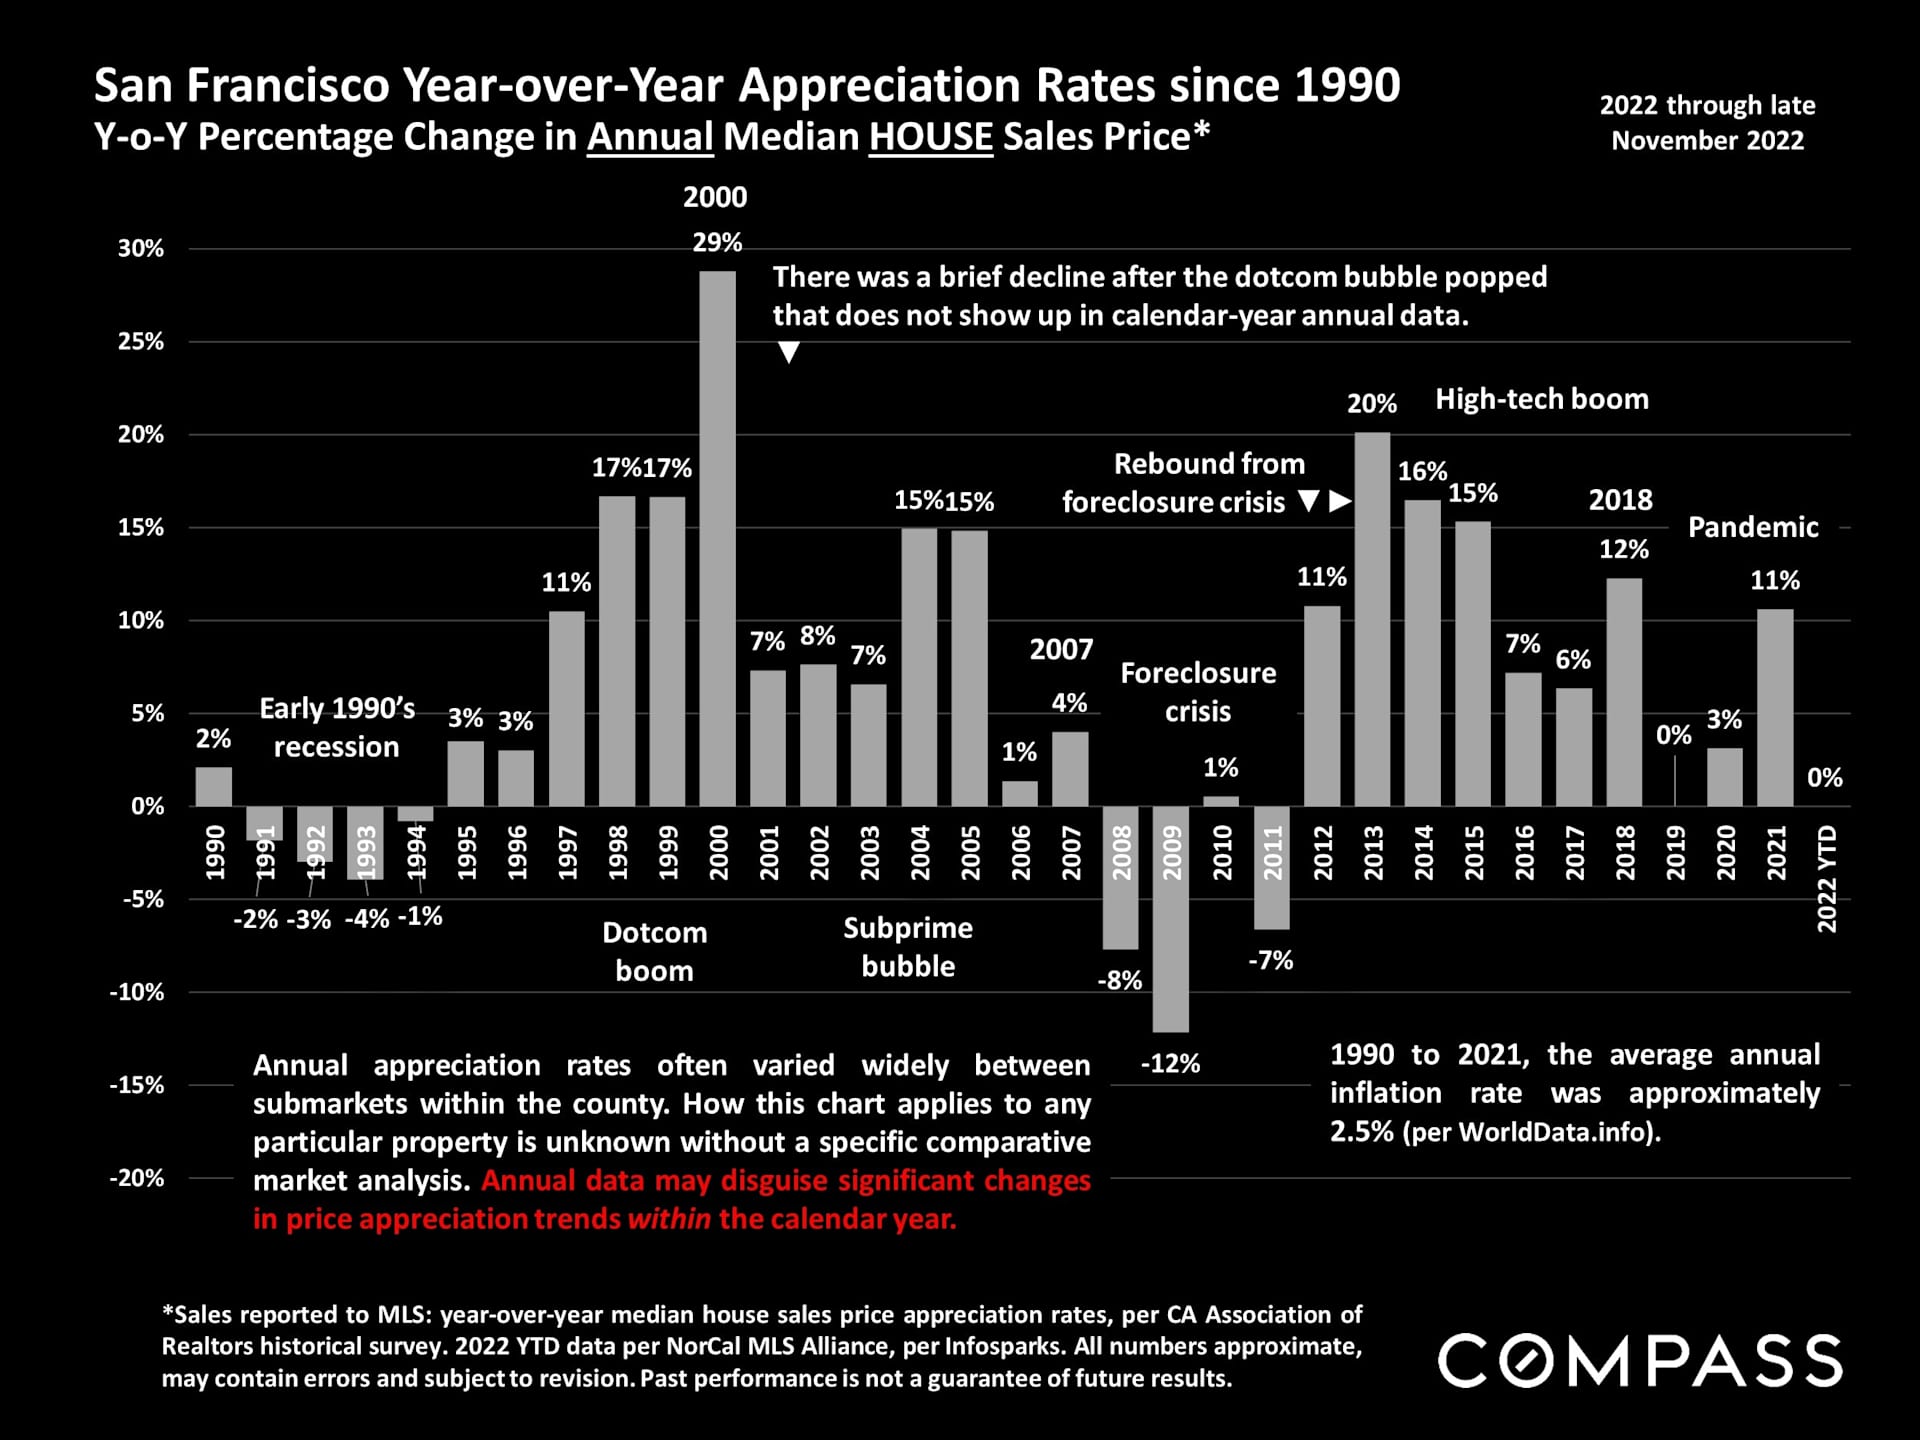
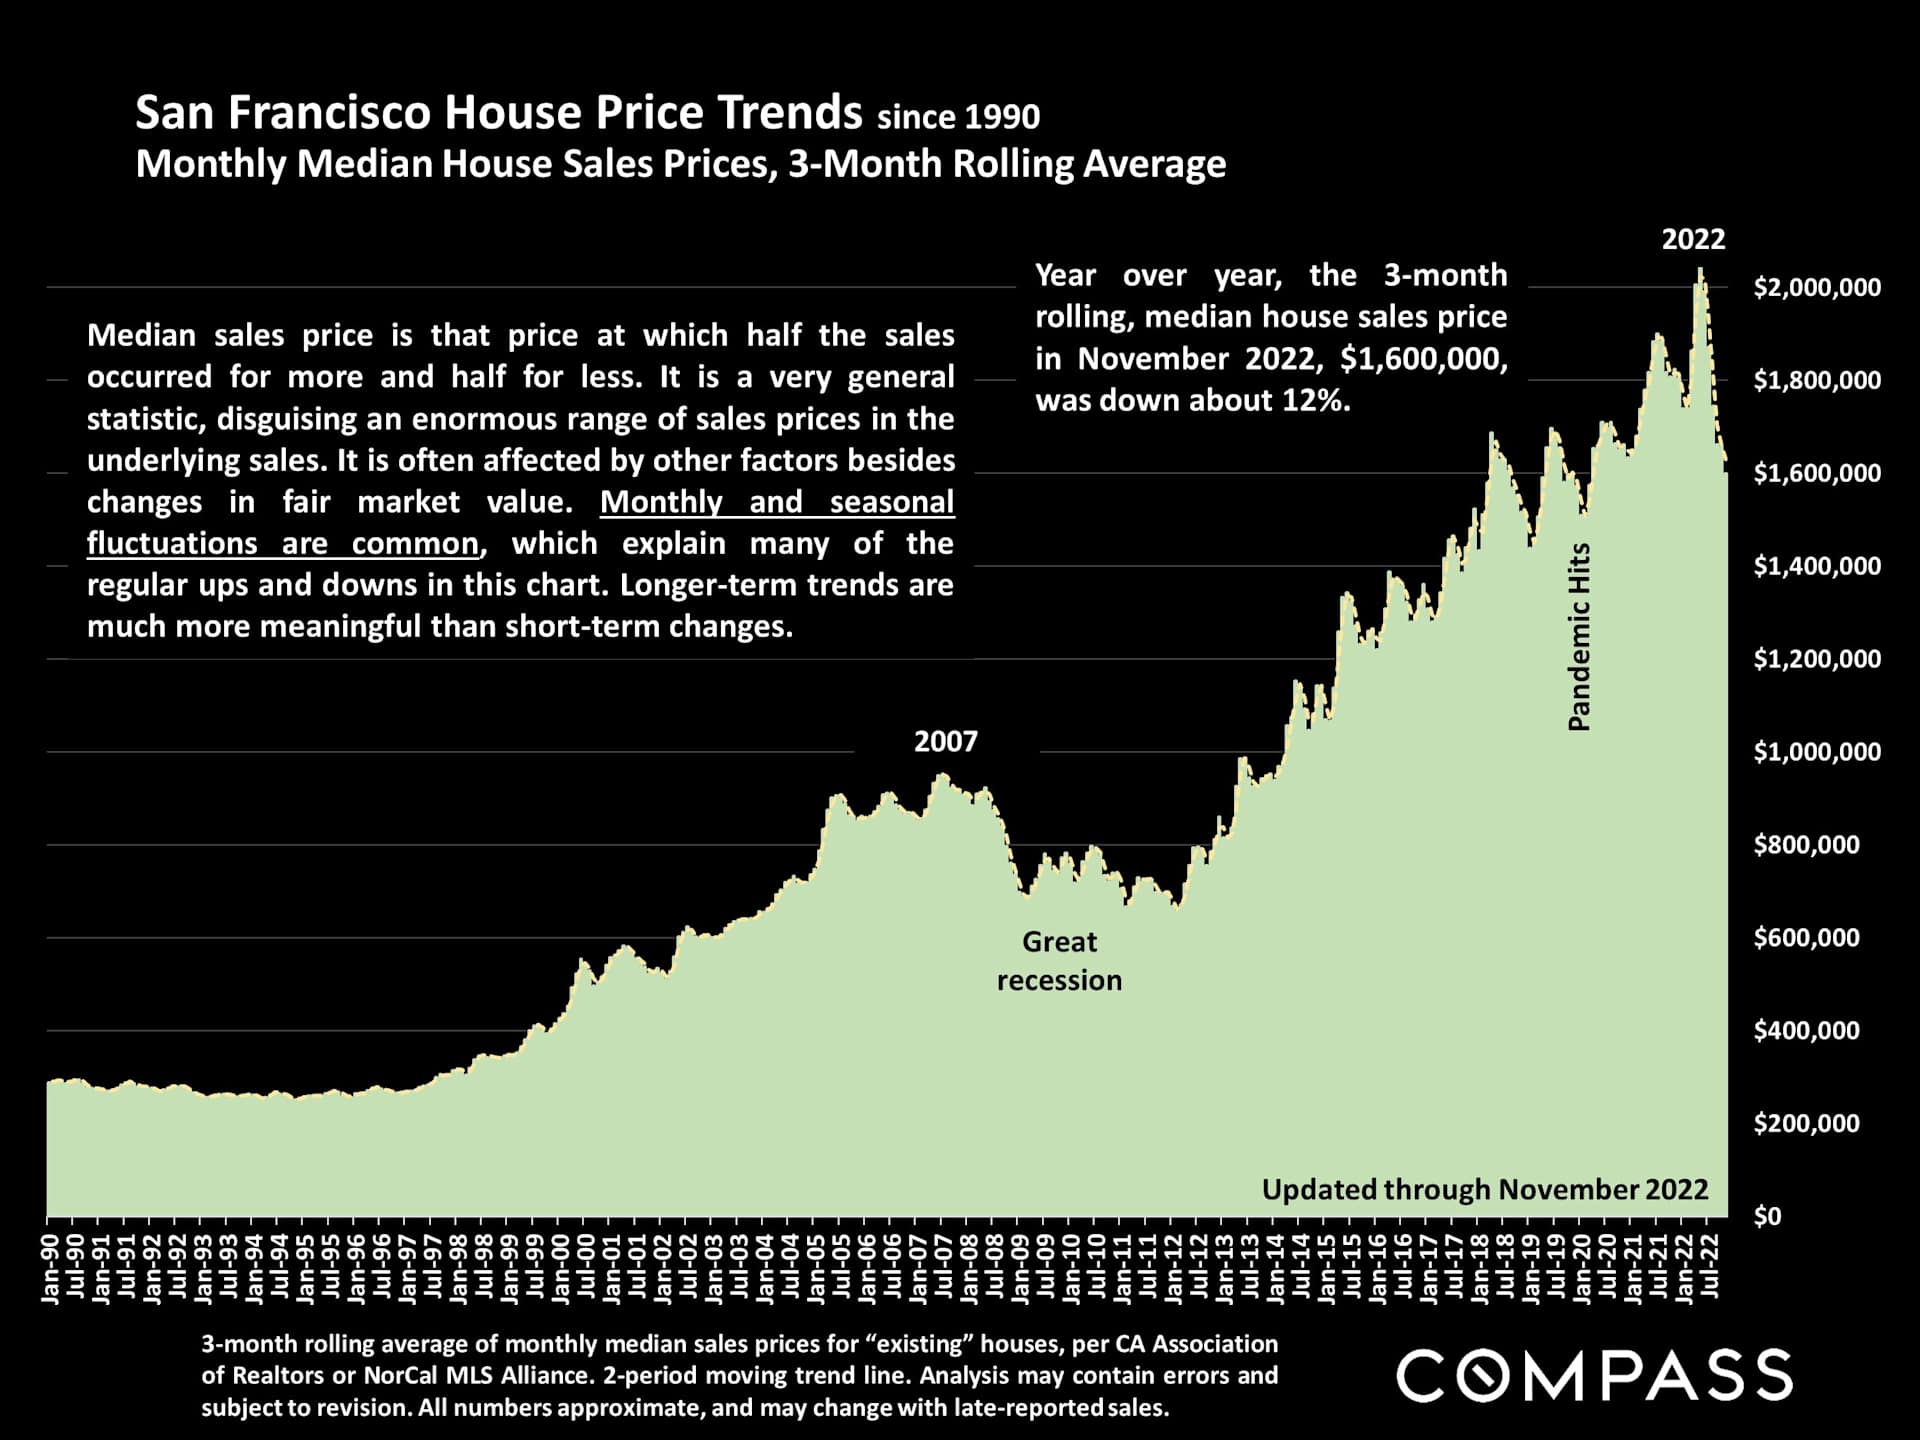
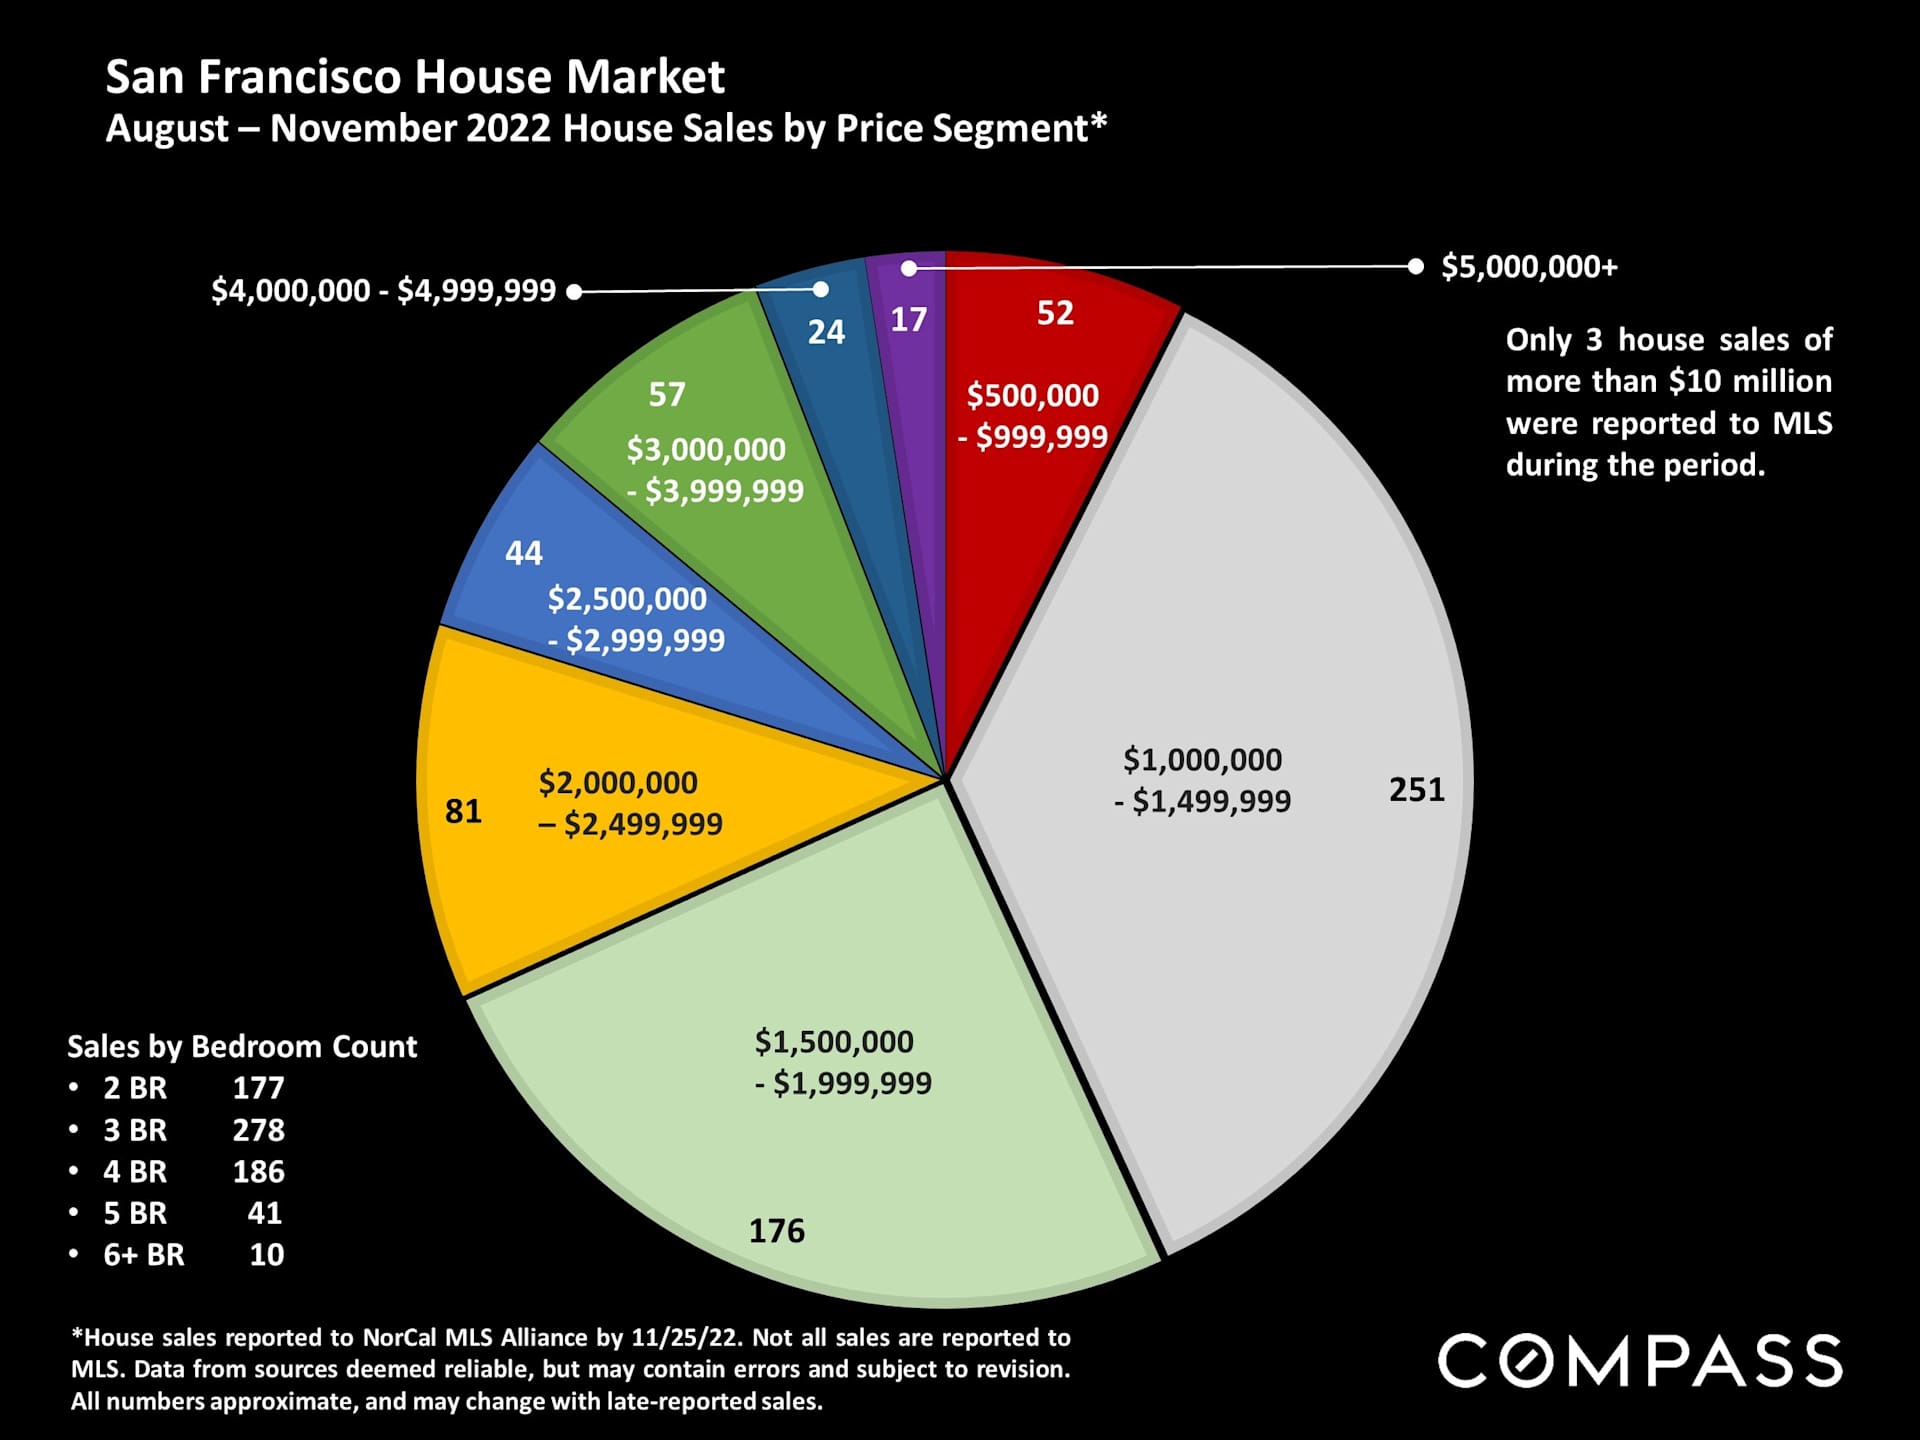
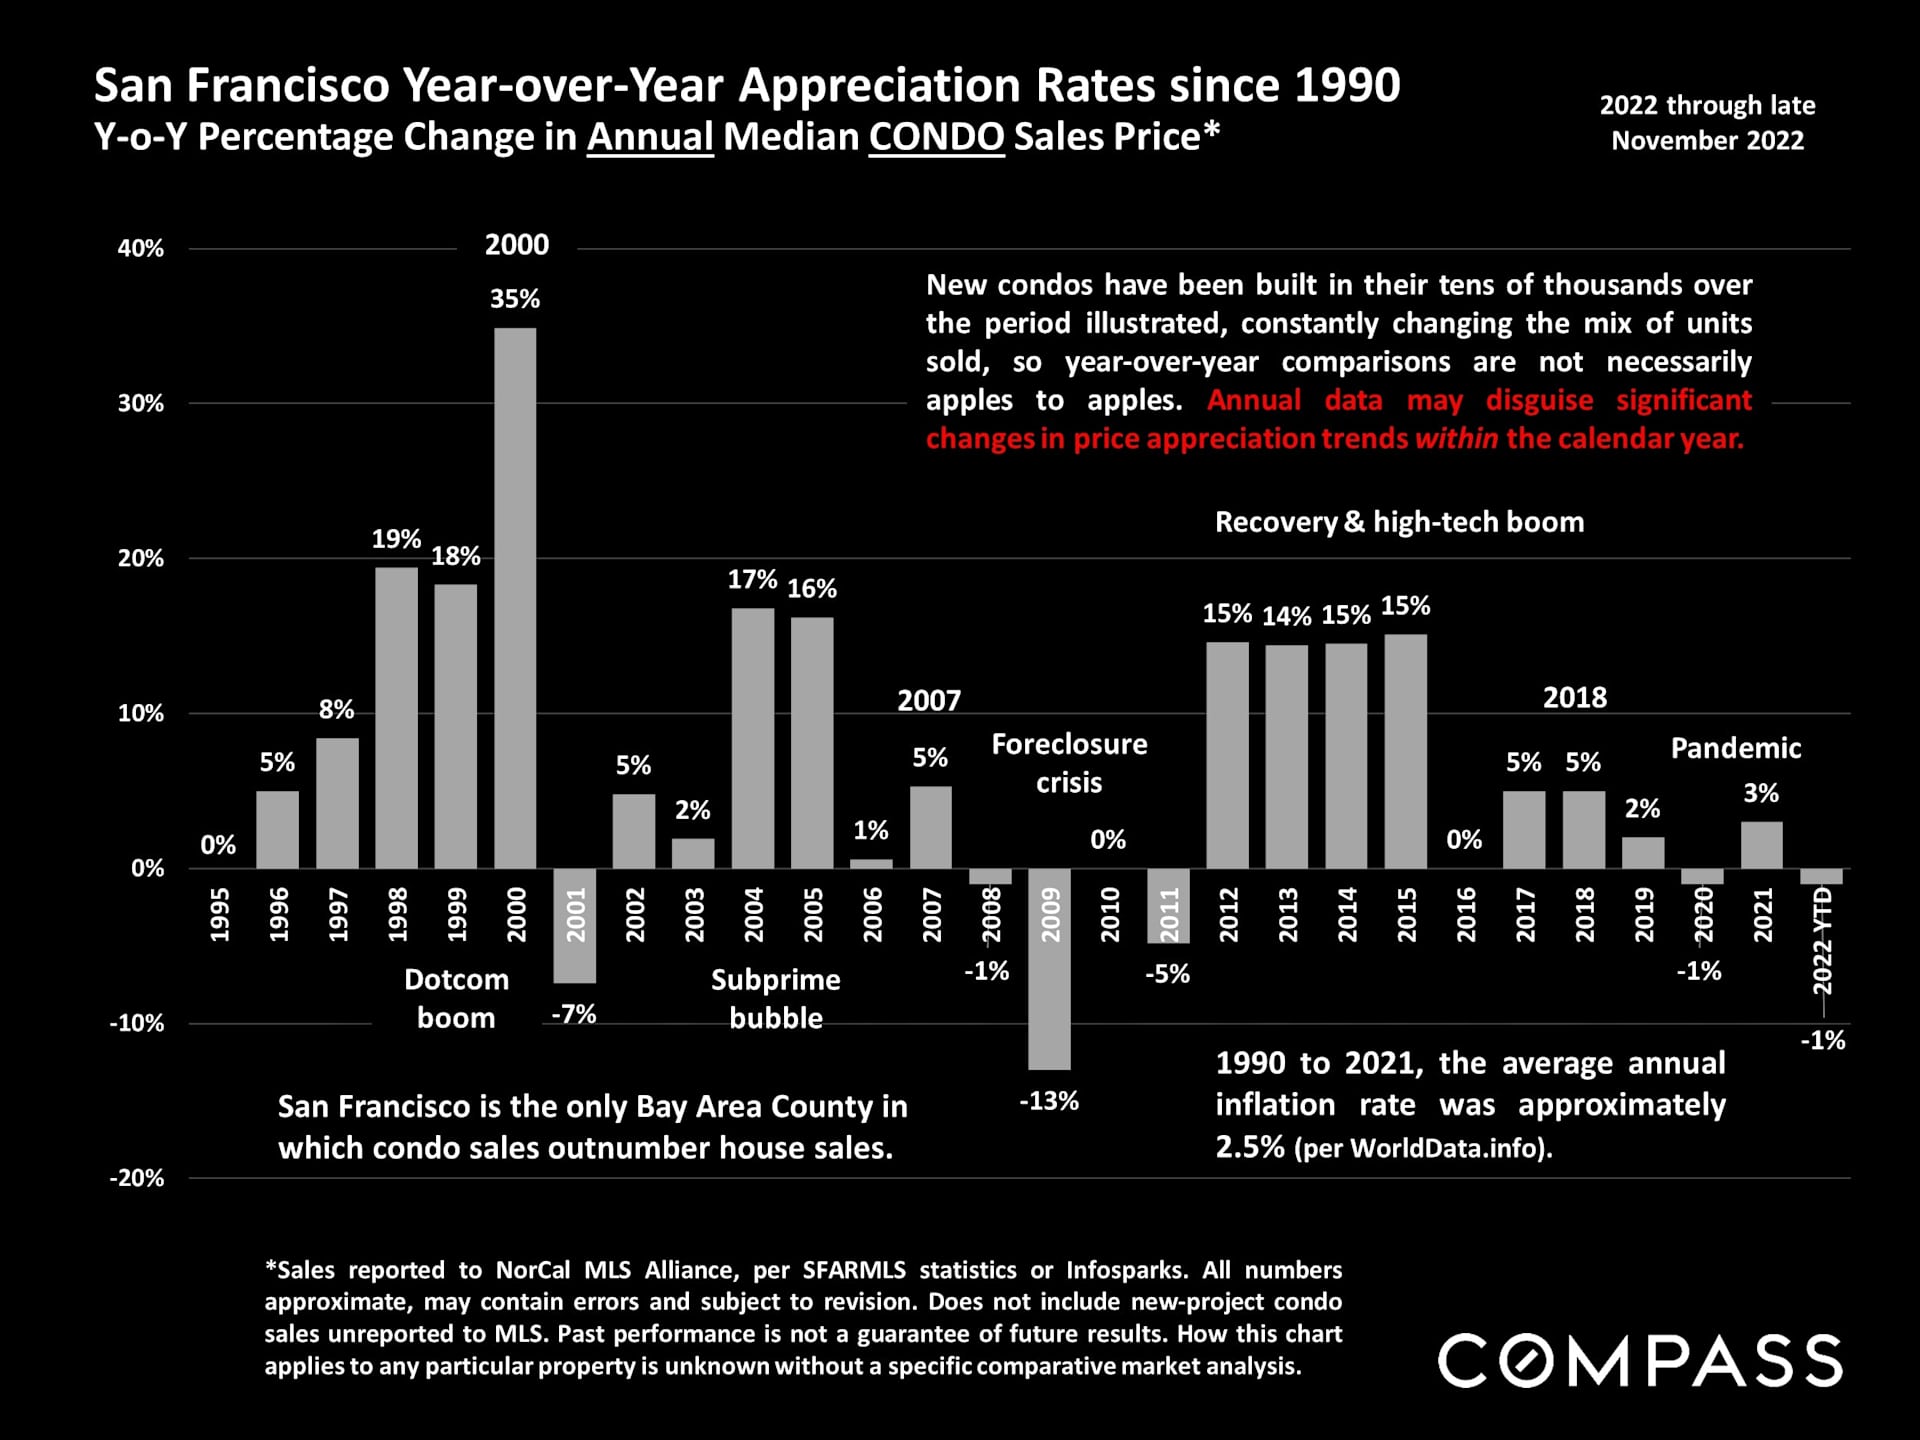
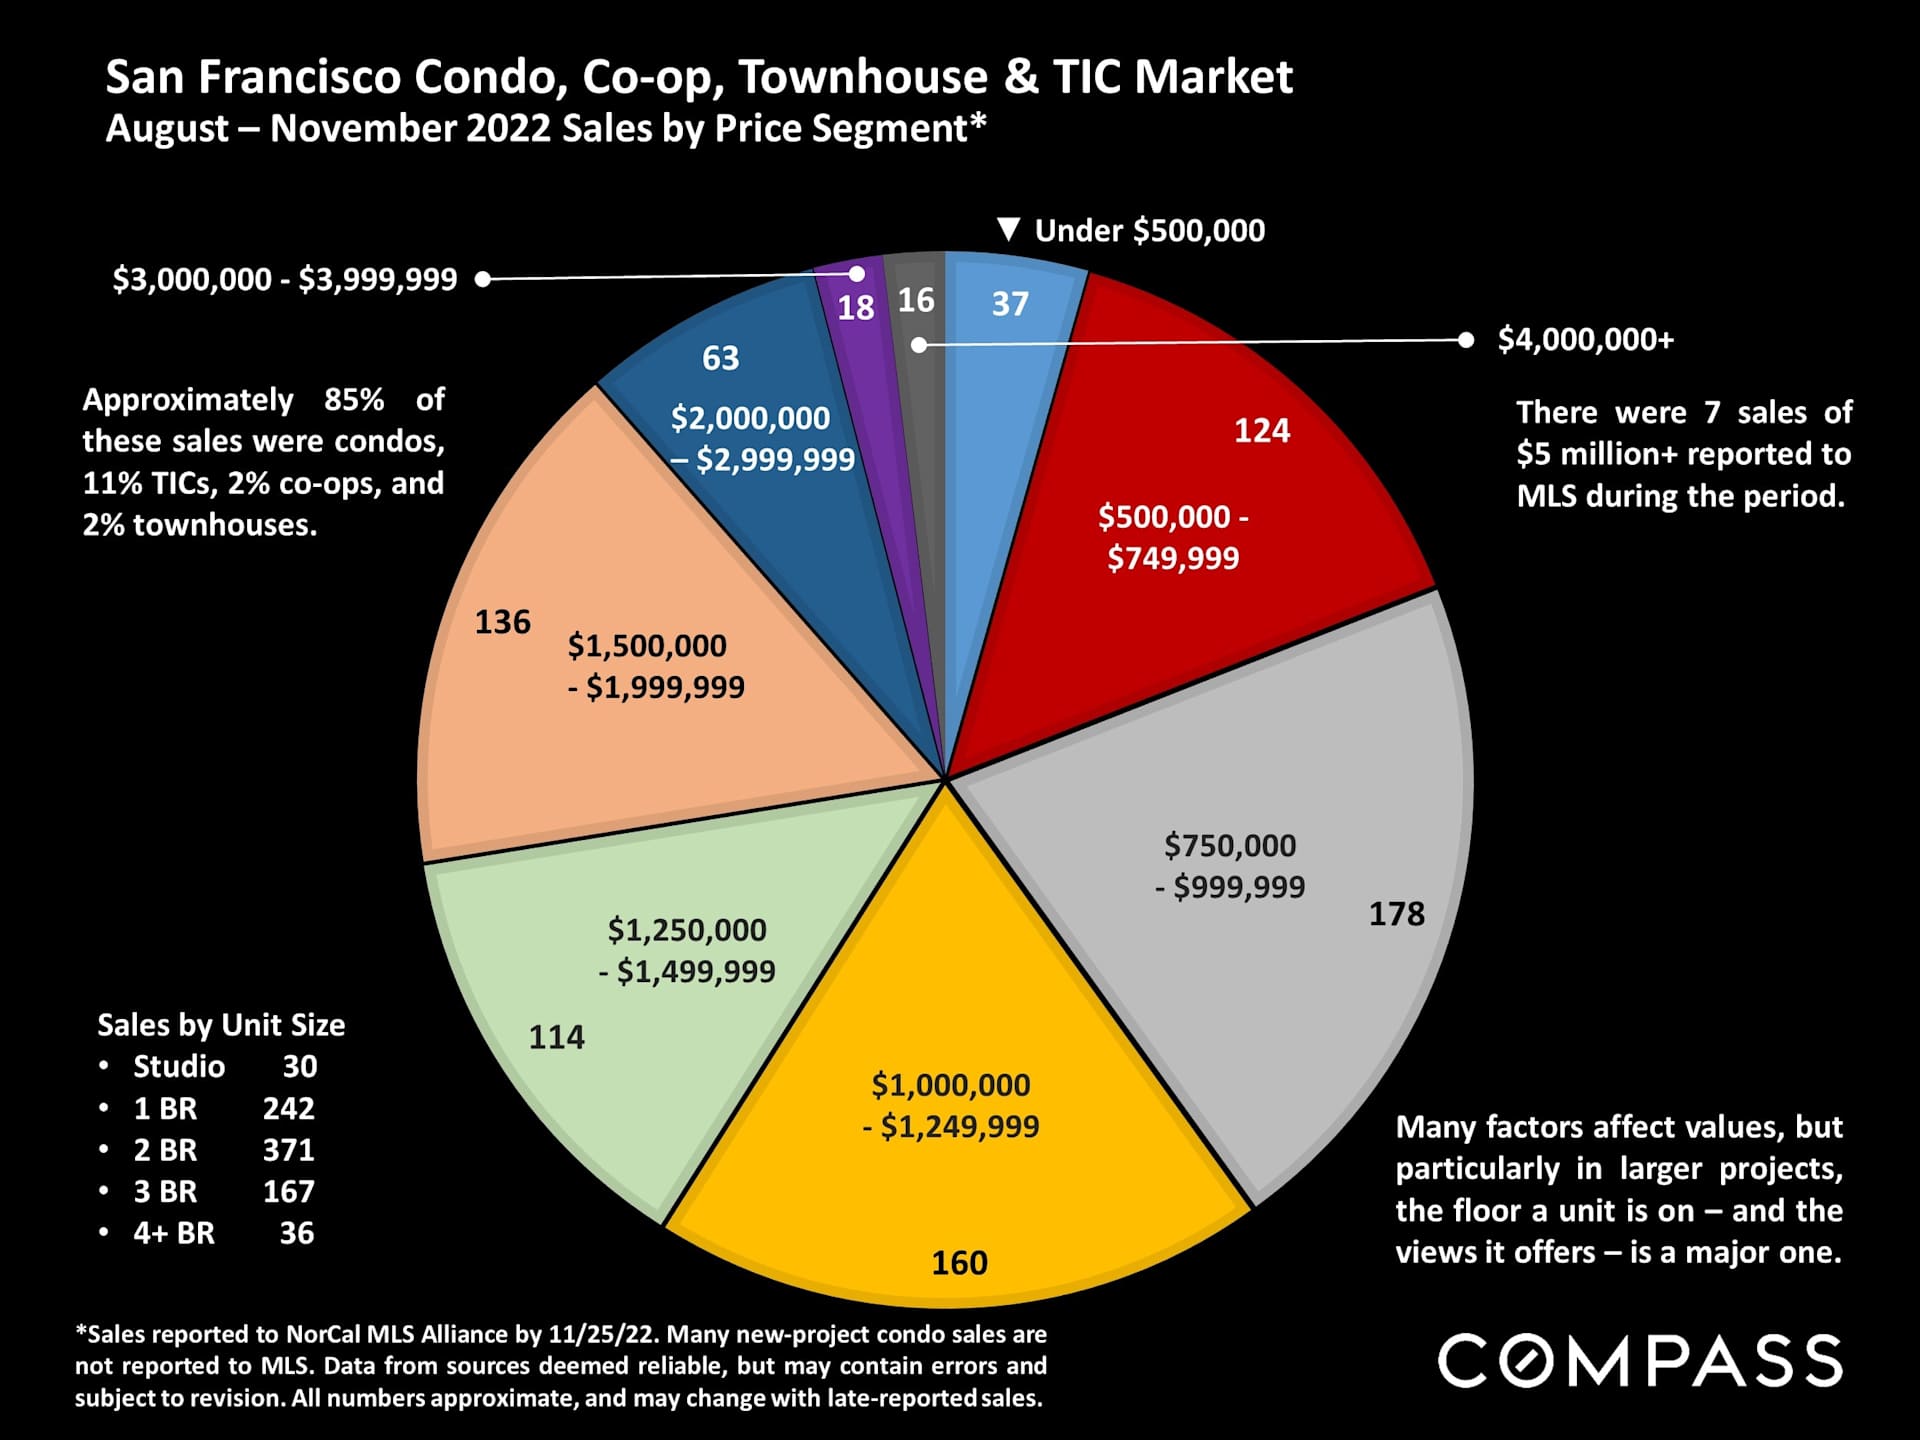
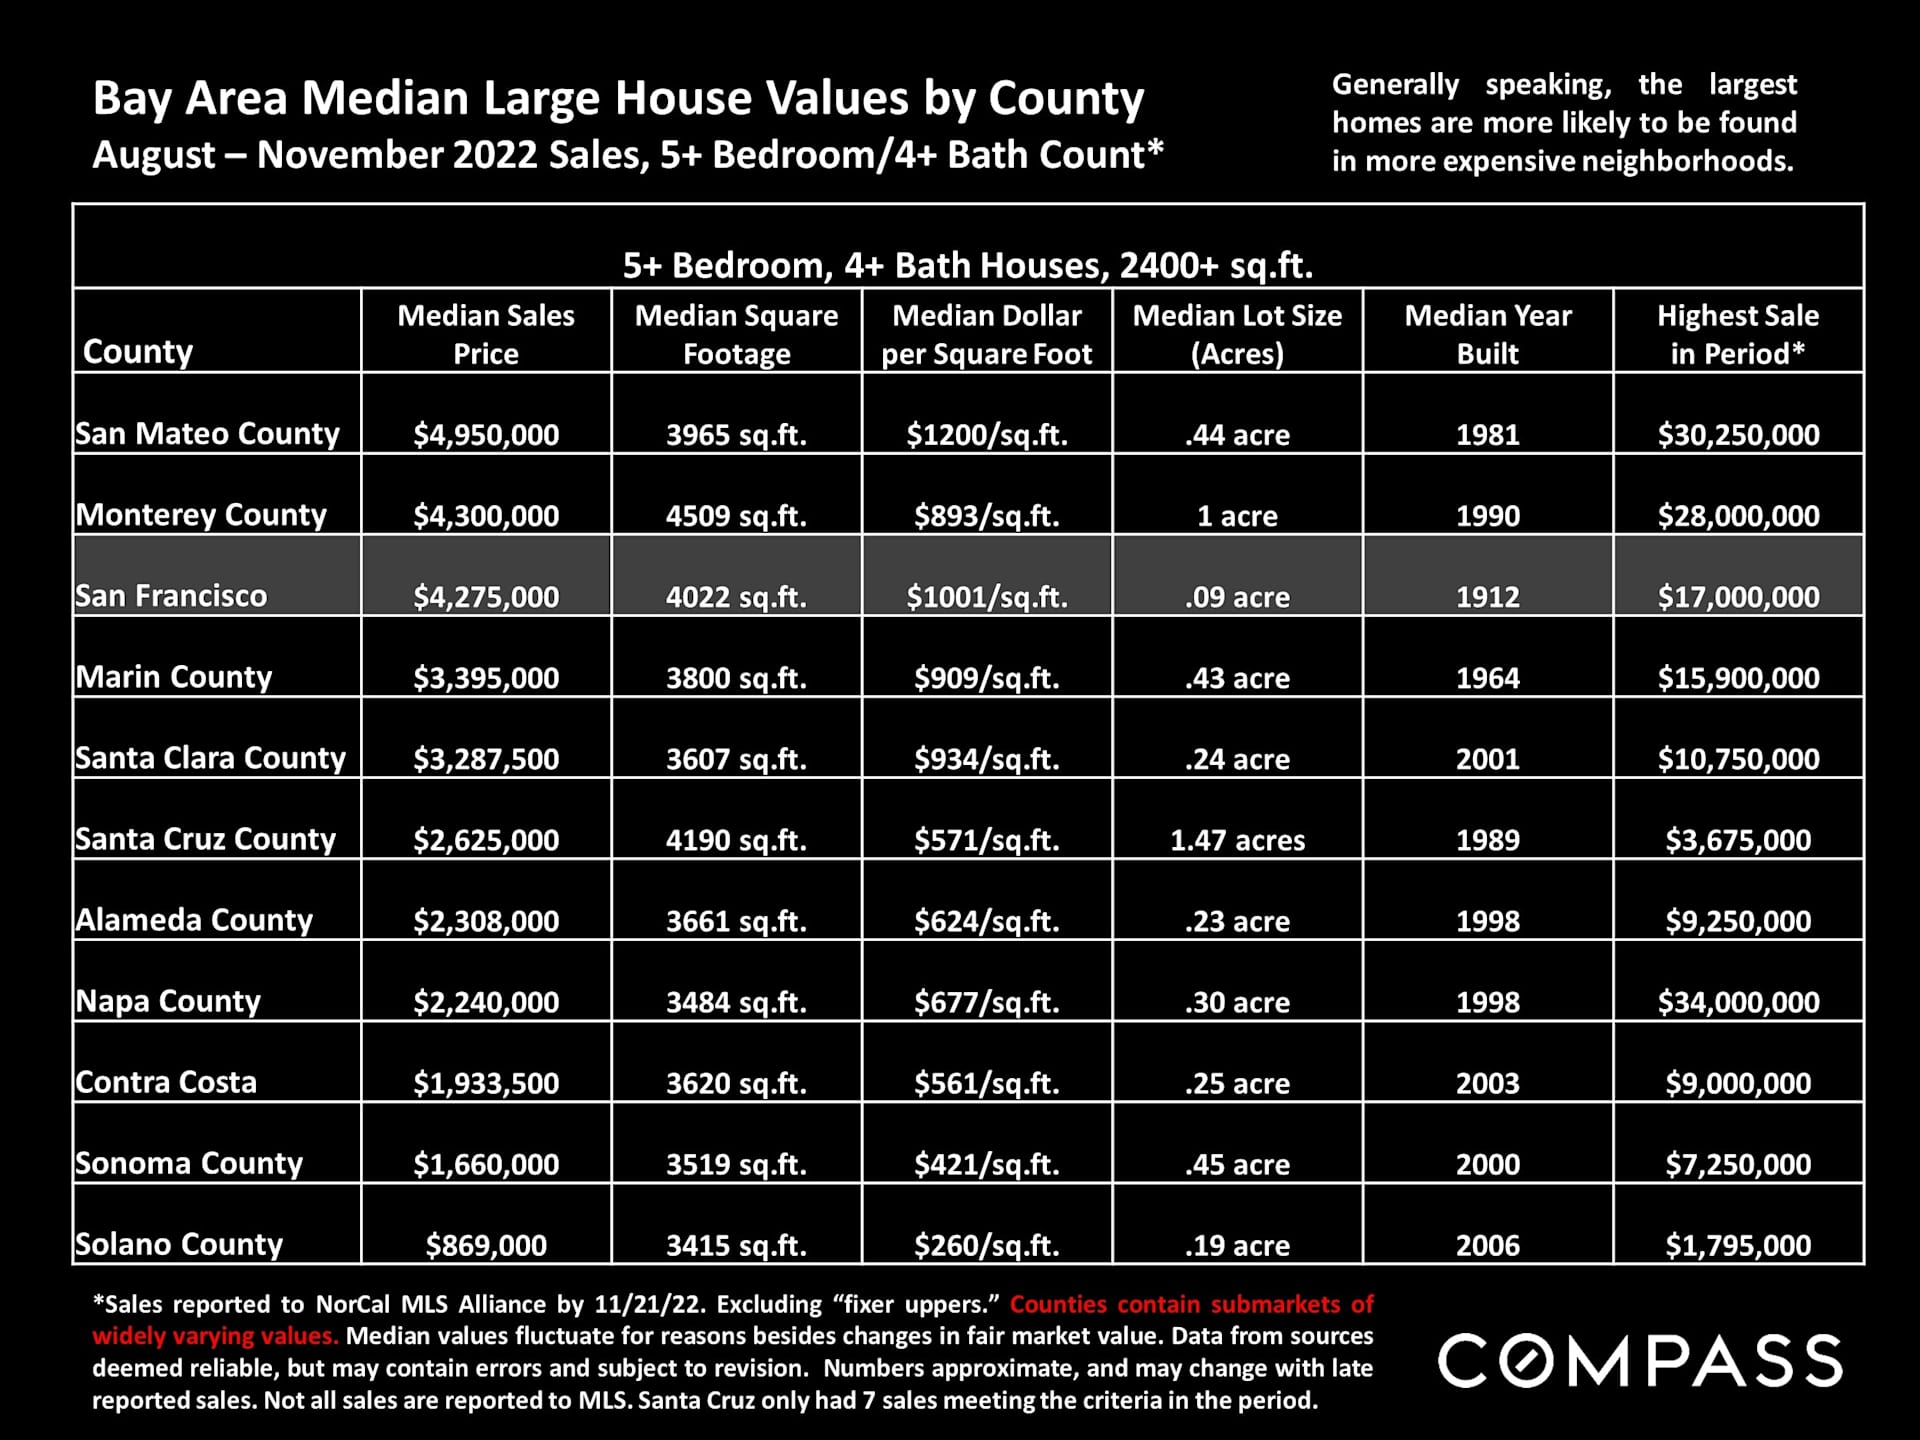
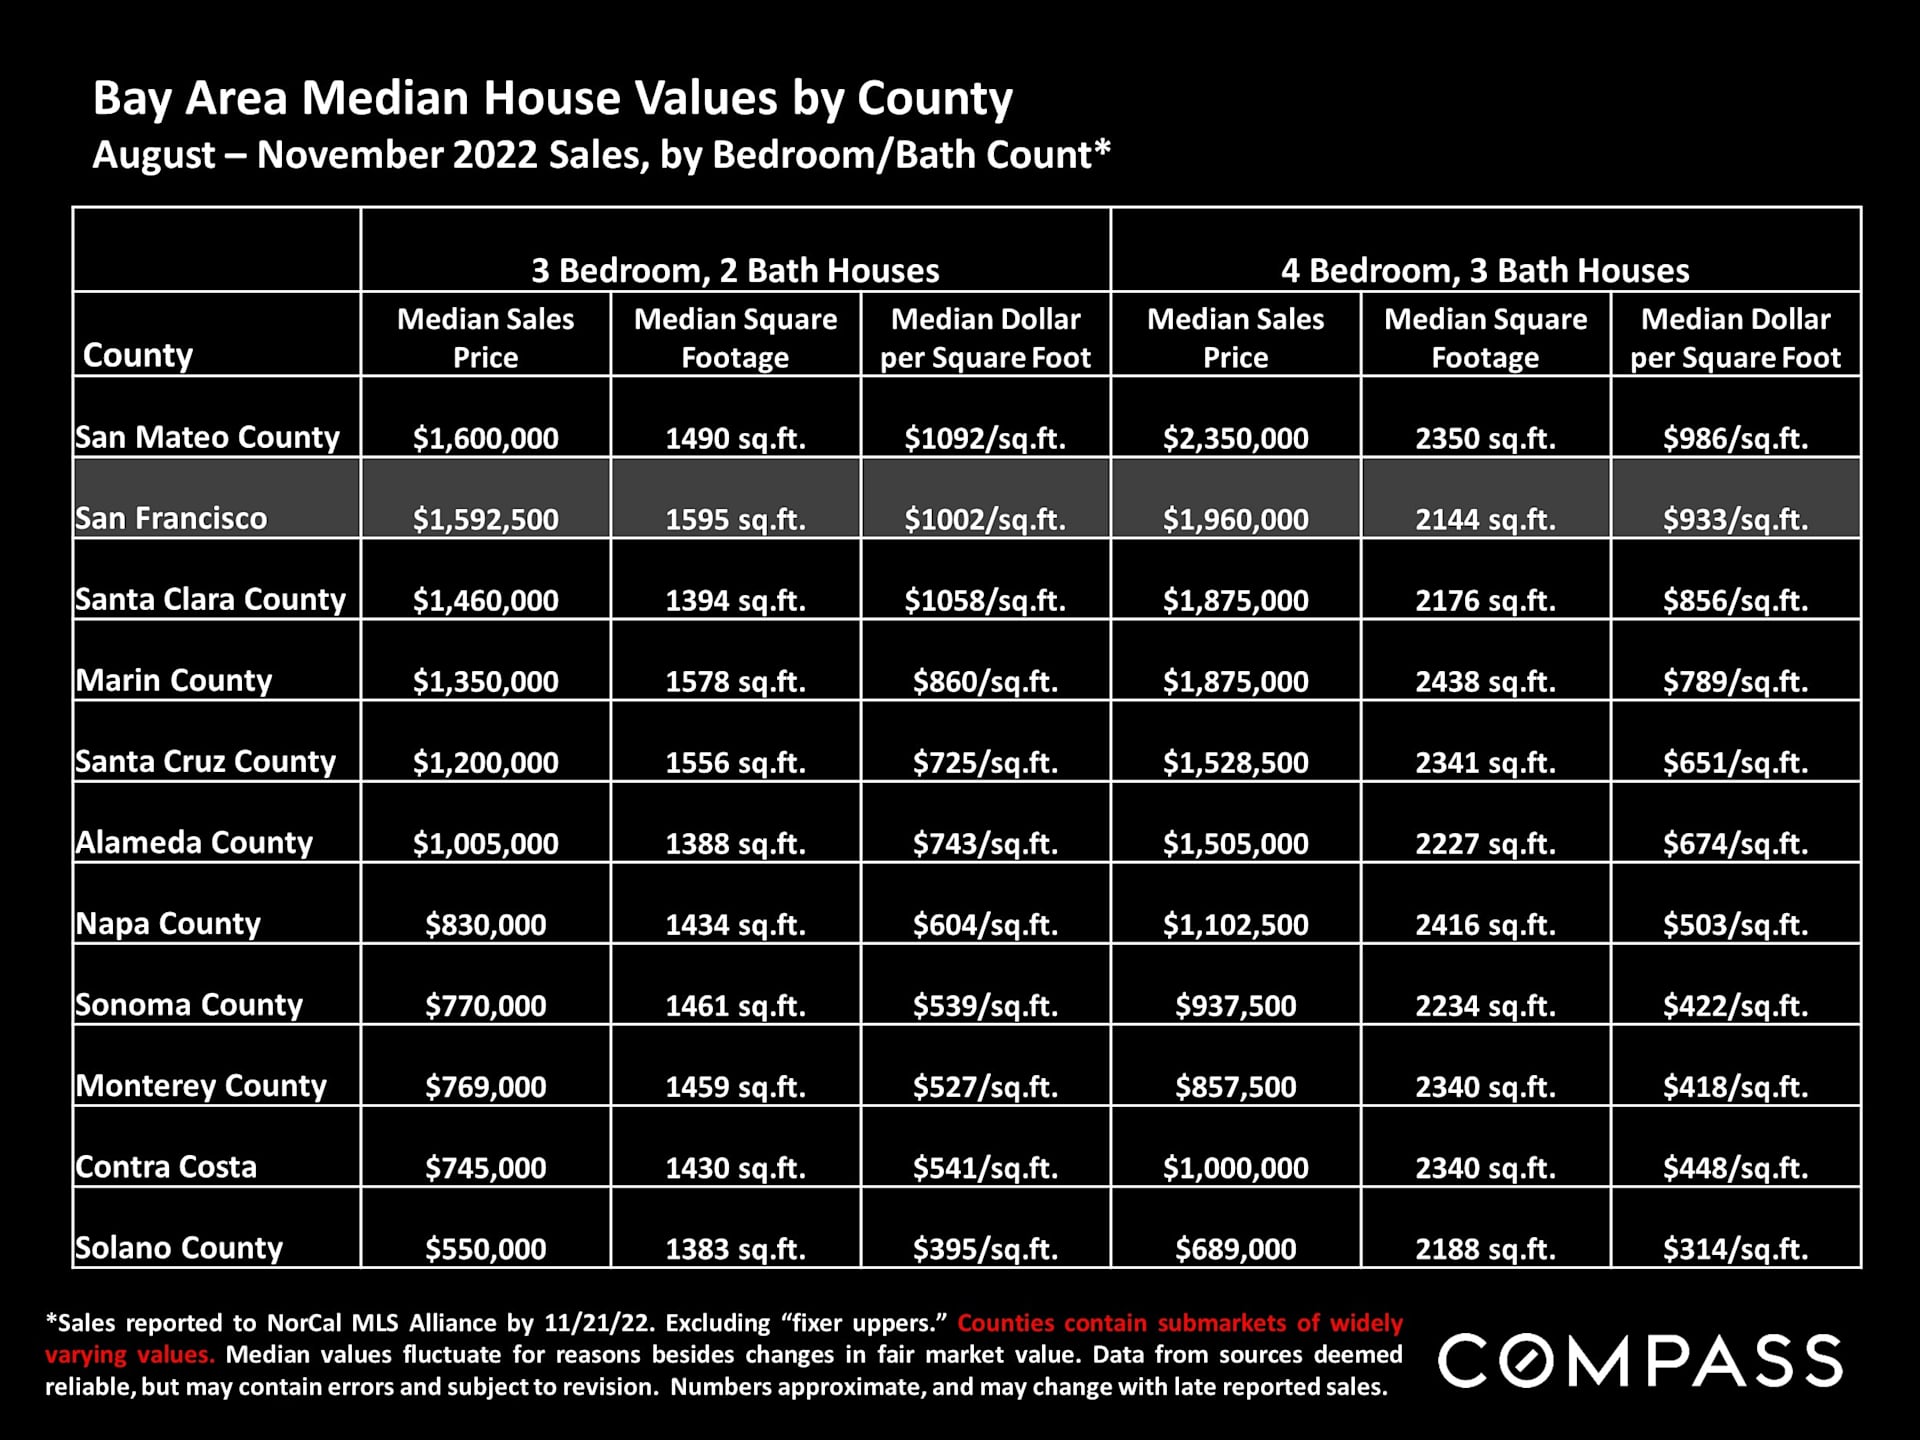
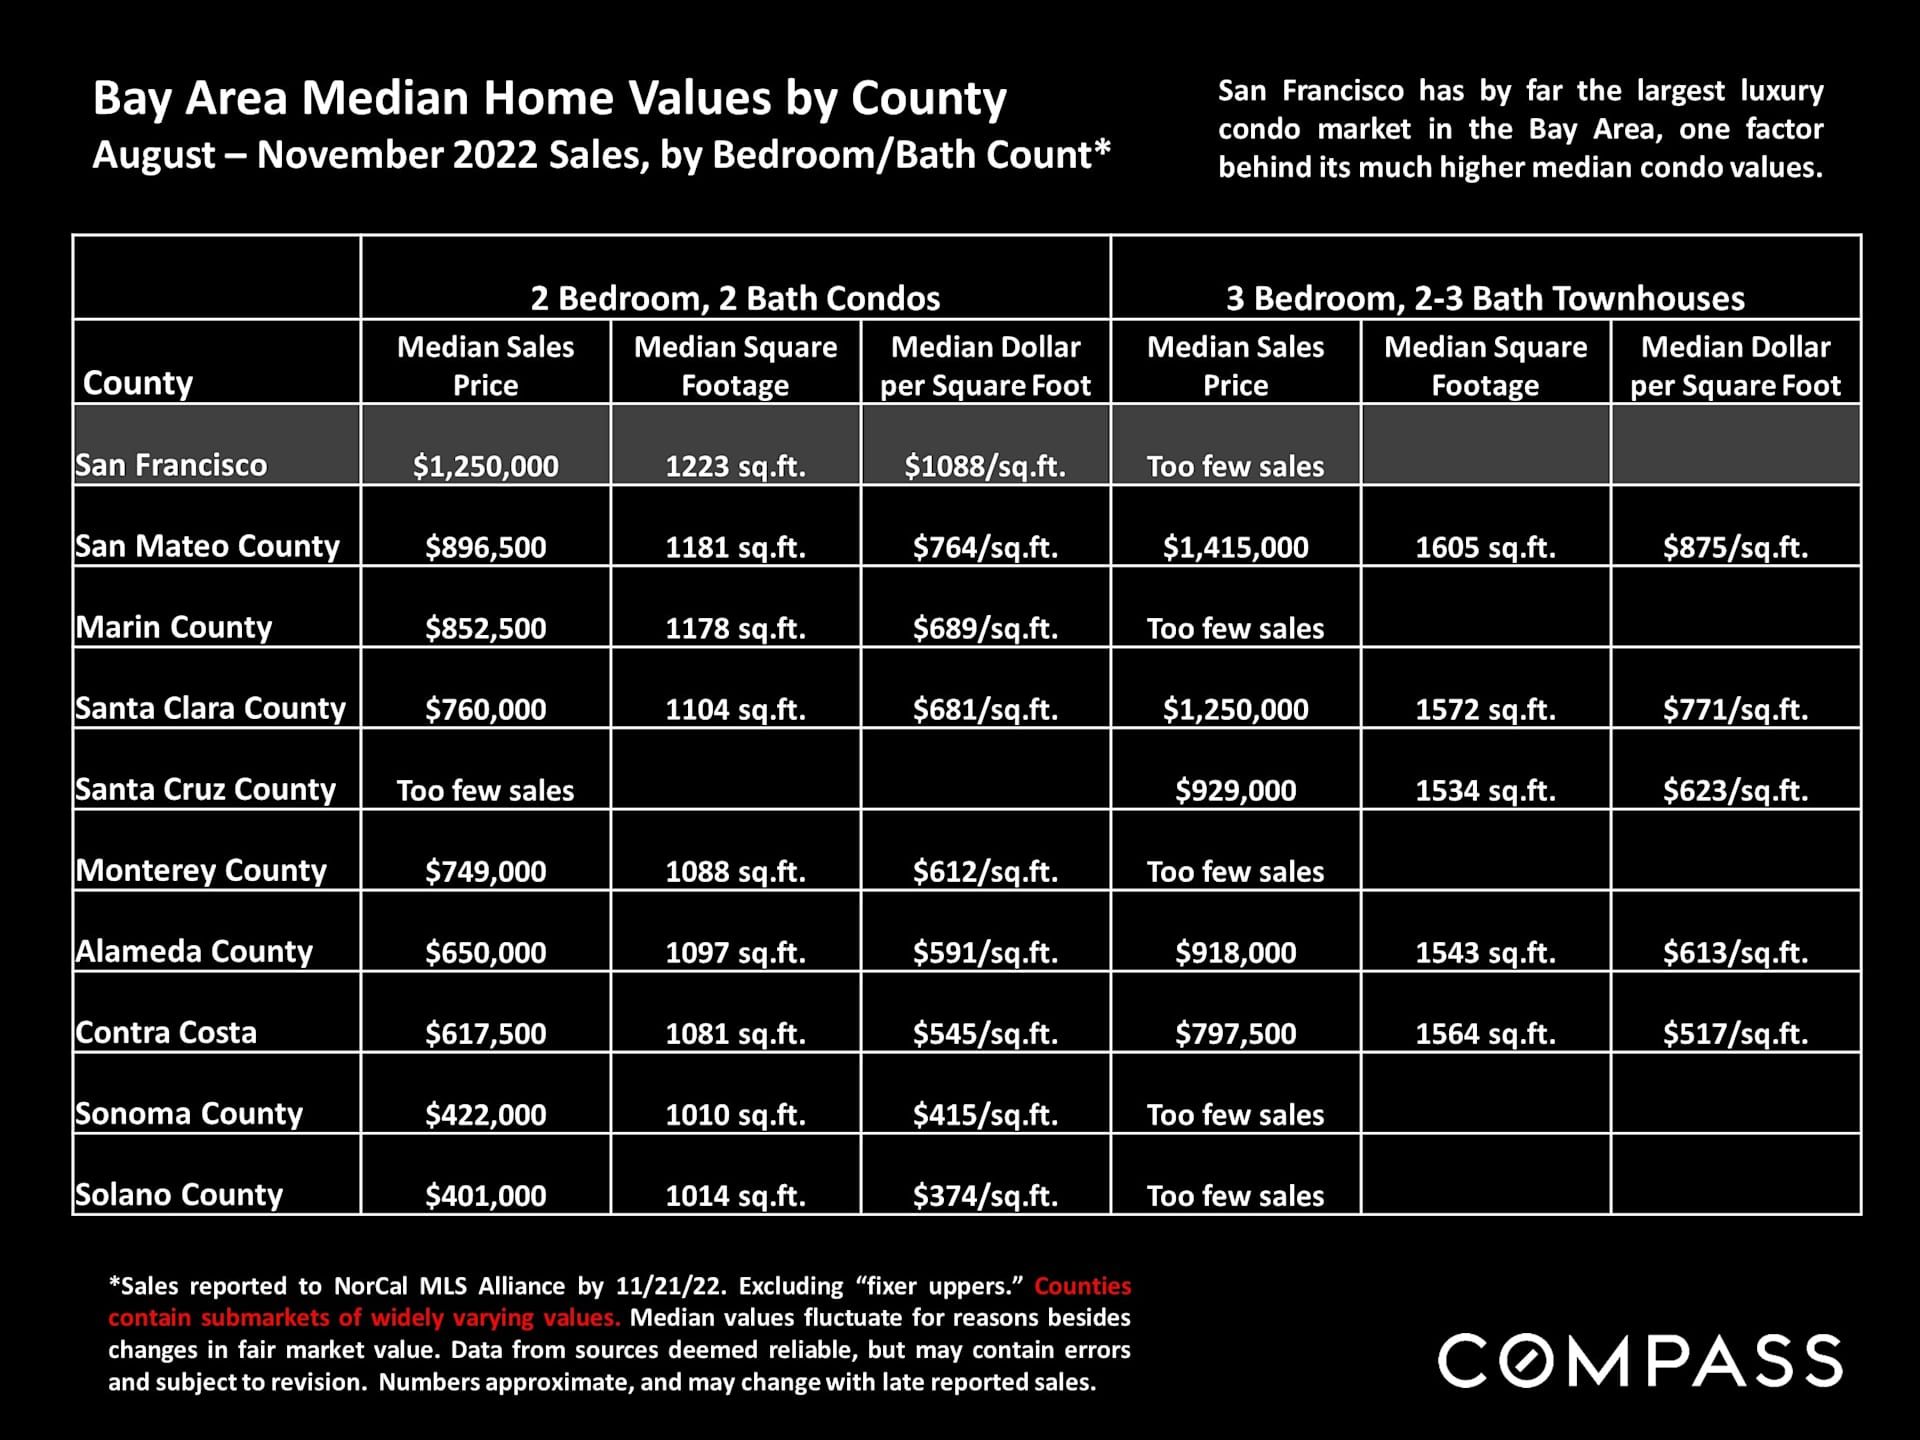
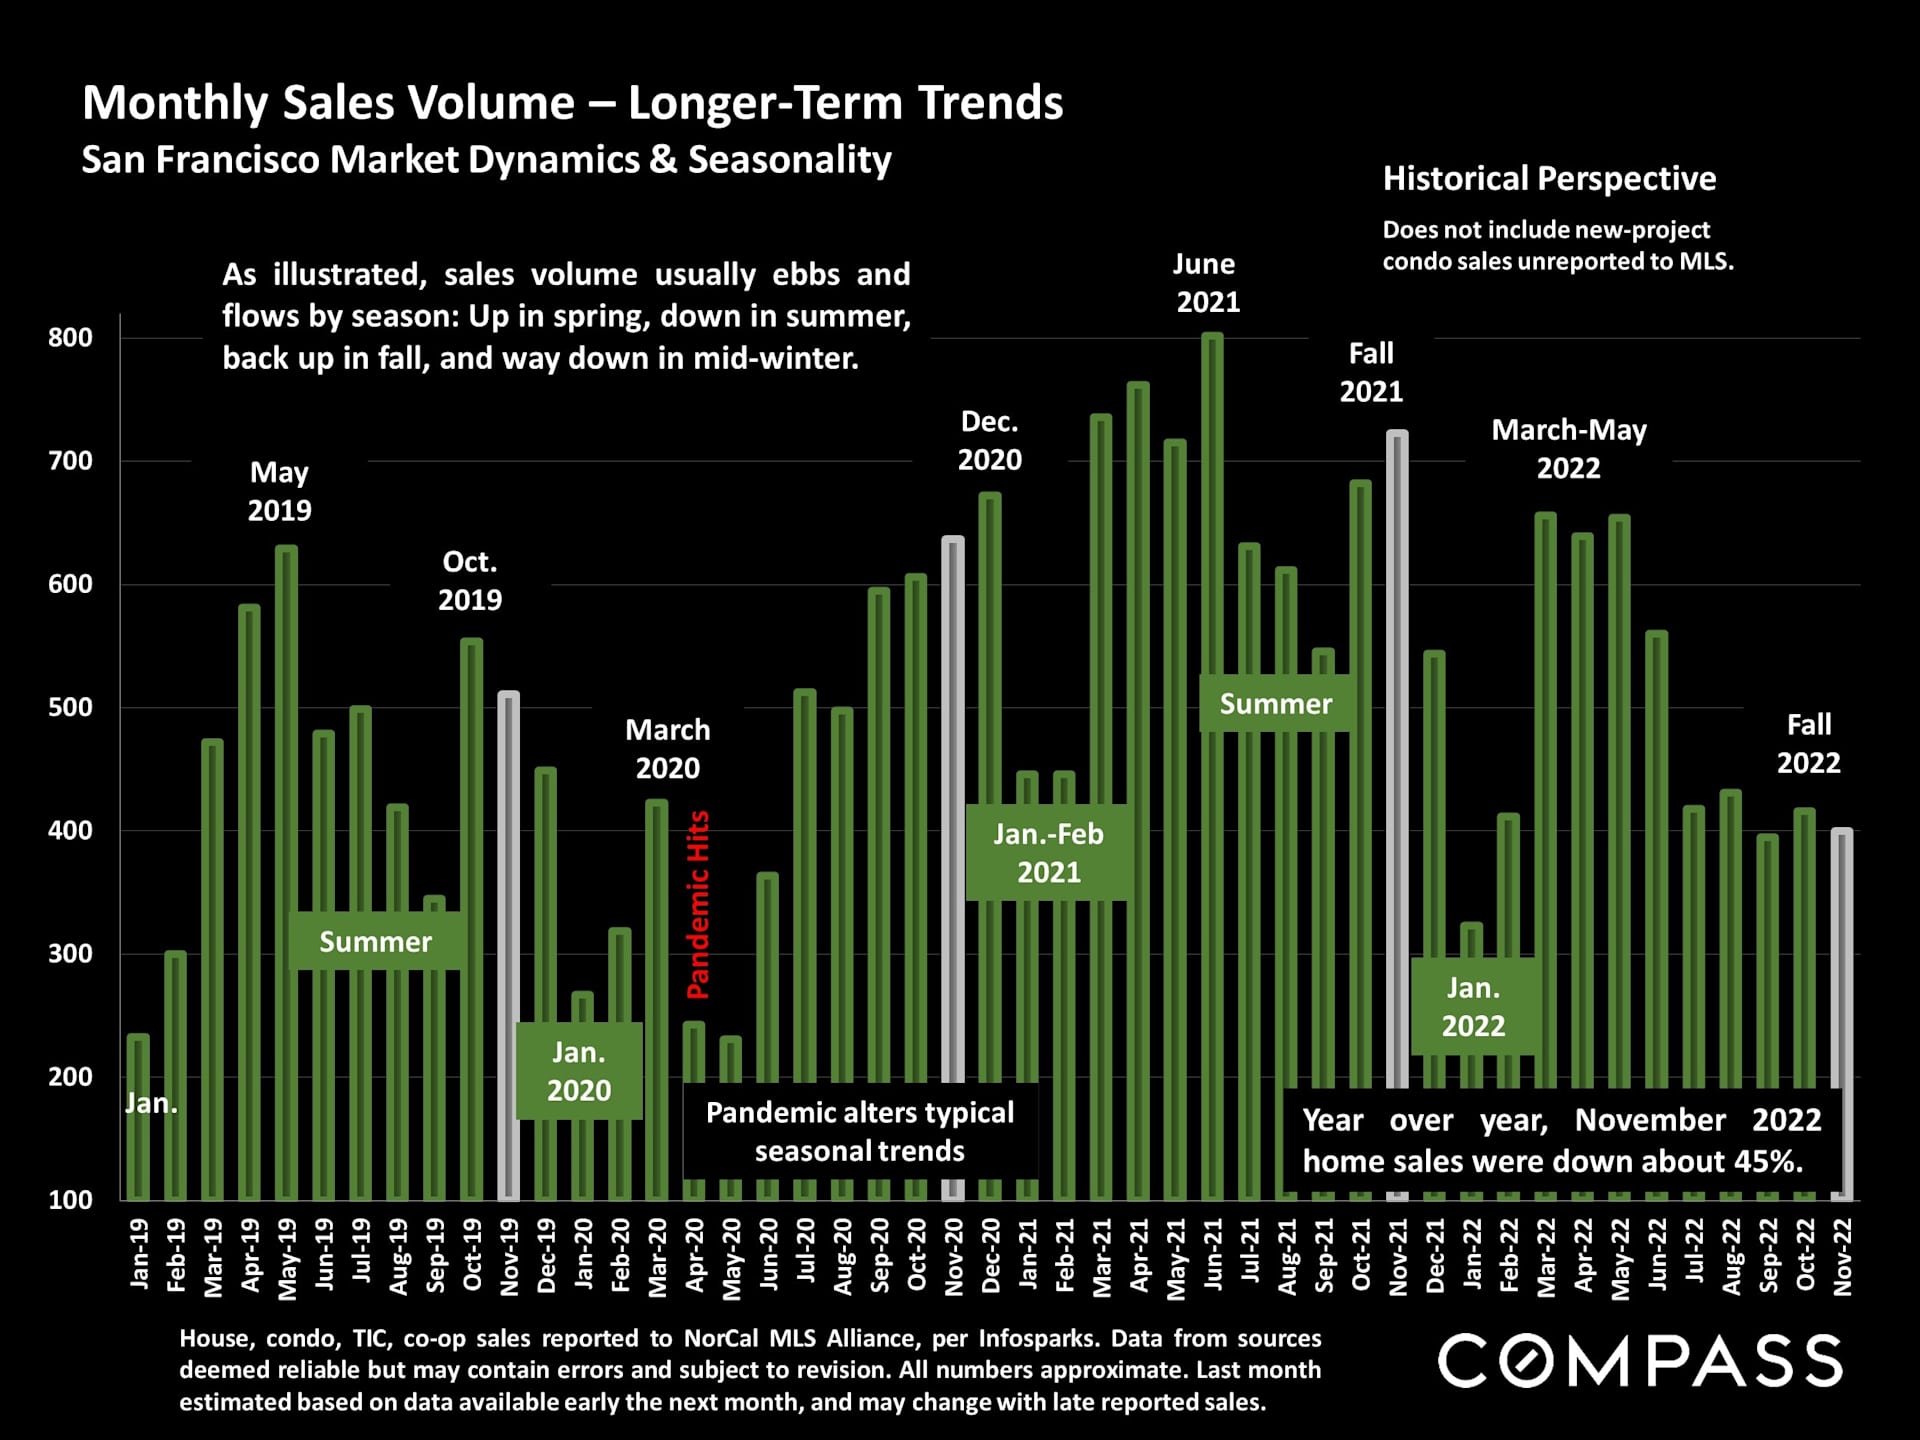
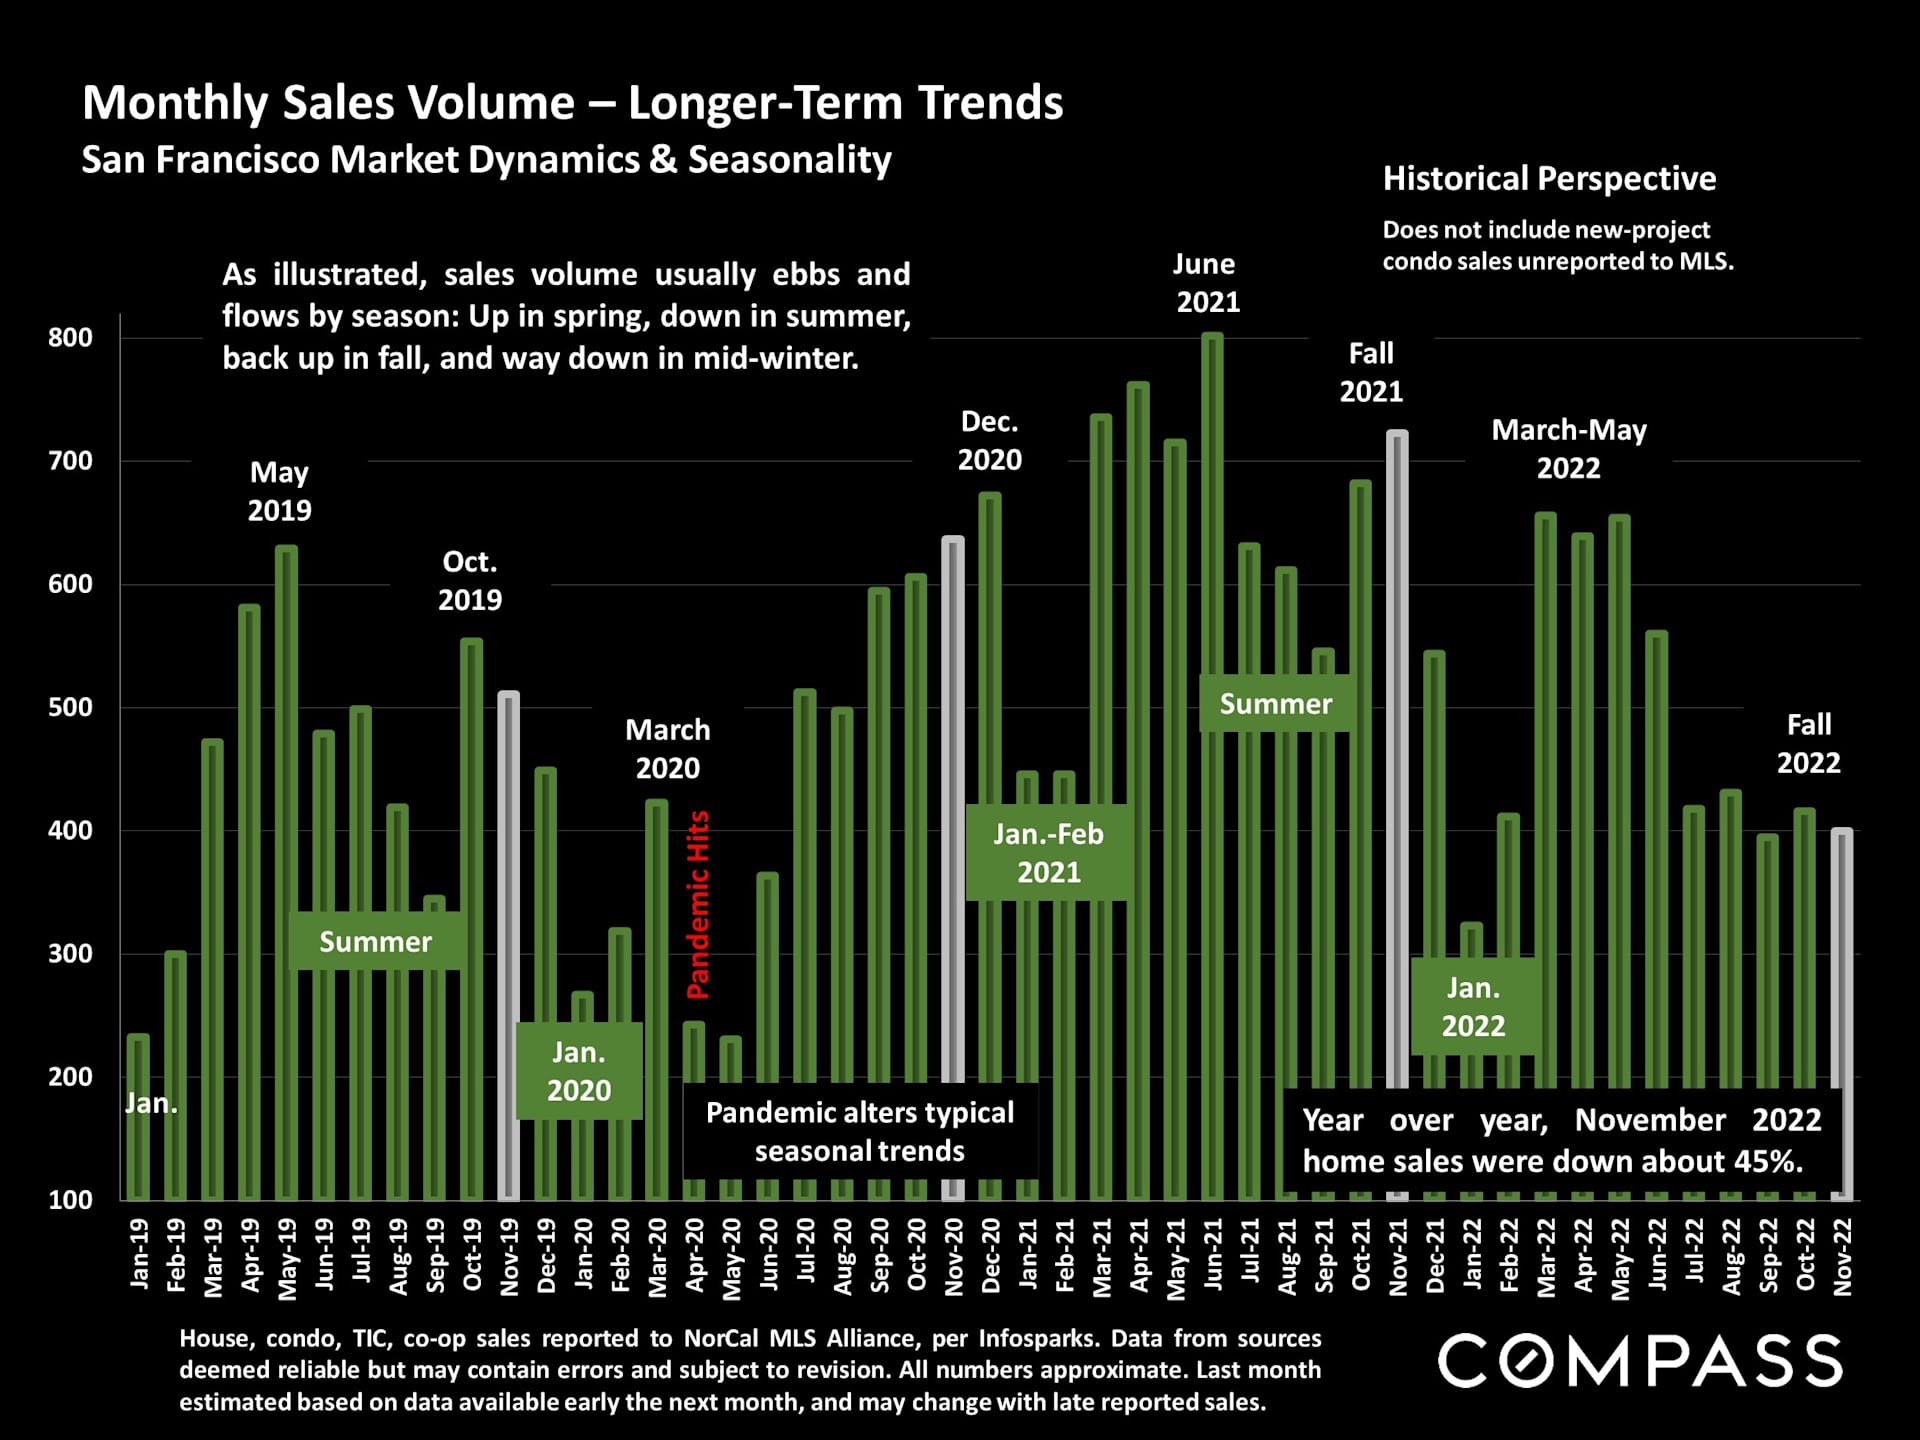
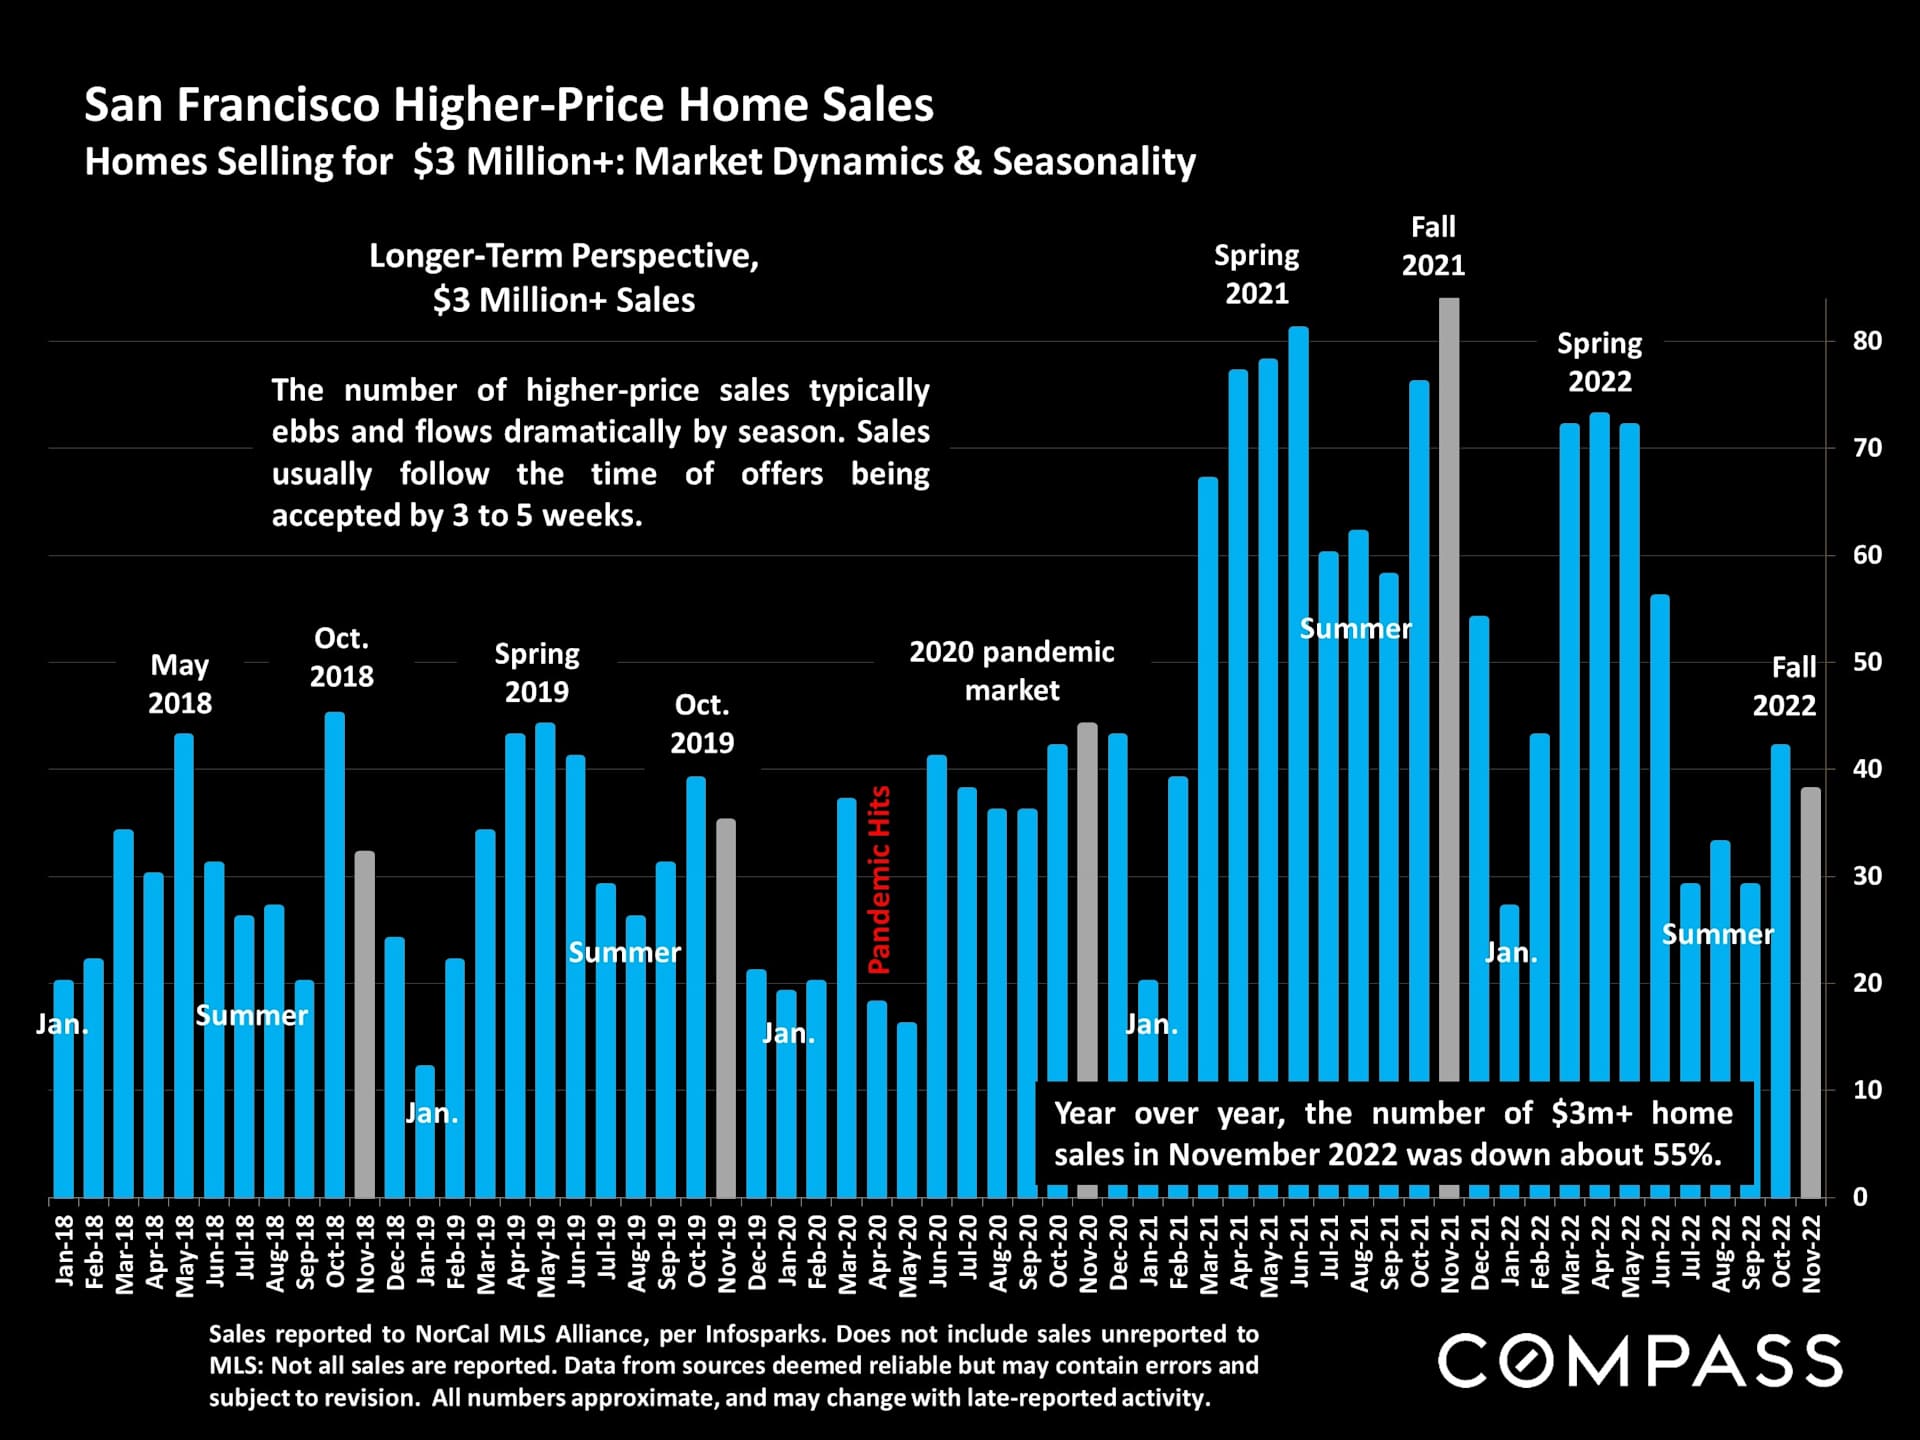
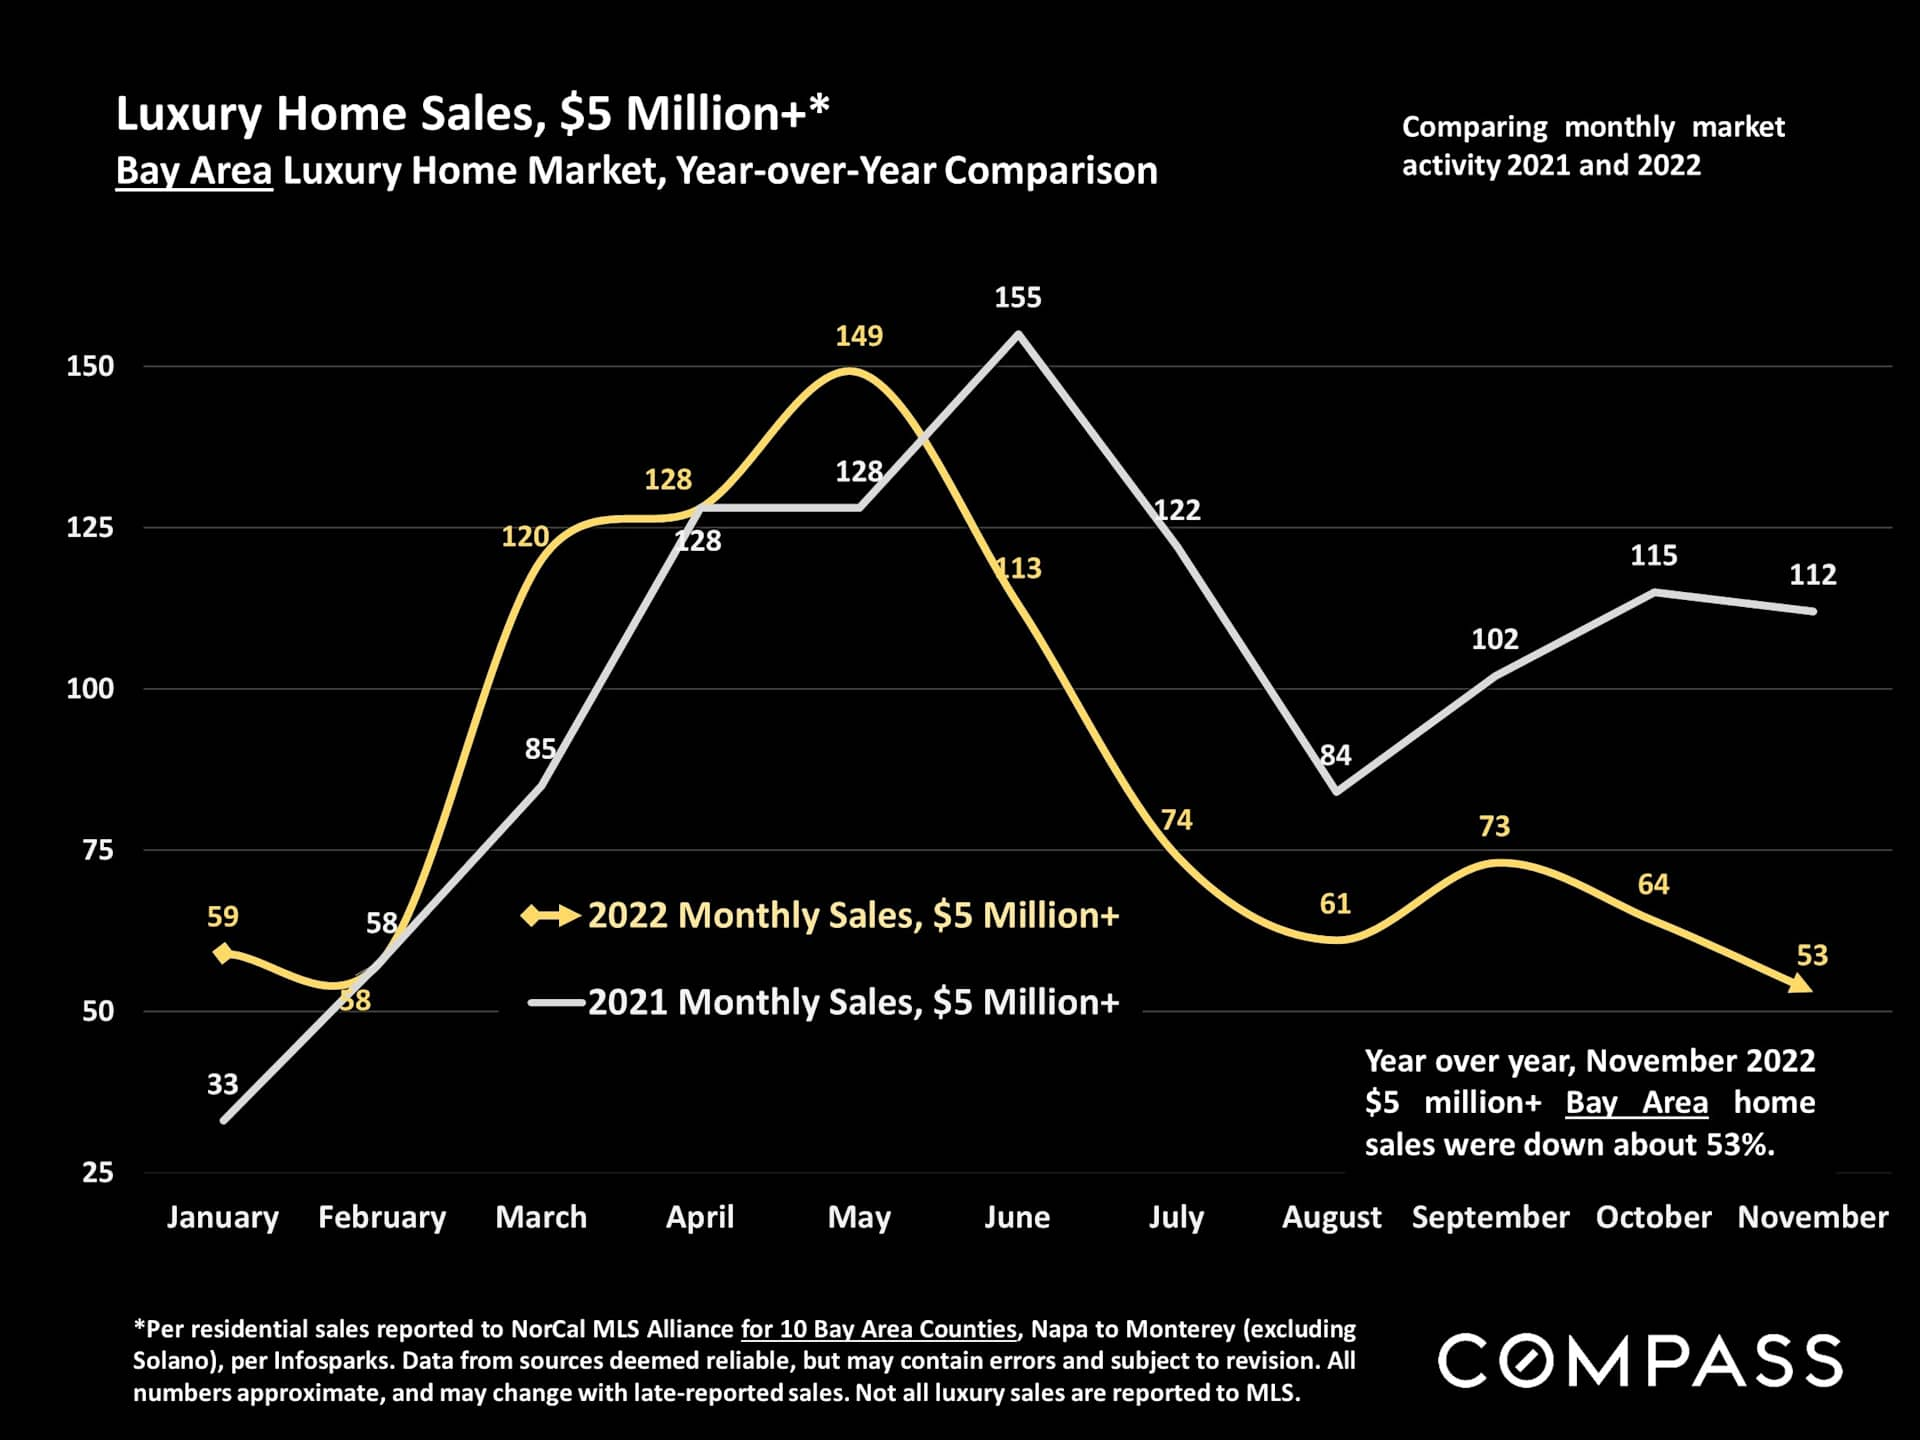
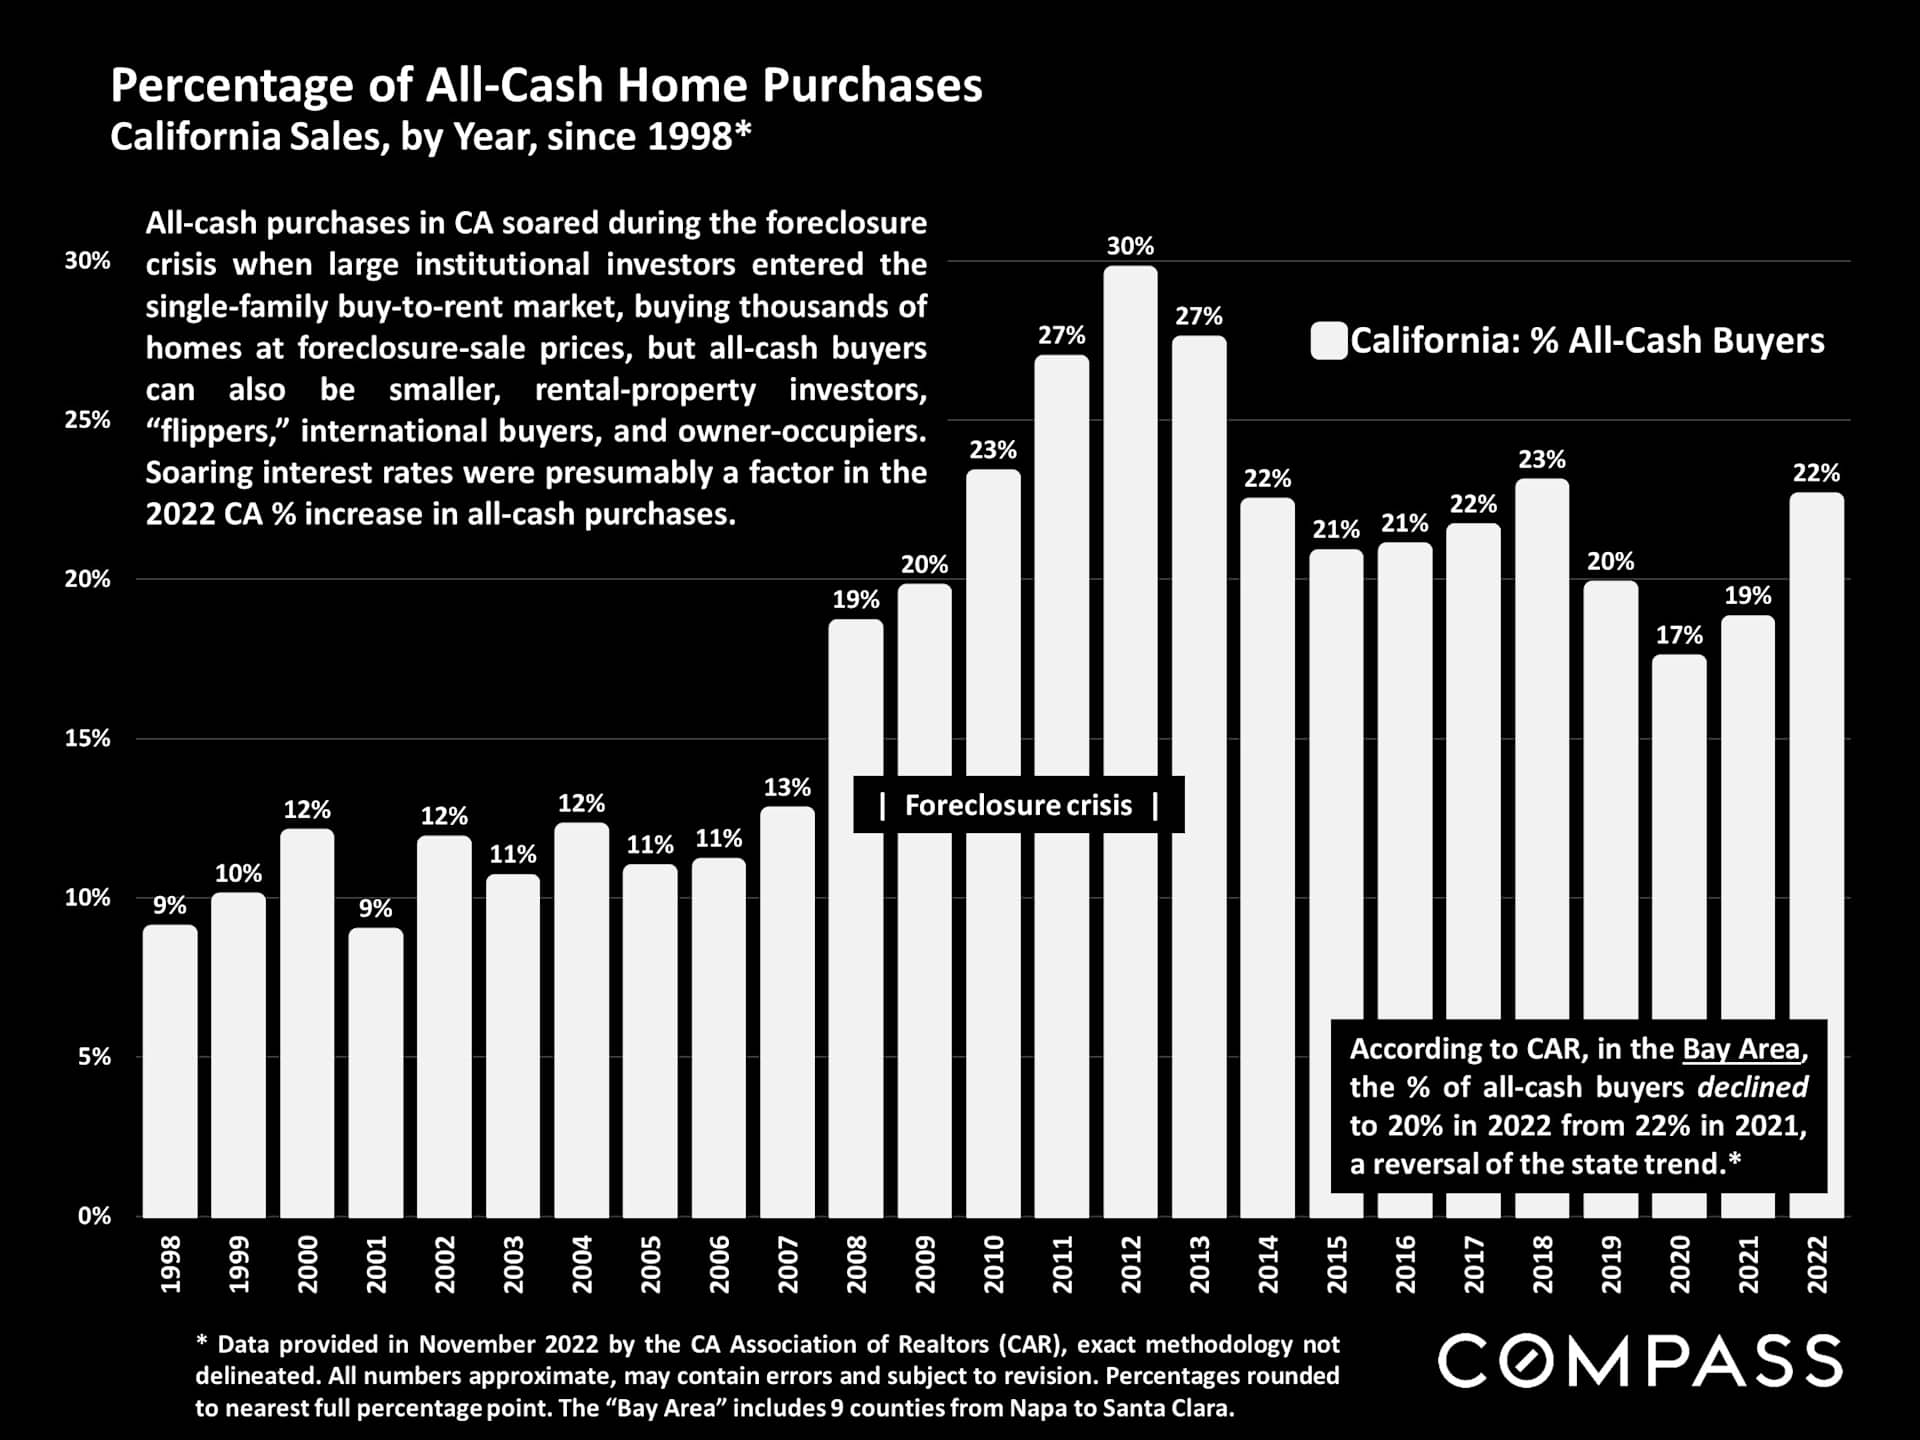
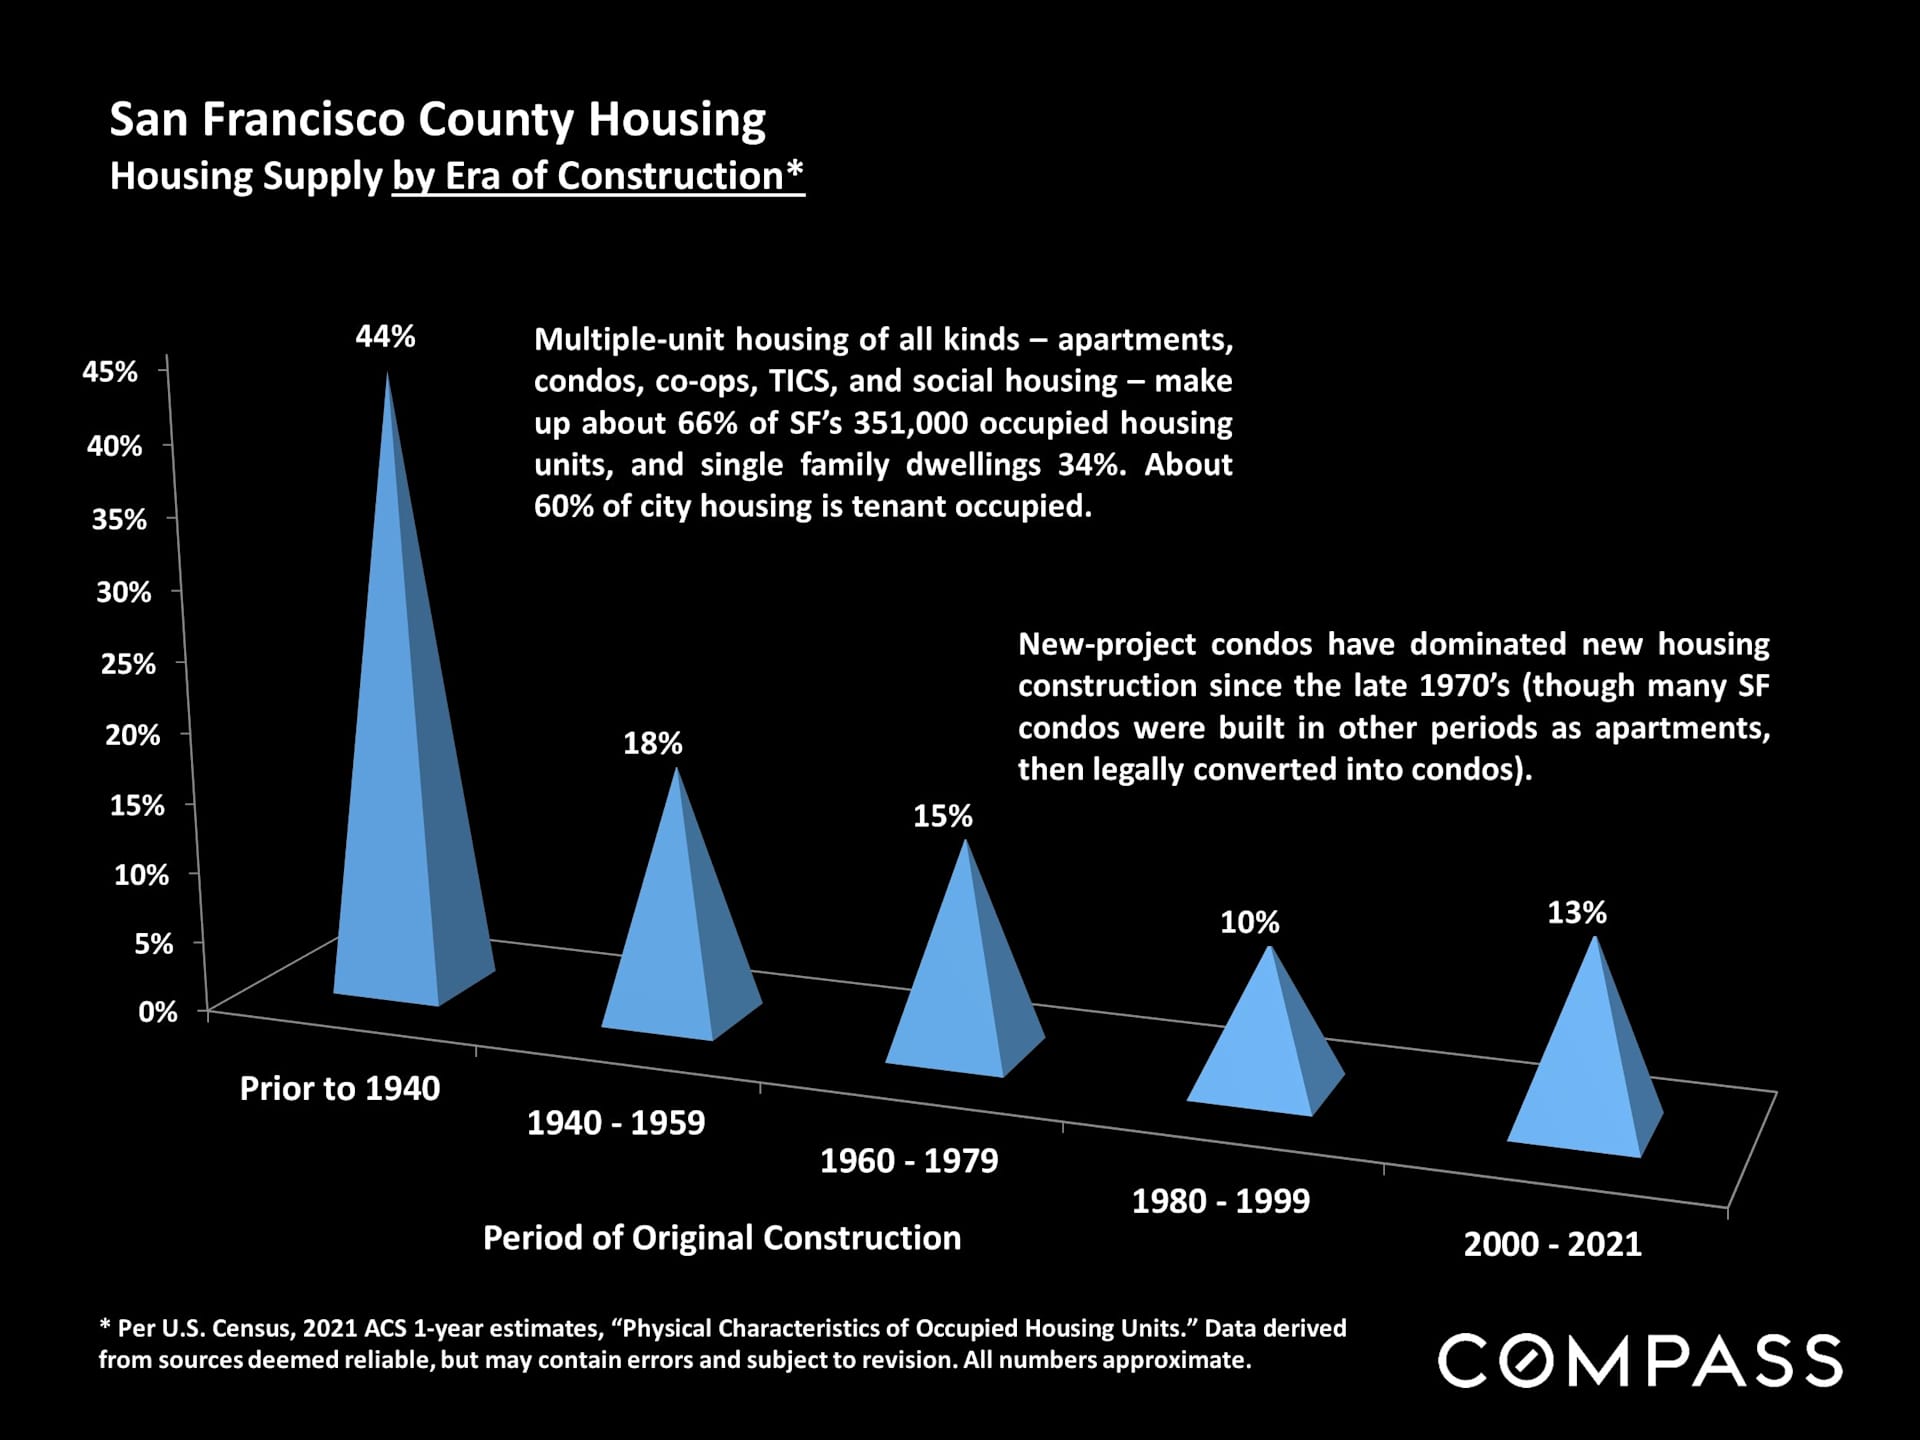
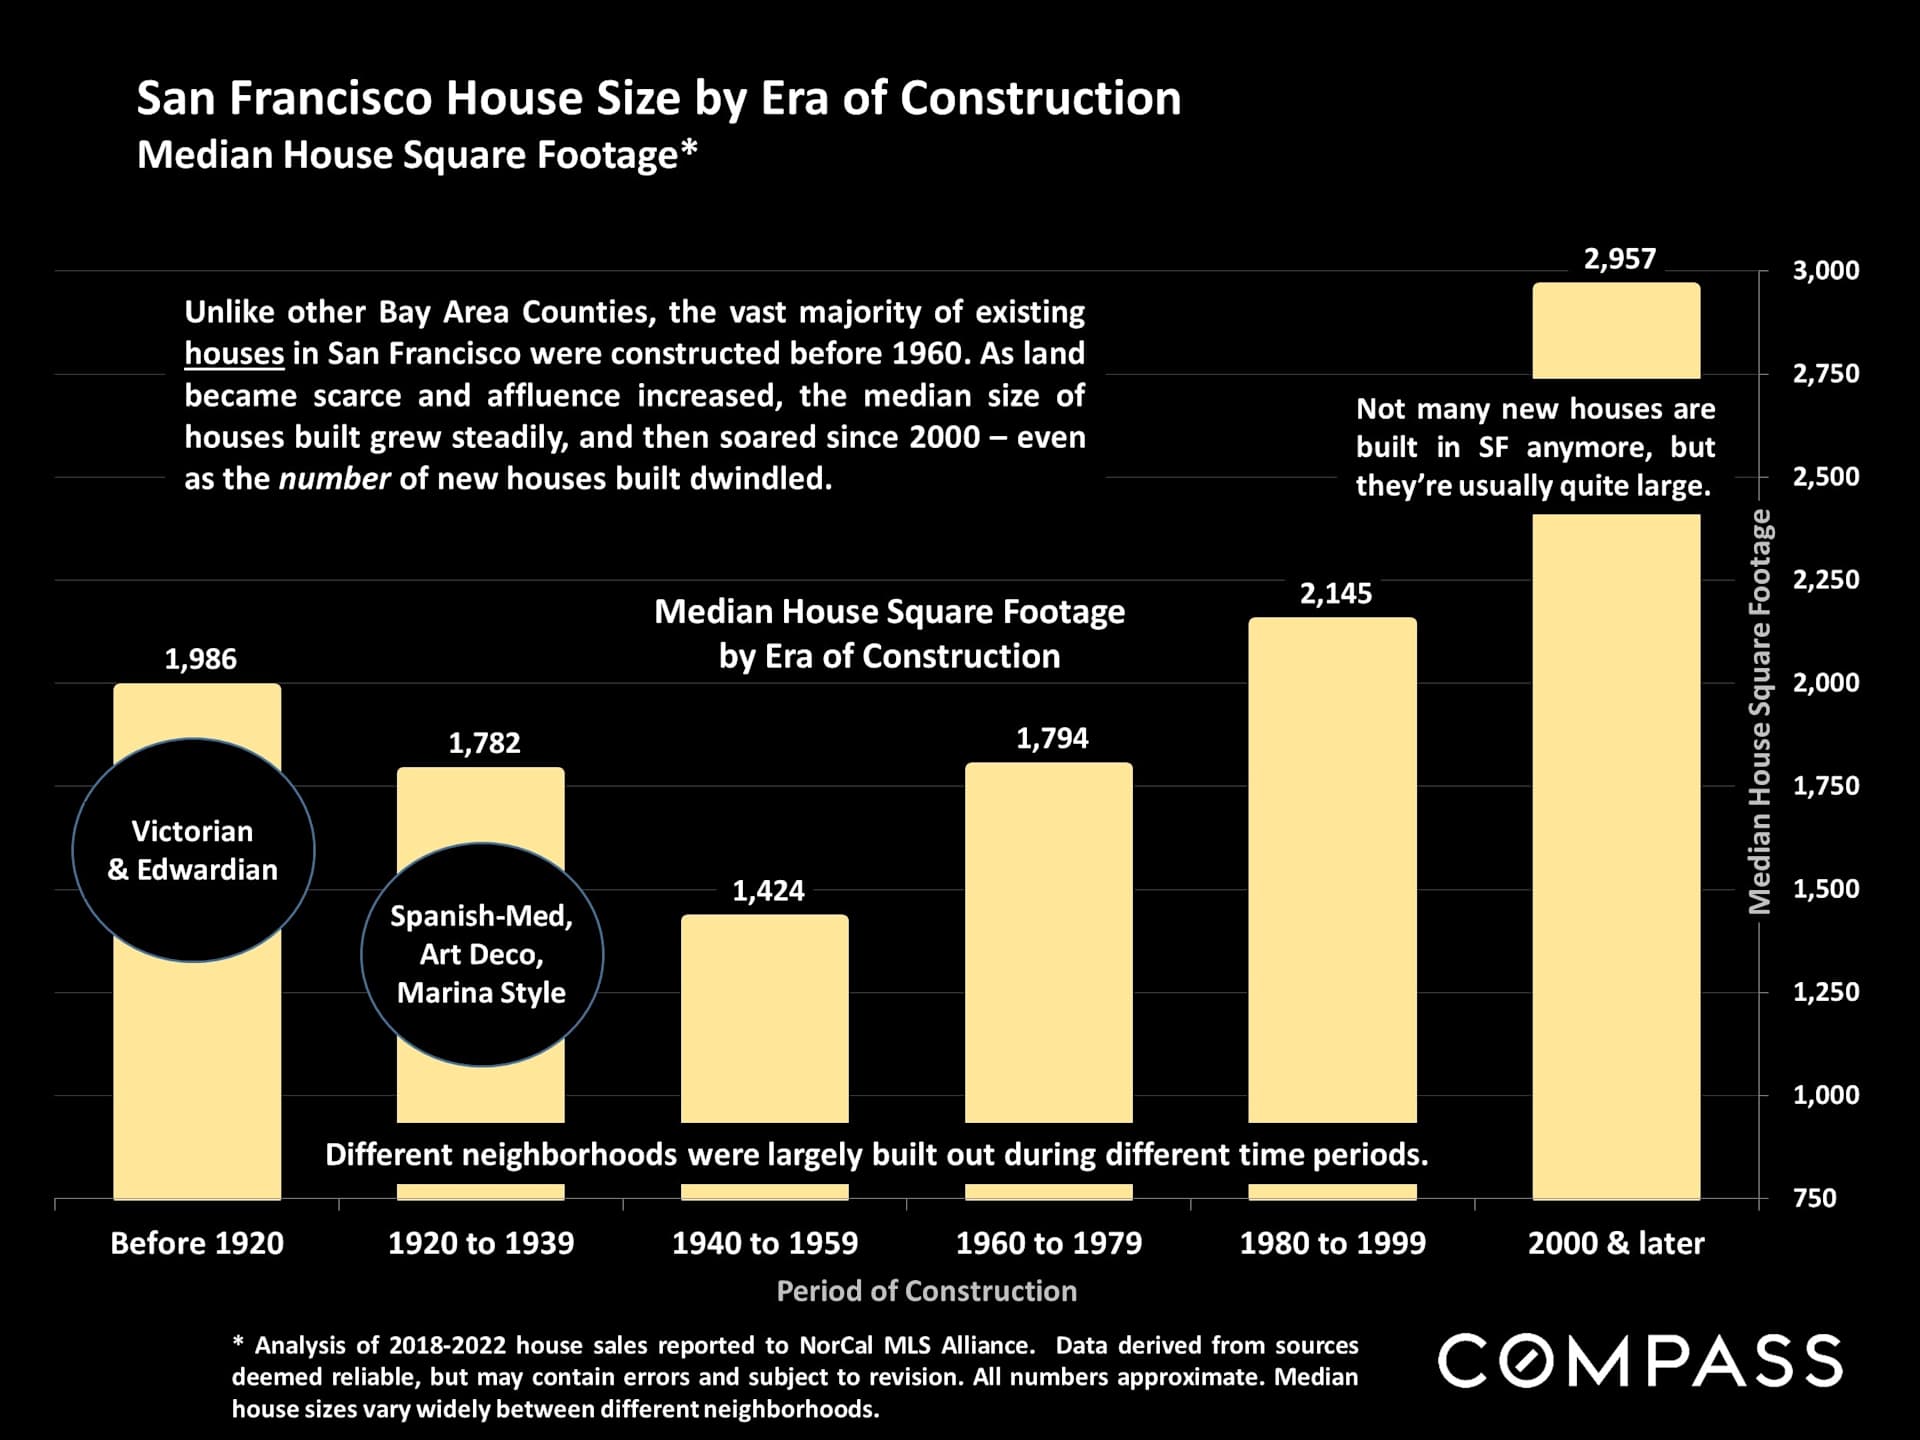
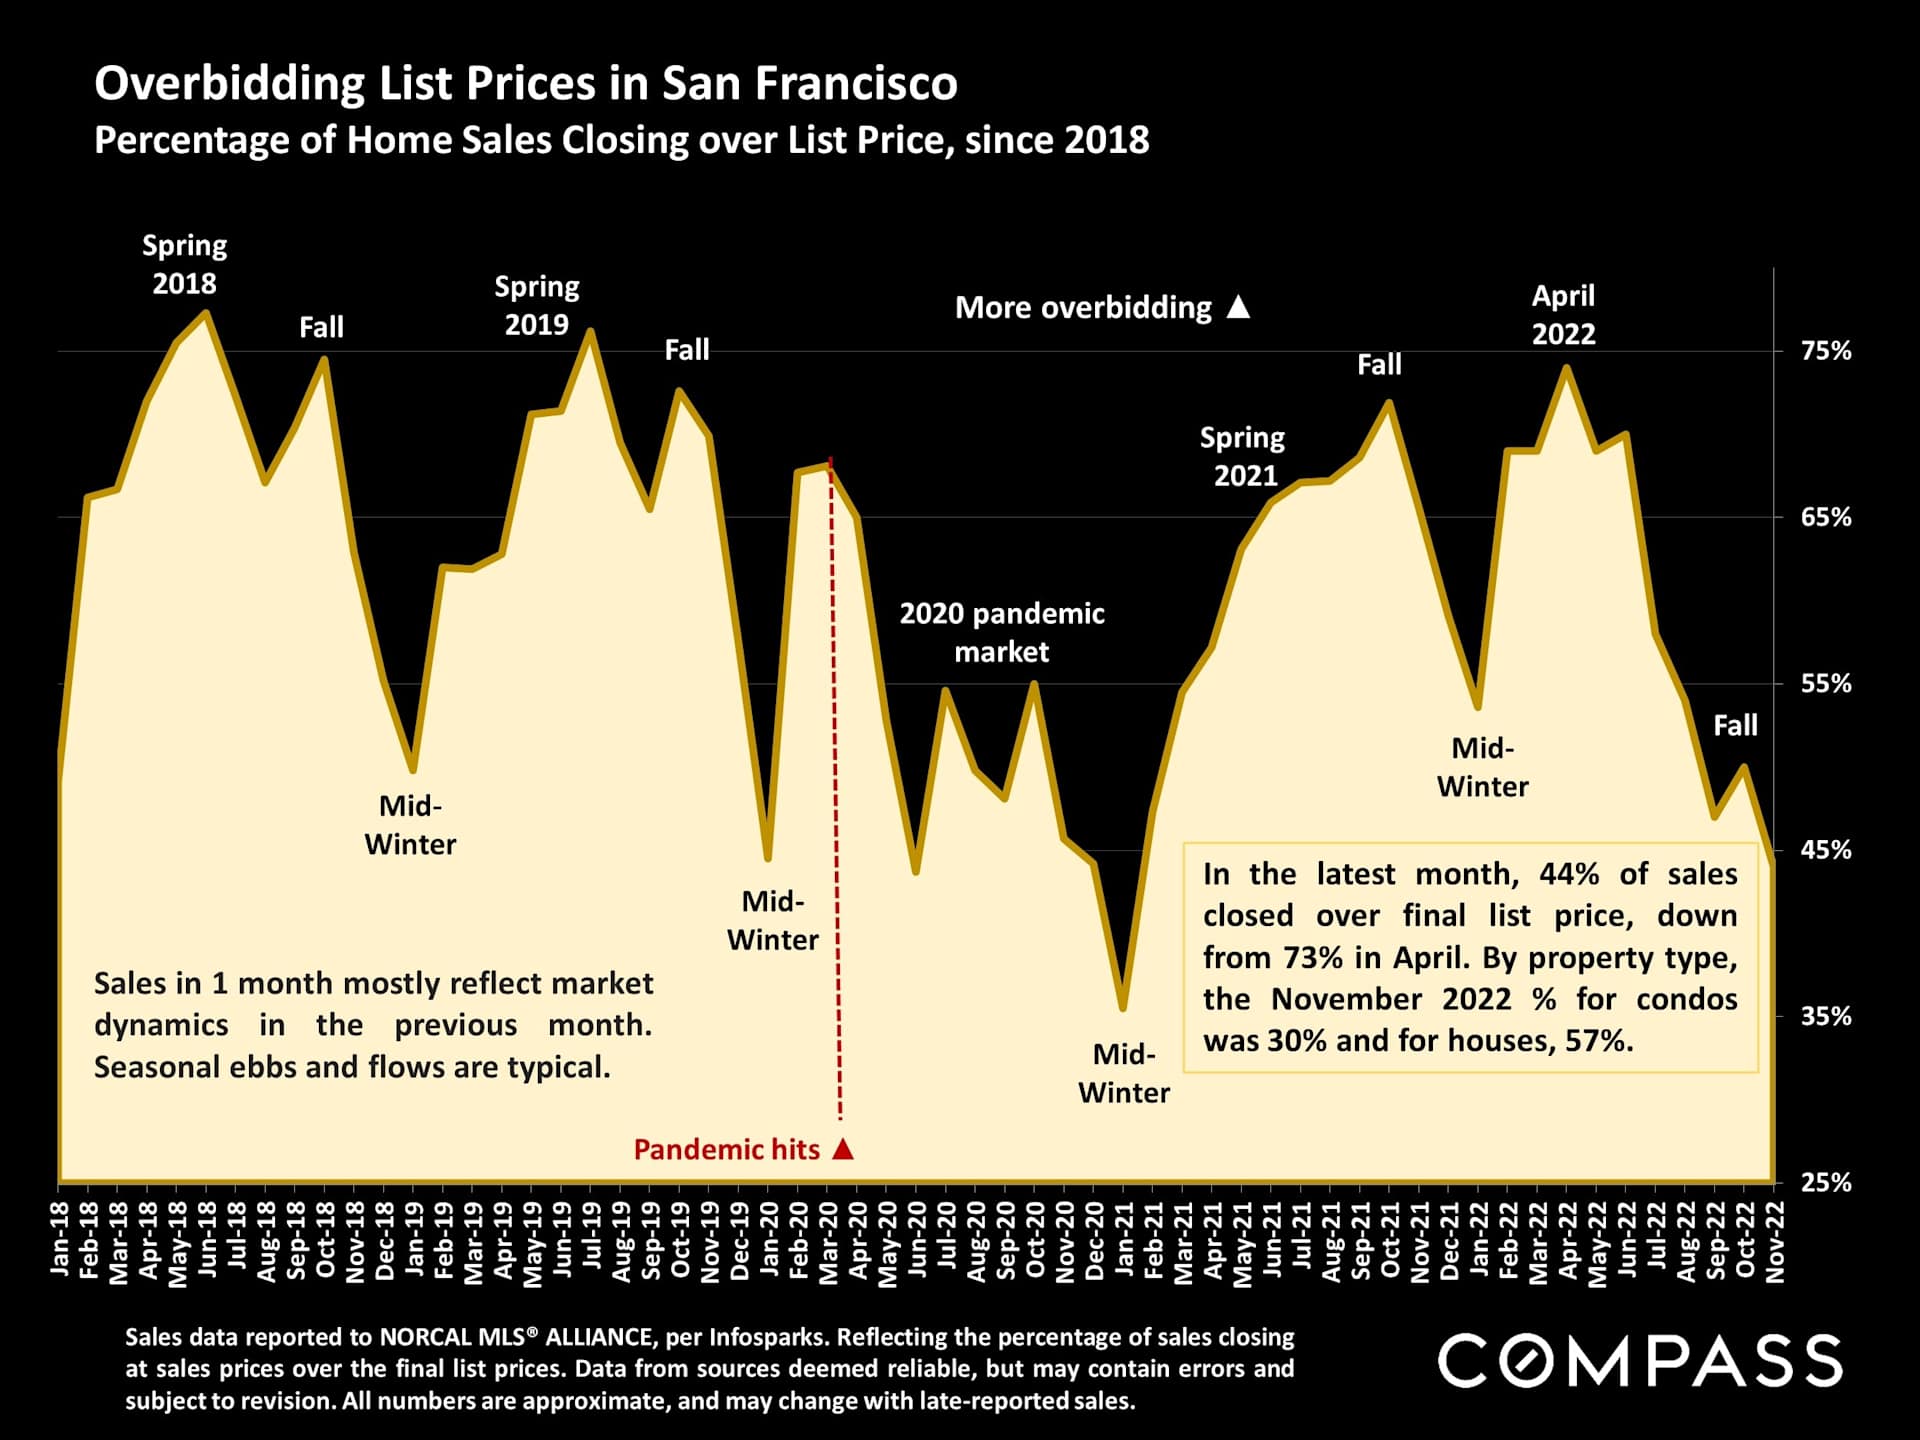
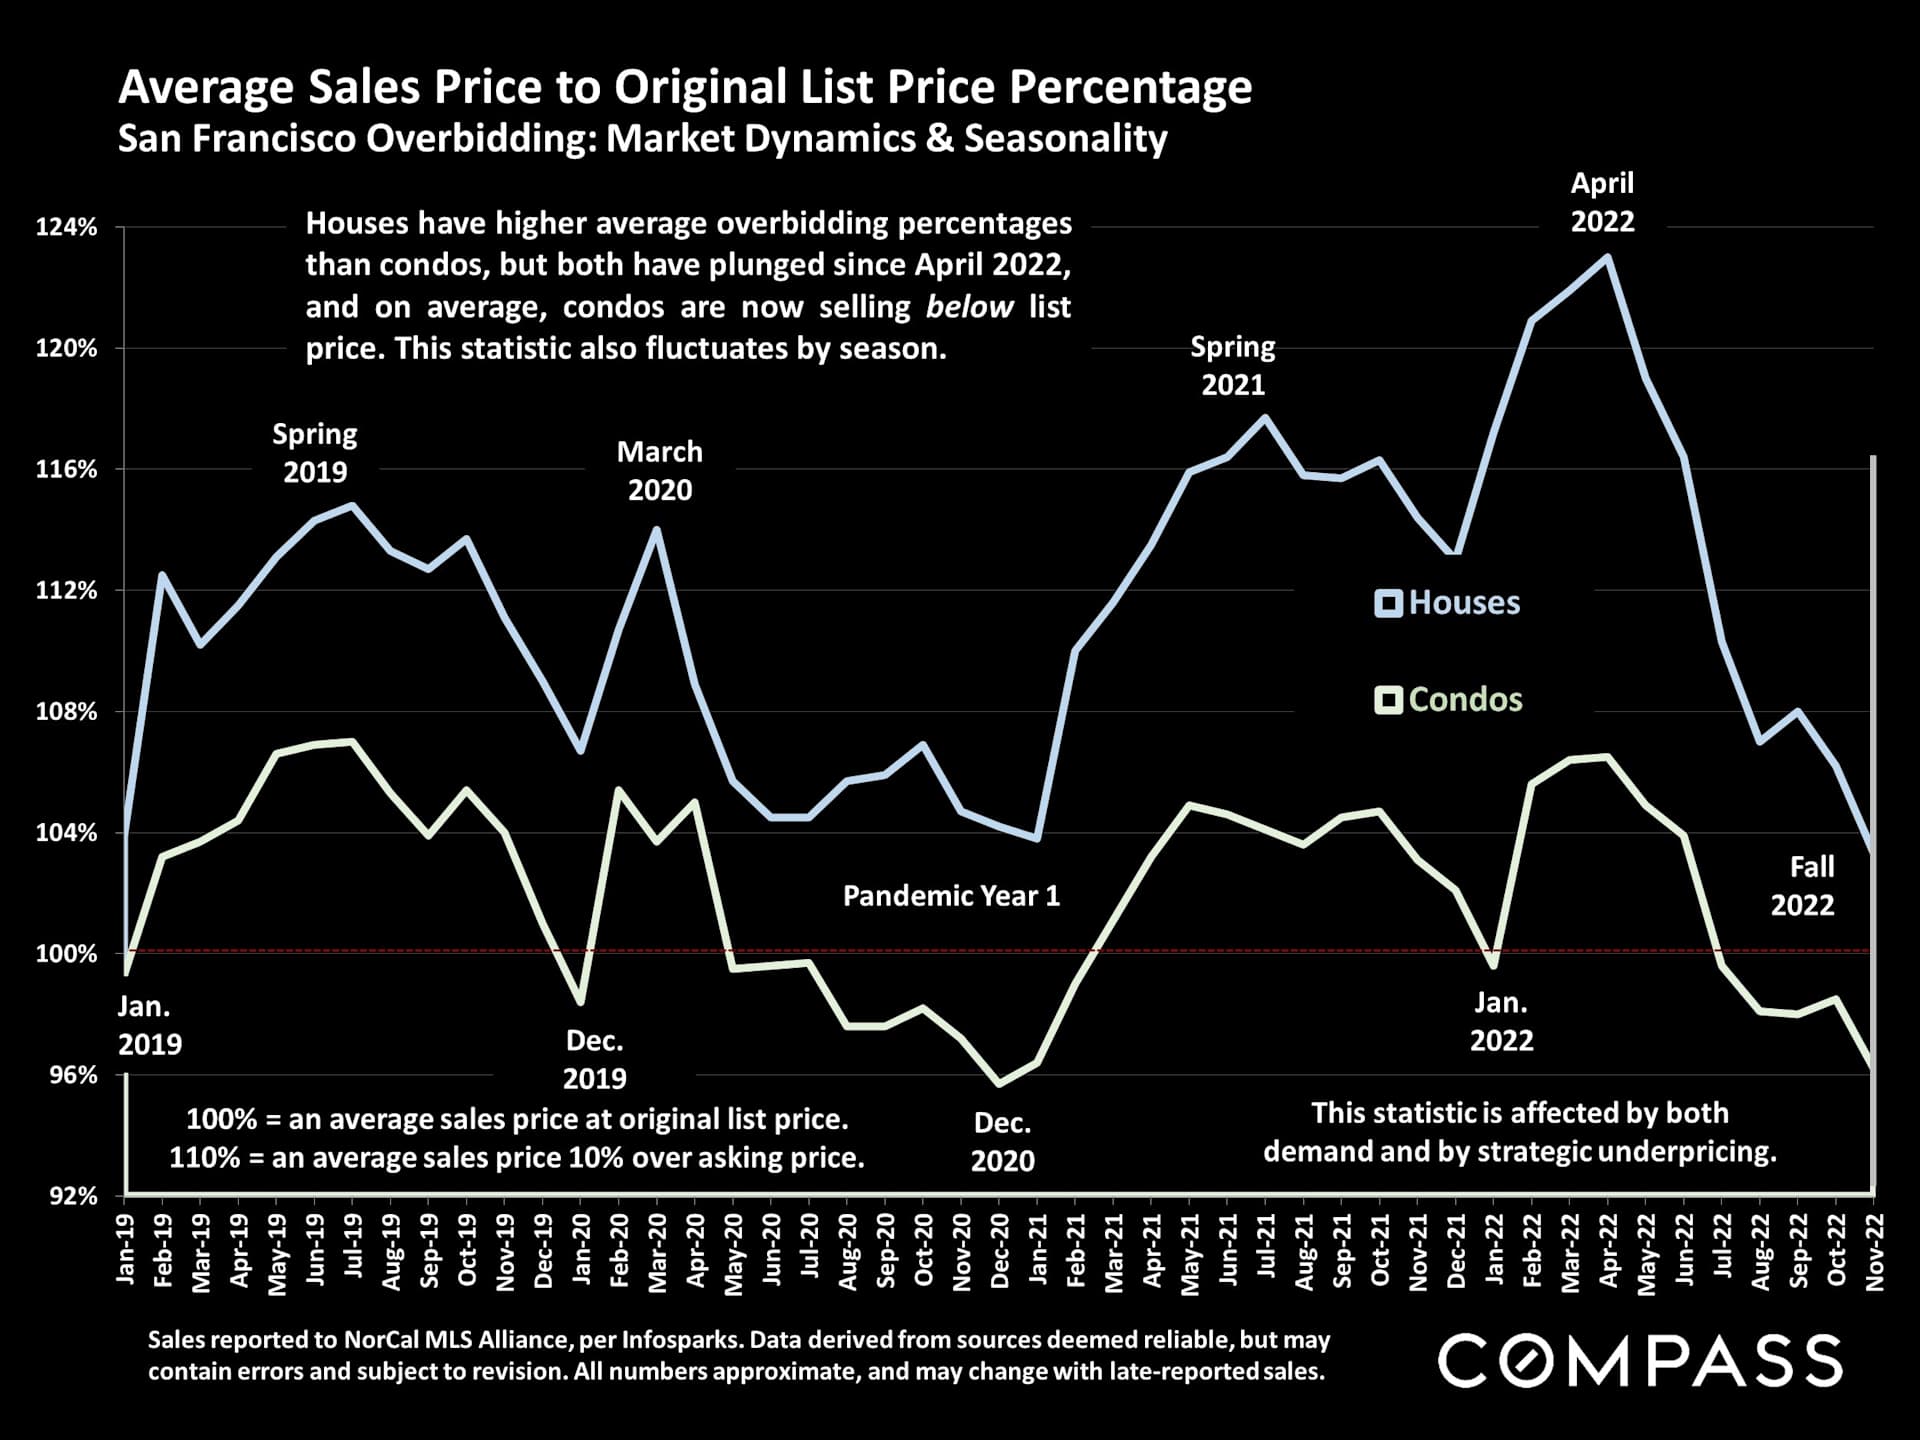
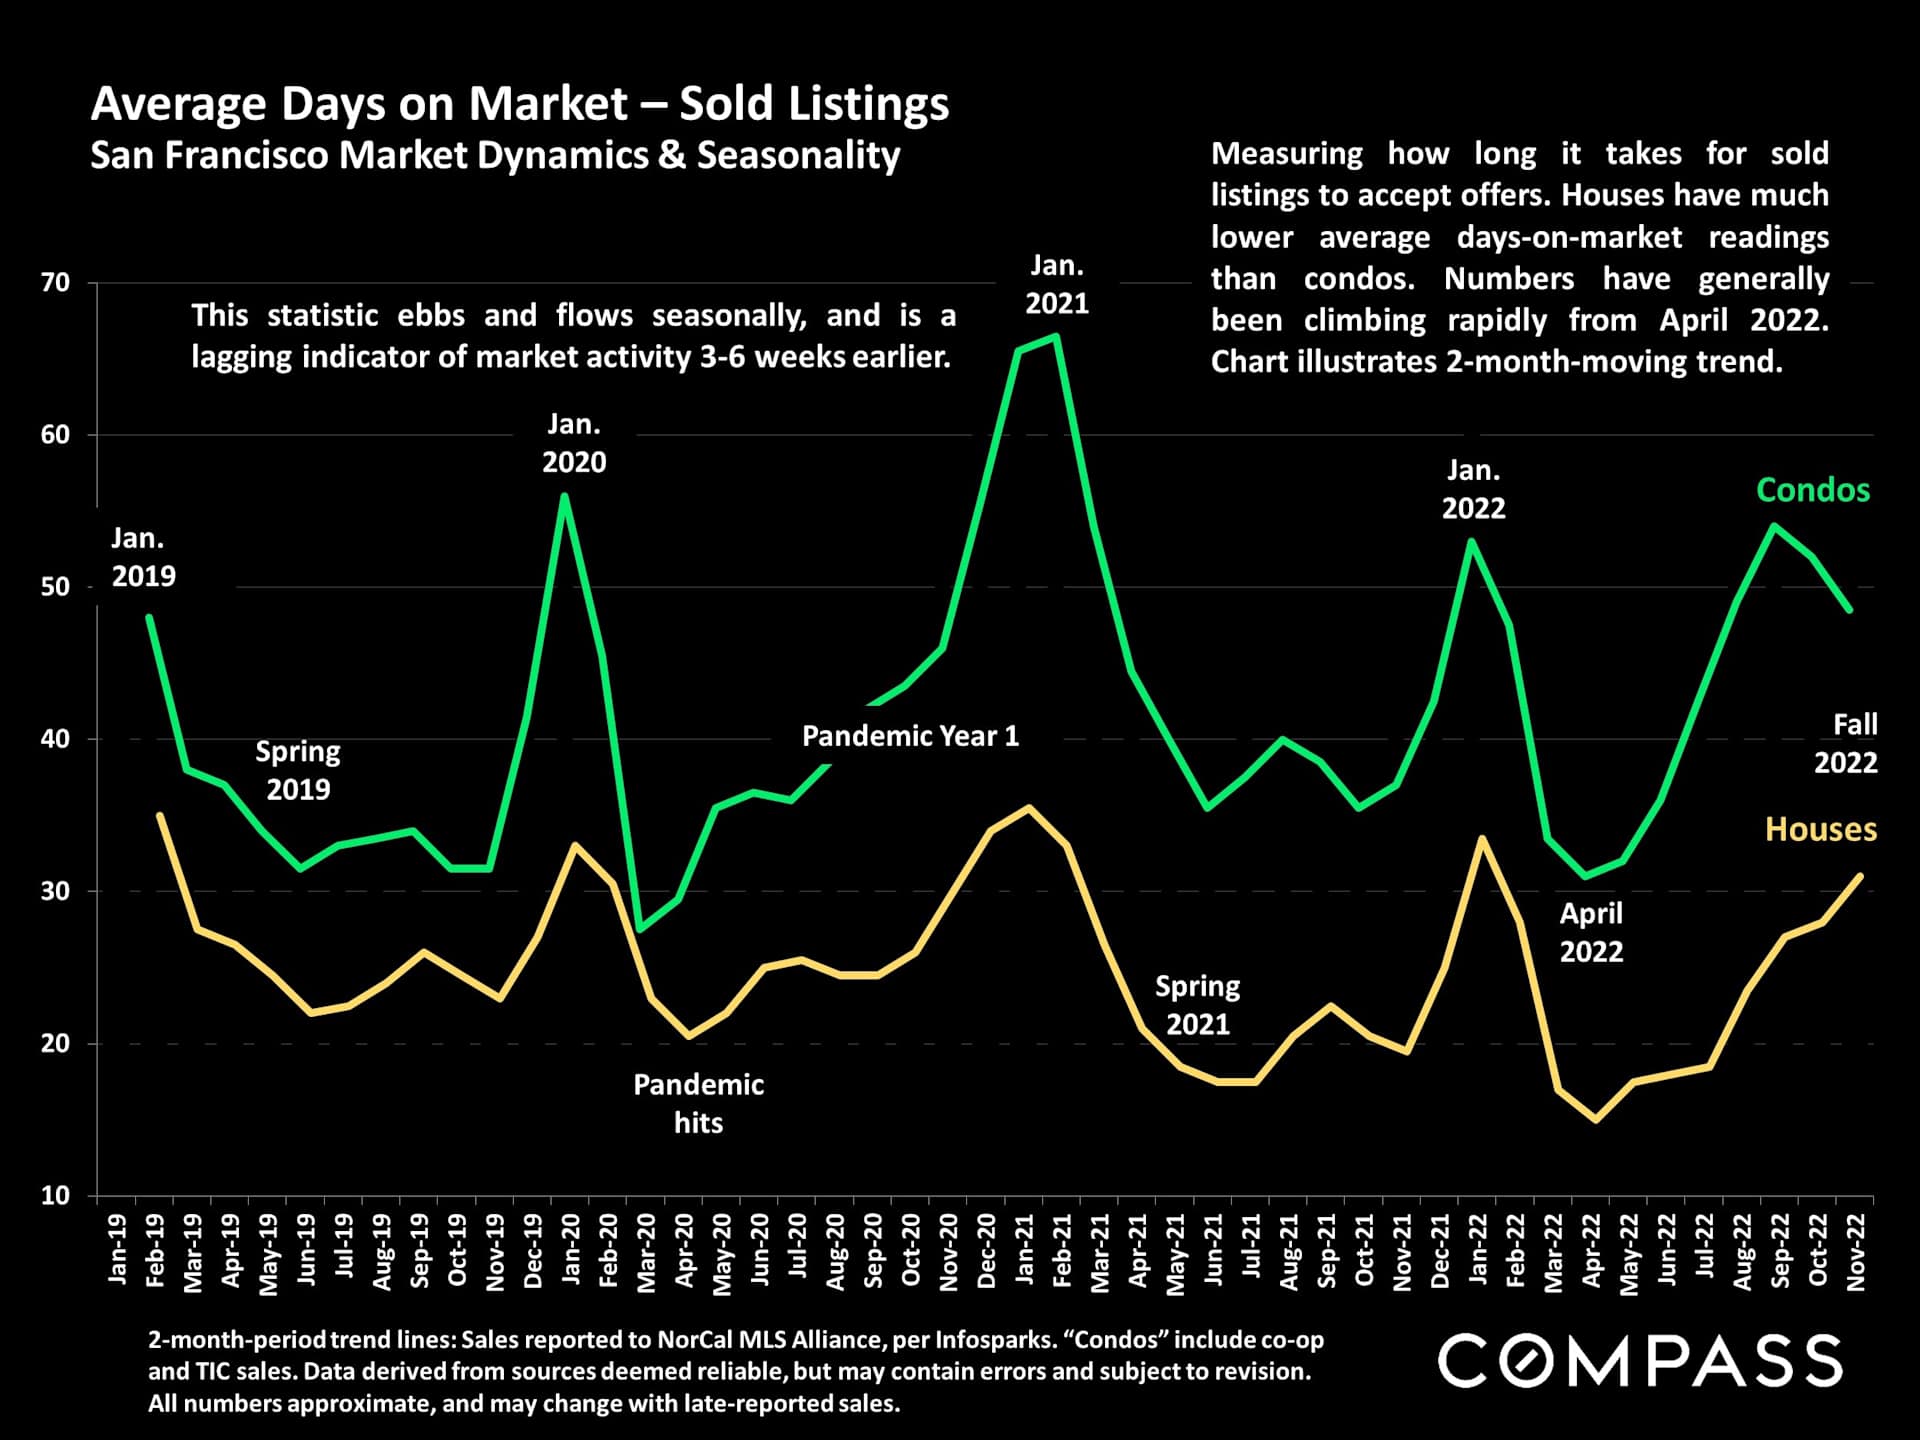
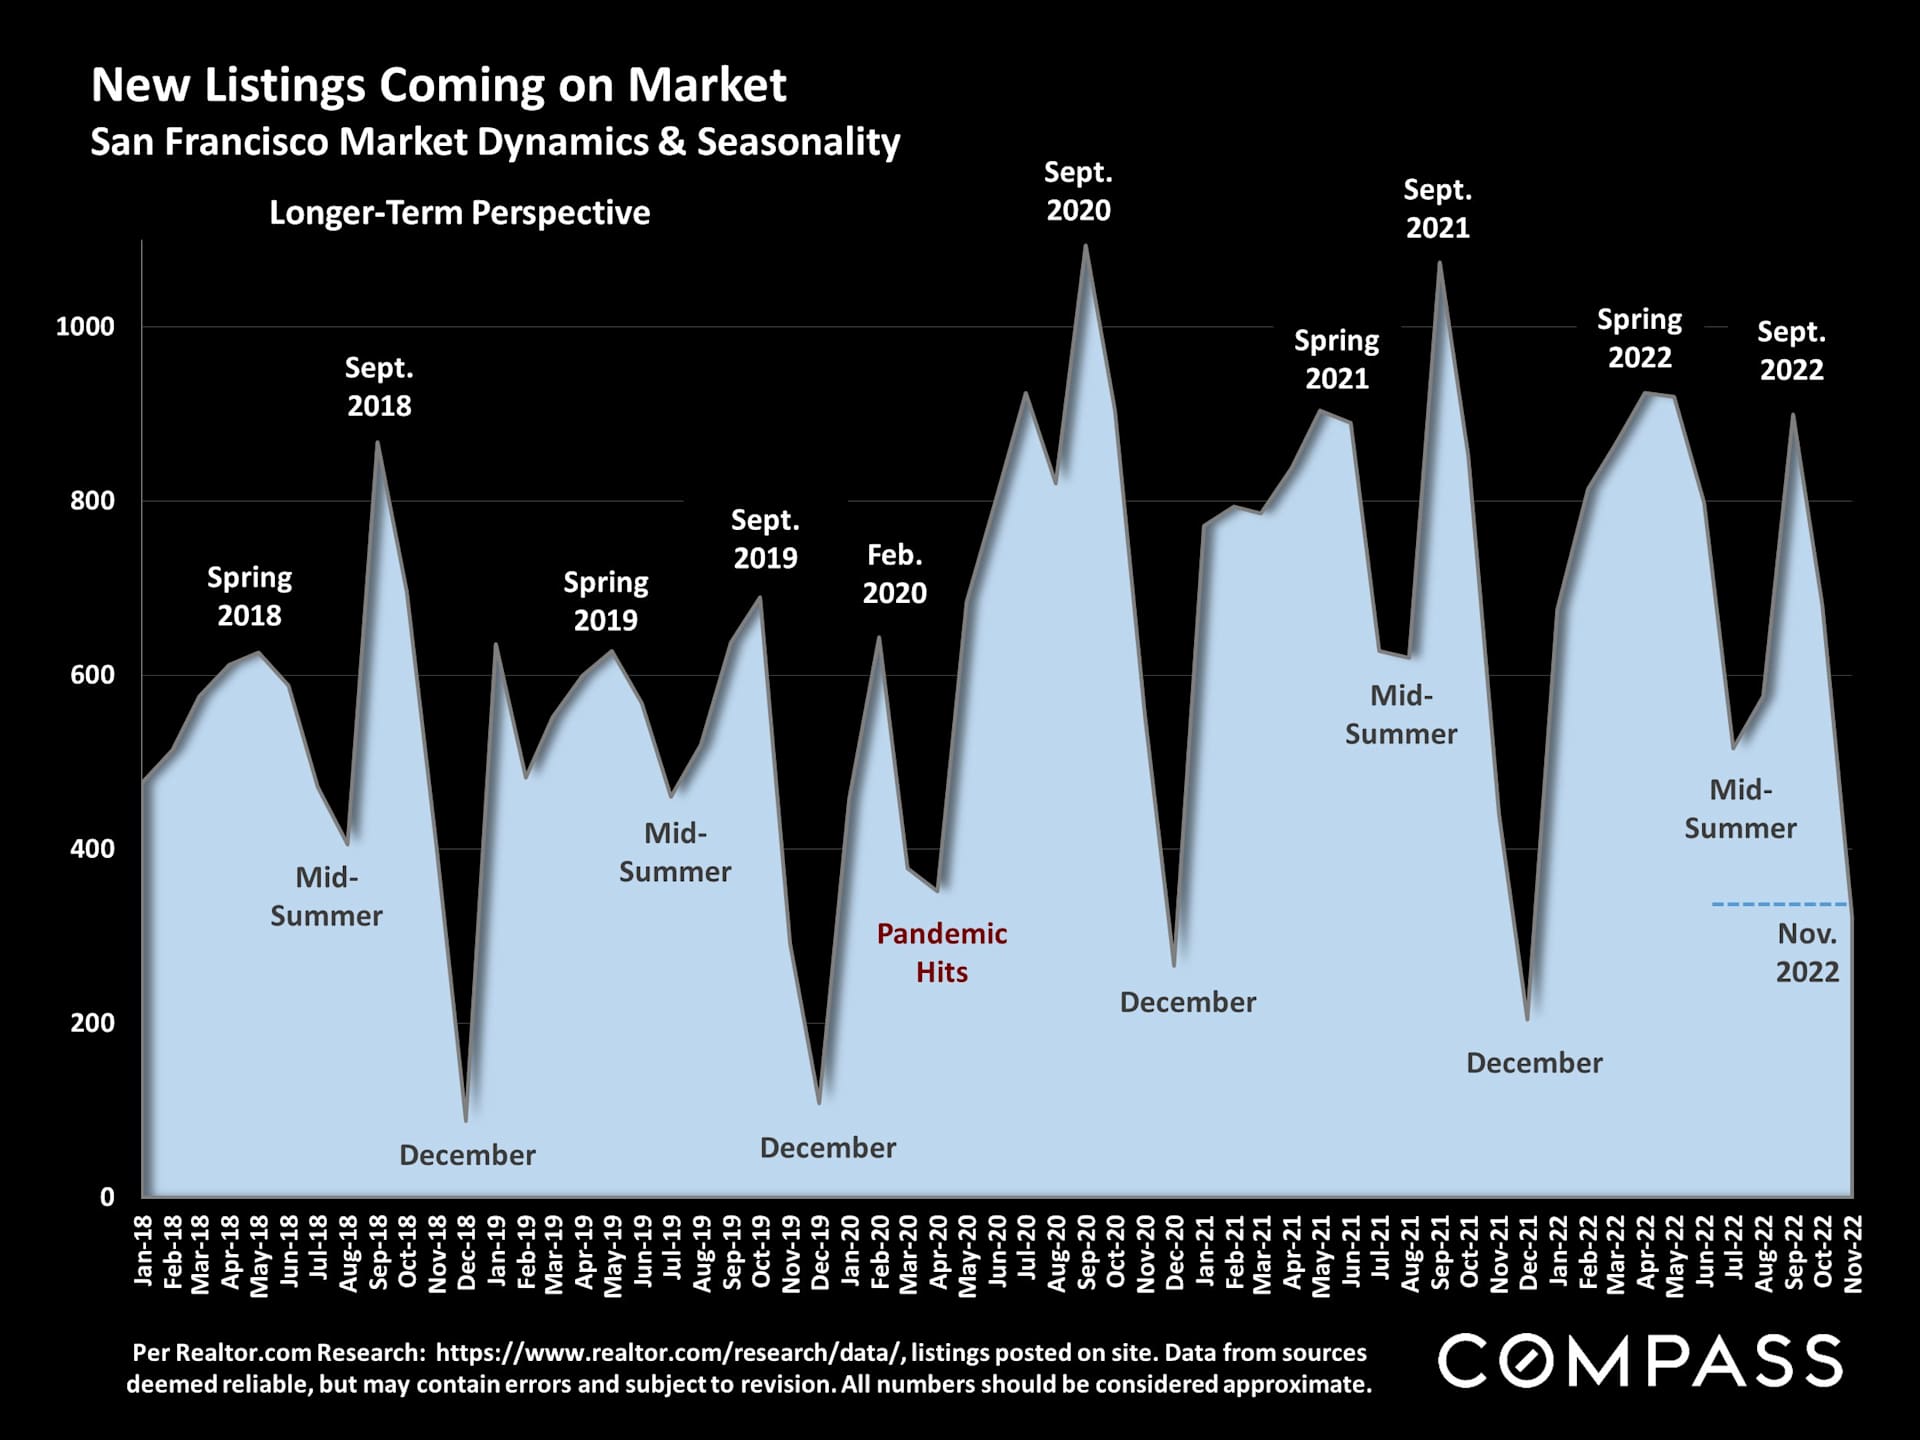
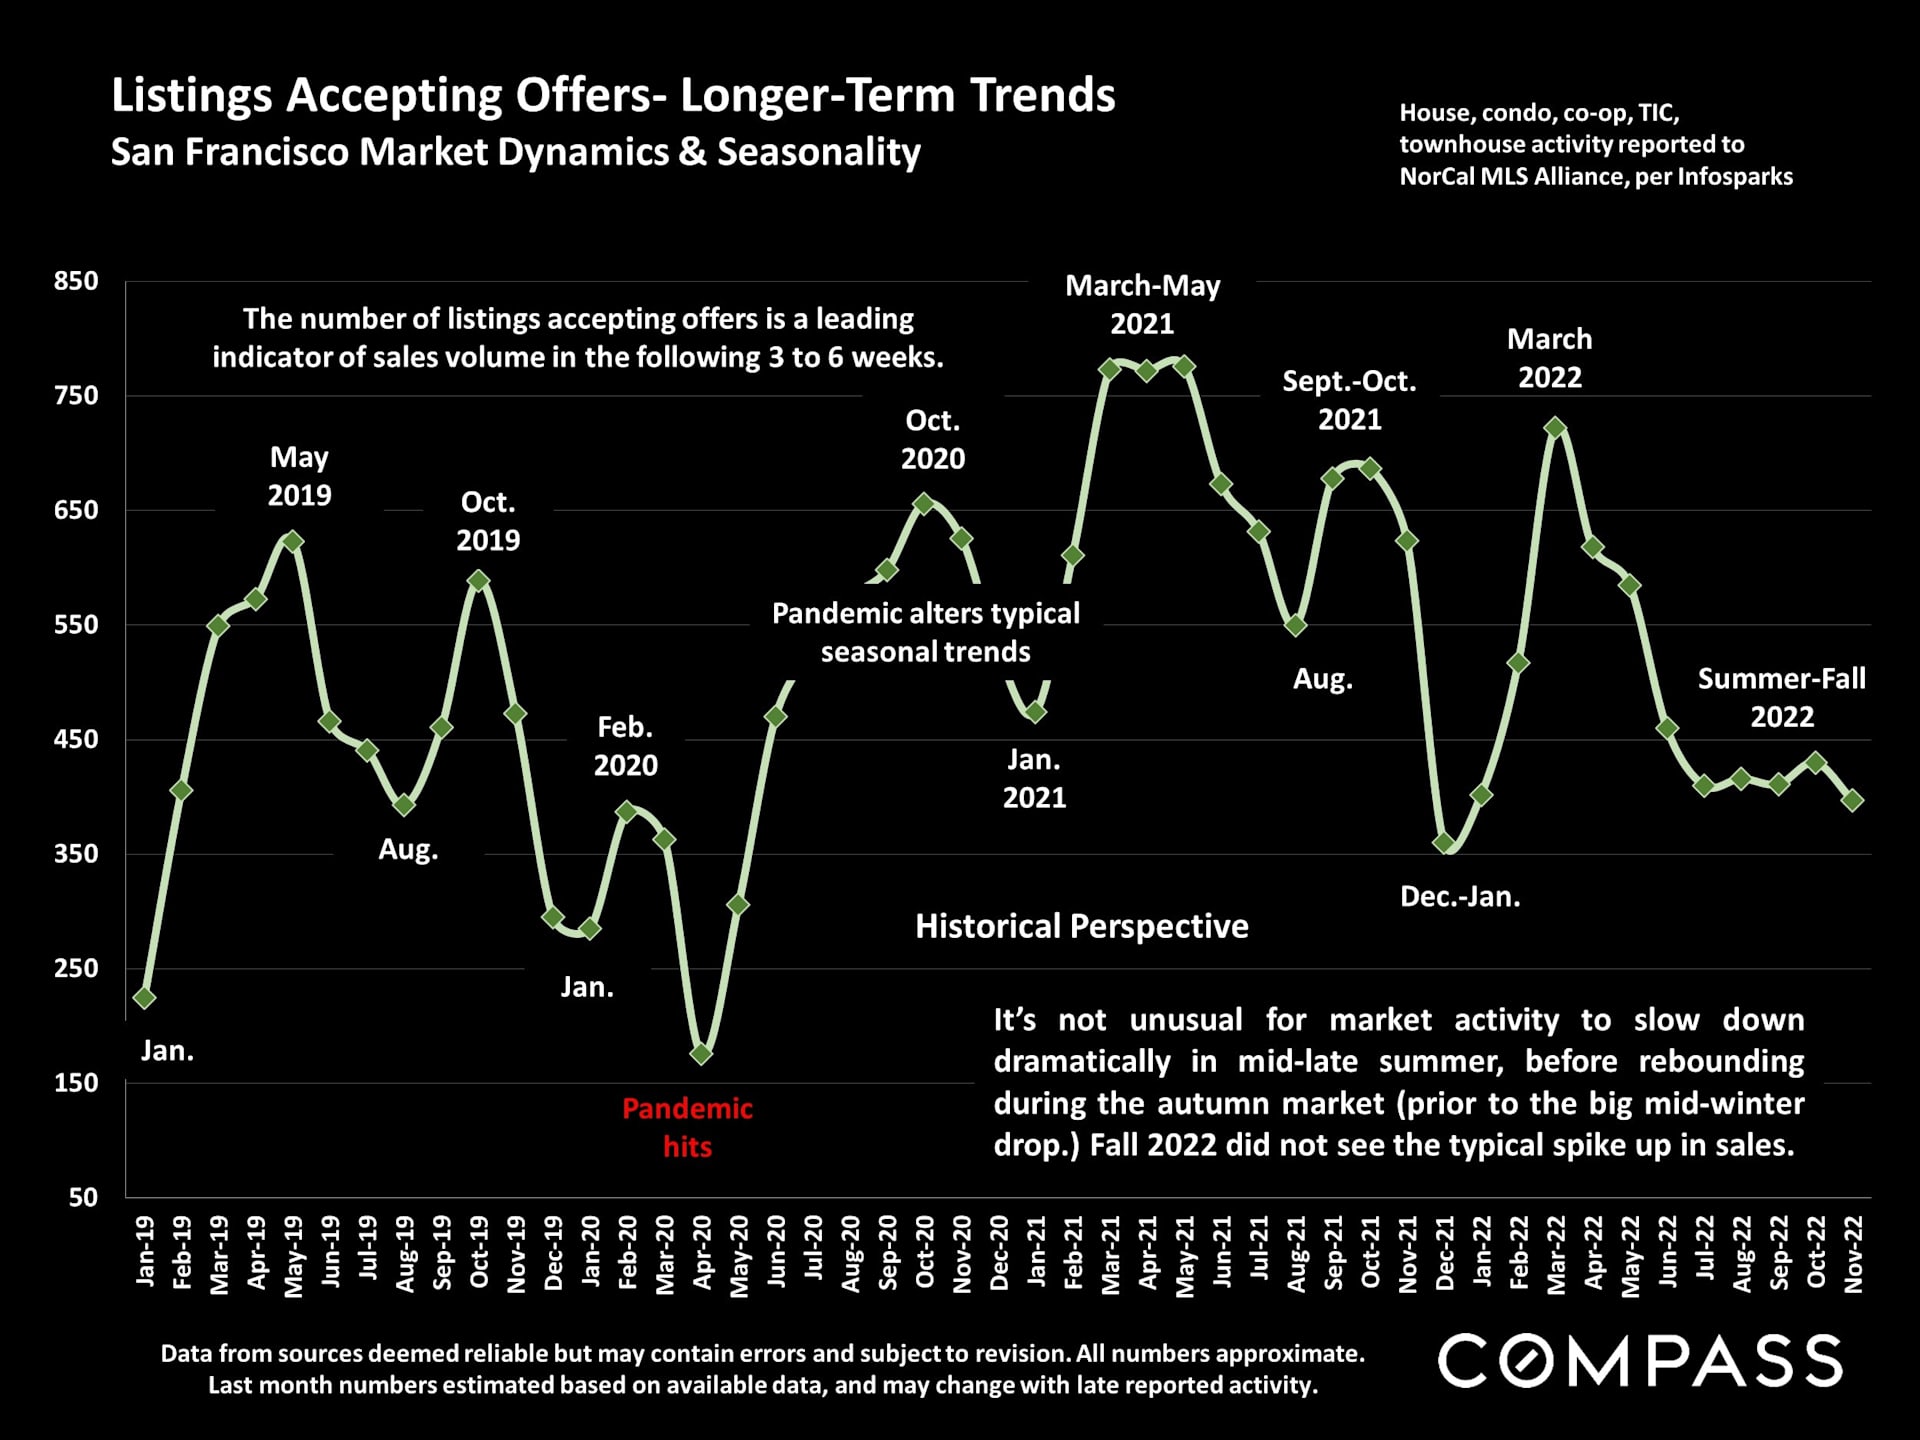
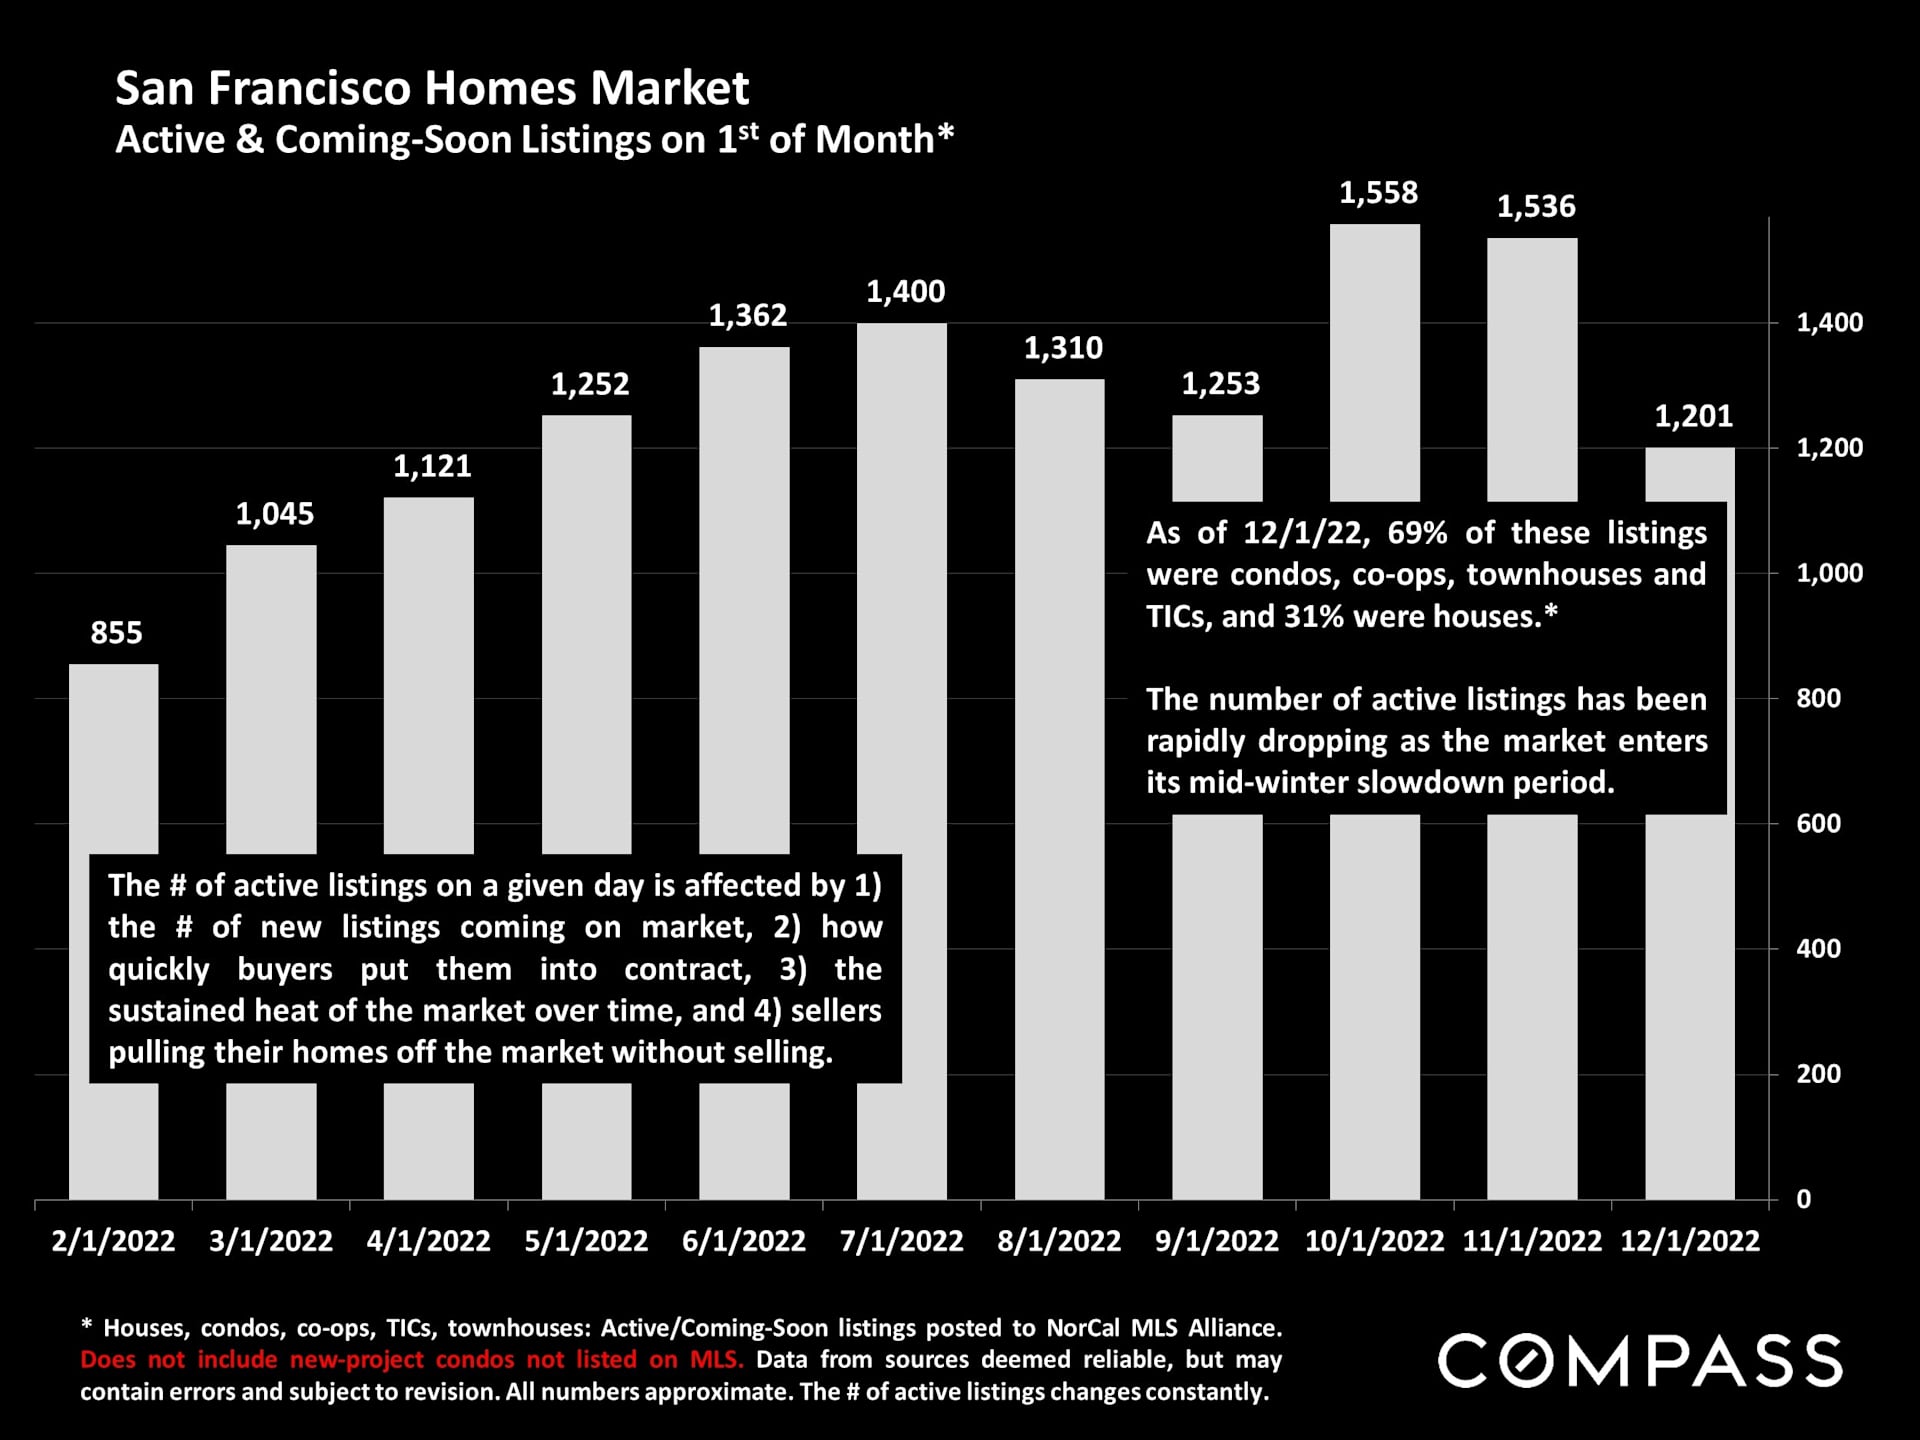
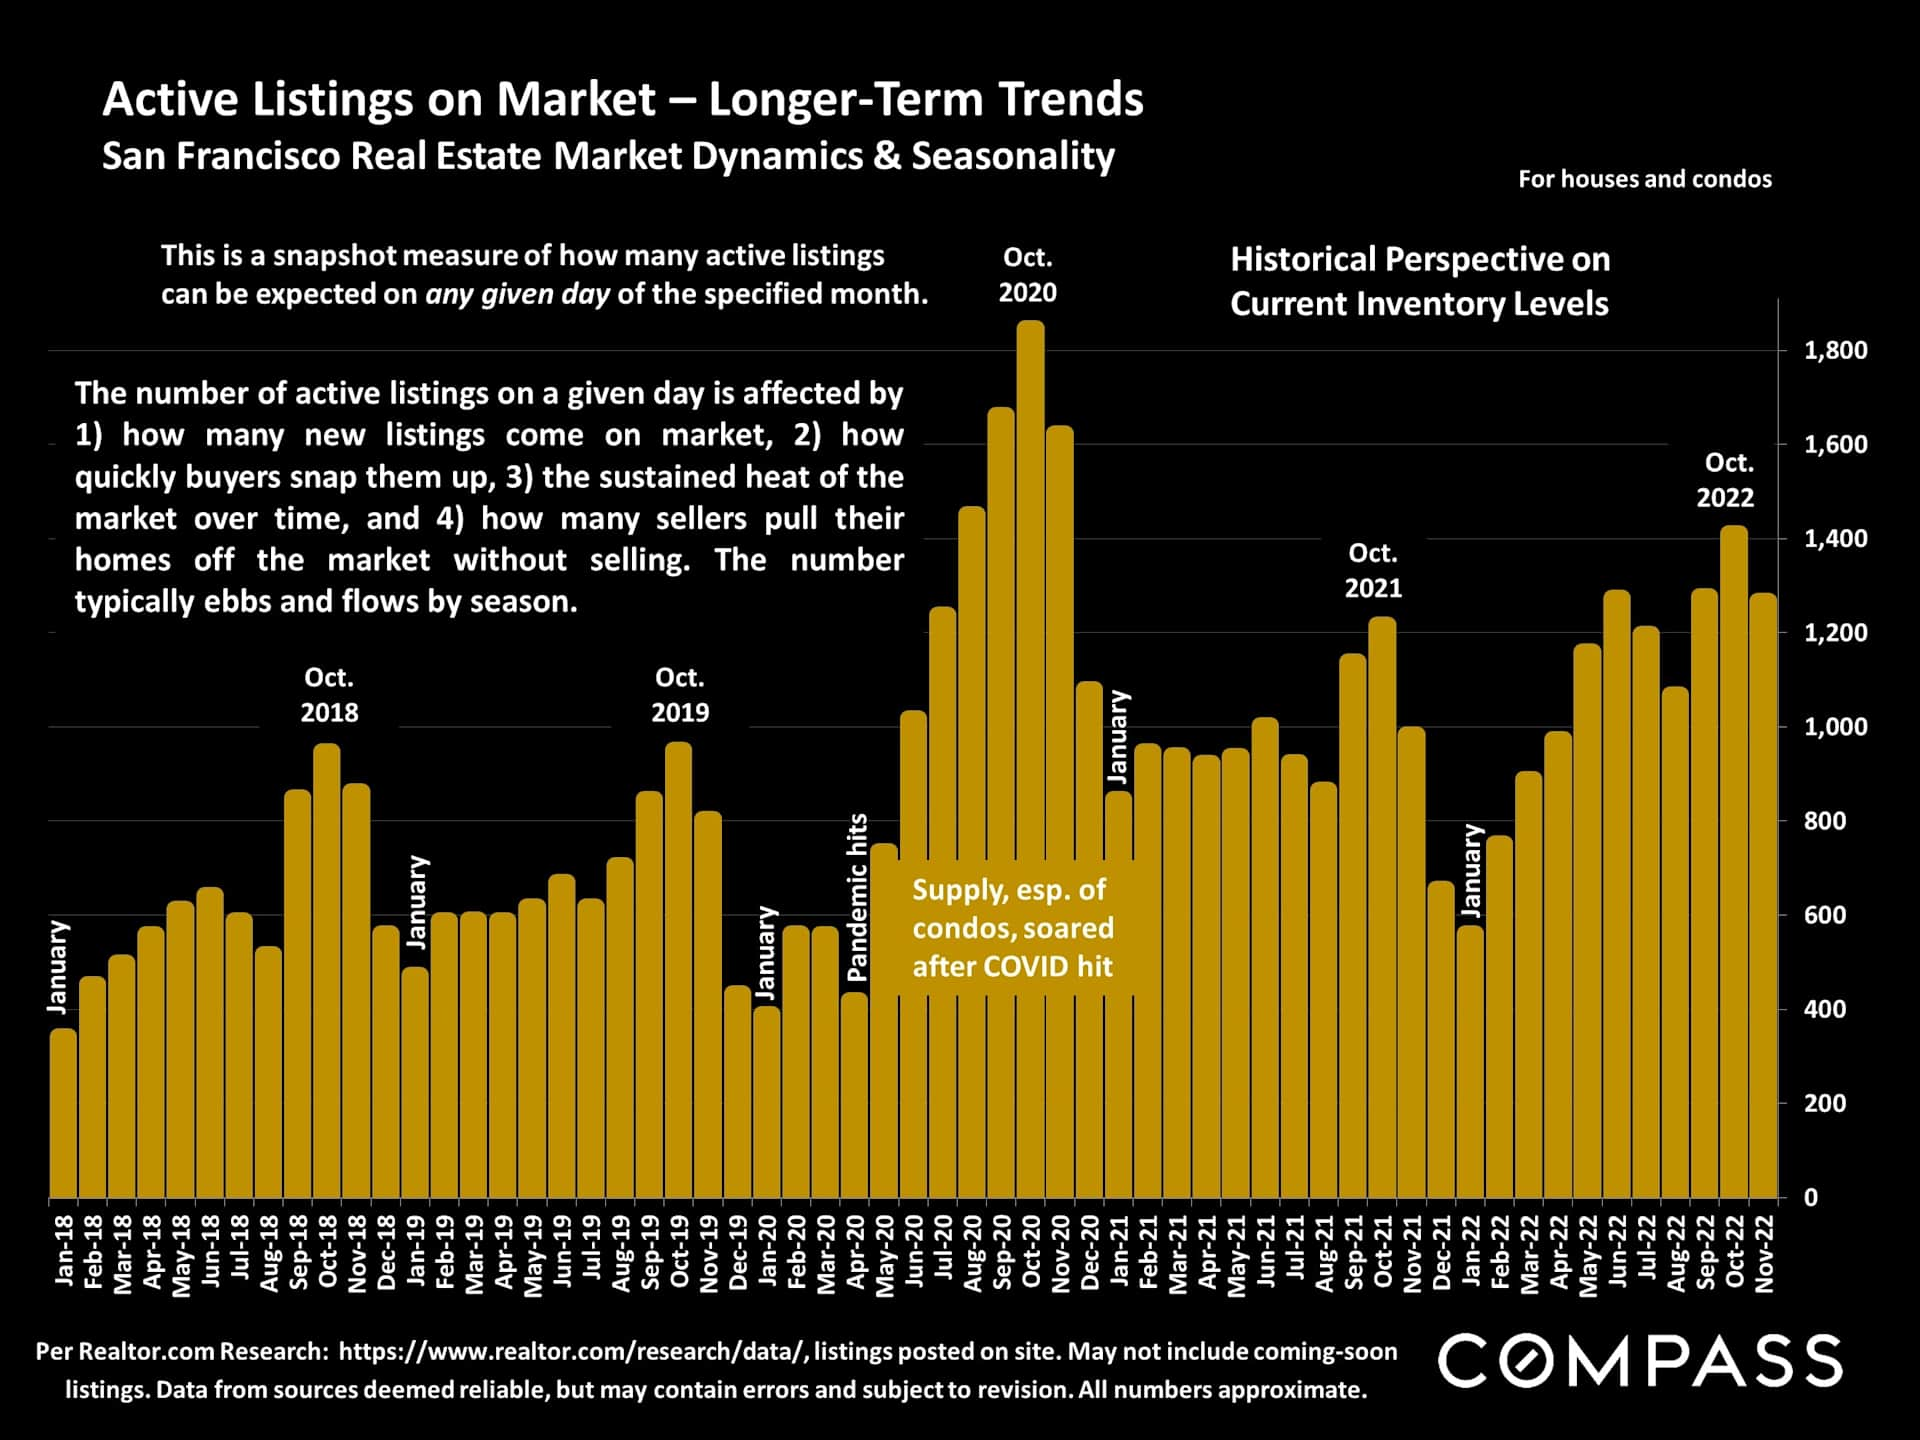
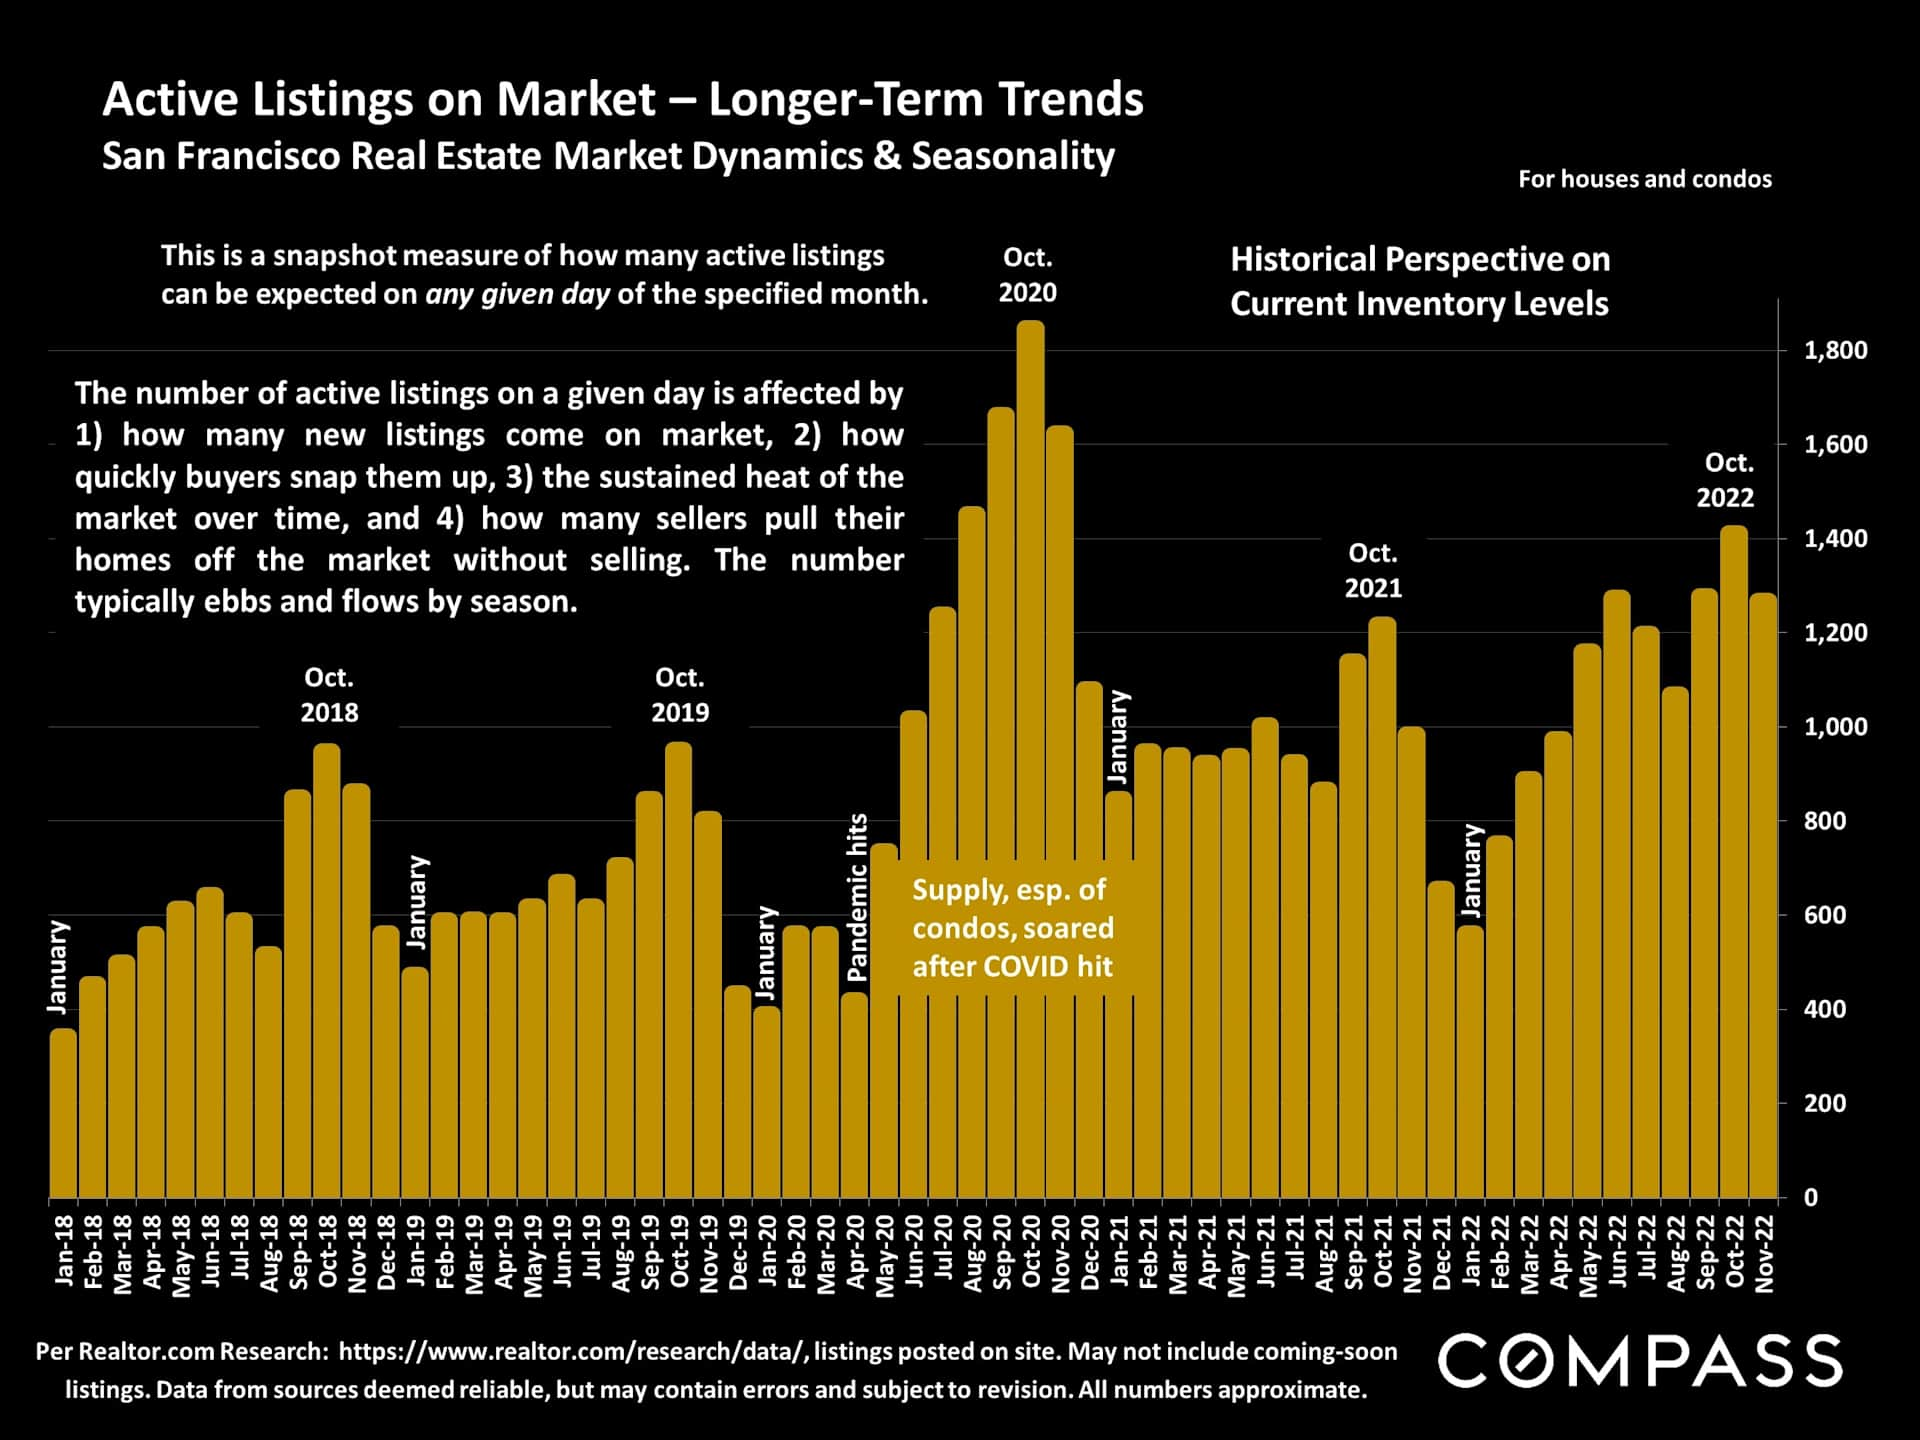
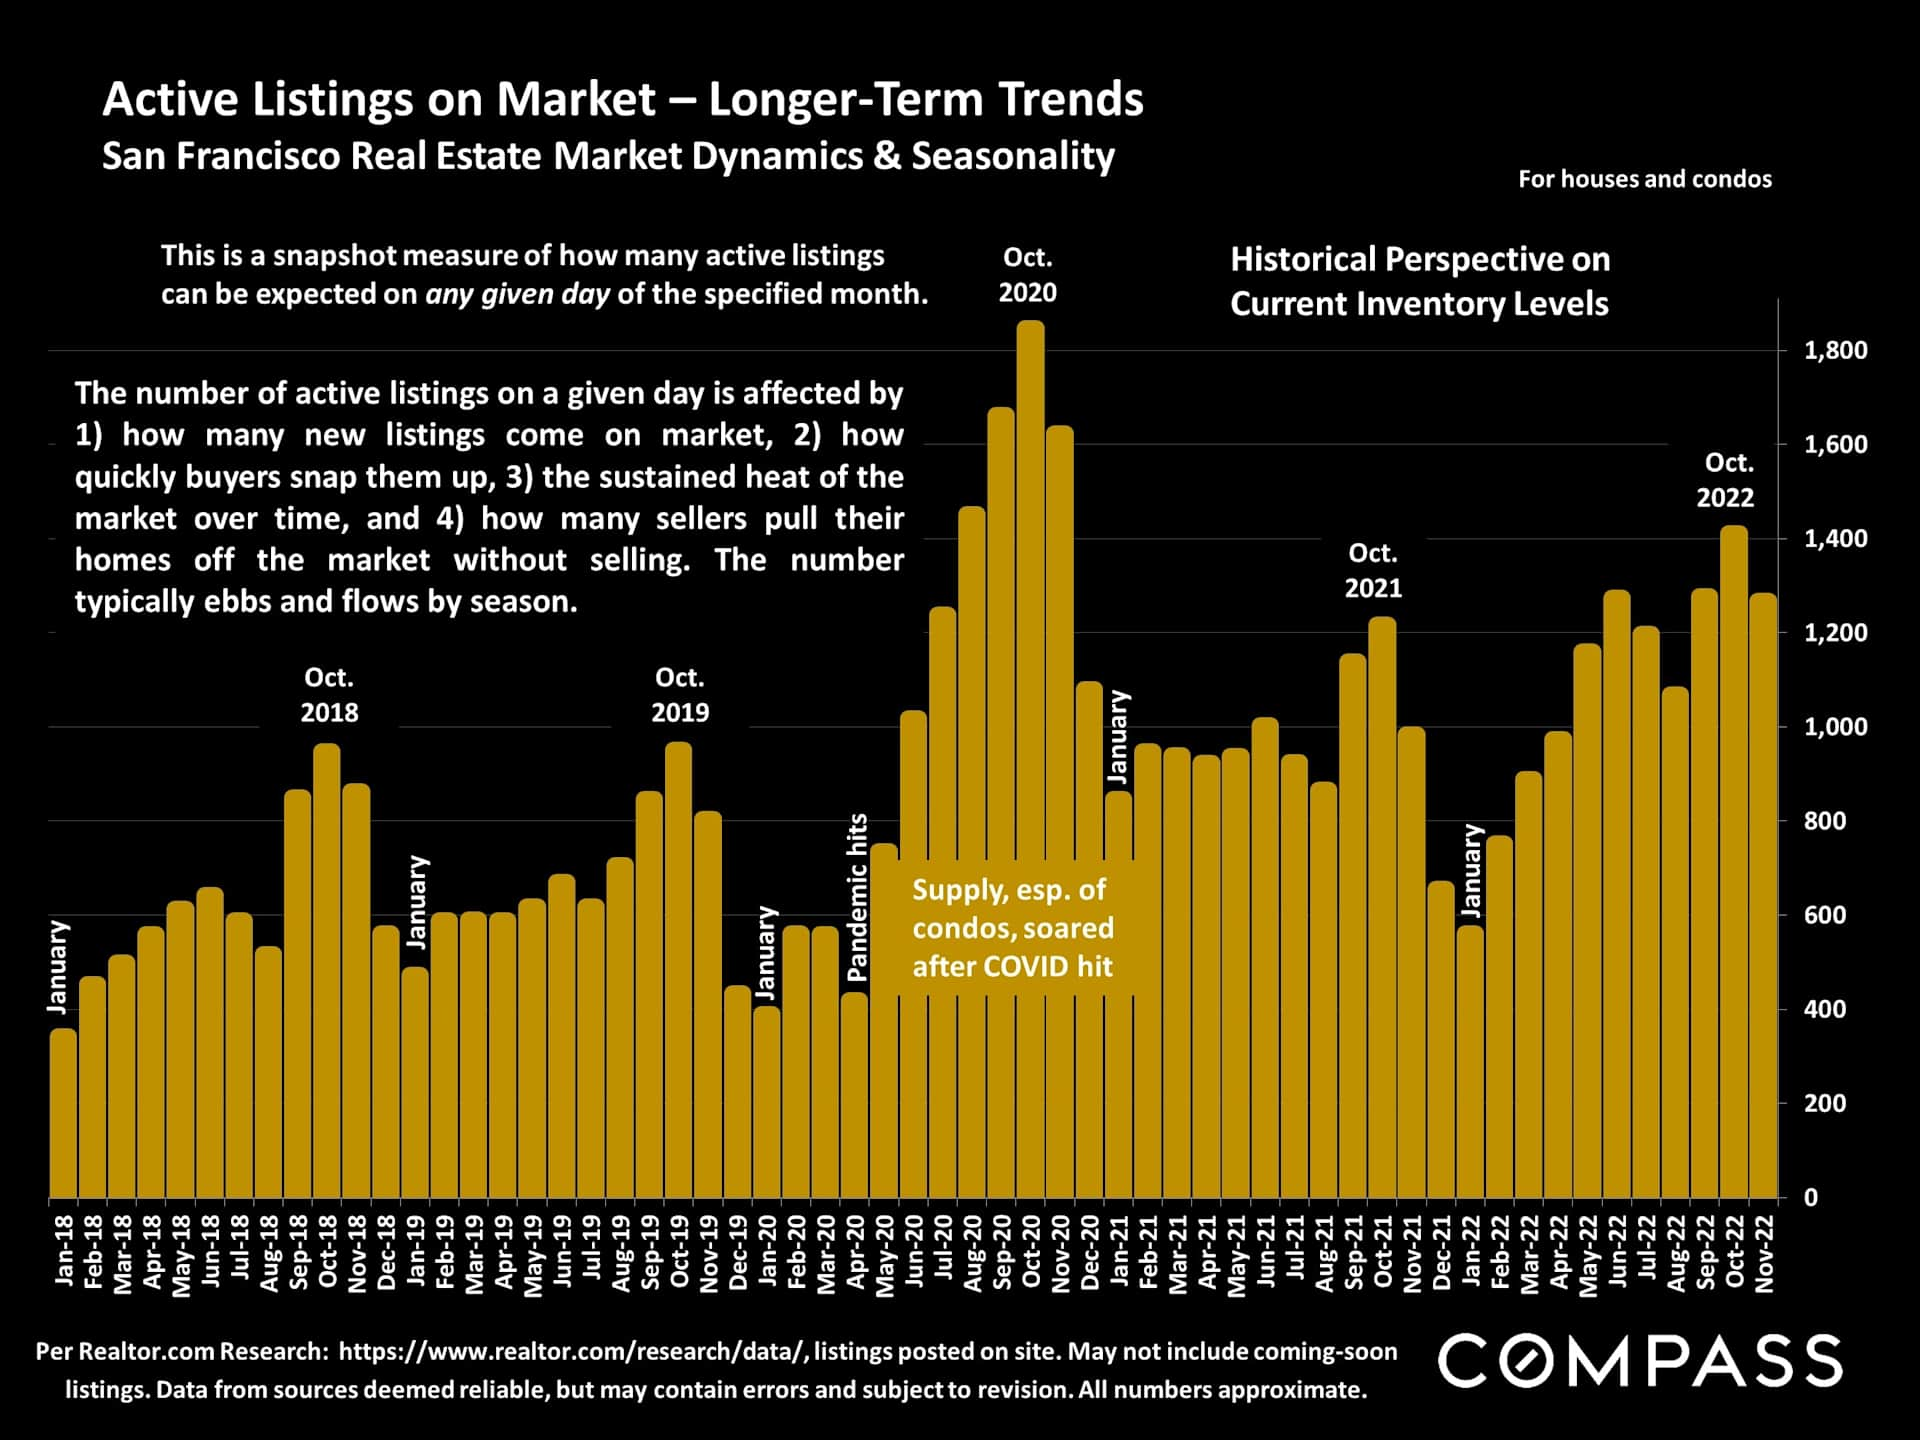
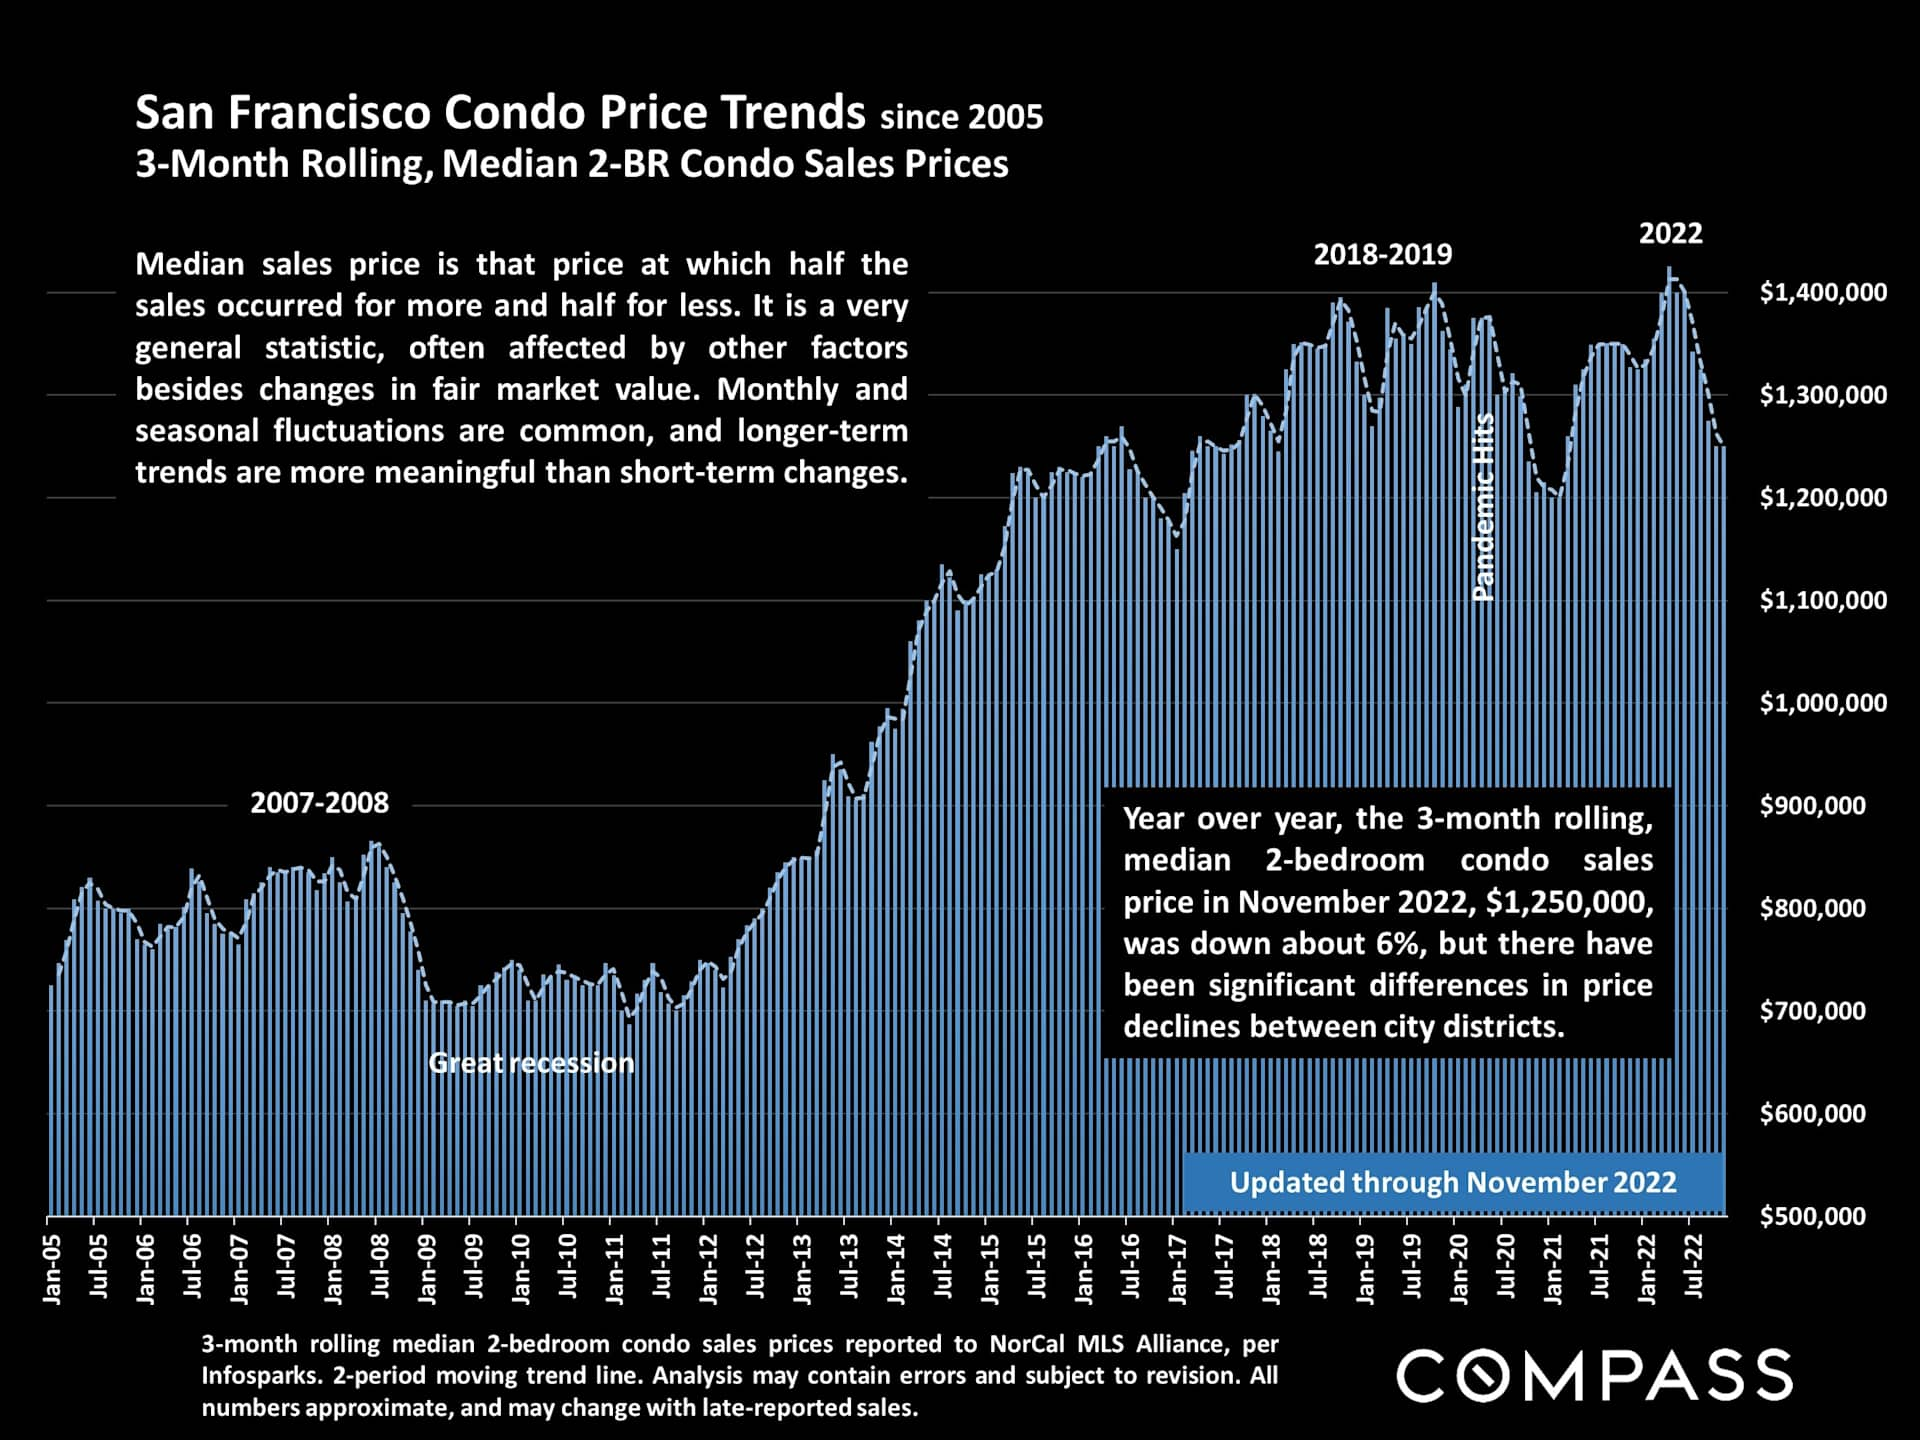
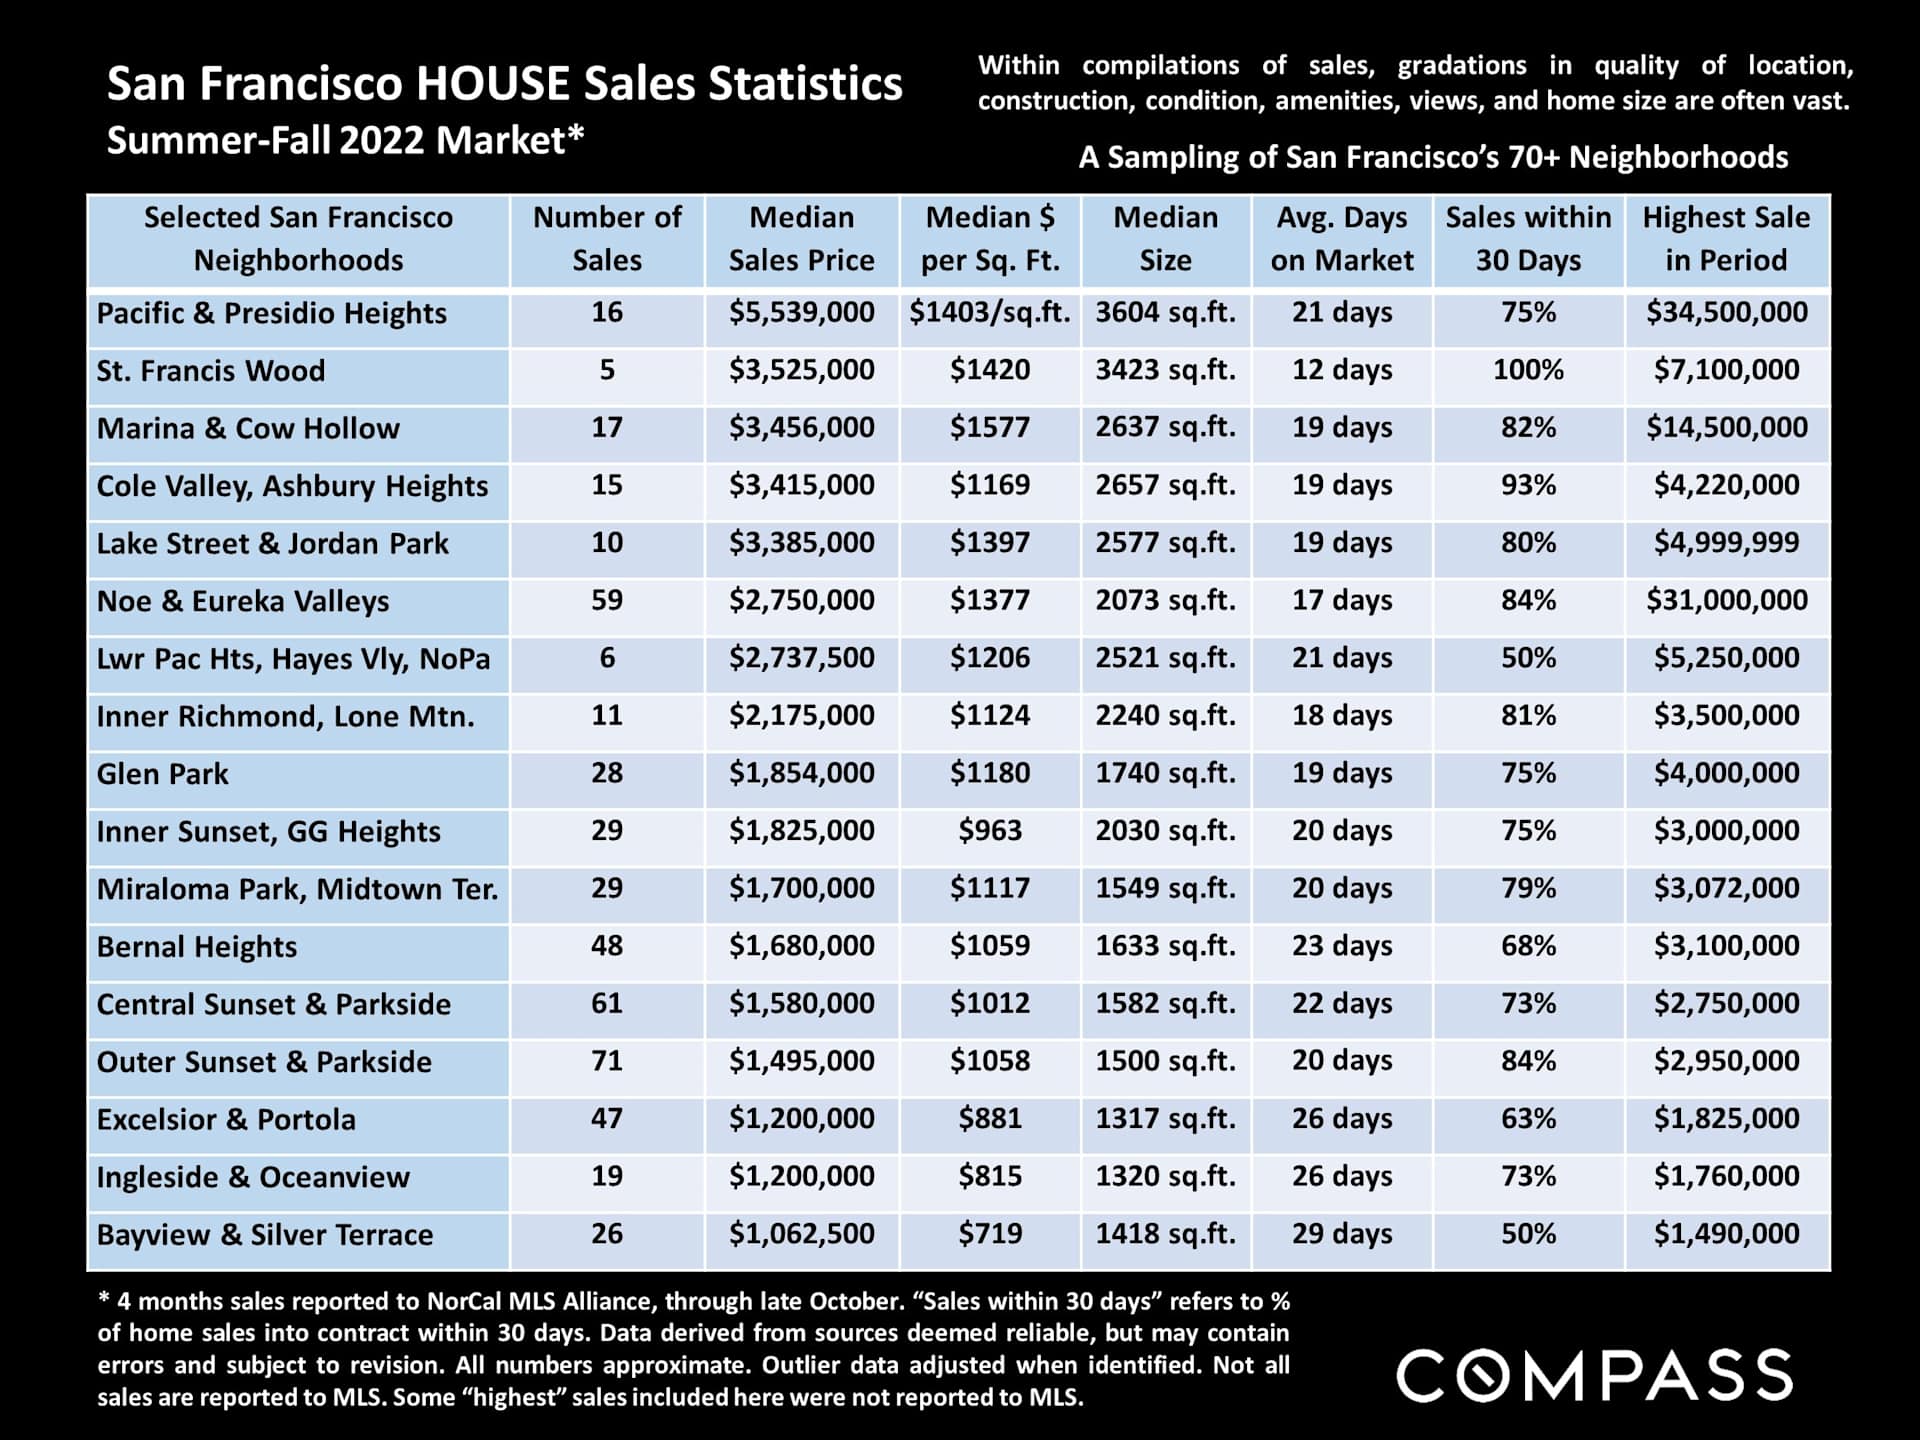
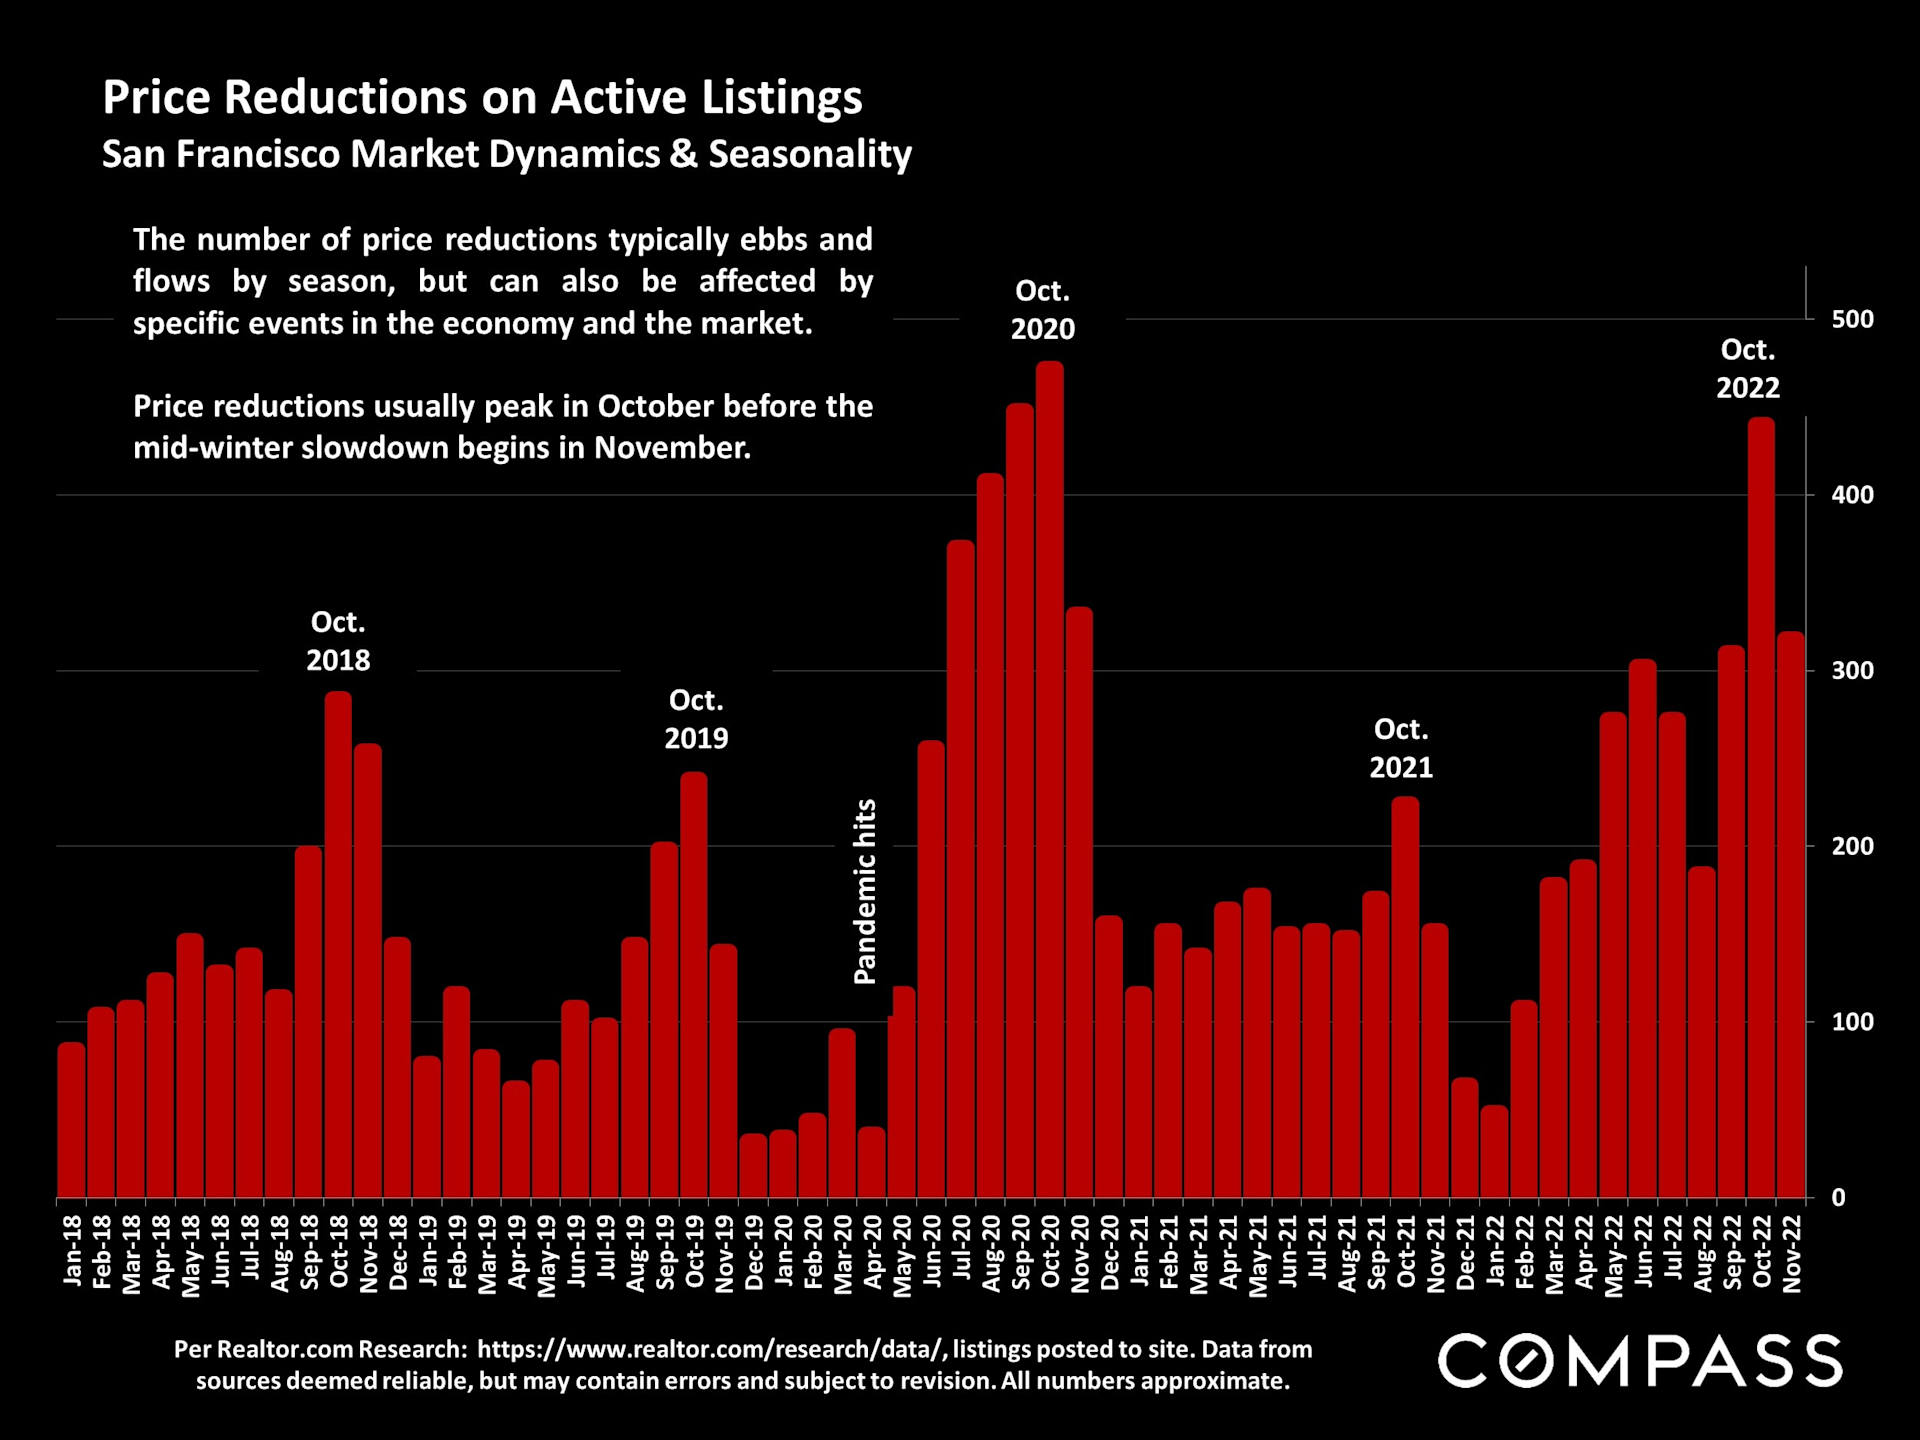
San Francisco real estate market report discussing 2022 trends, December activity, interest rates, and market conditions.San Francisco annual home-price appreciation chart, with gray bars and annotations for major market cycles.Chart of San Francisco median house prices from 1990 to 2022, with the November 2022 price at $1.6 million.San Francisco house sales by price segment, August–November 2022, shown in a pie chart with bedroom-count totals.Chart of San Francisco condo price appreciation rates from 1995 to 2022, annotated with major real estate market periods.Chart of San Francisco condo price appreciation by year, with historical market-cycle annotations and a Compass wordmark.San Francisco August–November 2022 home sales infographic with price-segment pie chart and unit-size counts.Bay Area large-home sales table comparing median prices and property details by county, August–November 2022.Table comparing Bay Area county home prices, square footage, and price per square foot by bedroom and bath count.Bay Area home value comparison table by county for condos and townhouses, August–November 2022.Chart of monthly San Francisco home sales from 2019 to 2022, highlighting seasonal patterns and a 45% annual decline.Chart of San Francisco monthly home sales, January 2019–November 2022, with seasonal patterns and a 45% year-over-year decline in November 2022.Chart of San Francisco $3 million-plus home sales from 2018 to 2022, showing seasonal patterns and a November 2022 decline.Chart comparing monthly Bay Area home sales over $5 million in 2021 and 2022, with November sales down about 53%.Chart of California all-cash home purchases from 1998–2022, peaking at 30% in 2012 and ending at 22%.Chart of San Francisco housing by construction era, with 44% built before 1940 and 13% from 2000 to 2021.Chart of median San Francisco house size by construction era, rising from 1,424 square feet in 1940–1959 to 2,957 after 2000.Chart of San Francisco home sales closing over list price, with monthly trends from 2018 to November 2022.Line chart compares San Francisco house and condo sale prices to list prices from 2019 to November 2022.Chart comparing average days on market for sold San Francisco houses and condos, January 2019–November 2022.Chart of San Francisco new listings, January 2018–November 2022, showing seasonal peaks, December lows, and a November 2022 marker.Chart of San Francisco listings accepting offers, showing seasonal trends from January 2019 to November 2022.Chart of San Francisco active and coming-soon listings, peaking at 1,558 in October 2022 before falling to 1,201 in December.Chart of San Francisco active listings from 2018 to 2022, with gold bars showing inventory changes and pandemic-era supply growth.Chart of San Francisco active listings, January 2018–November 2022, with gold bars and inventory trend annotations.San Francisco active-listings chart, showing monthly inventory trends from 2018 to 2022 and a pandemic-era supply surge.Chart of San Francisco two-bedroom condo prices, 2005–2022, with November 2022 median at $1.25 million, down 6%.San Francisco neighborhood home sales statistics chart for the Summer-Fall 2022 market.Six adults work on laptops around a conference table in a bright office.Staged living room with a beige sectional, tall curtained windows, abstract art, and a black coffee table.Real estate statistics definitions and report disclaimer with Compass branding.Bar chart of San Francisco listing price reductions, with October peaks and a pandemic annotation from 2018 to 2022.

Work With Us

We will help you understand the complex aspects of the transaction and share our expertise so that you can make the best decisions possible. We are experienced, market savvy, and energetic. With both of us working for our clients, you get twice the amount of attention and insight.