
The SF Team, Eva + James, Compass

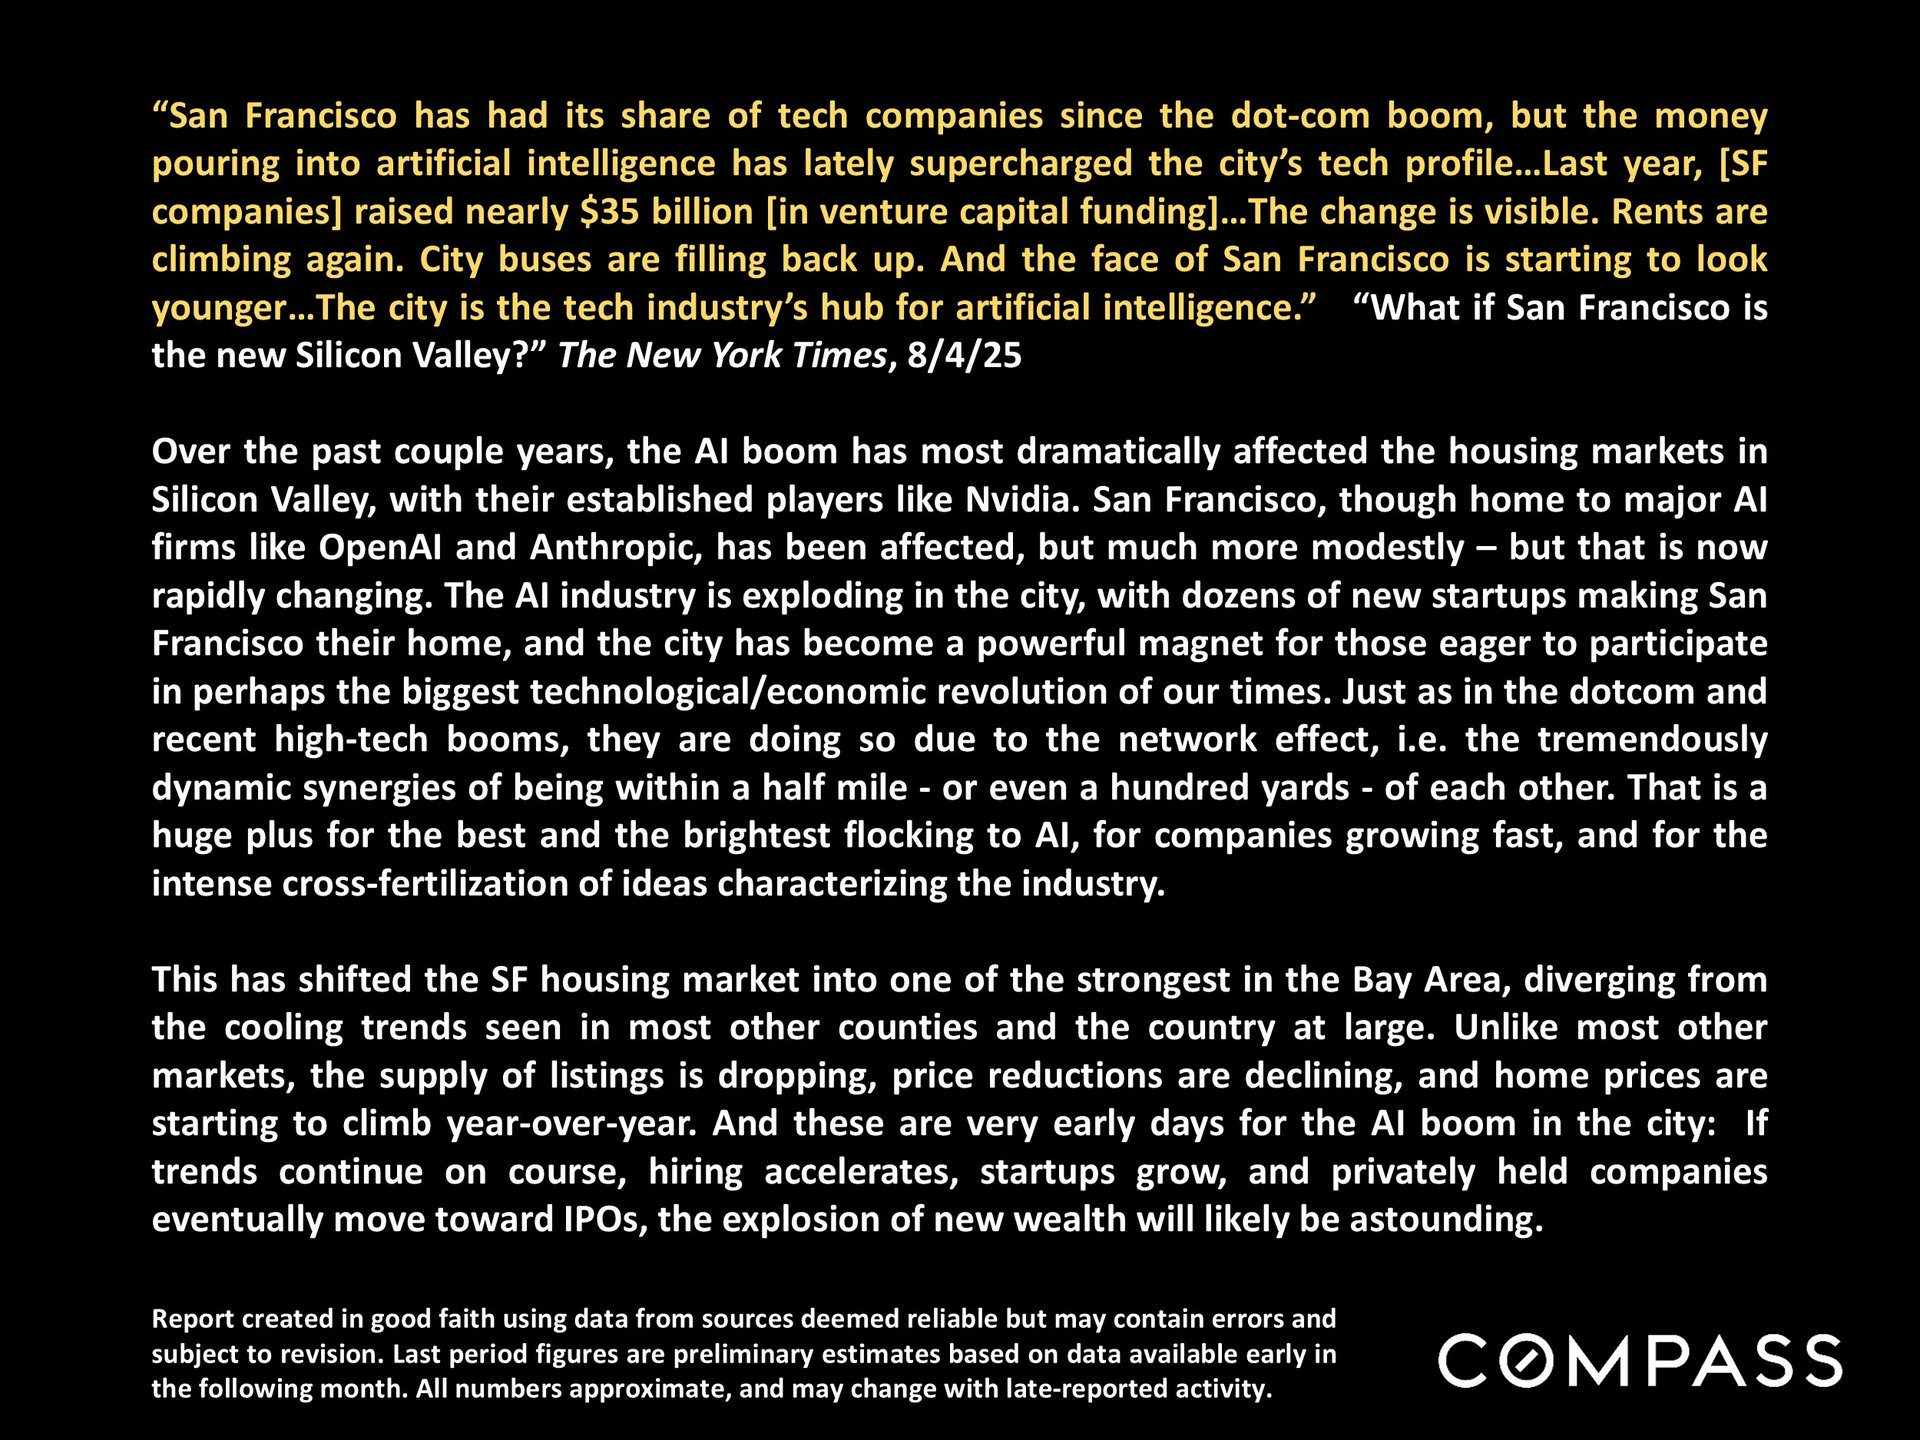
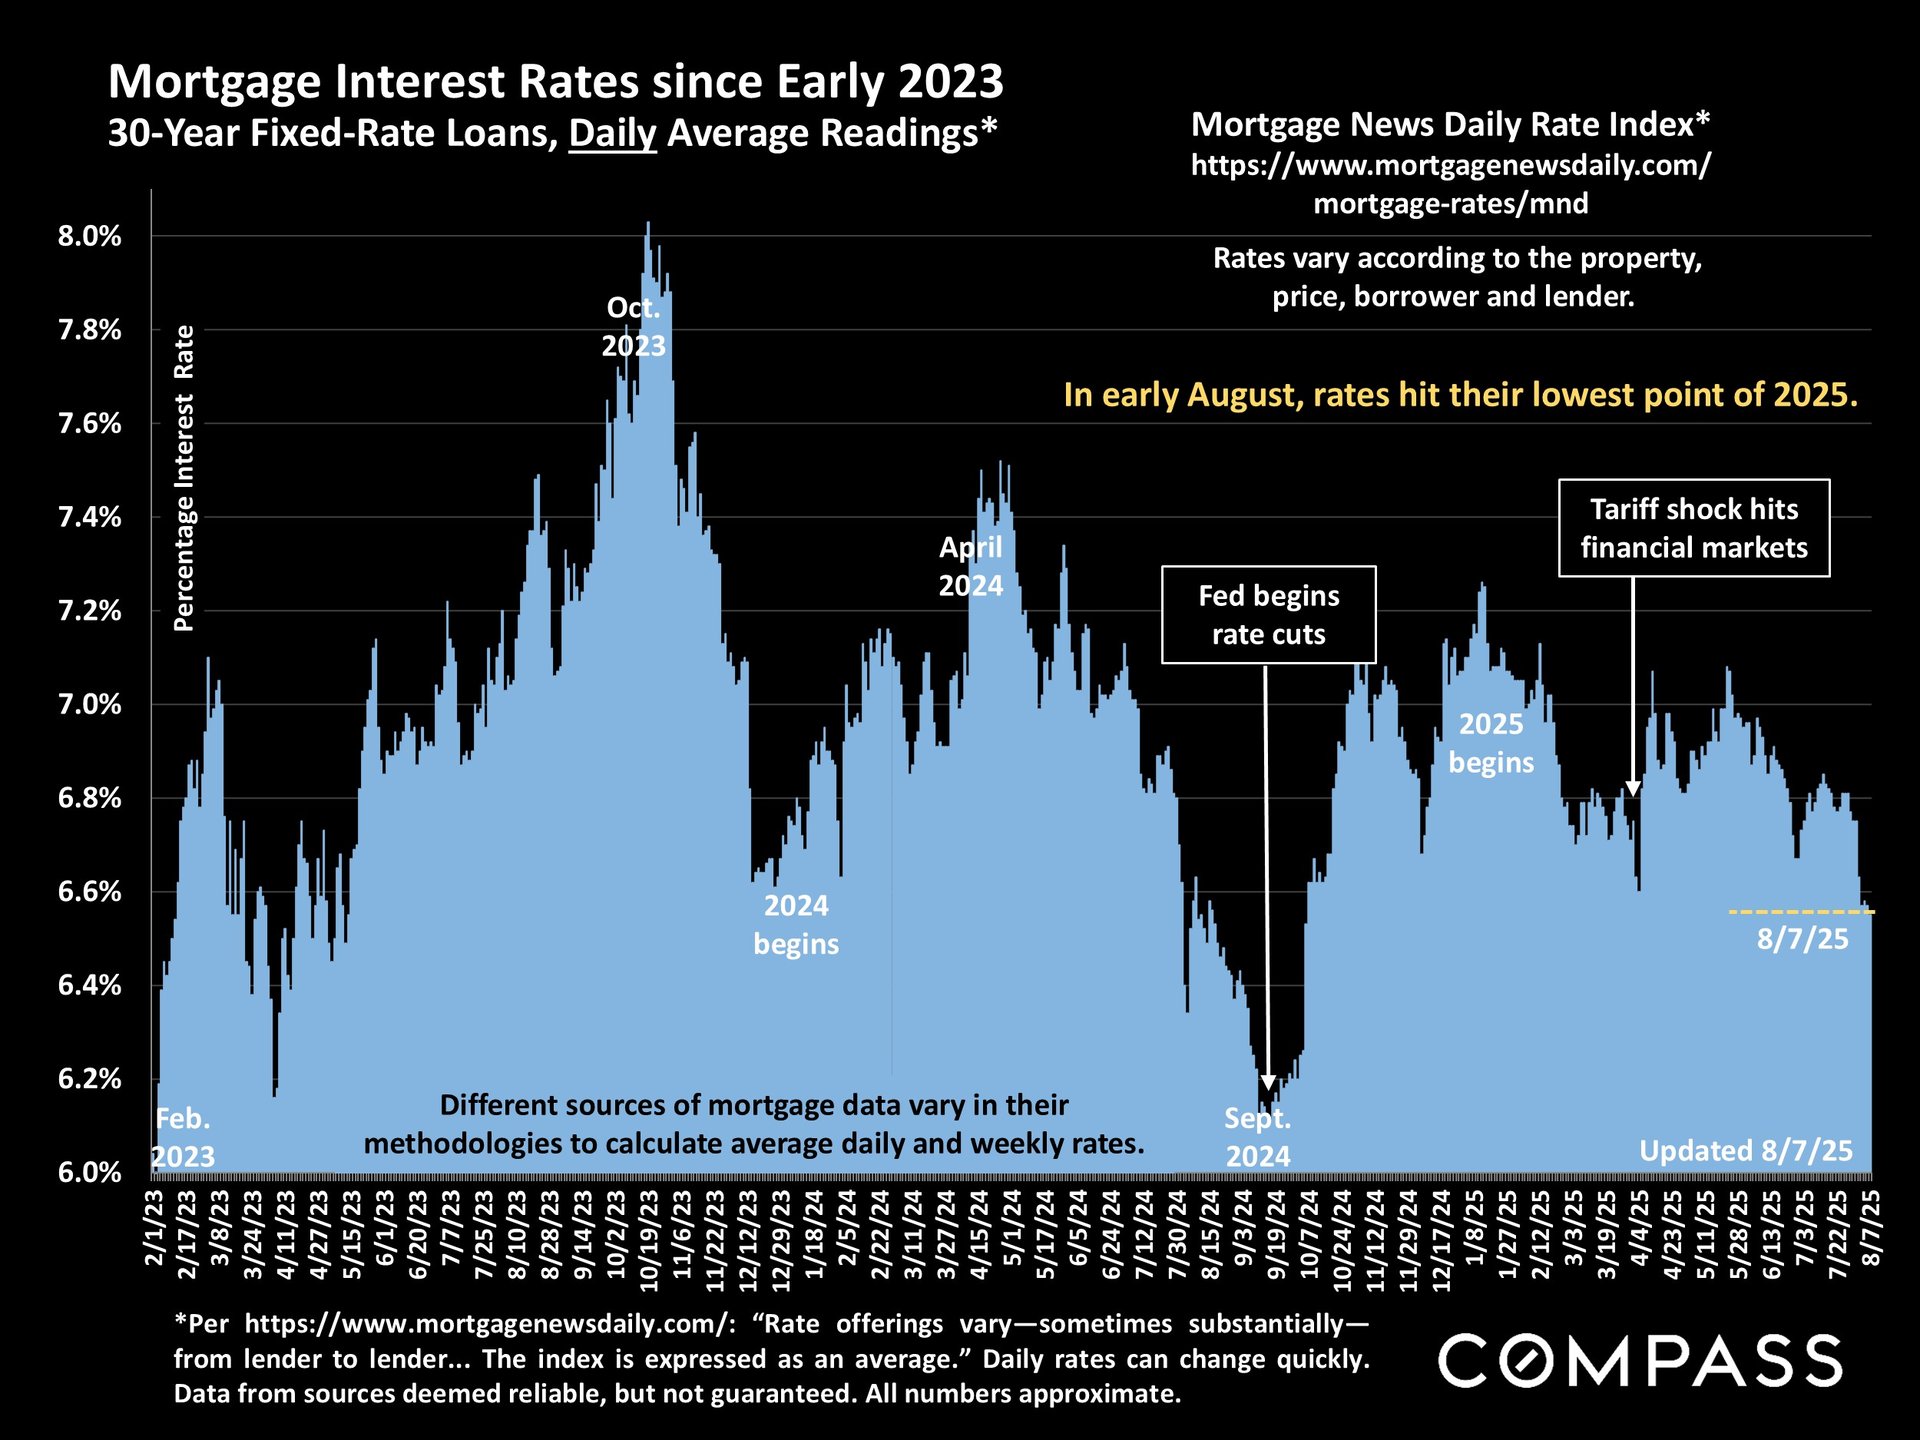
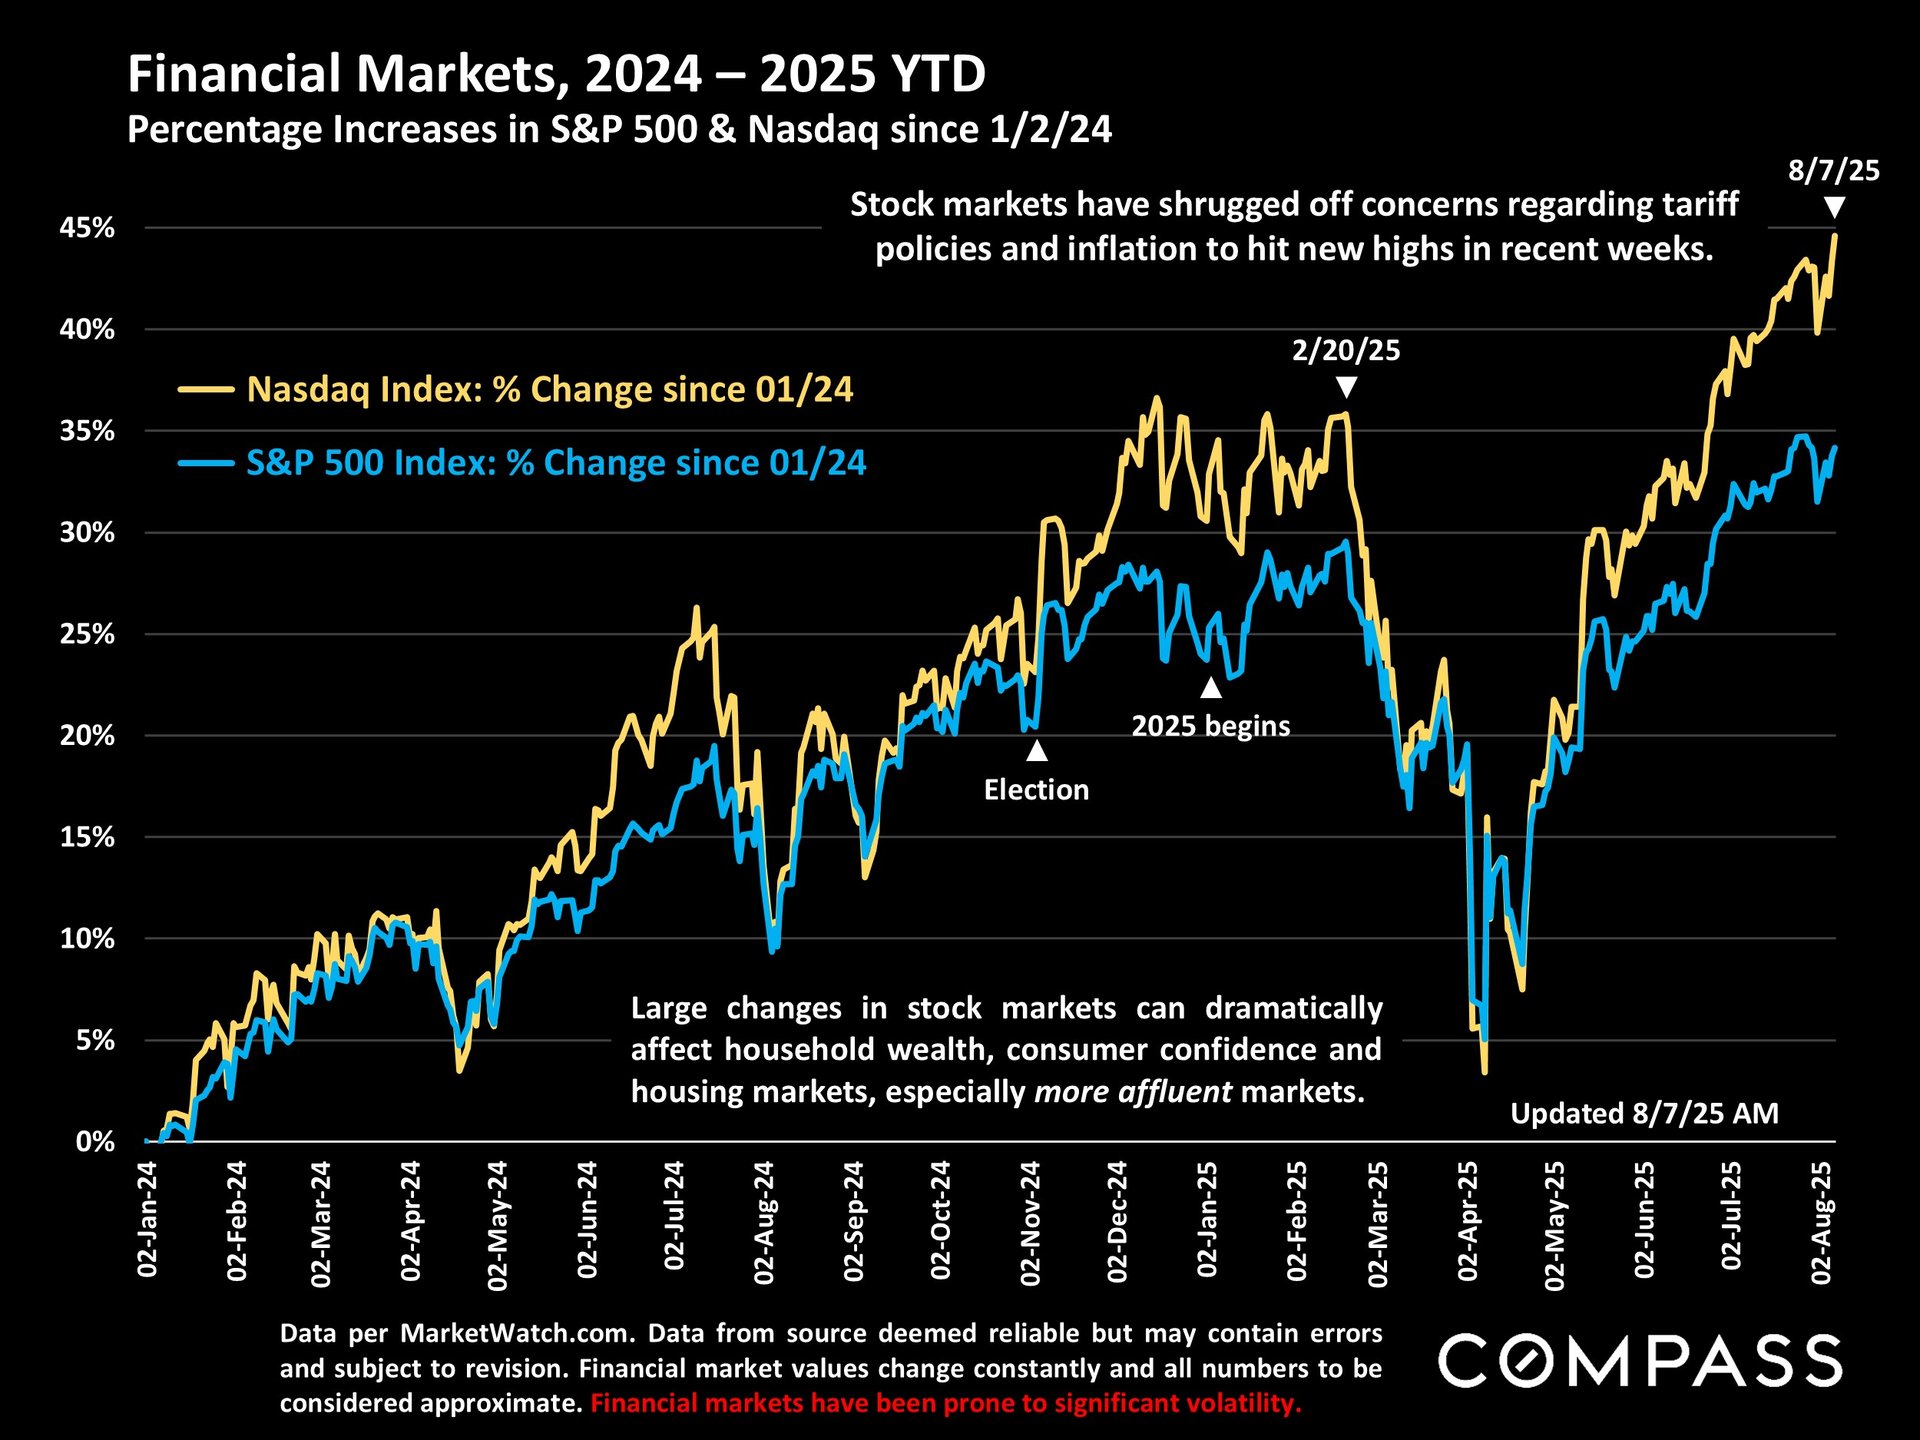
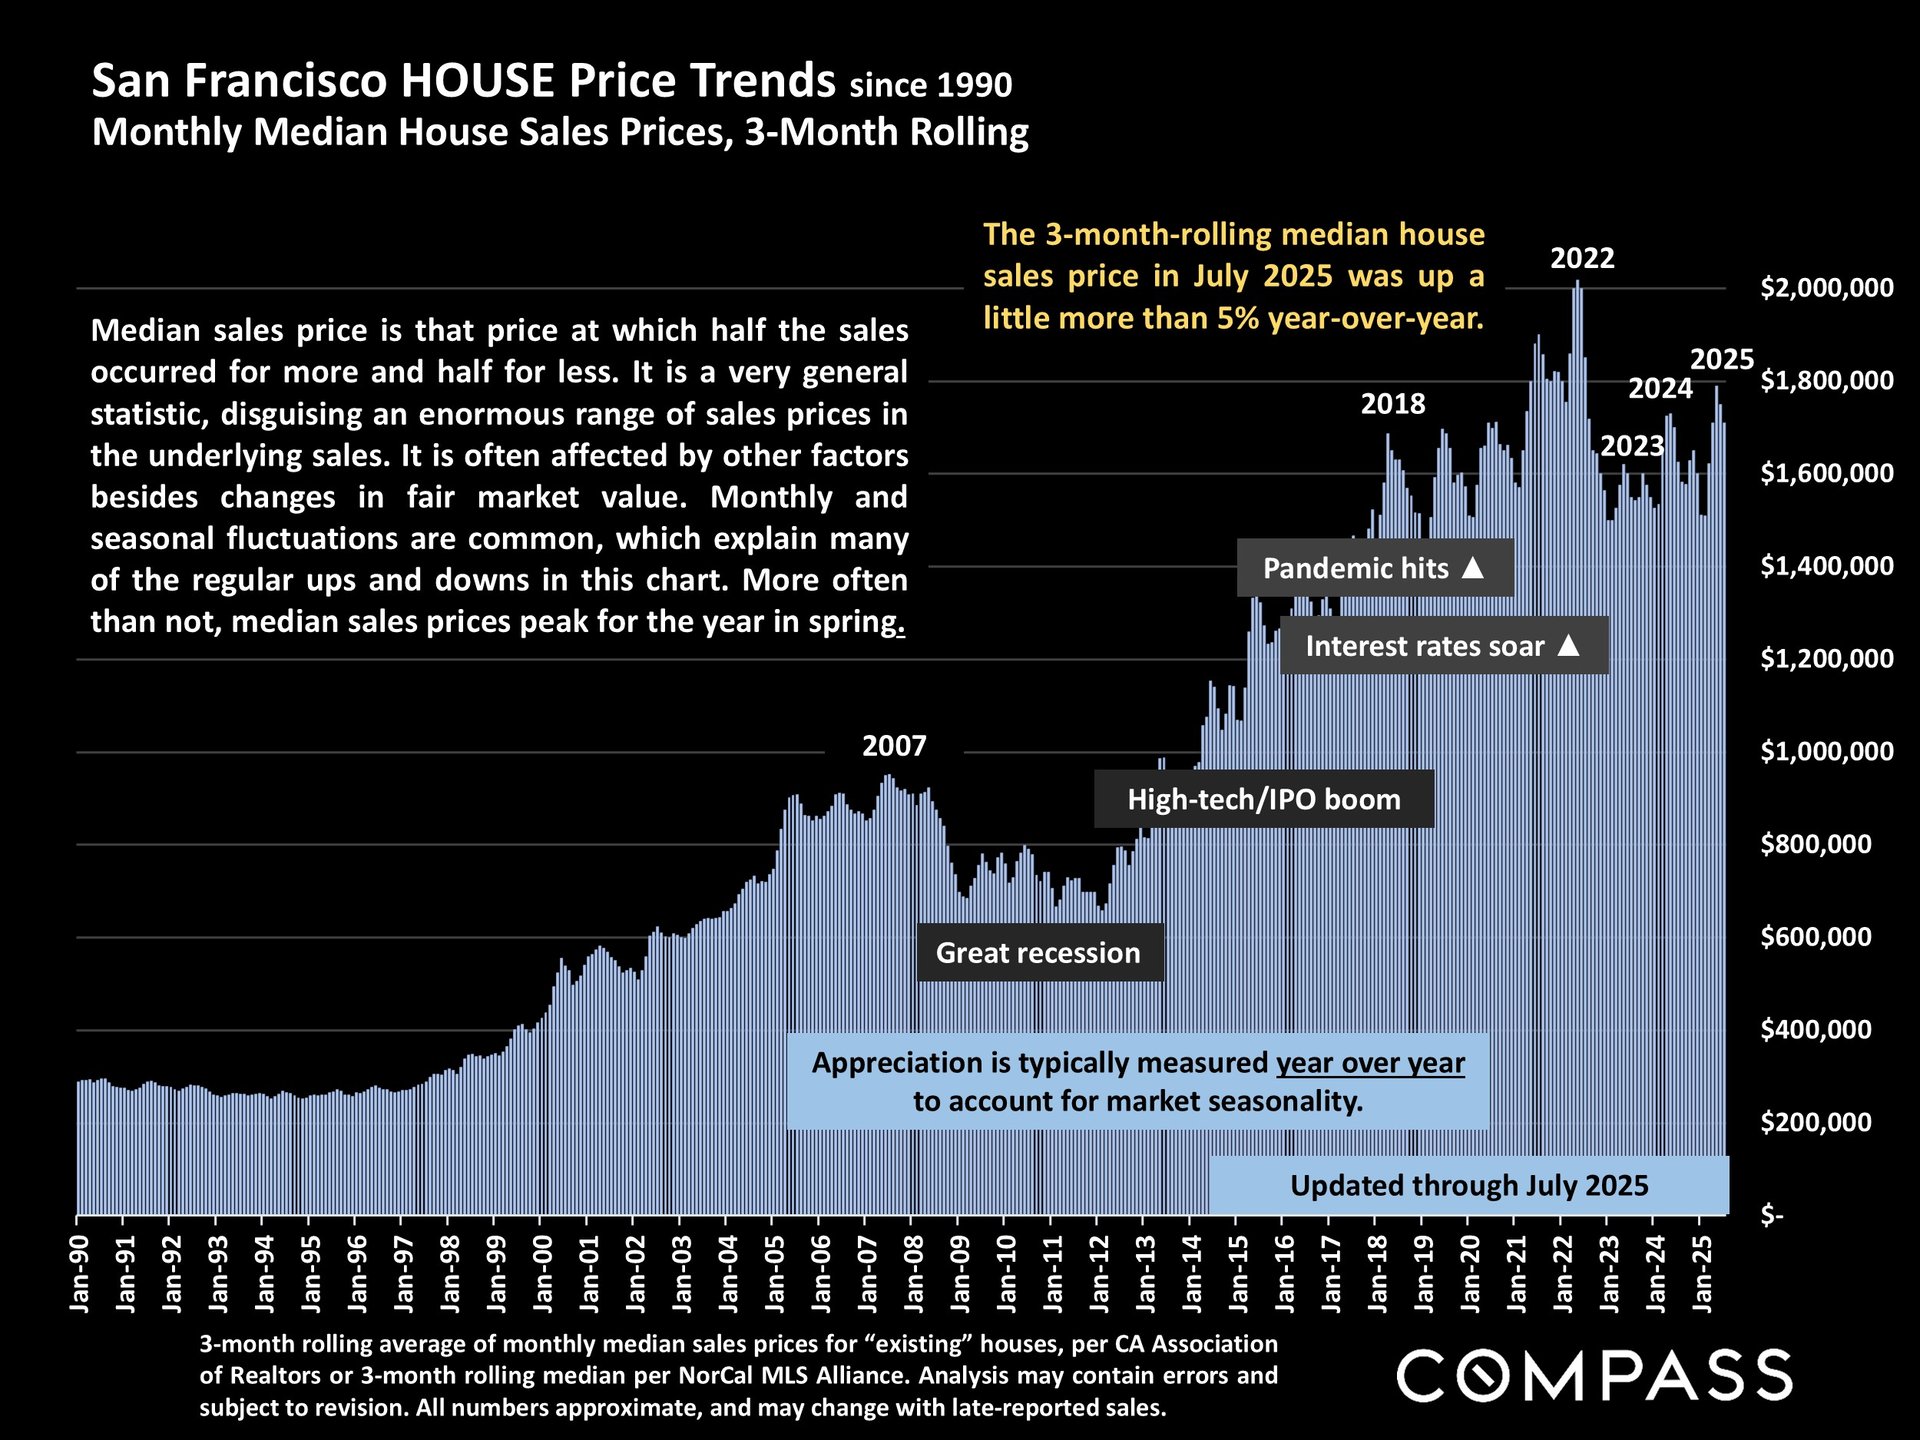
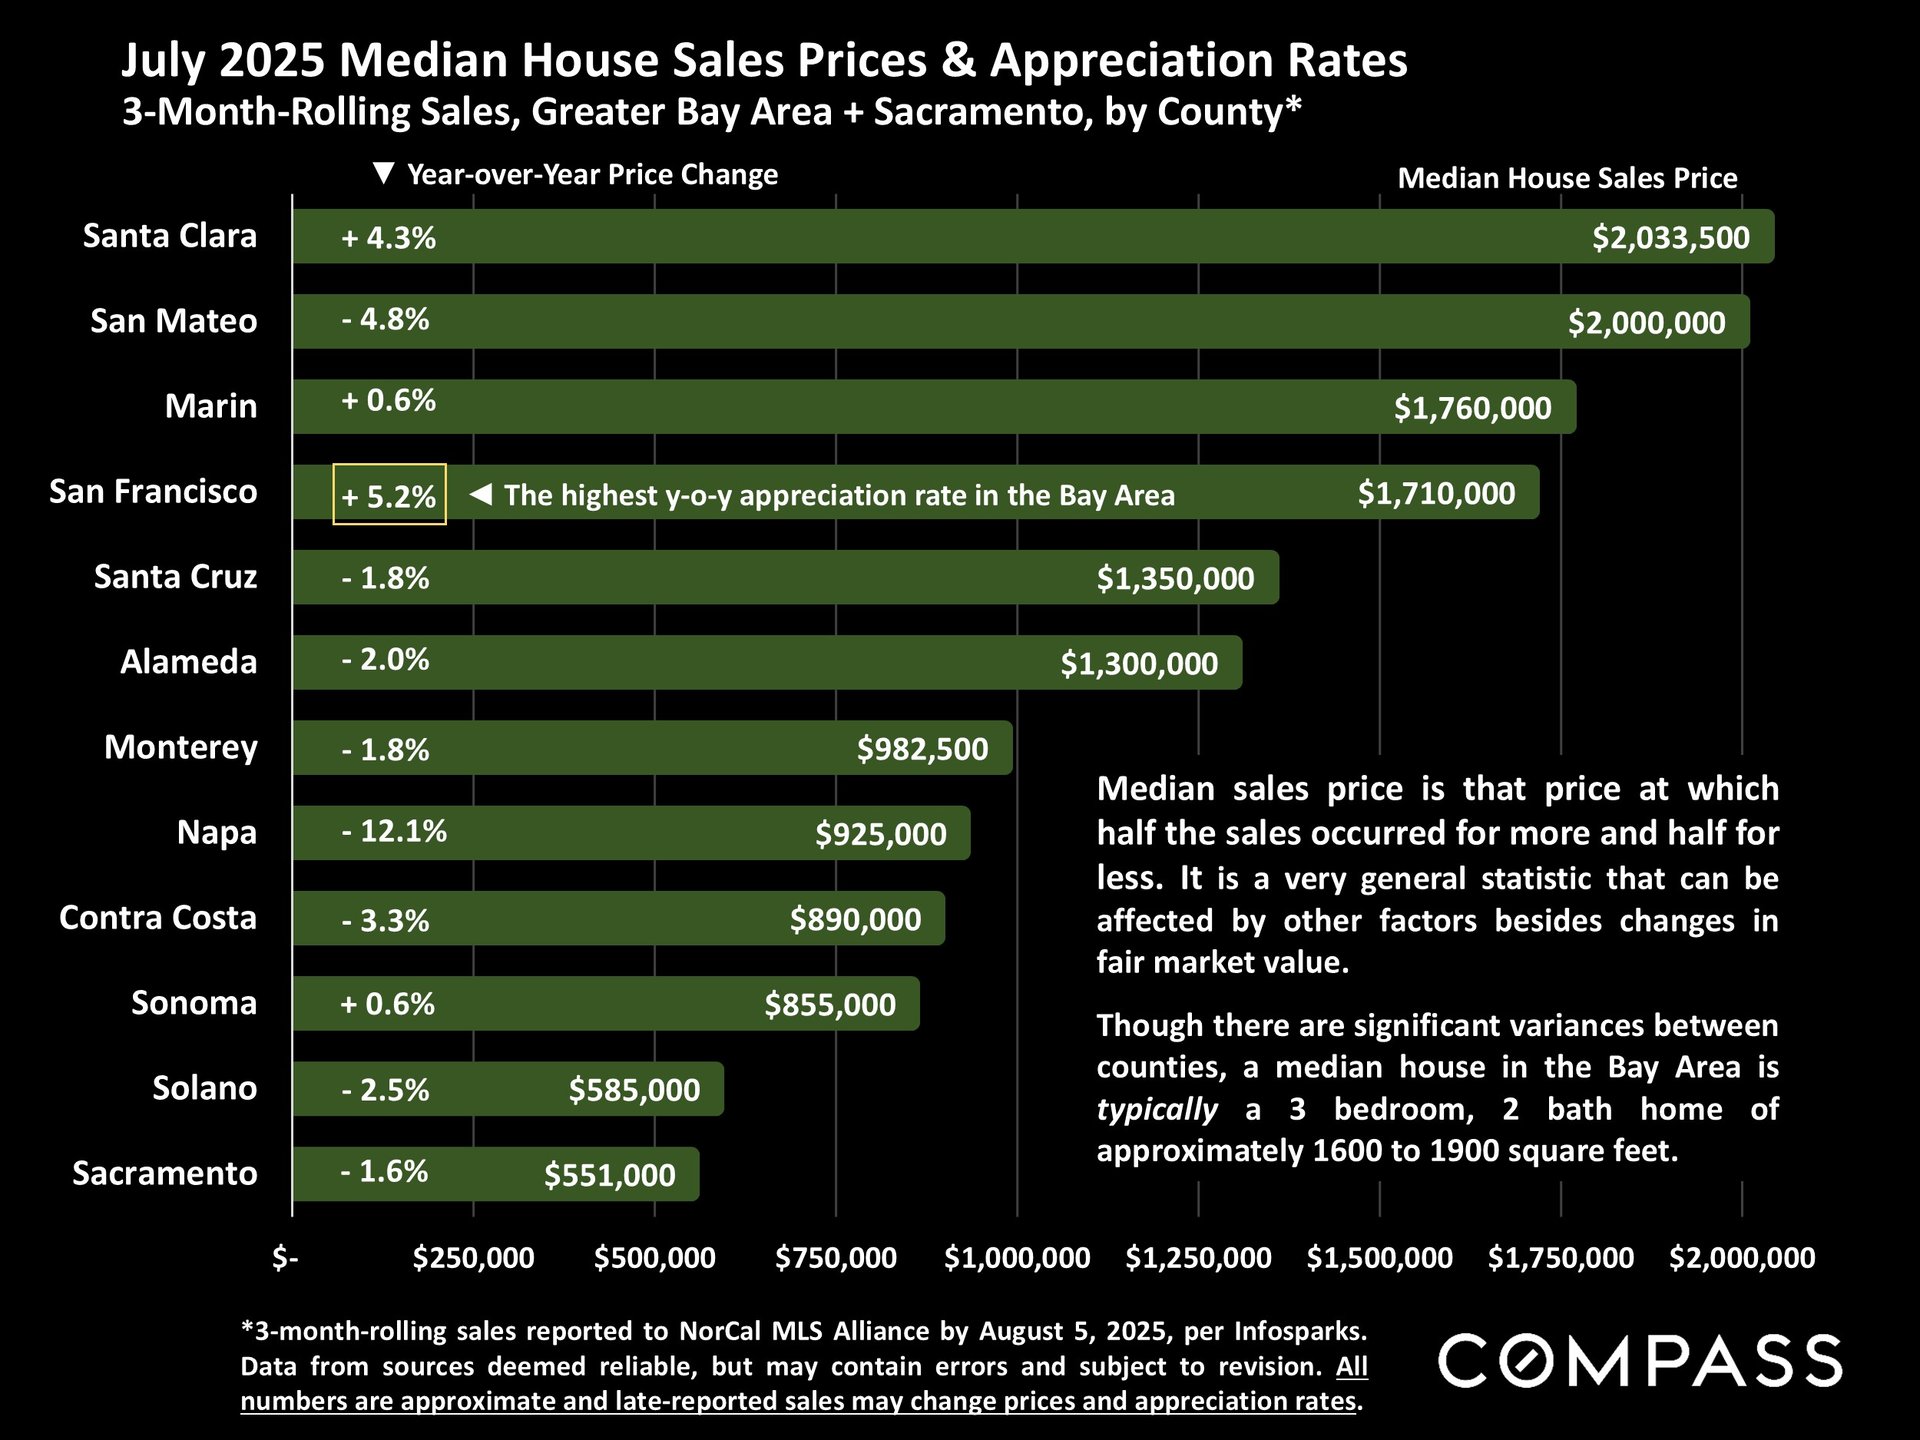
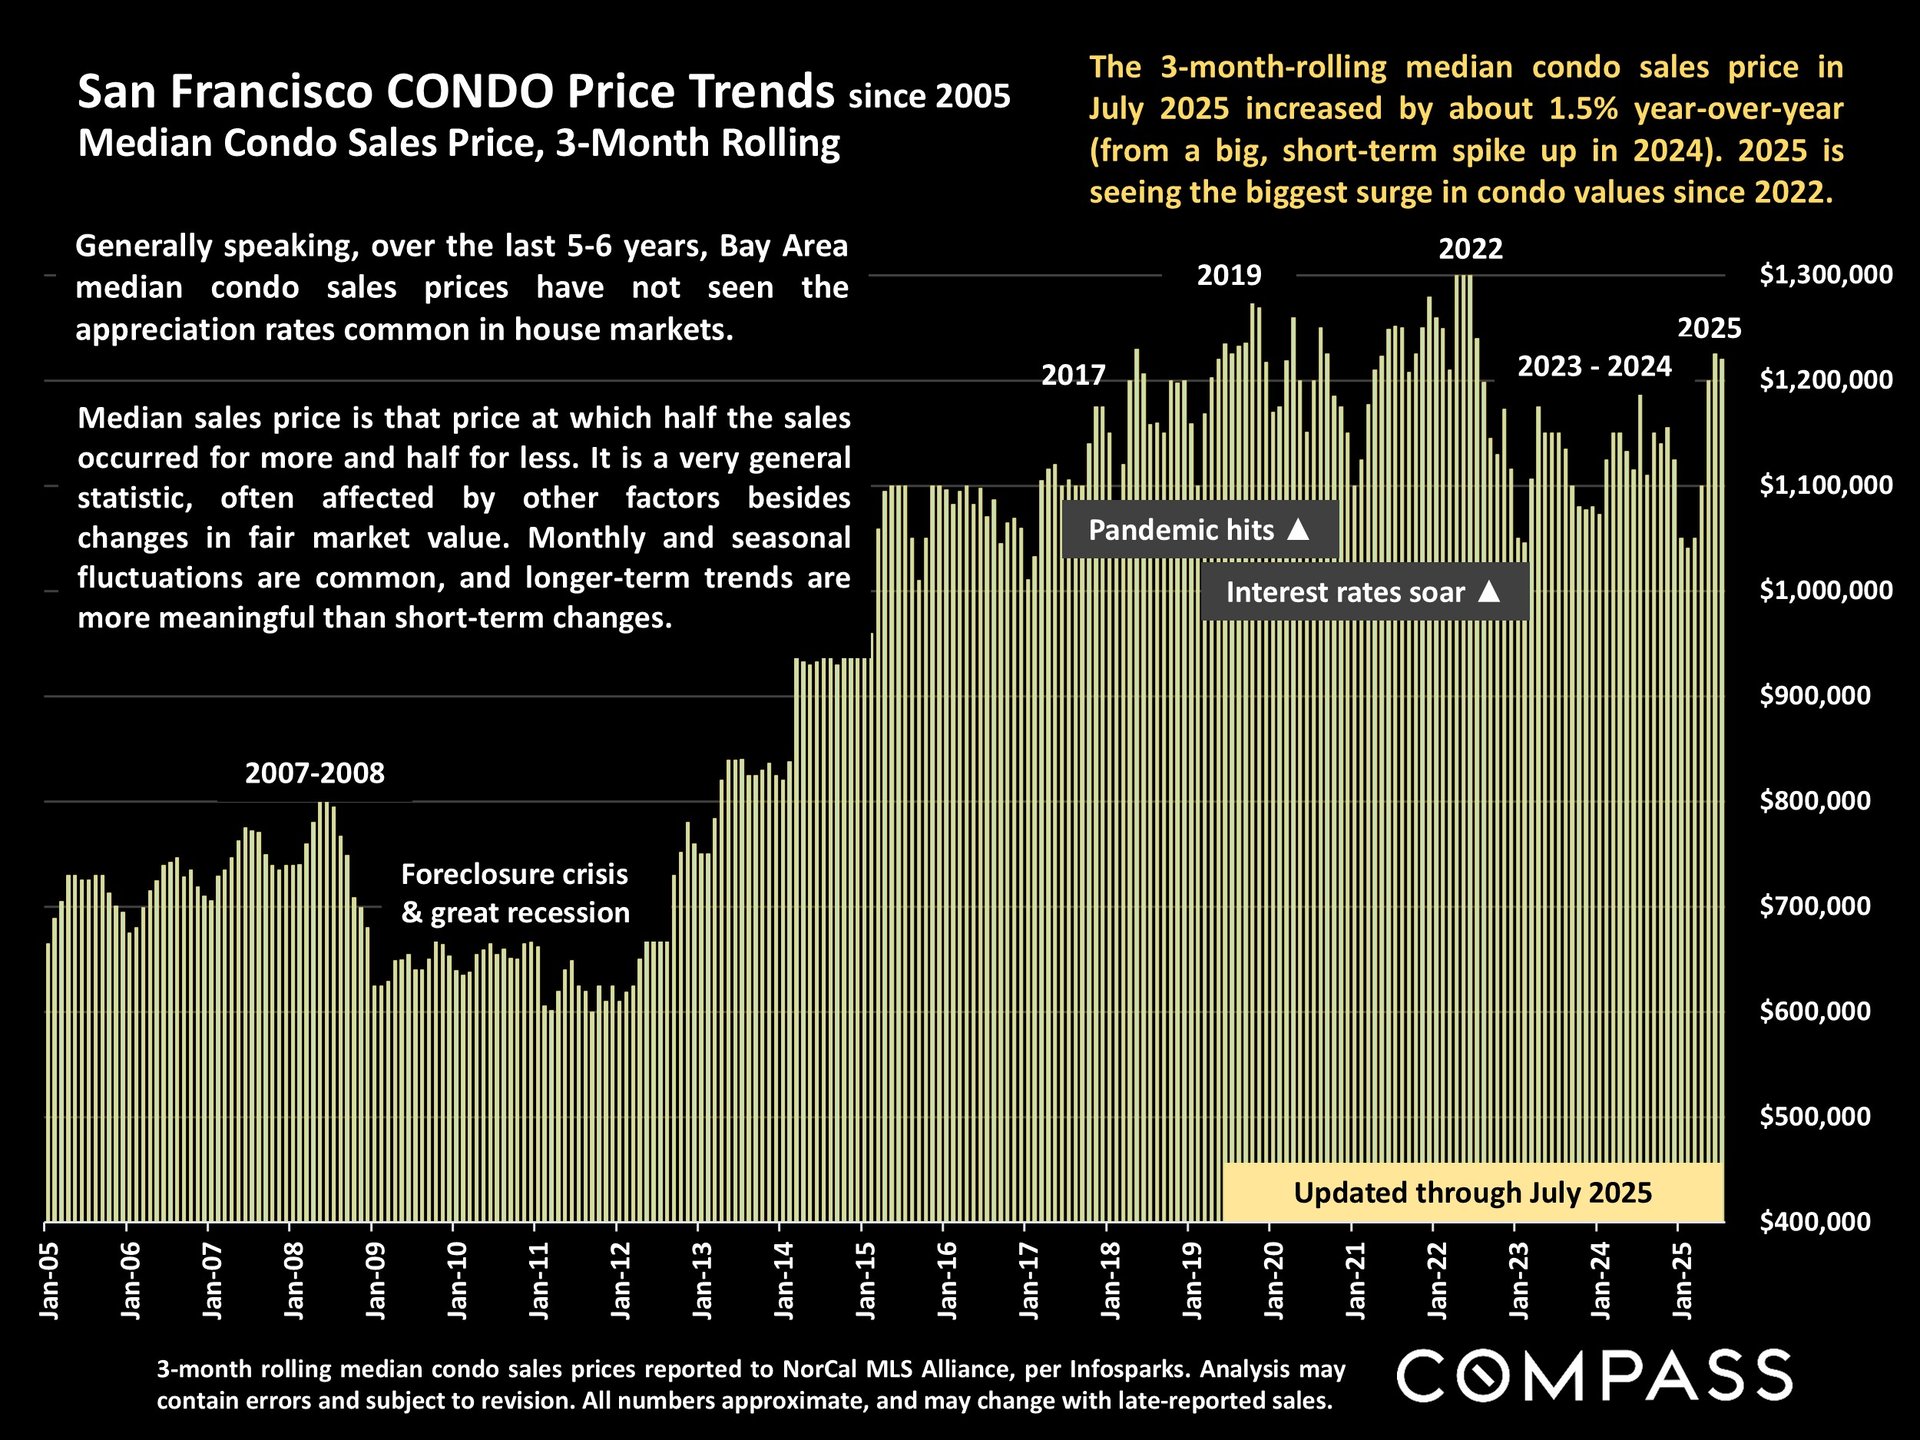
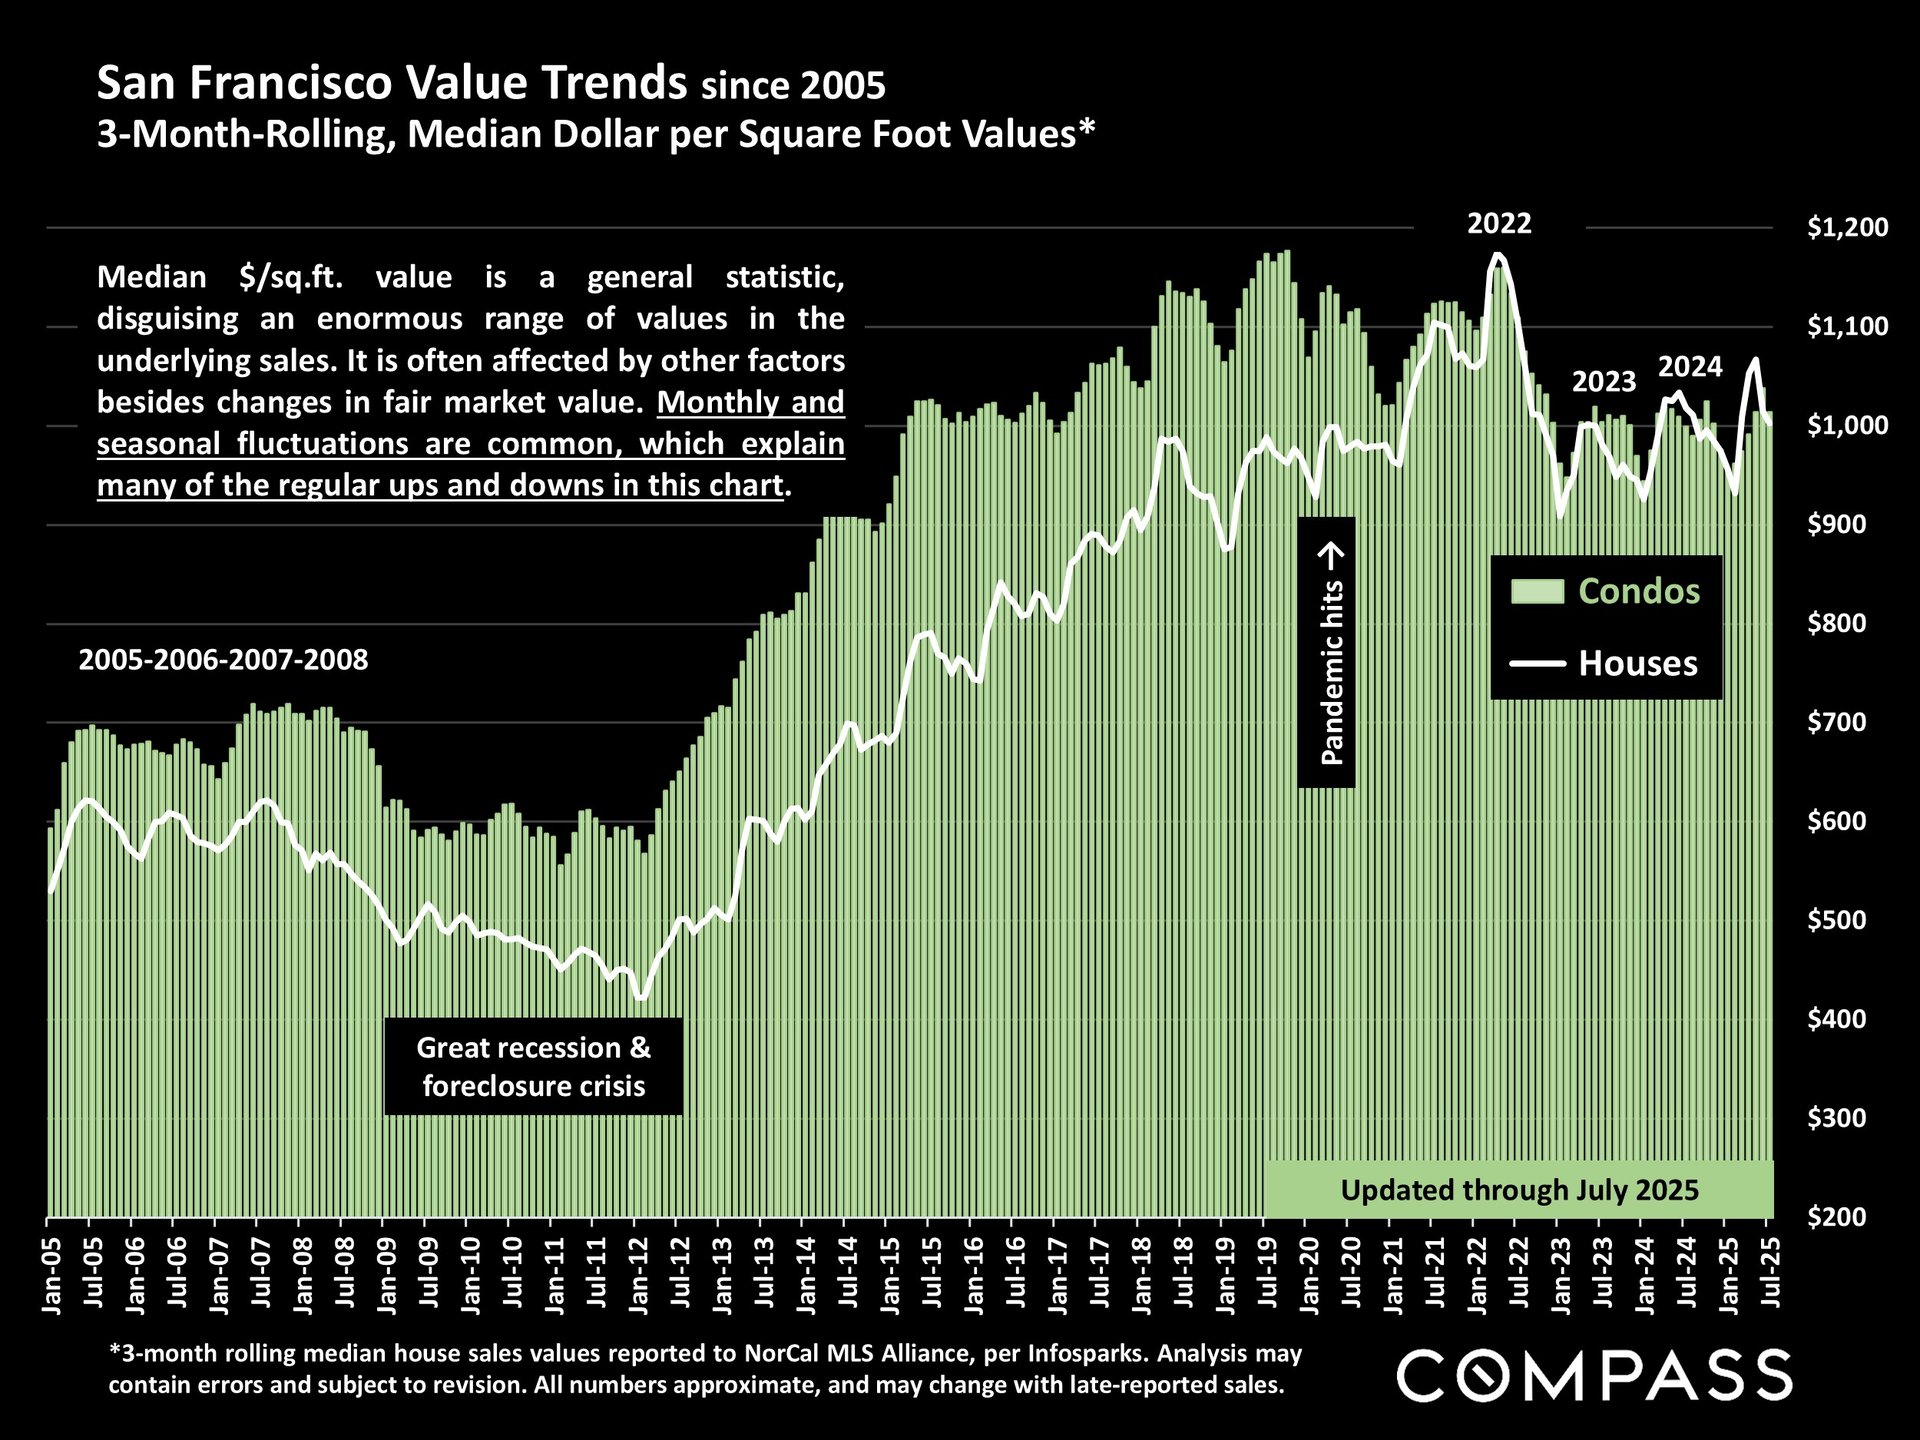
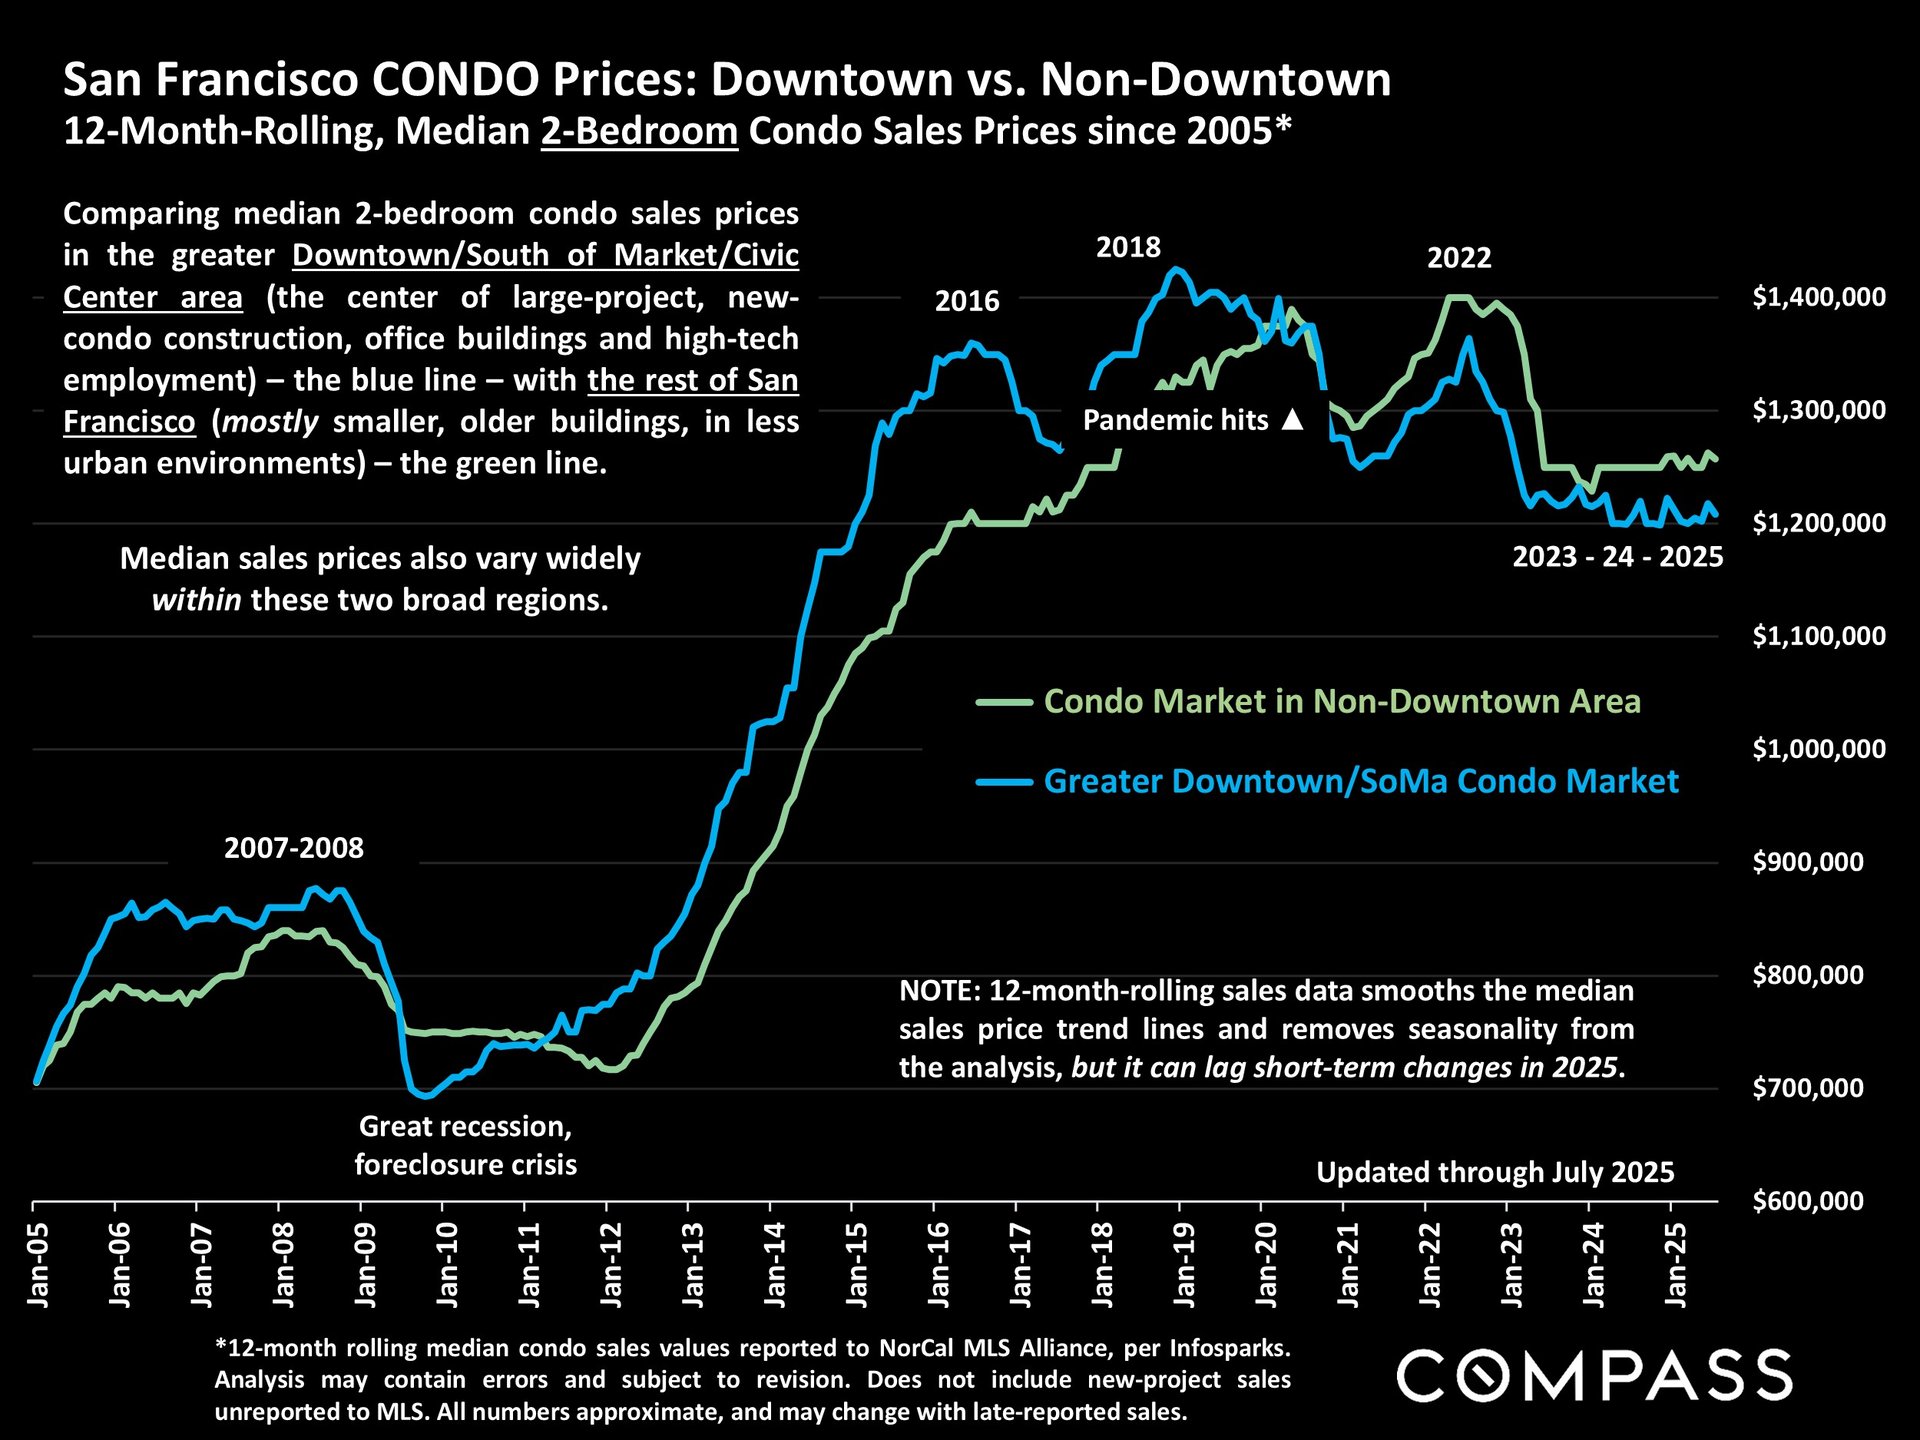
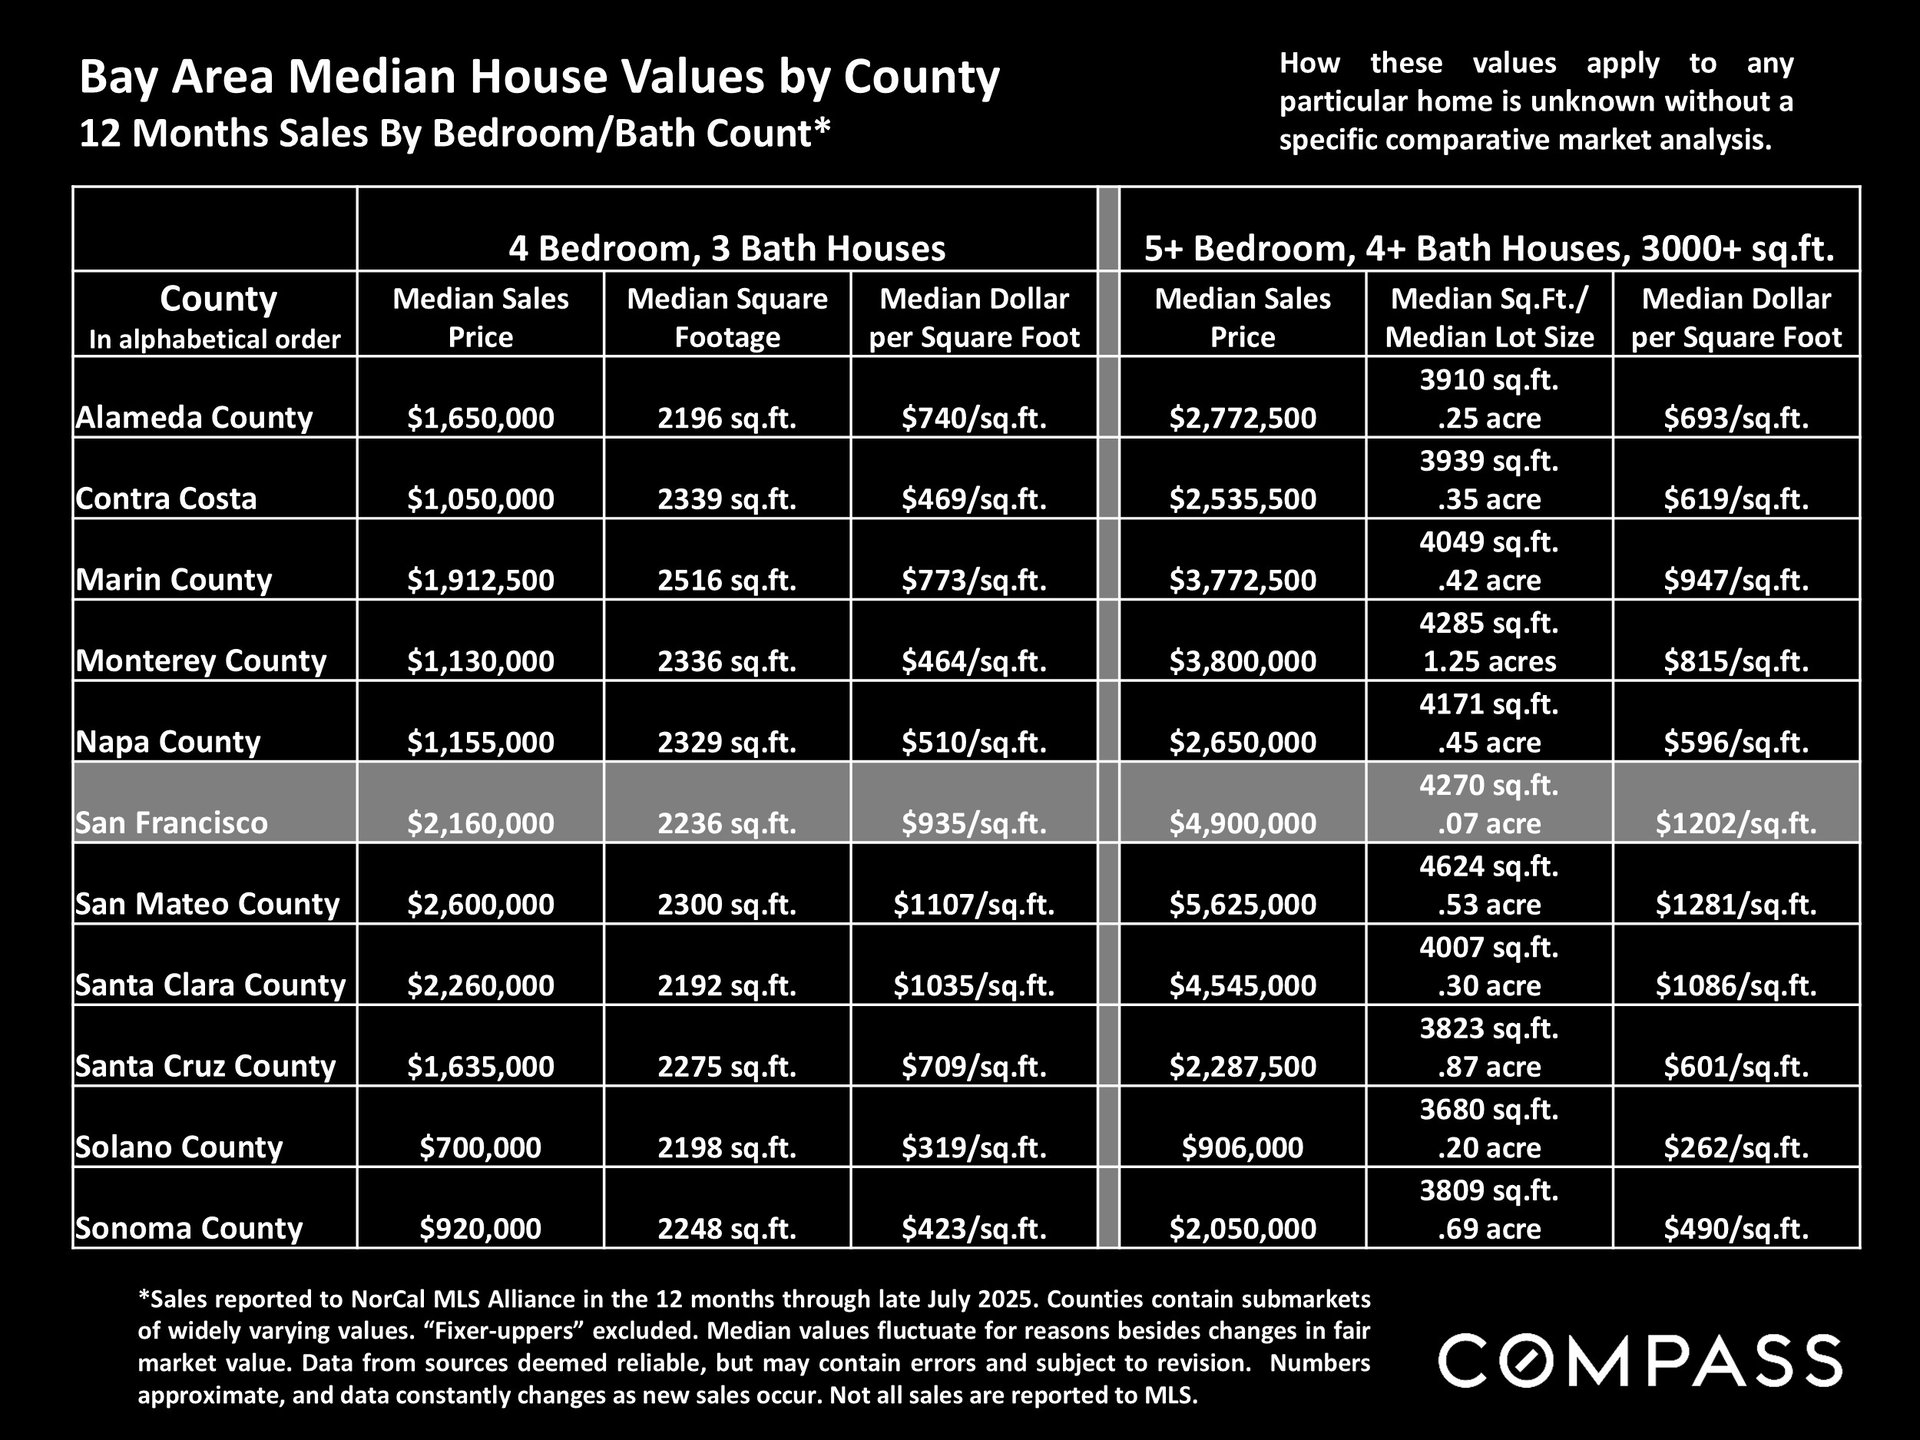
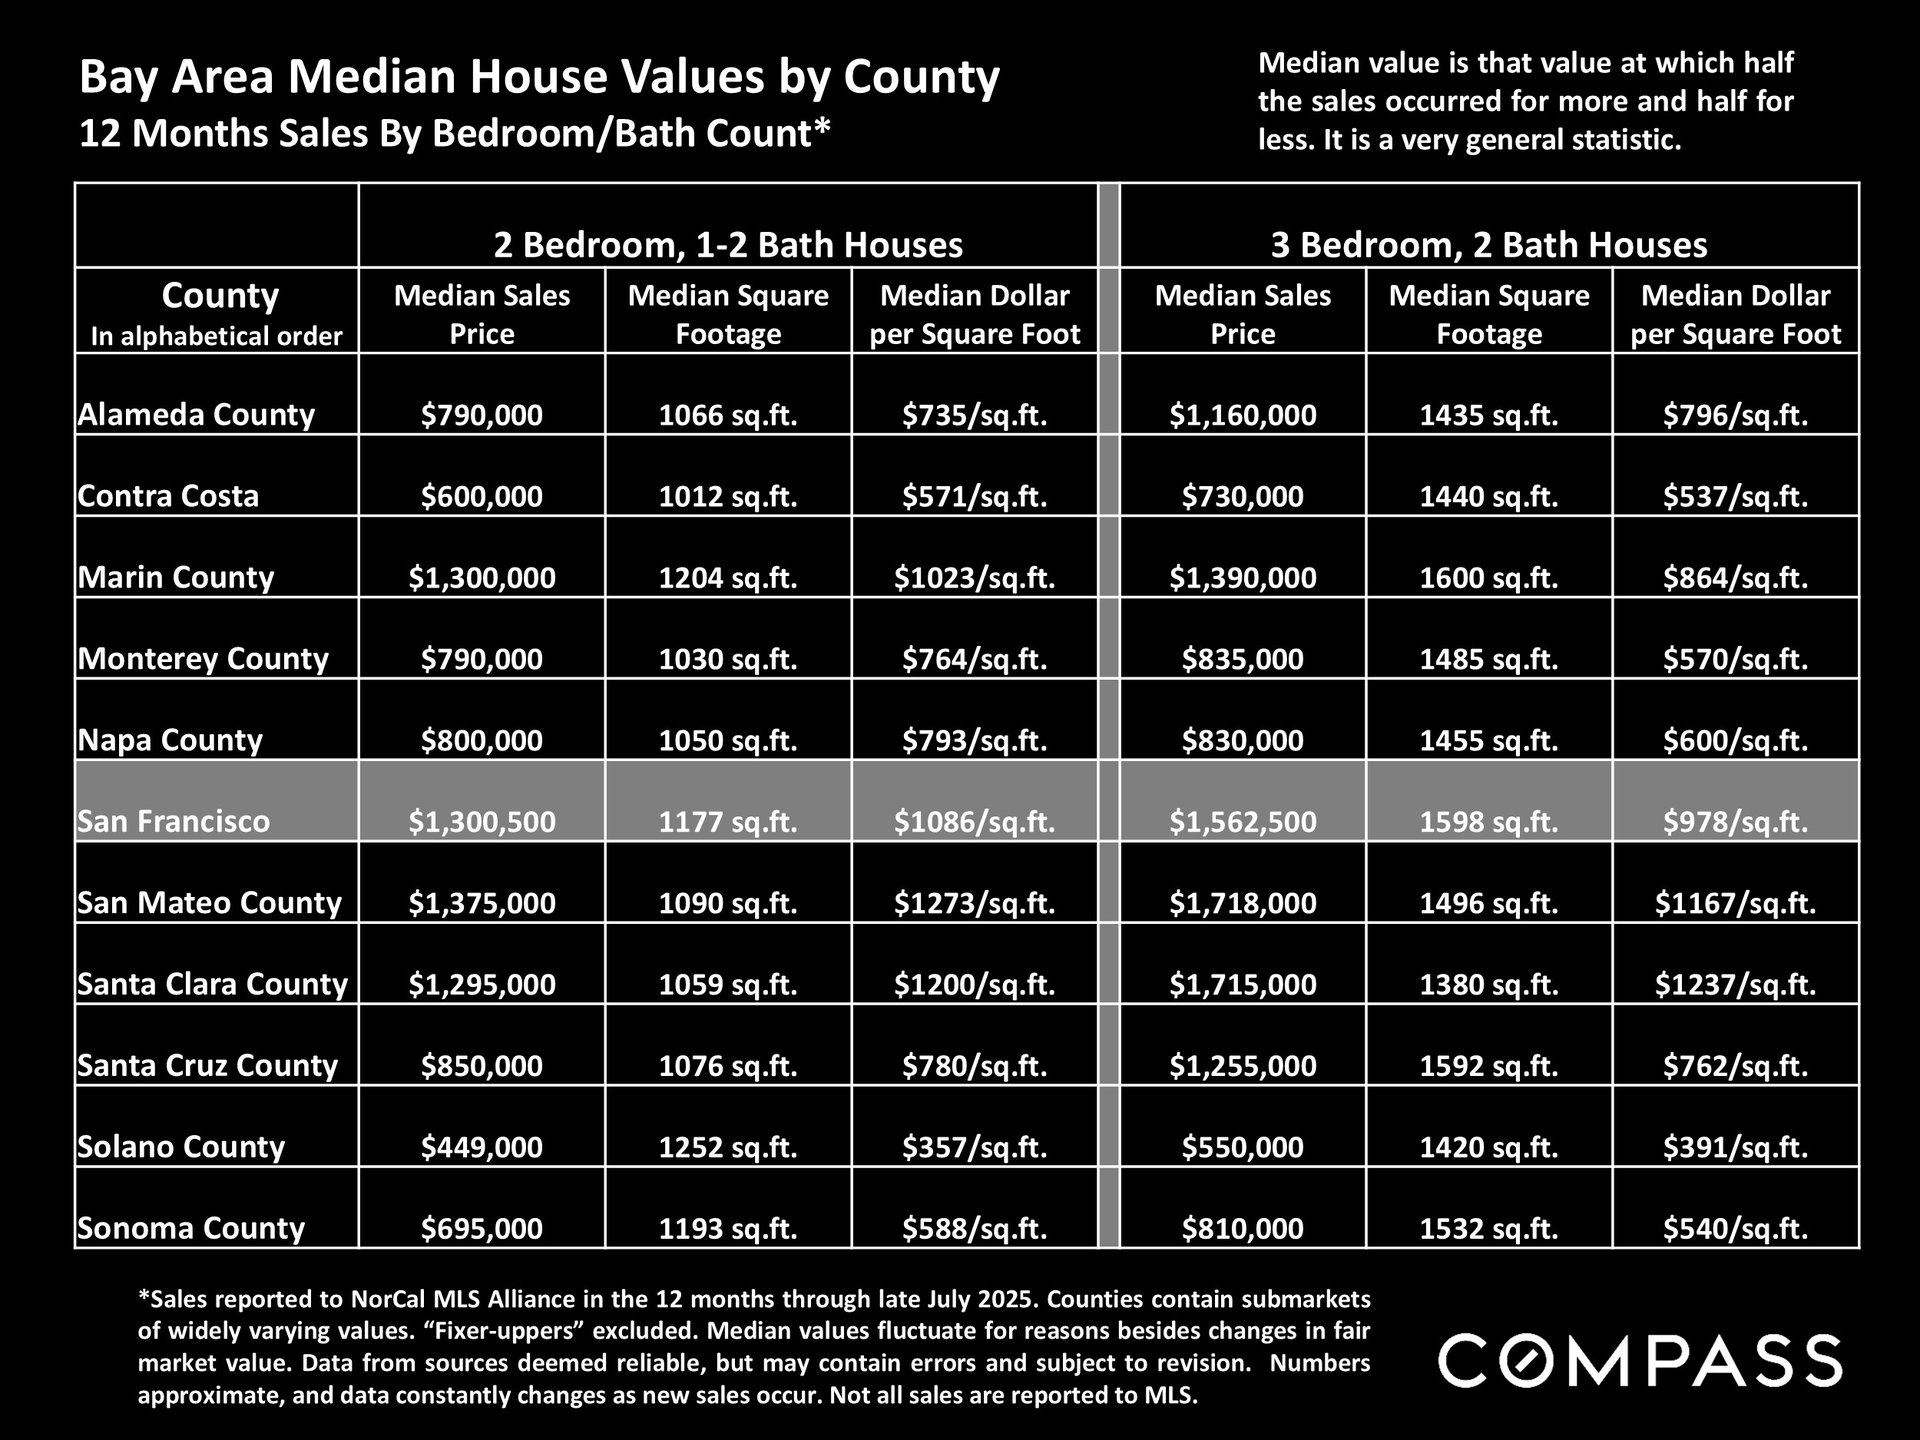
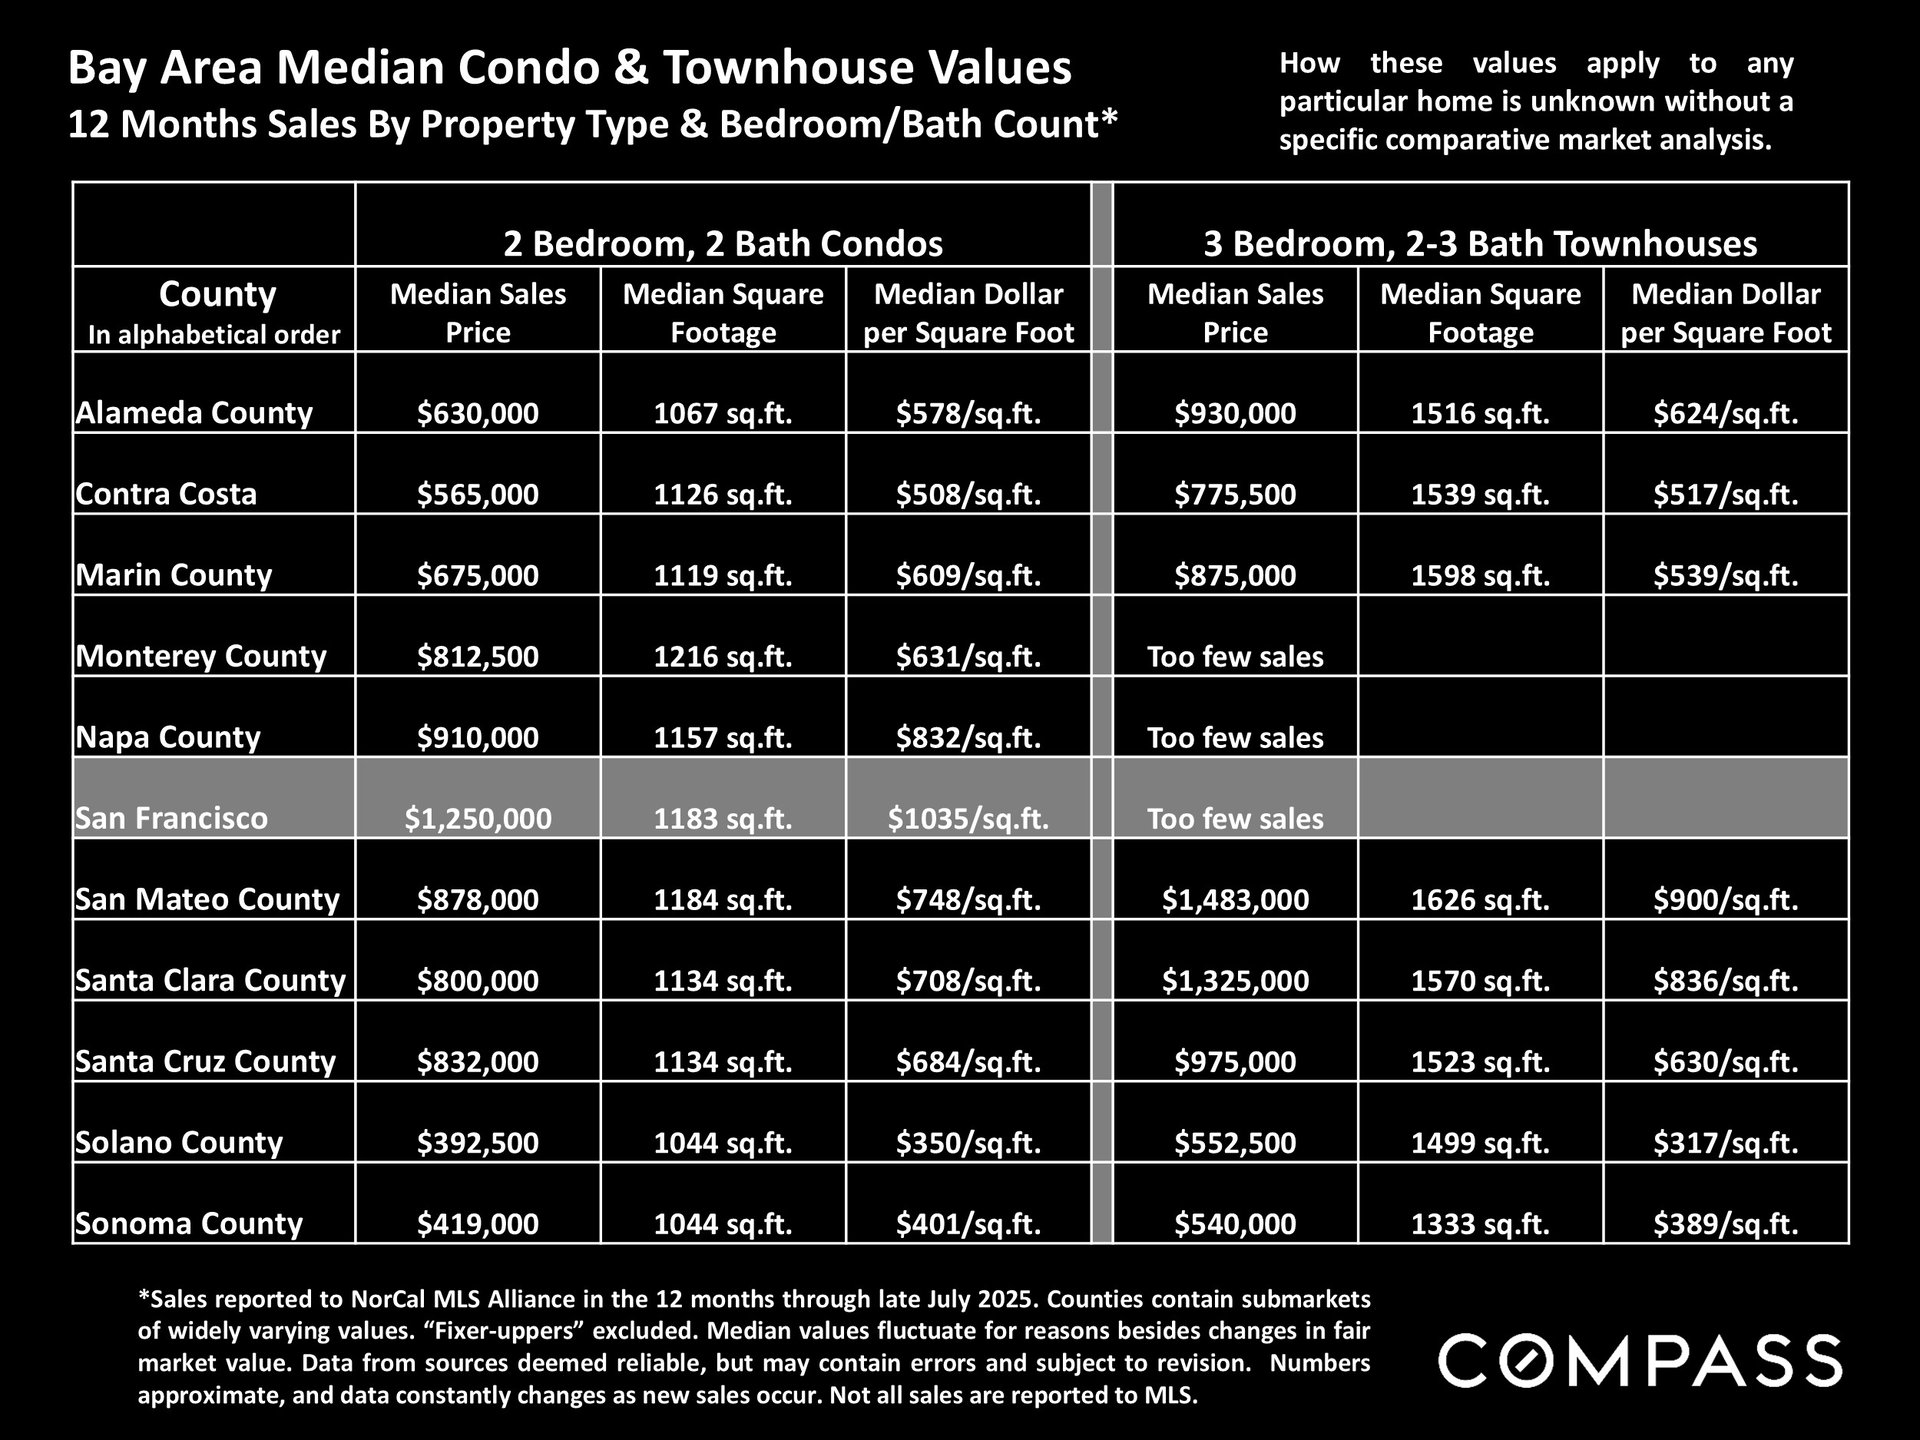
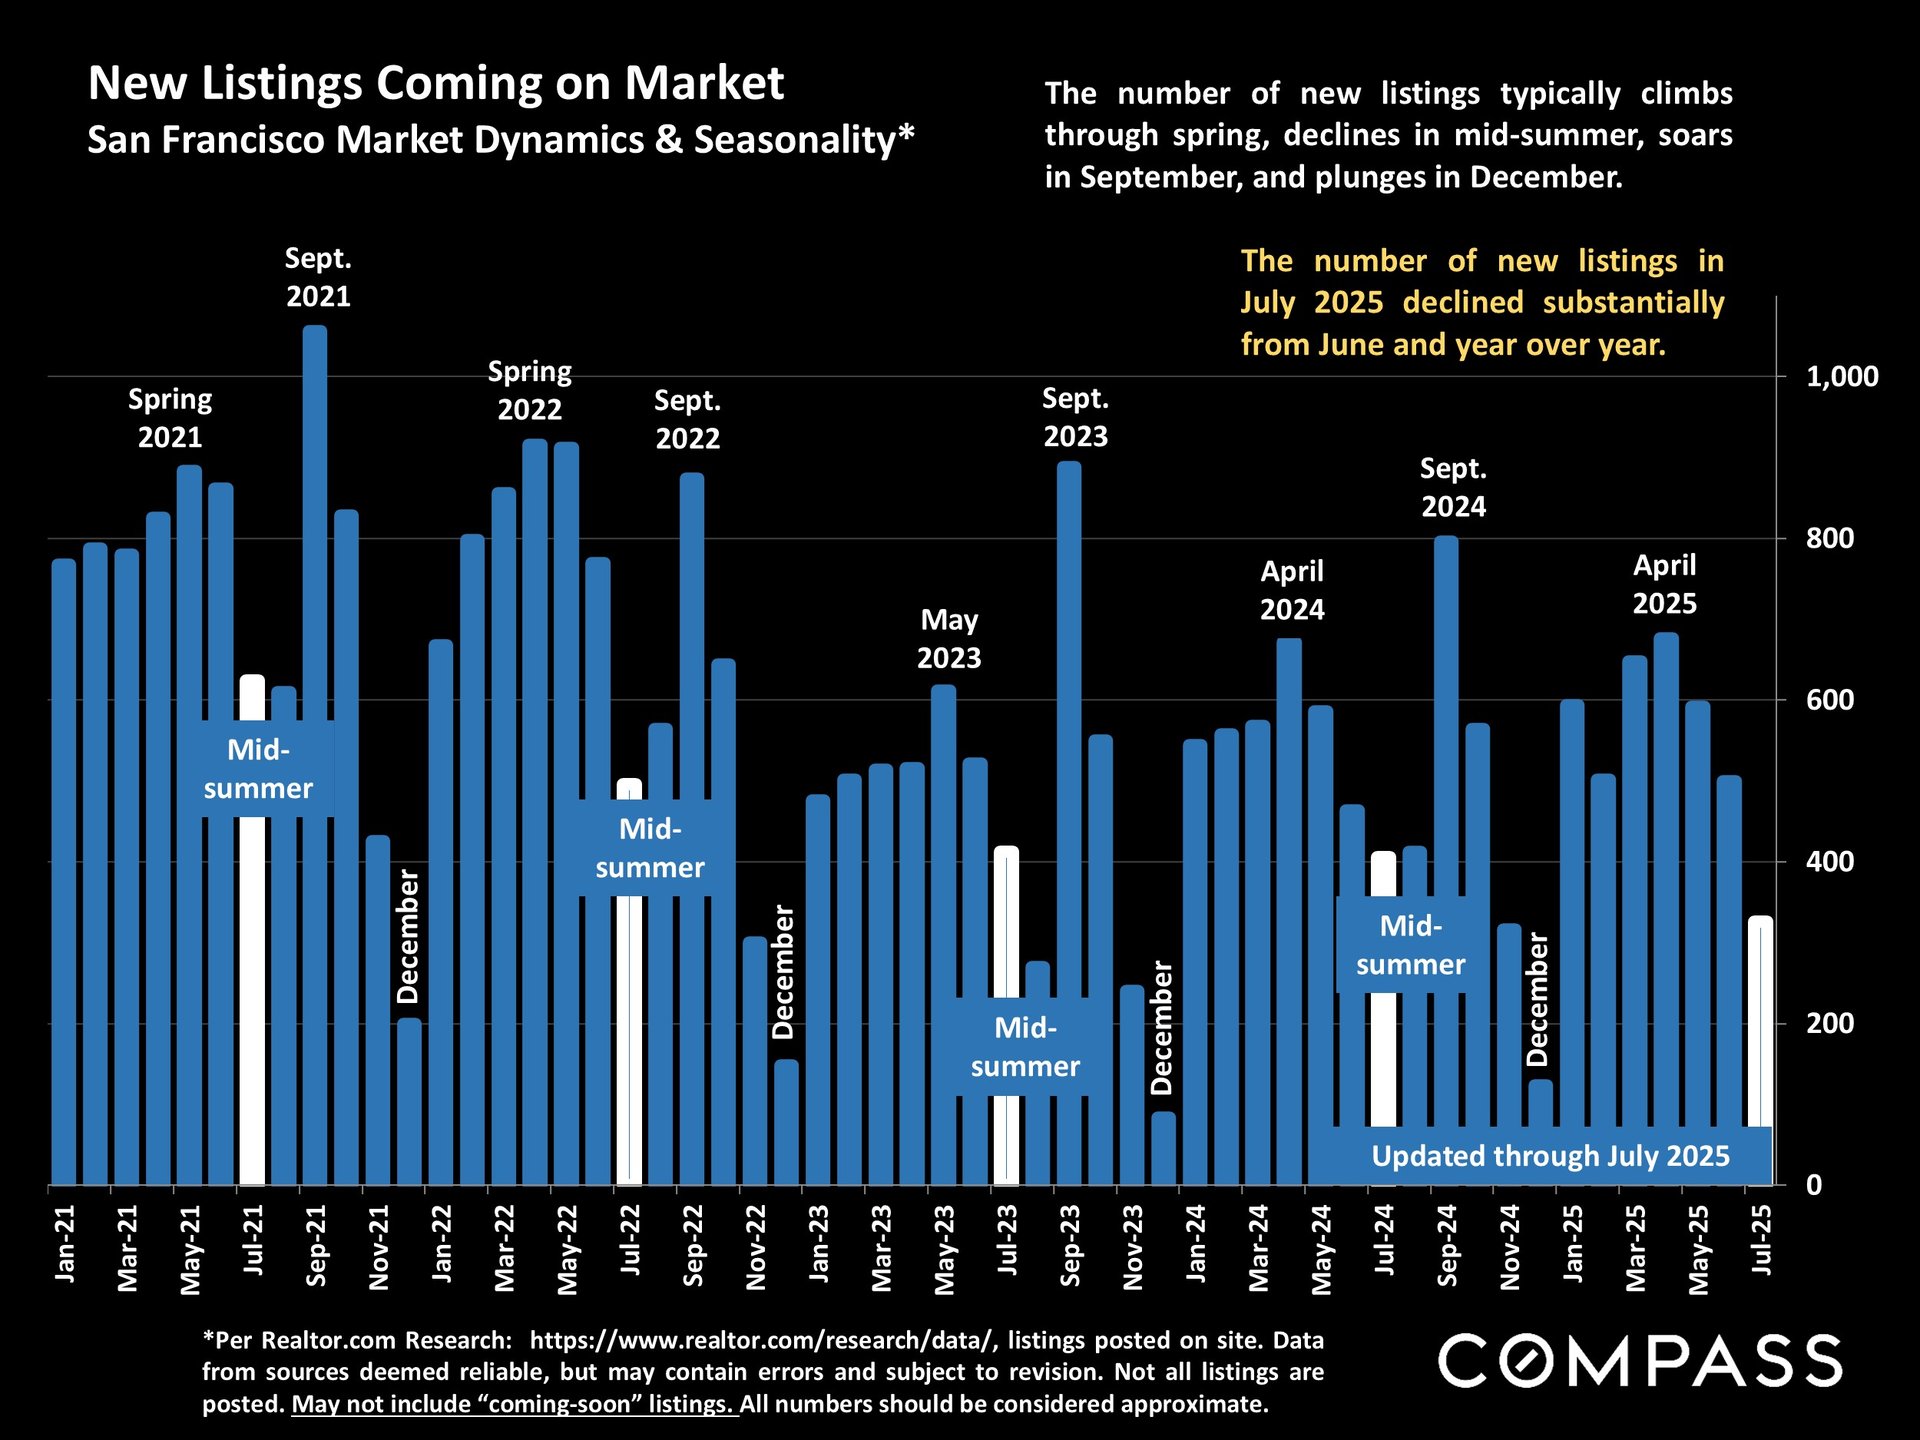
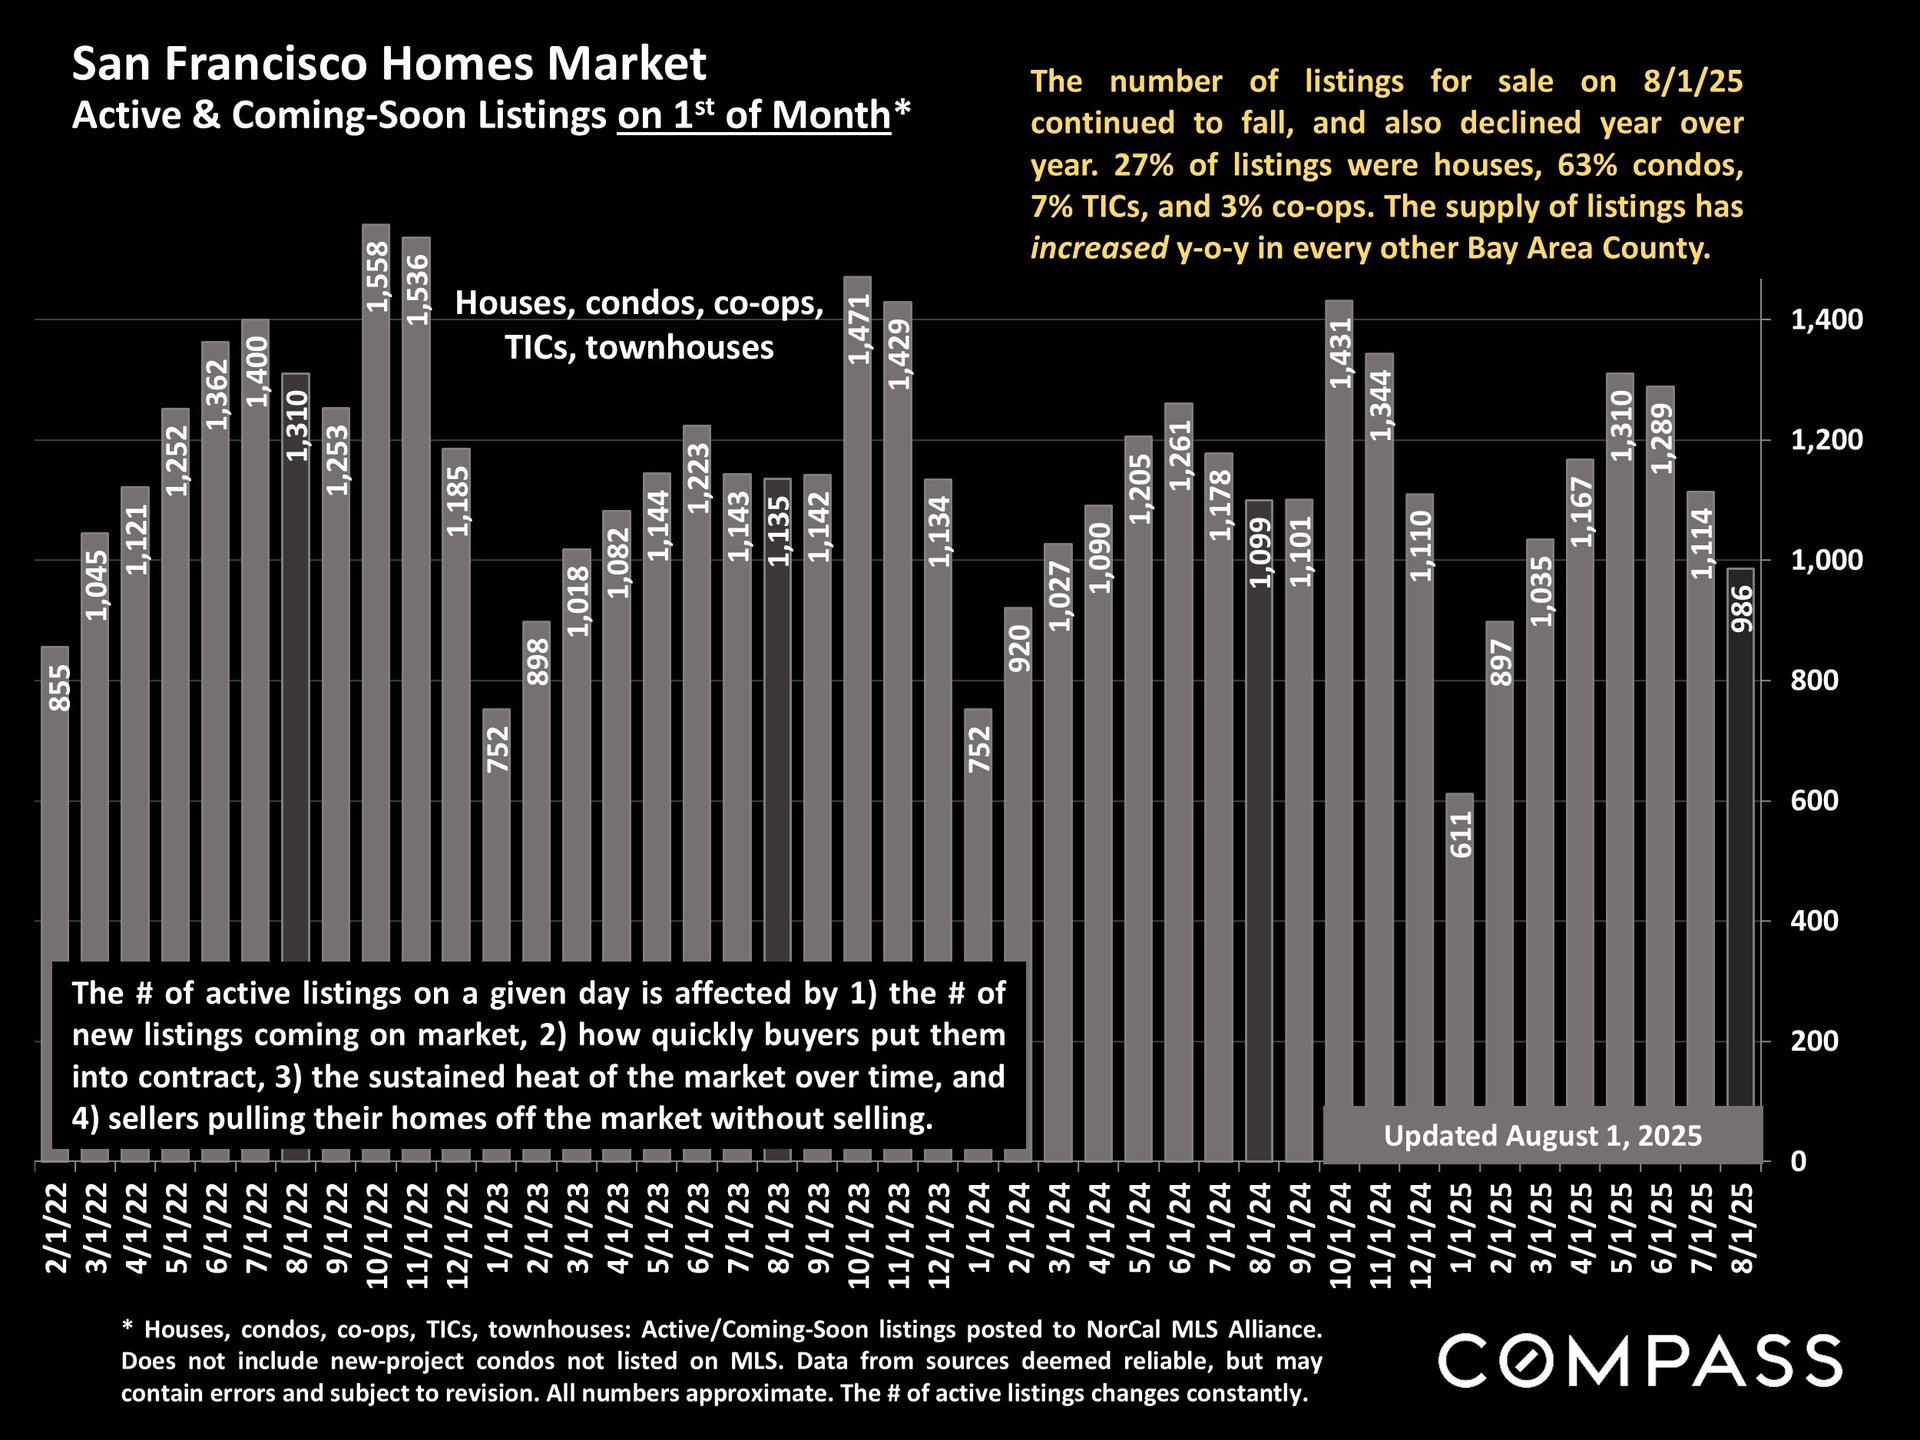
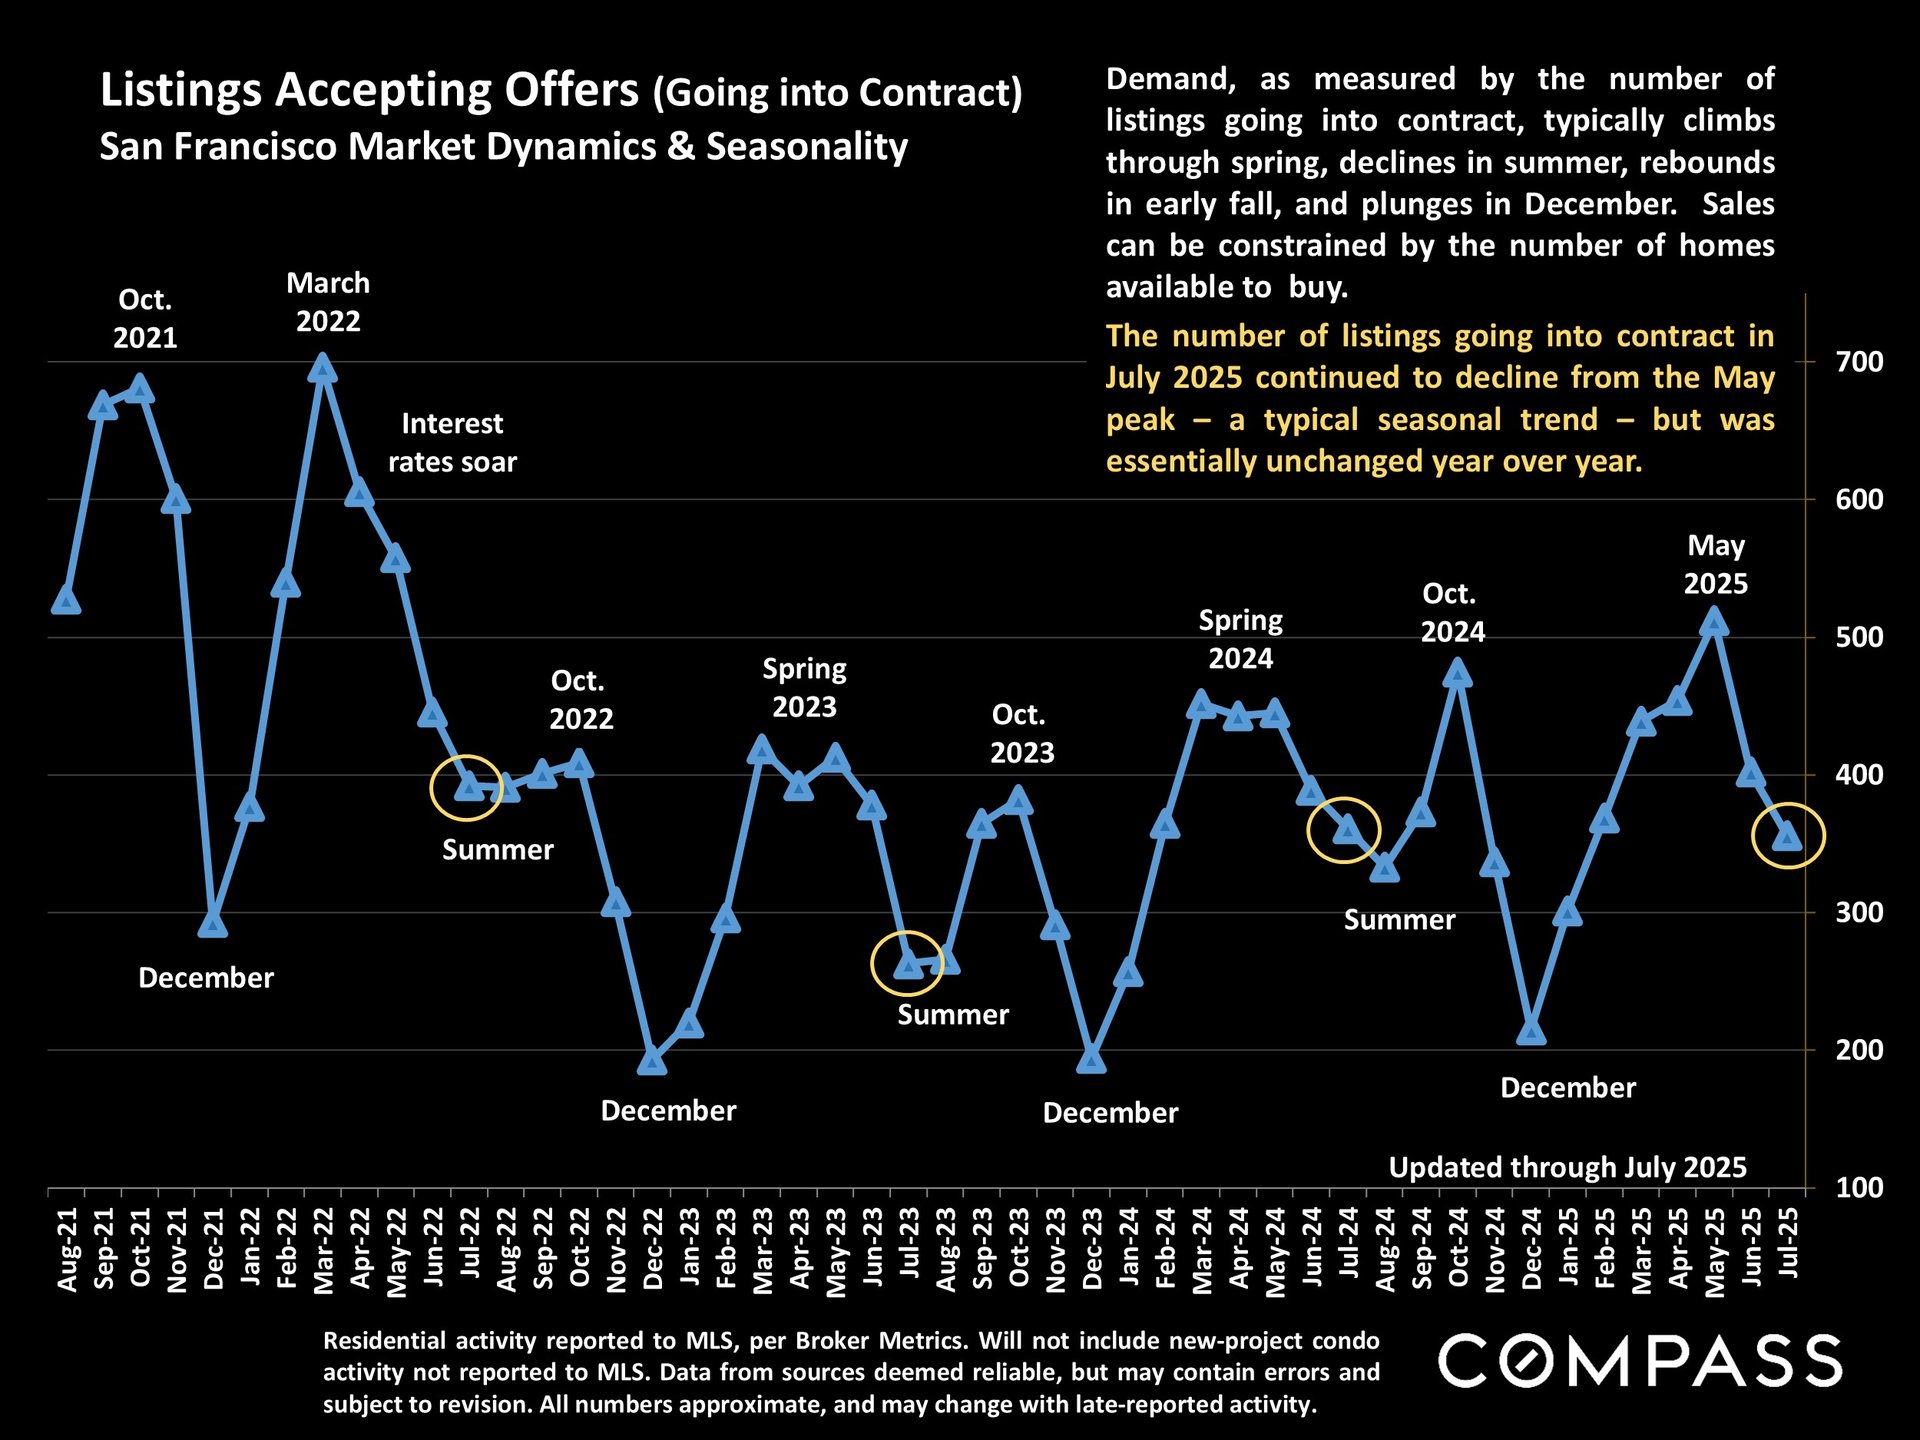
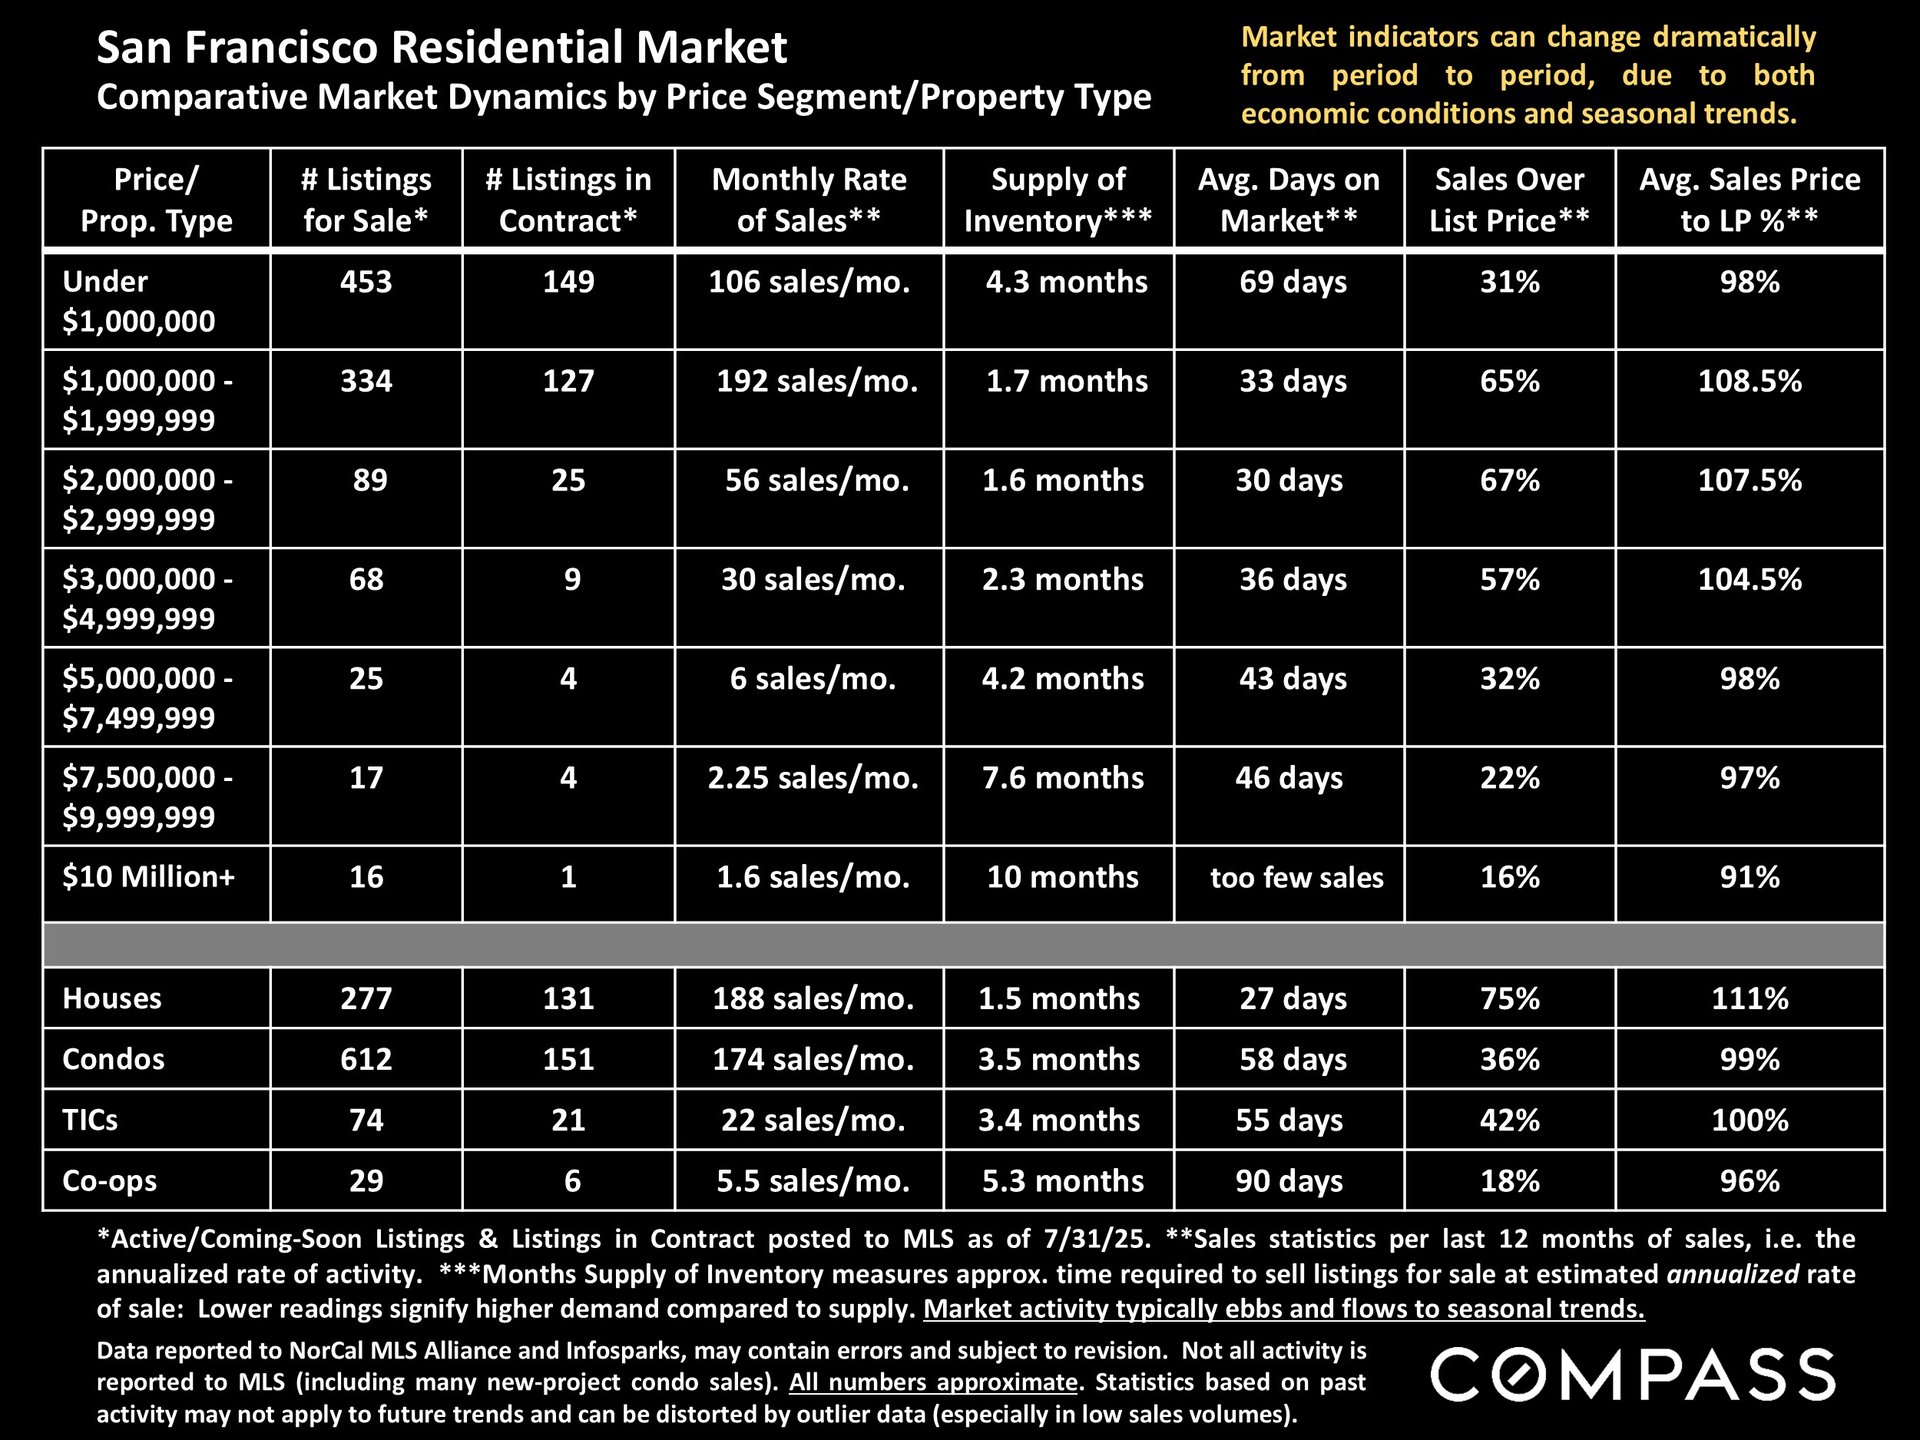
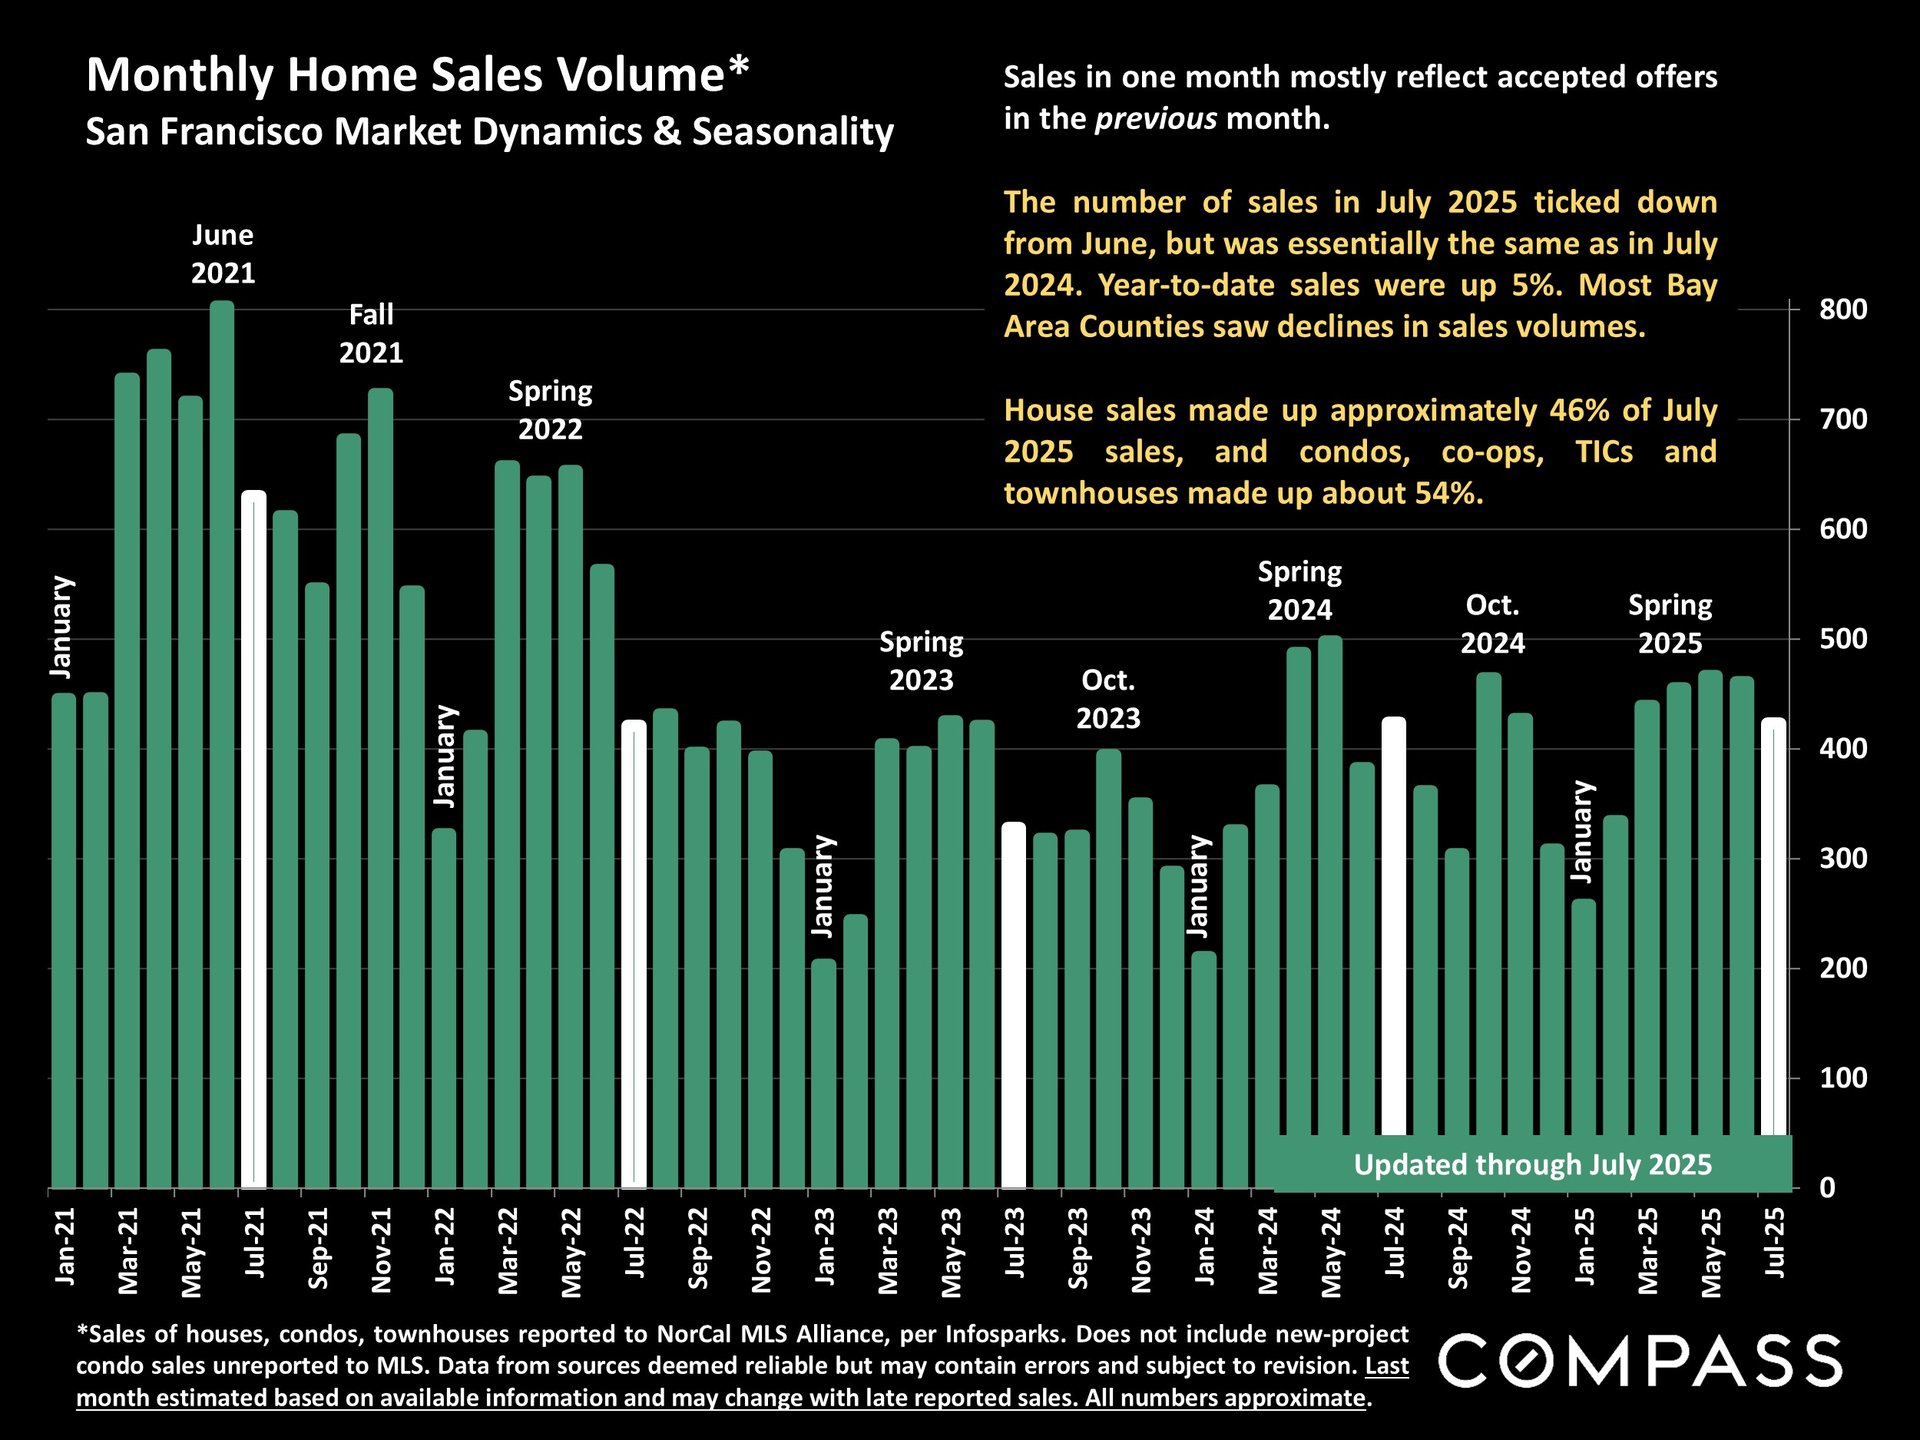
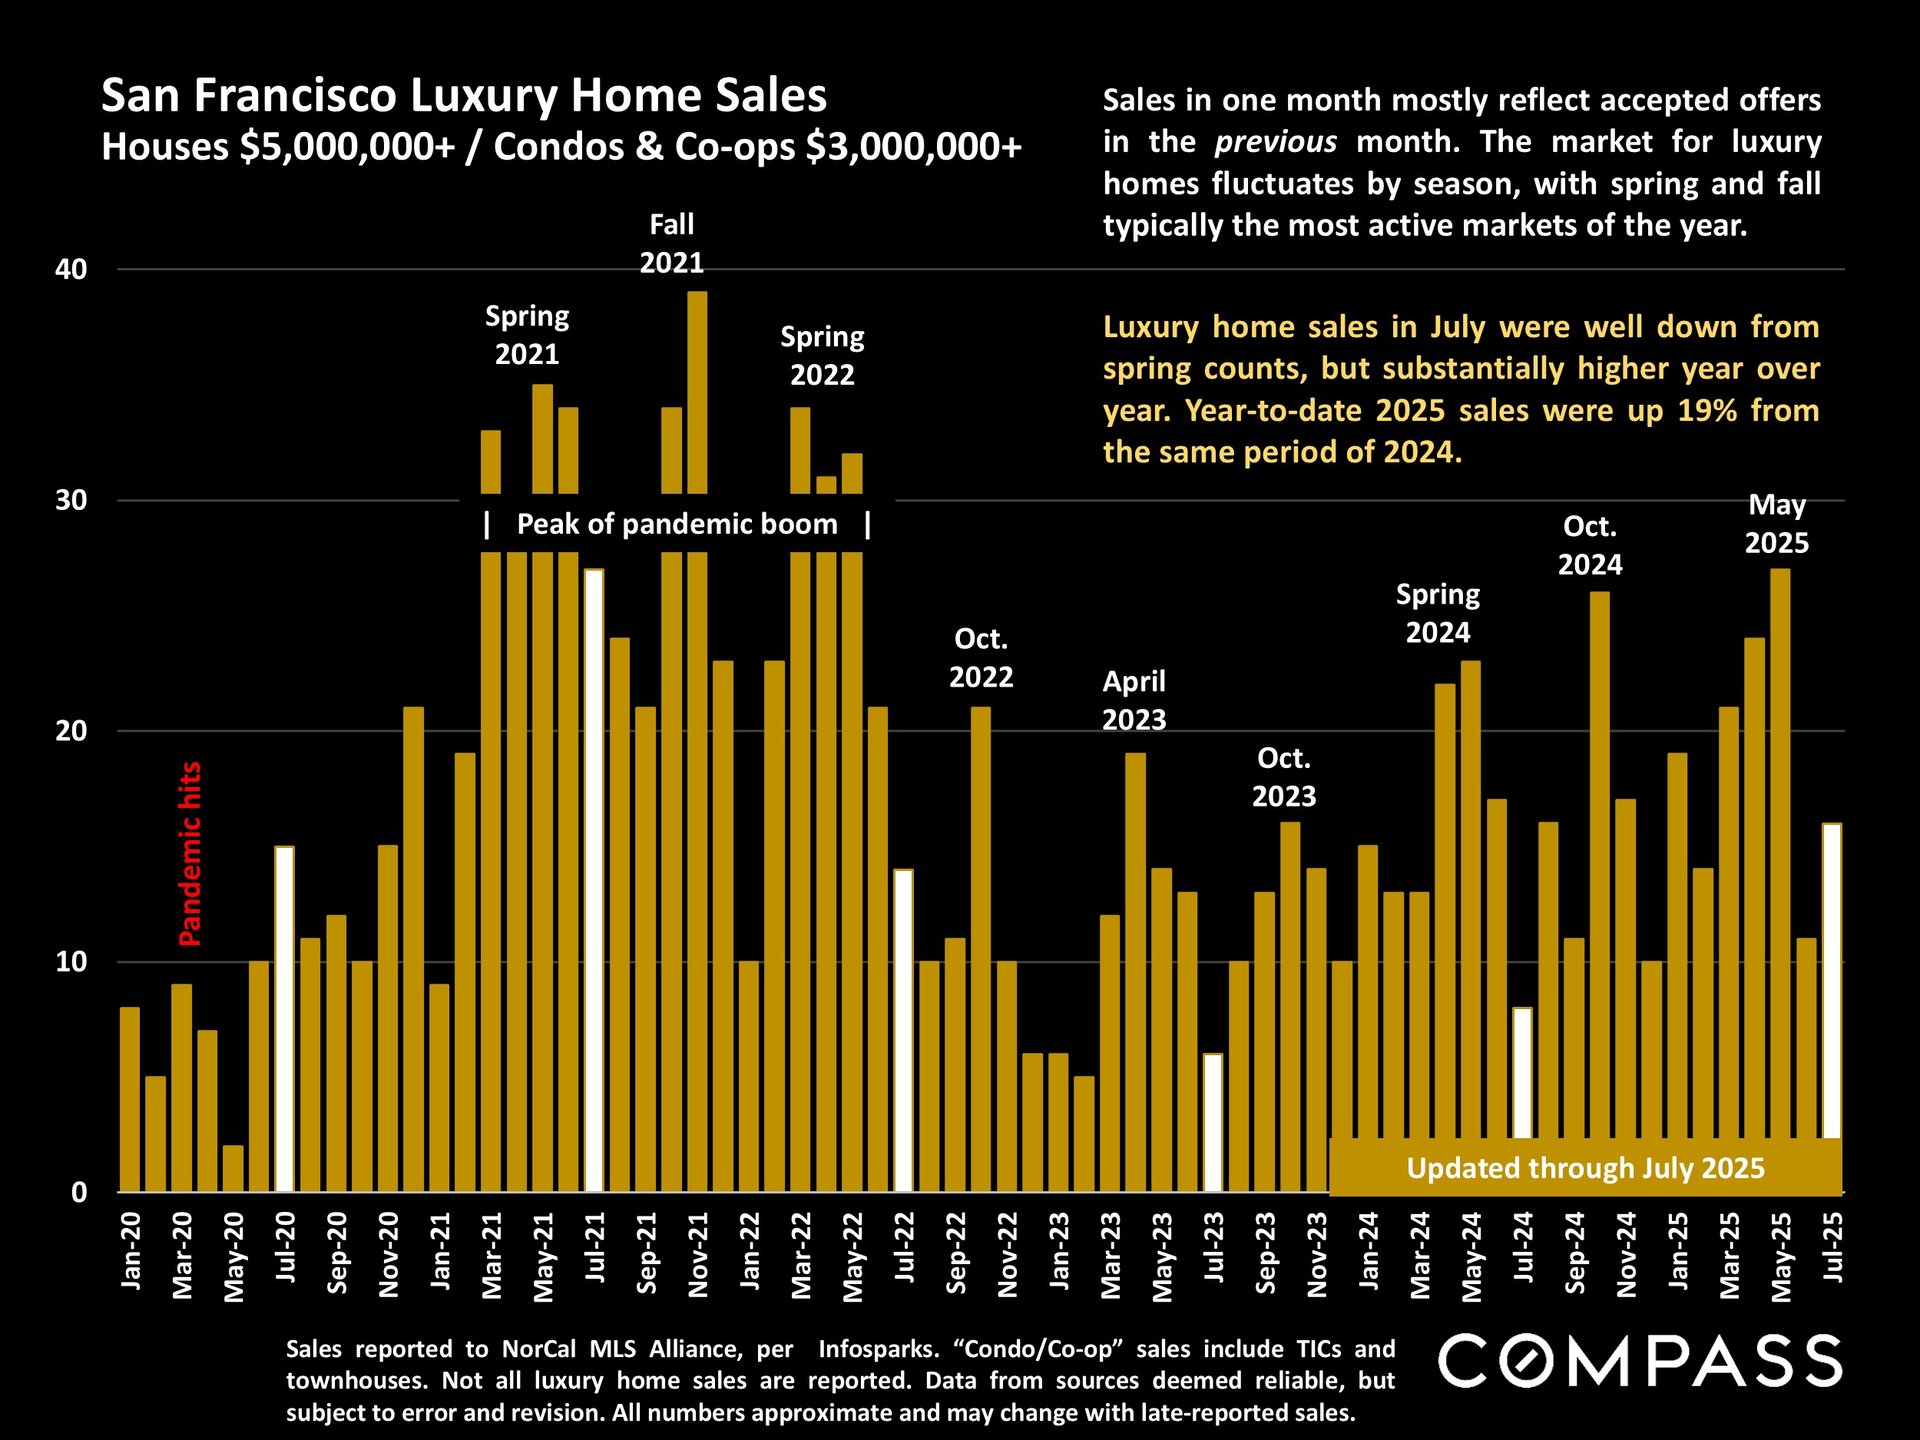
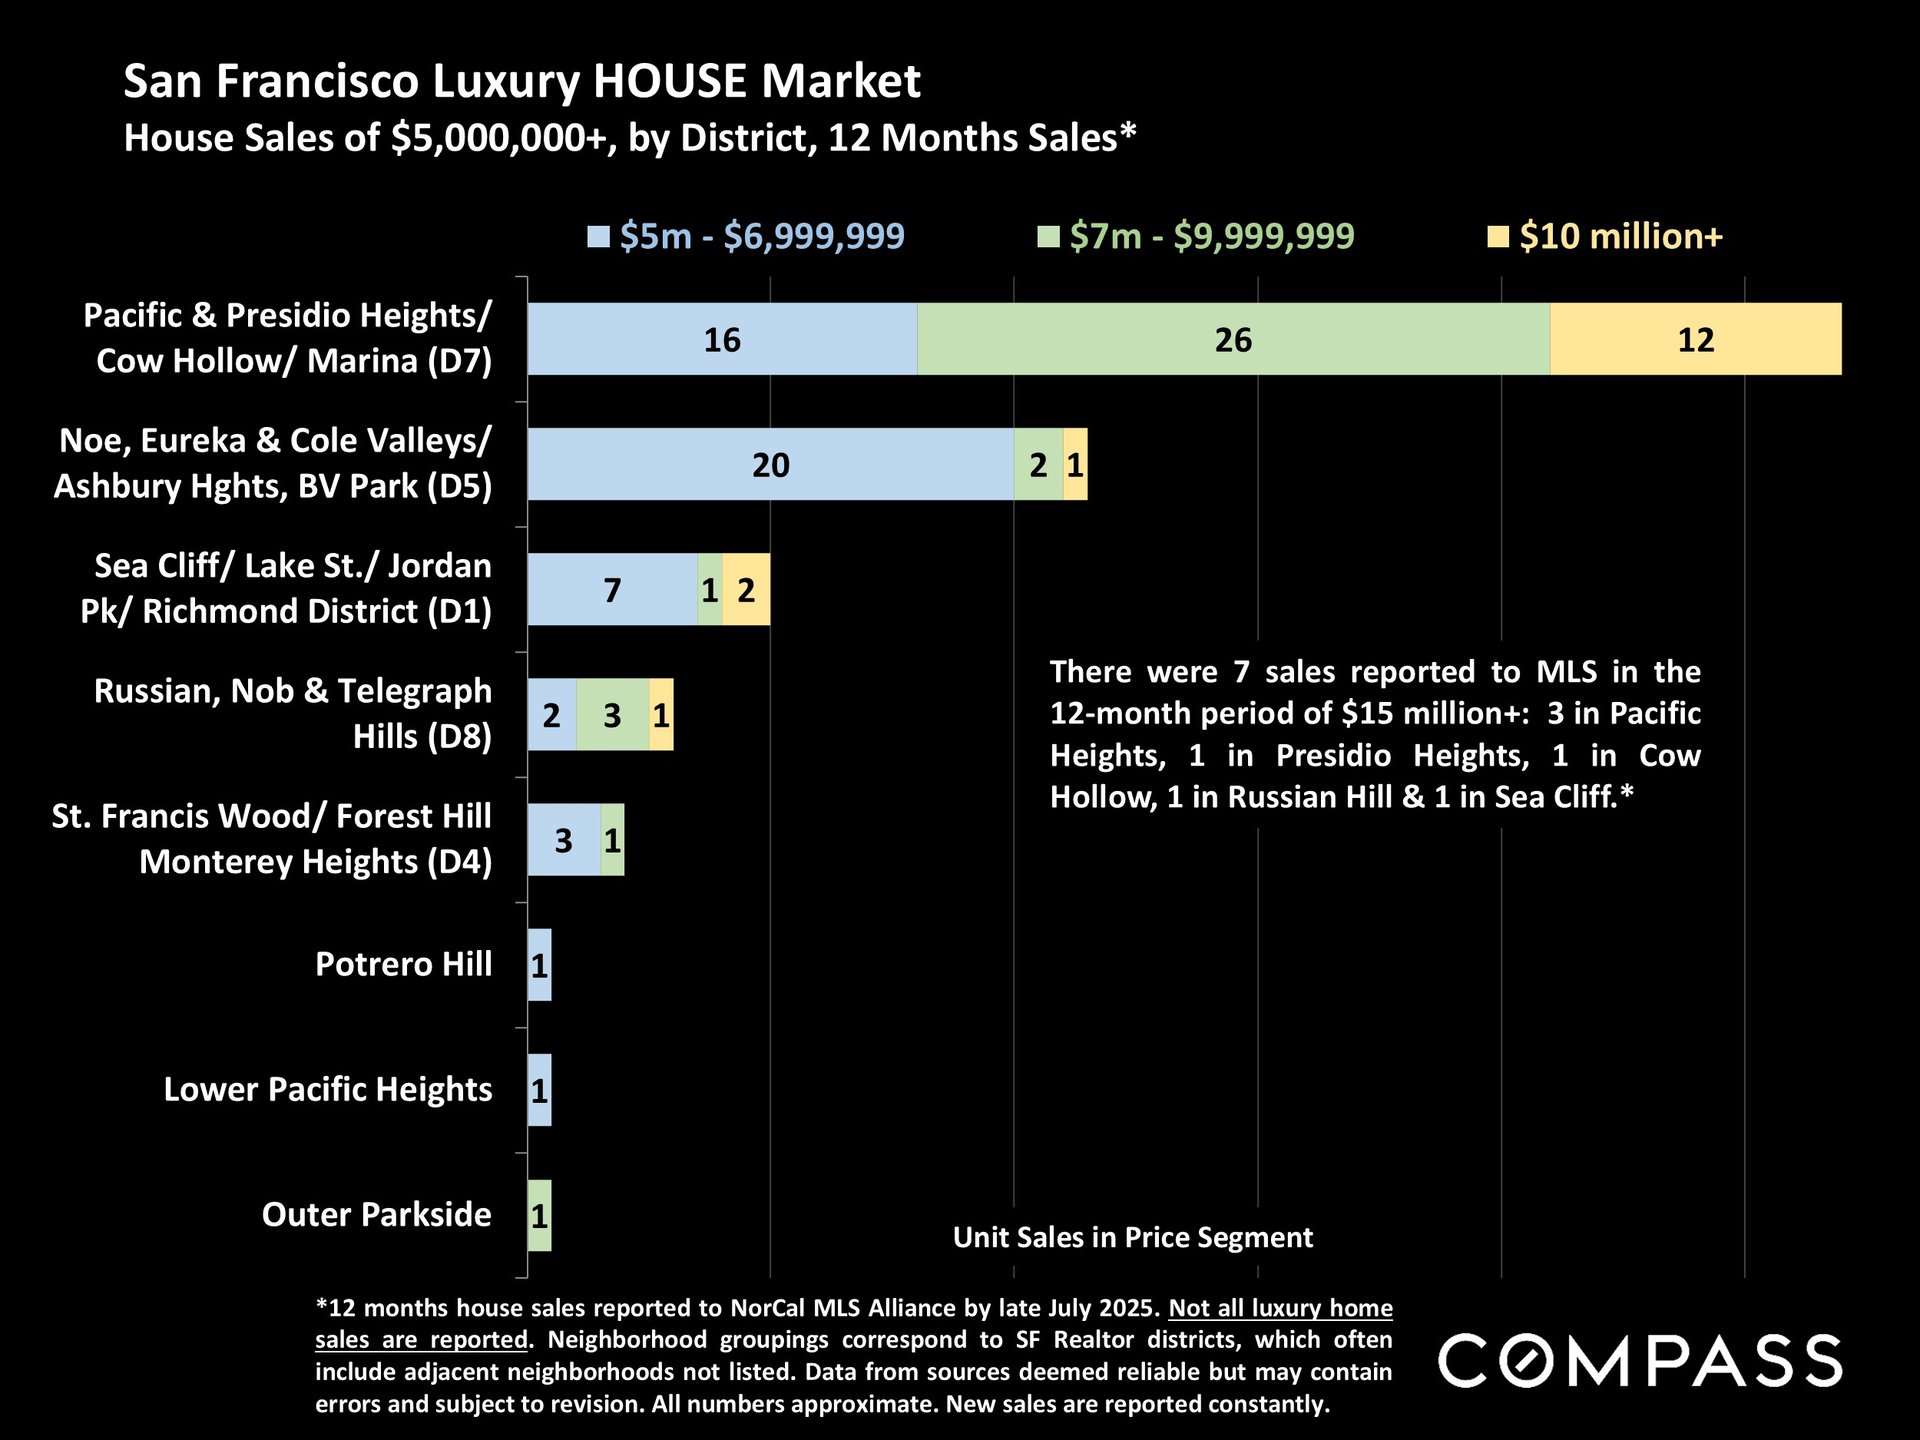
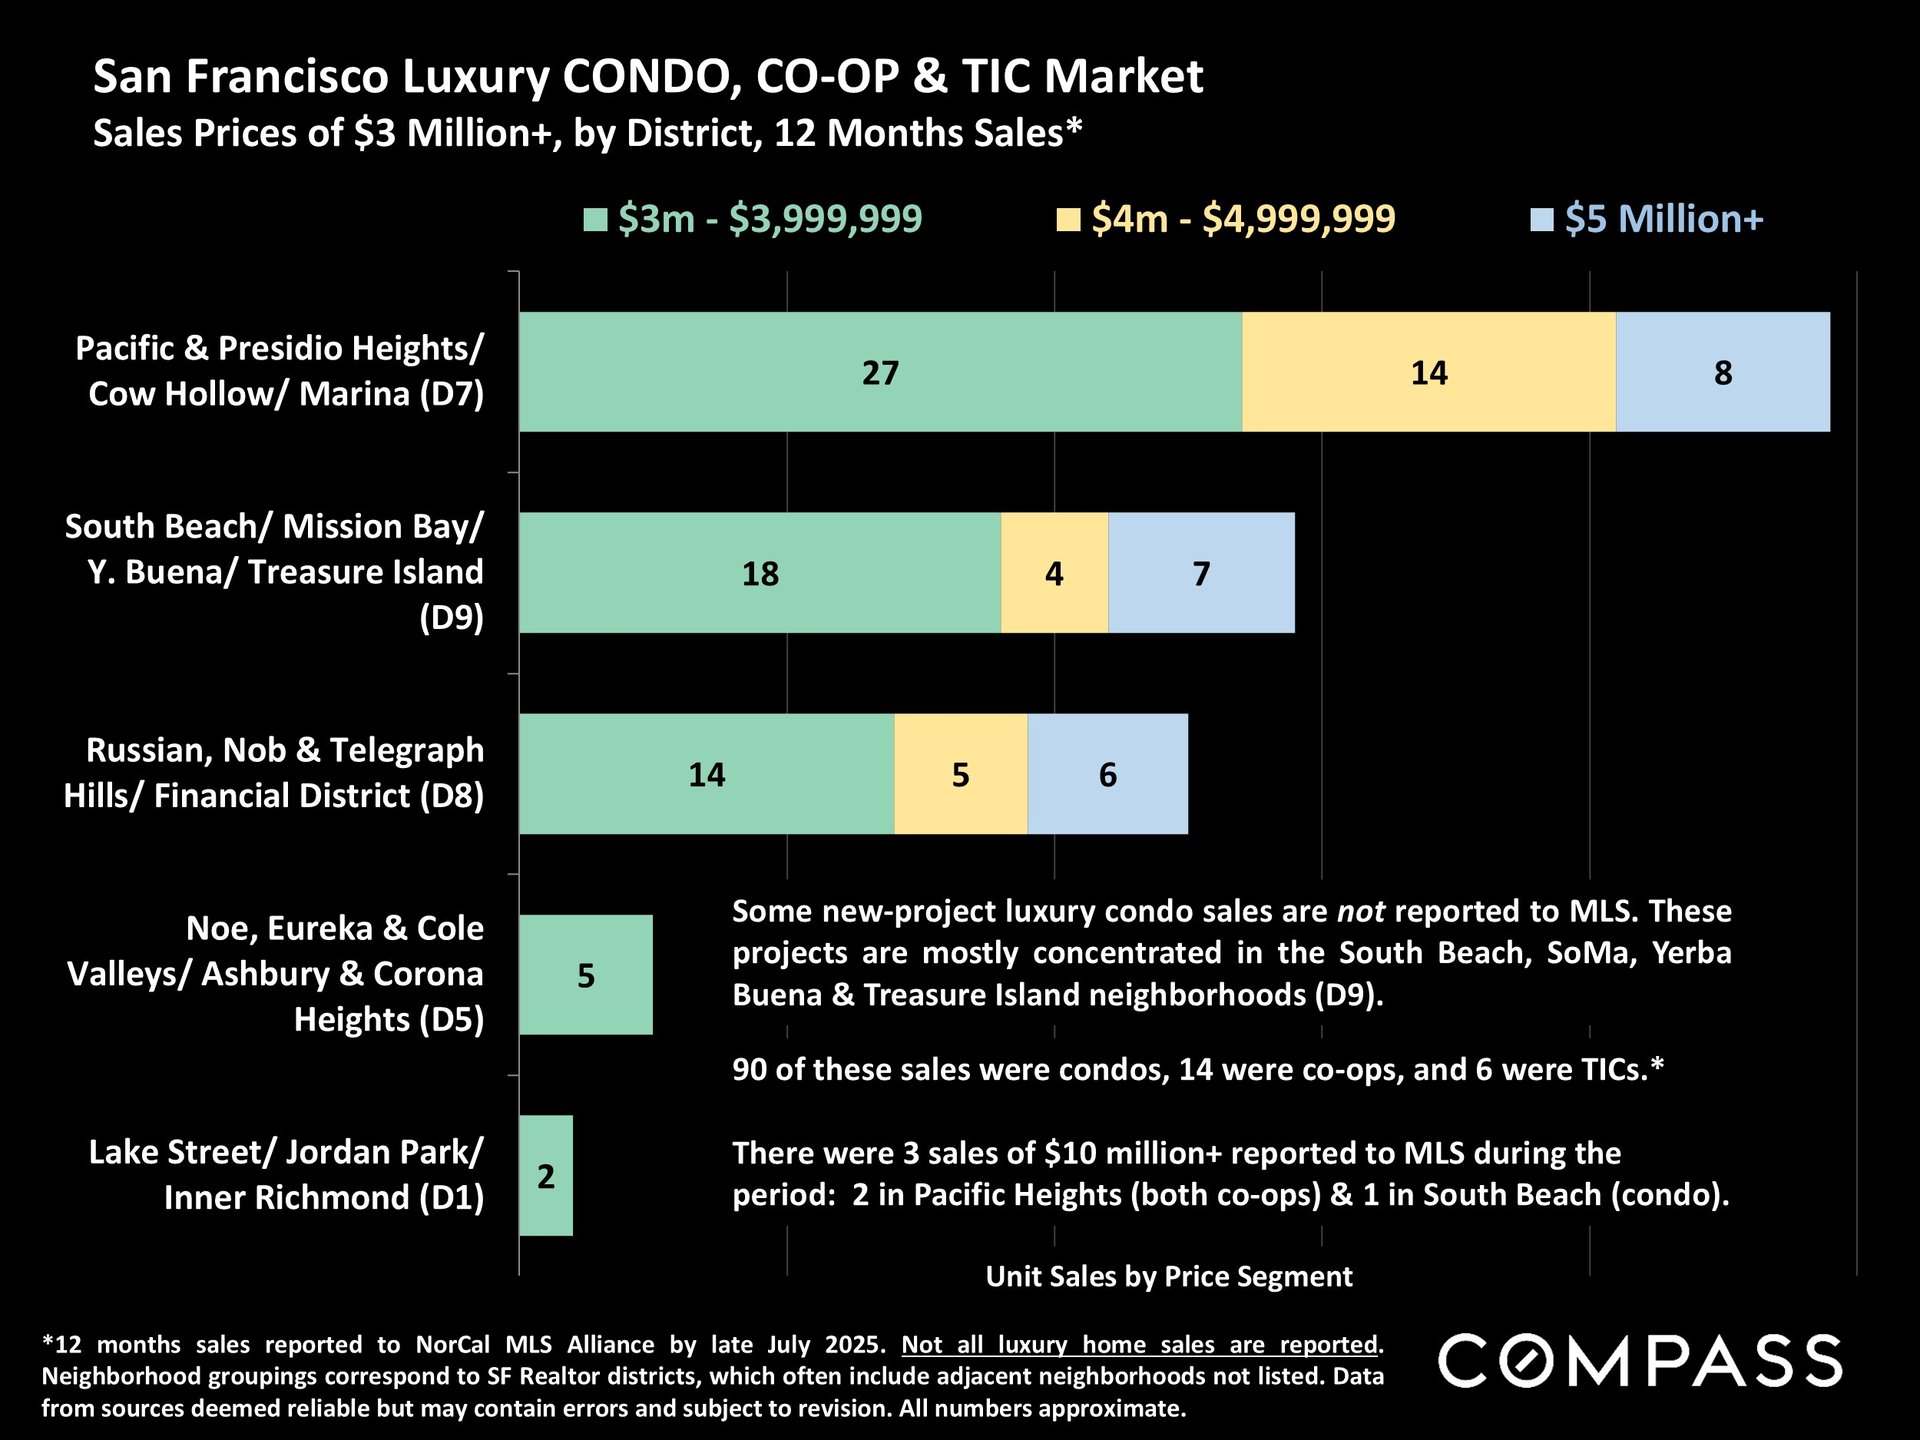
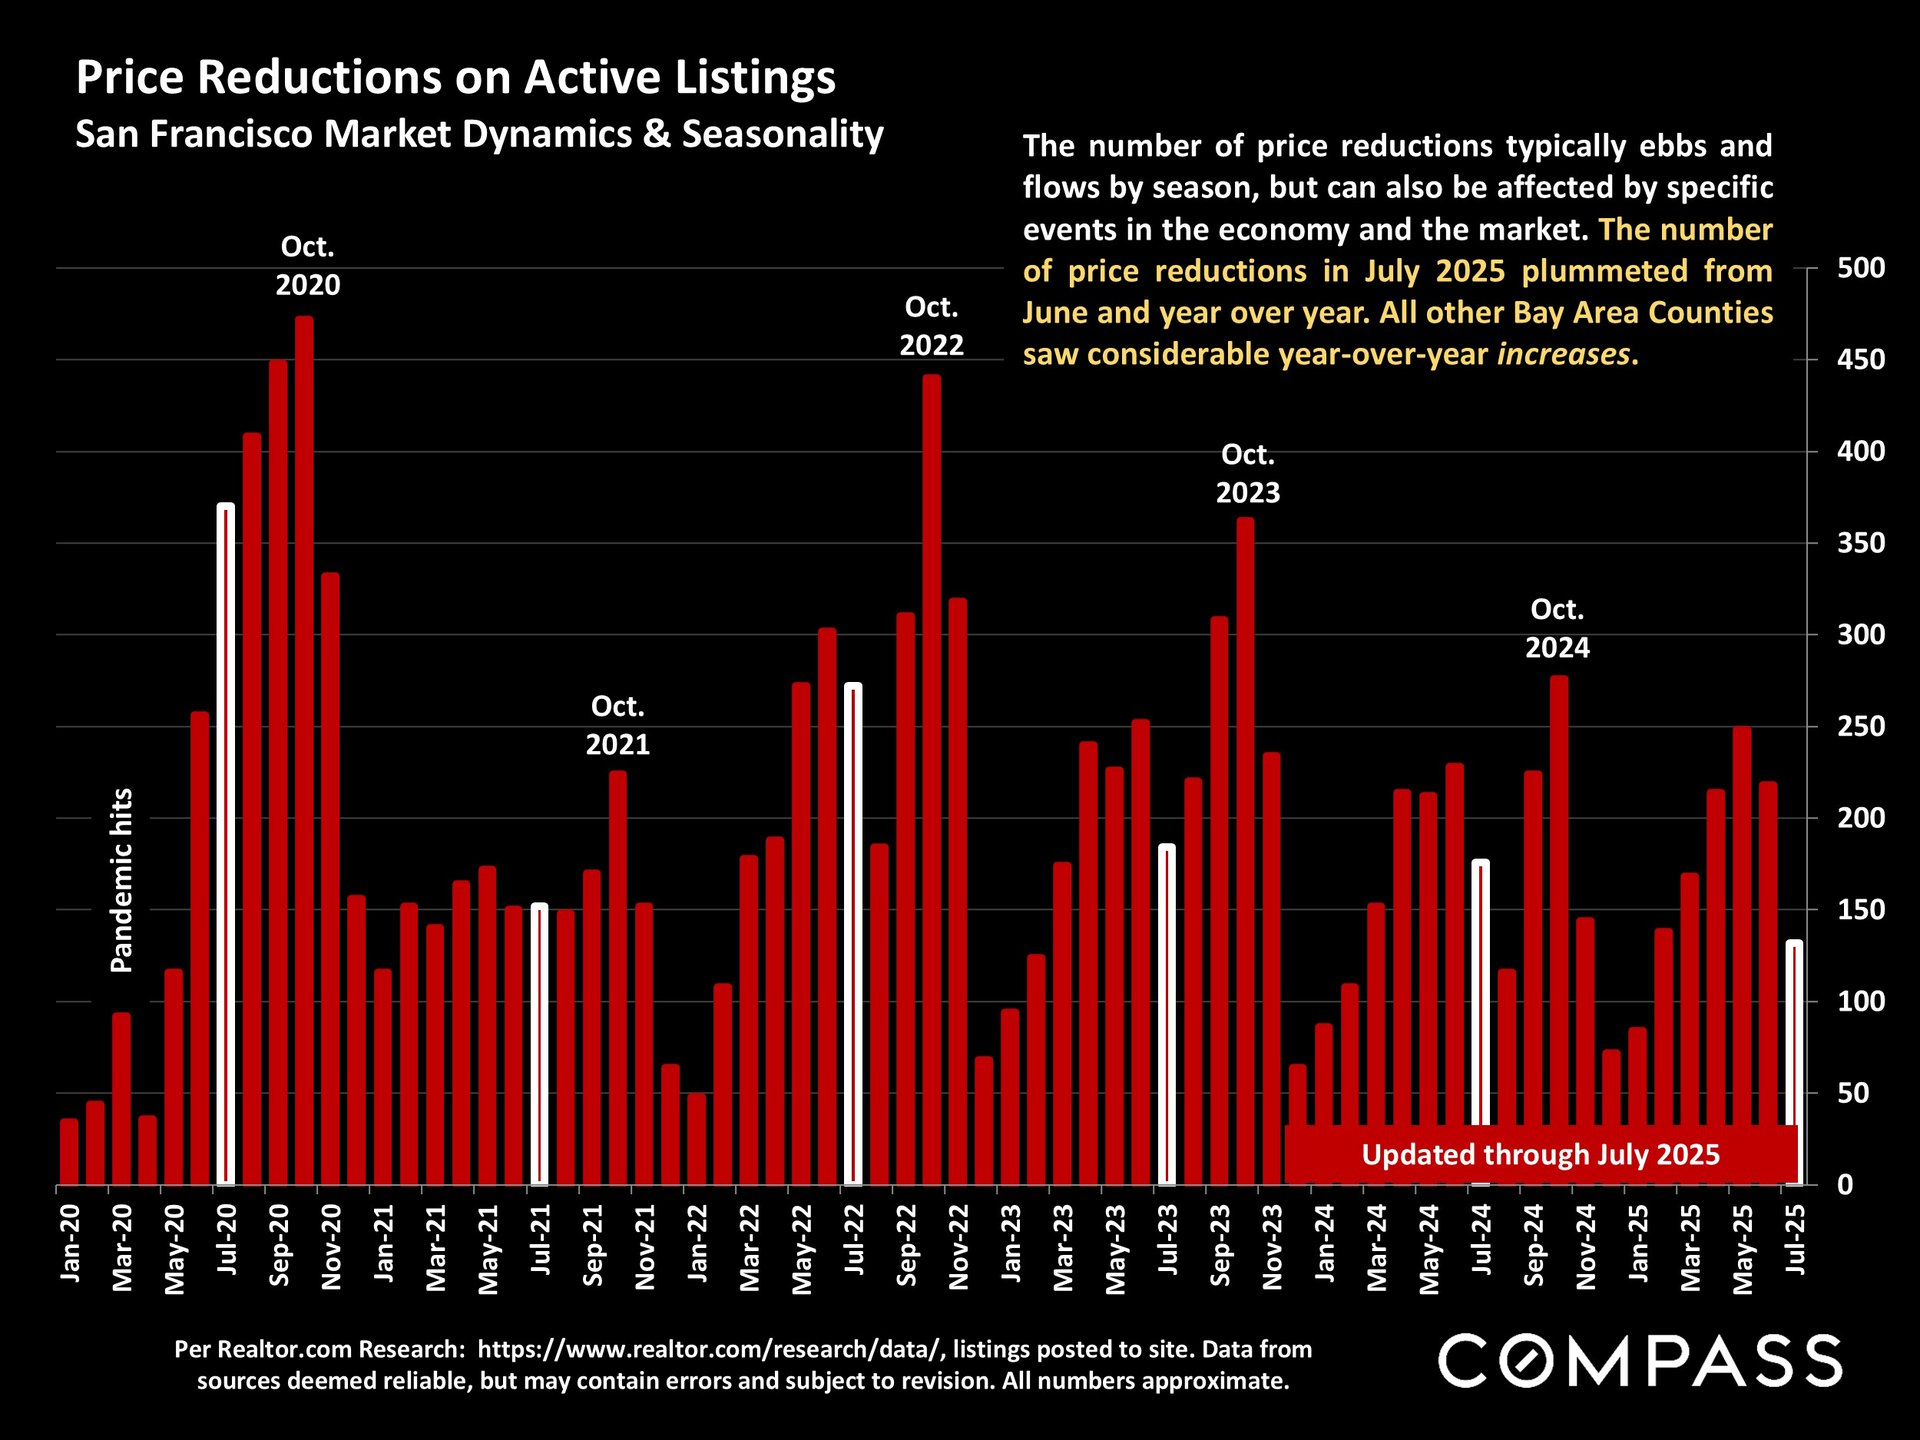
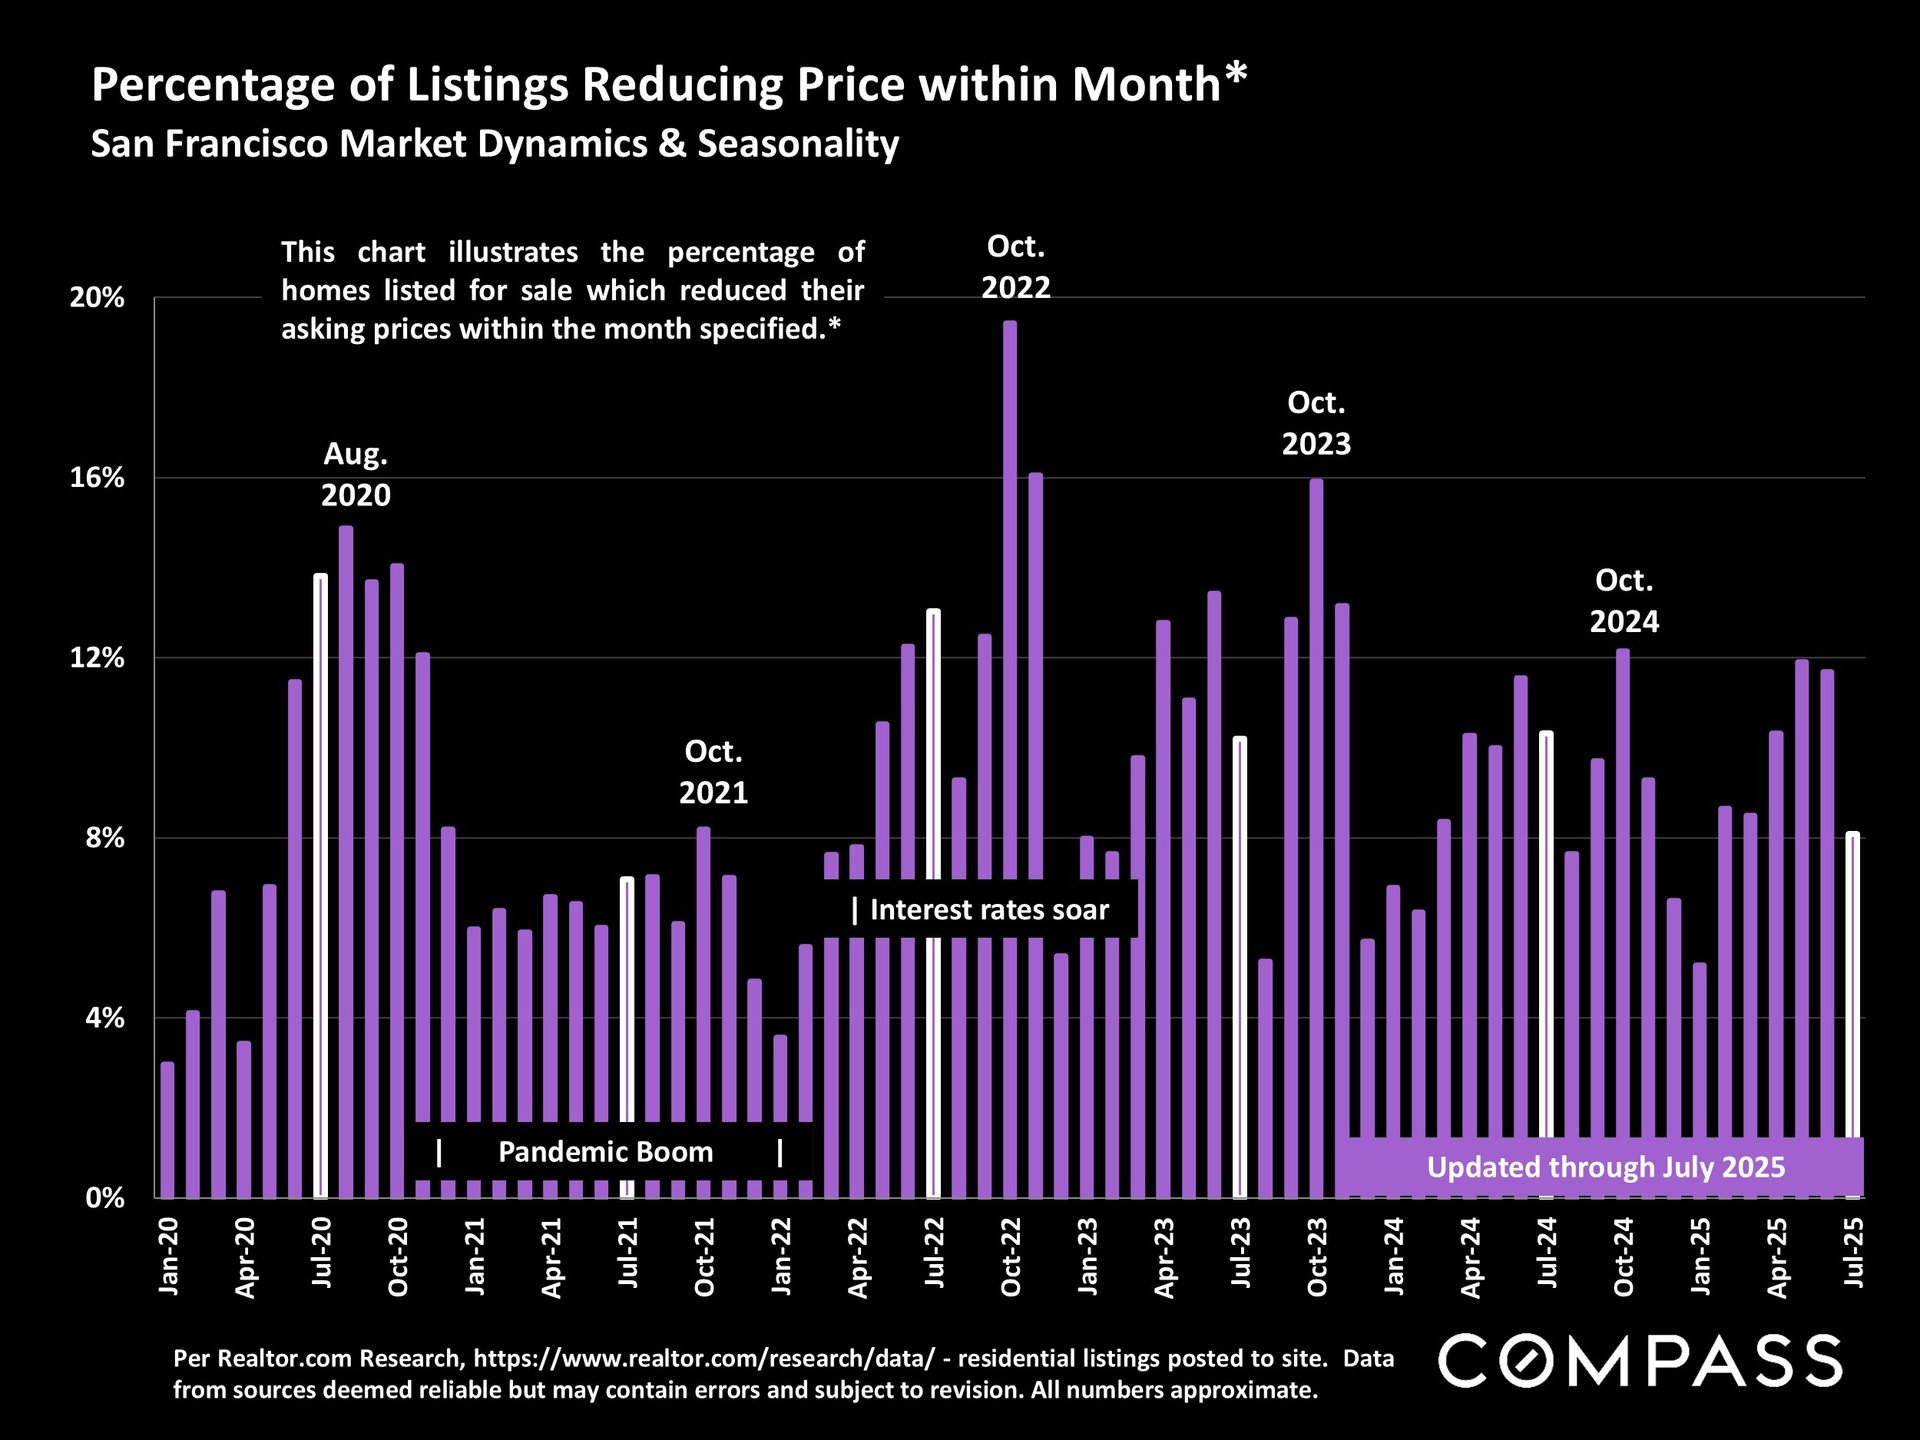
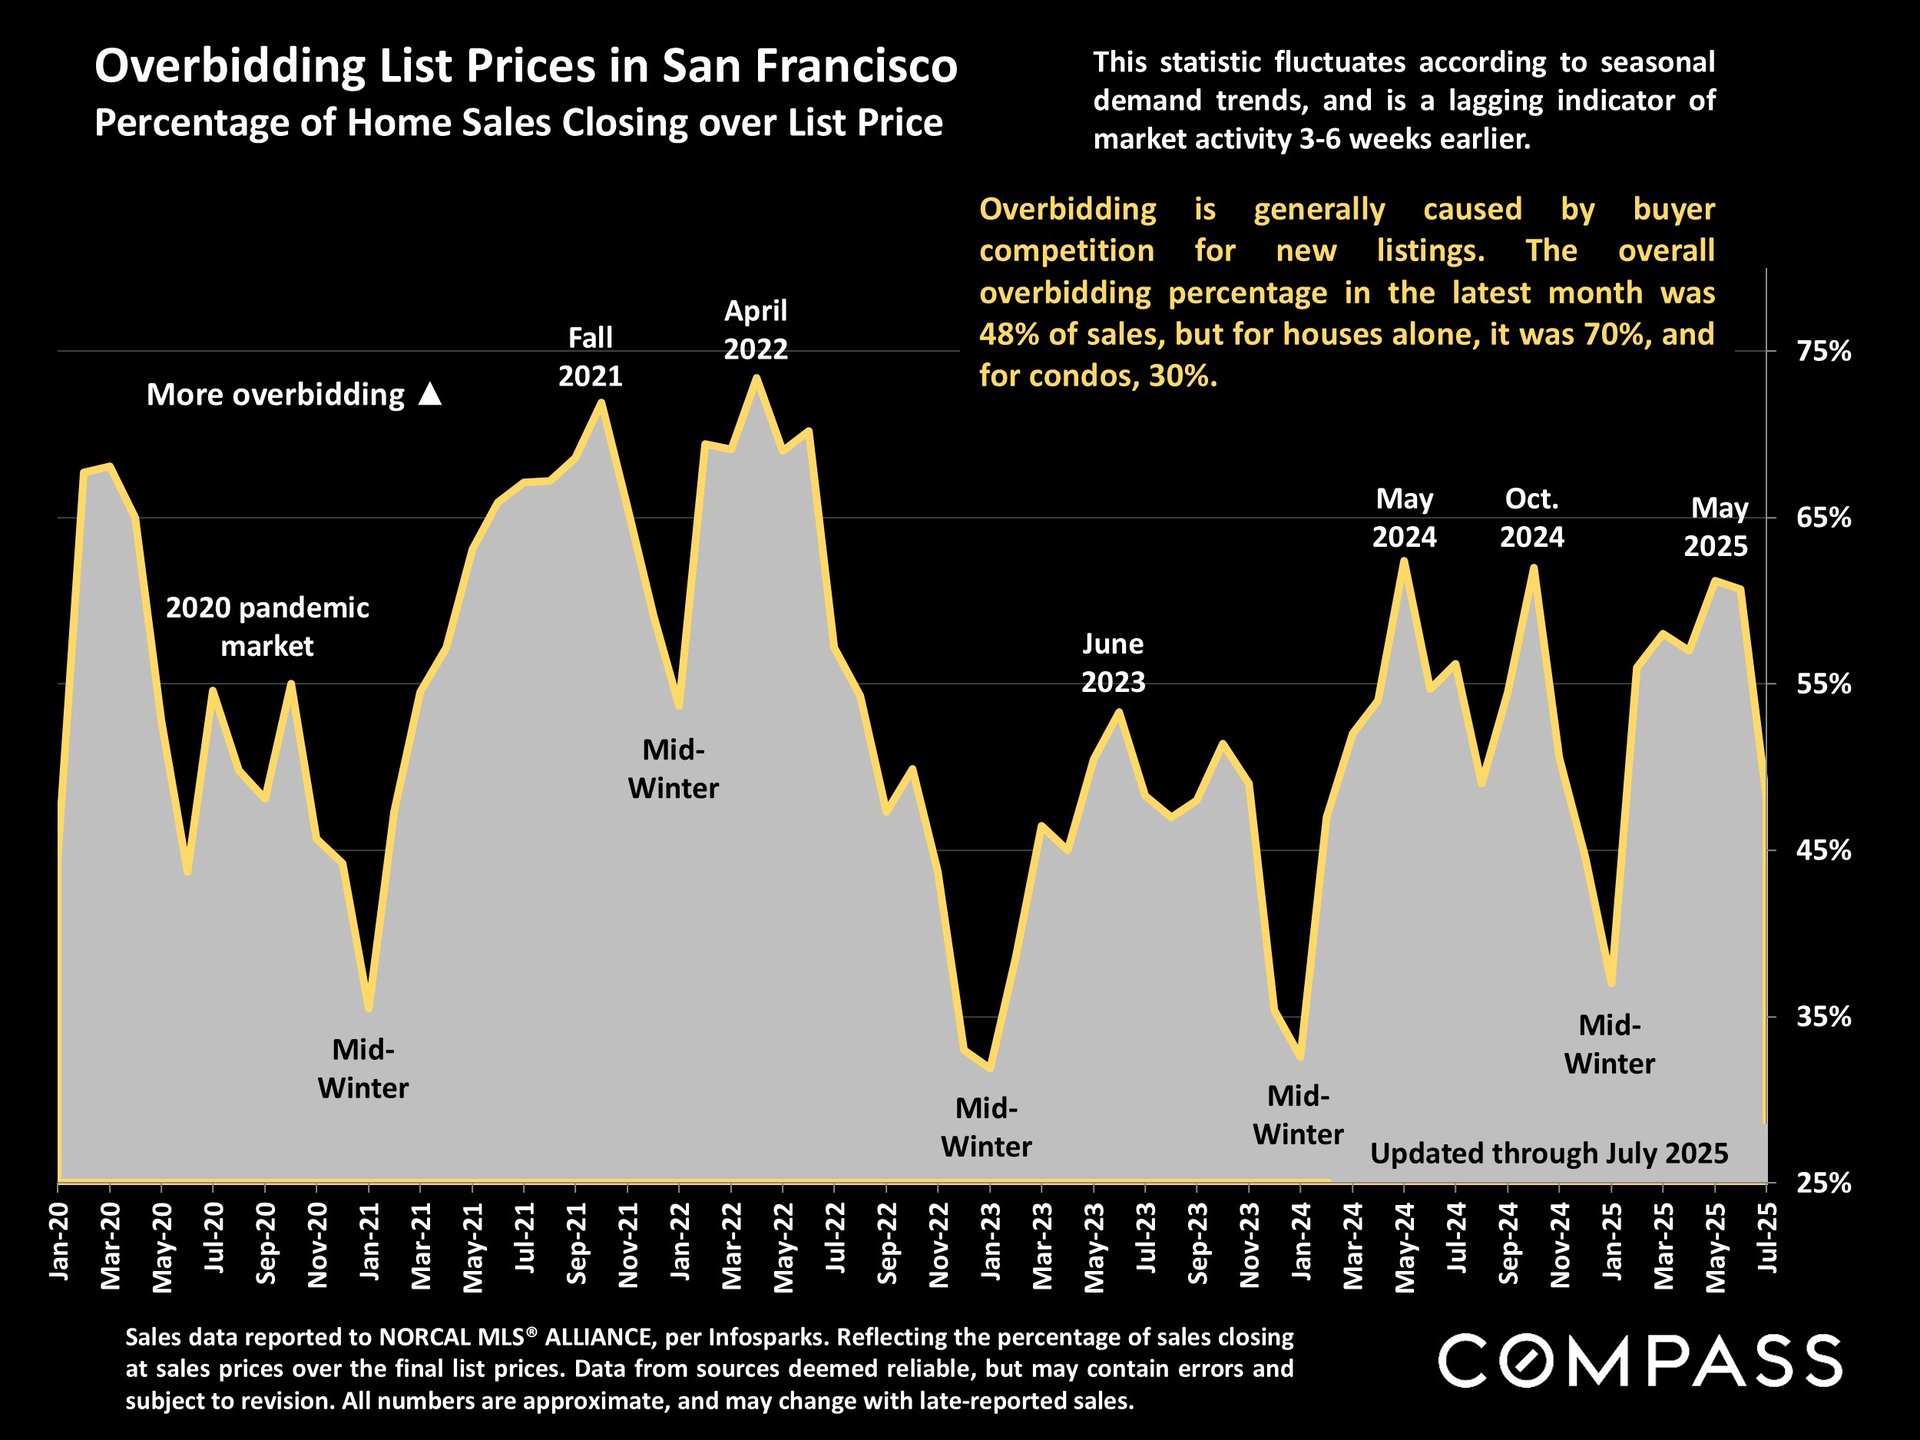
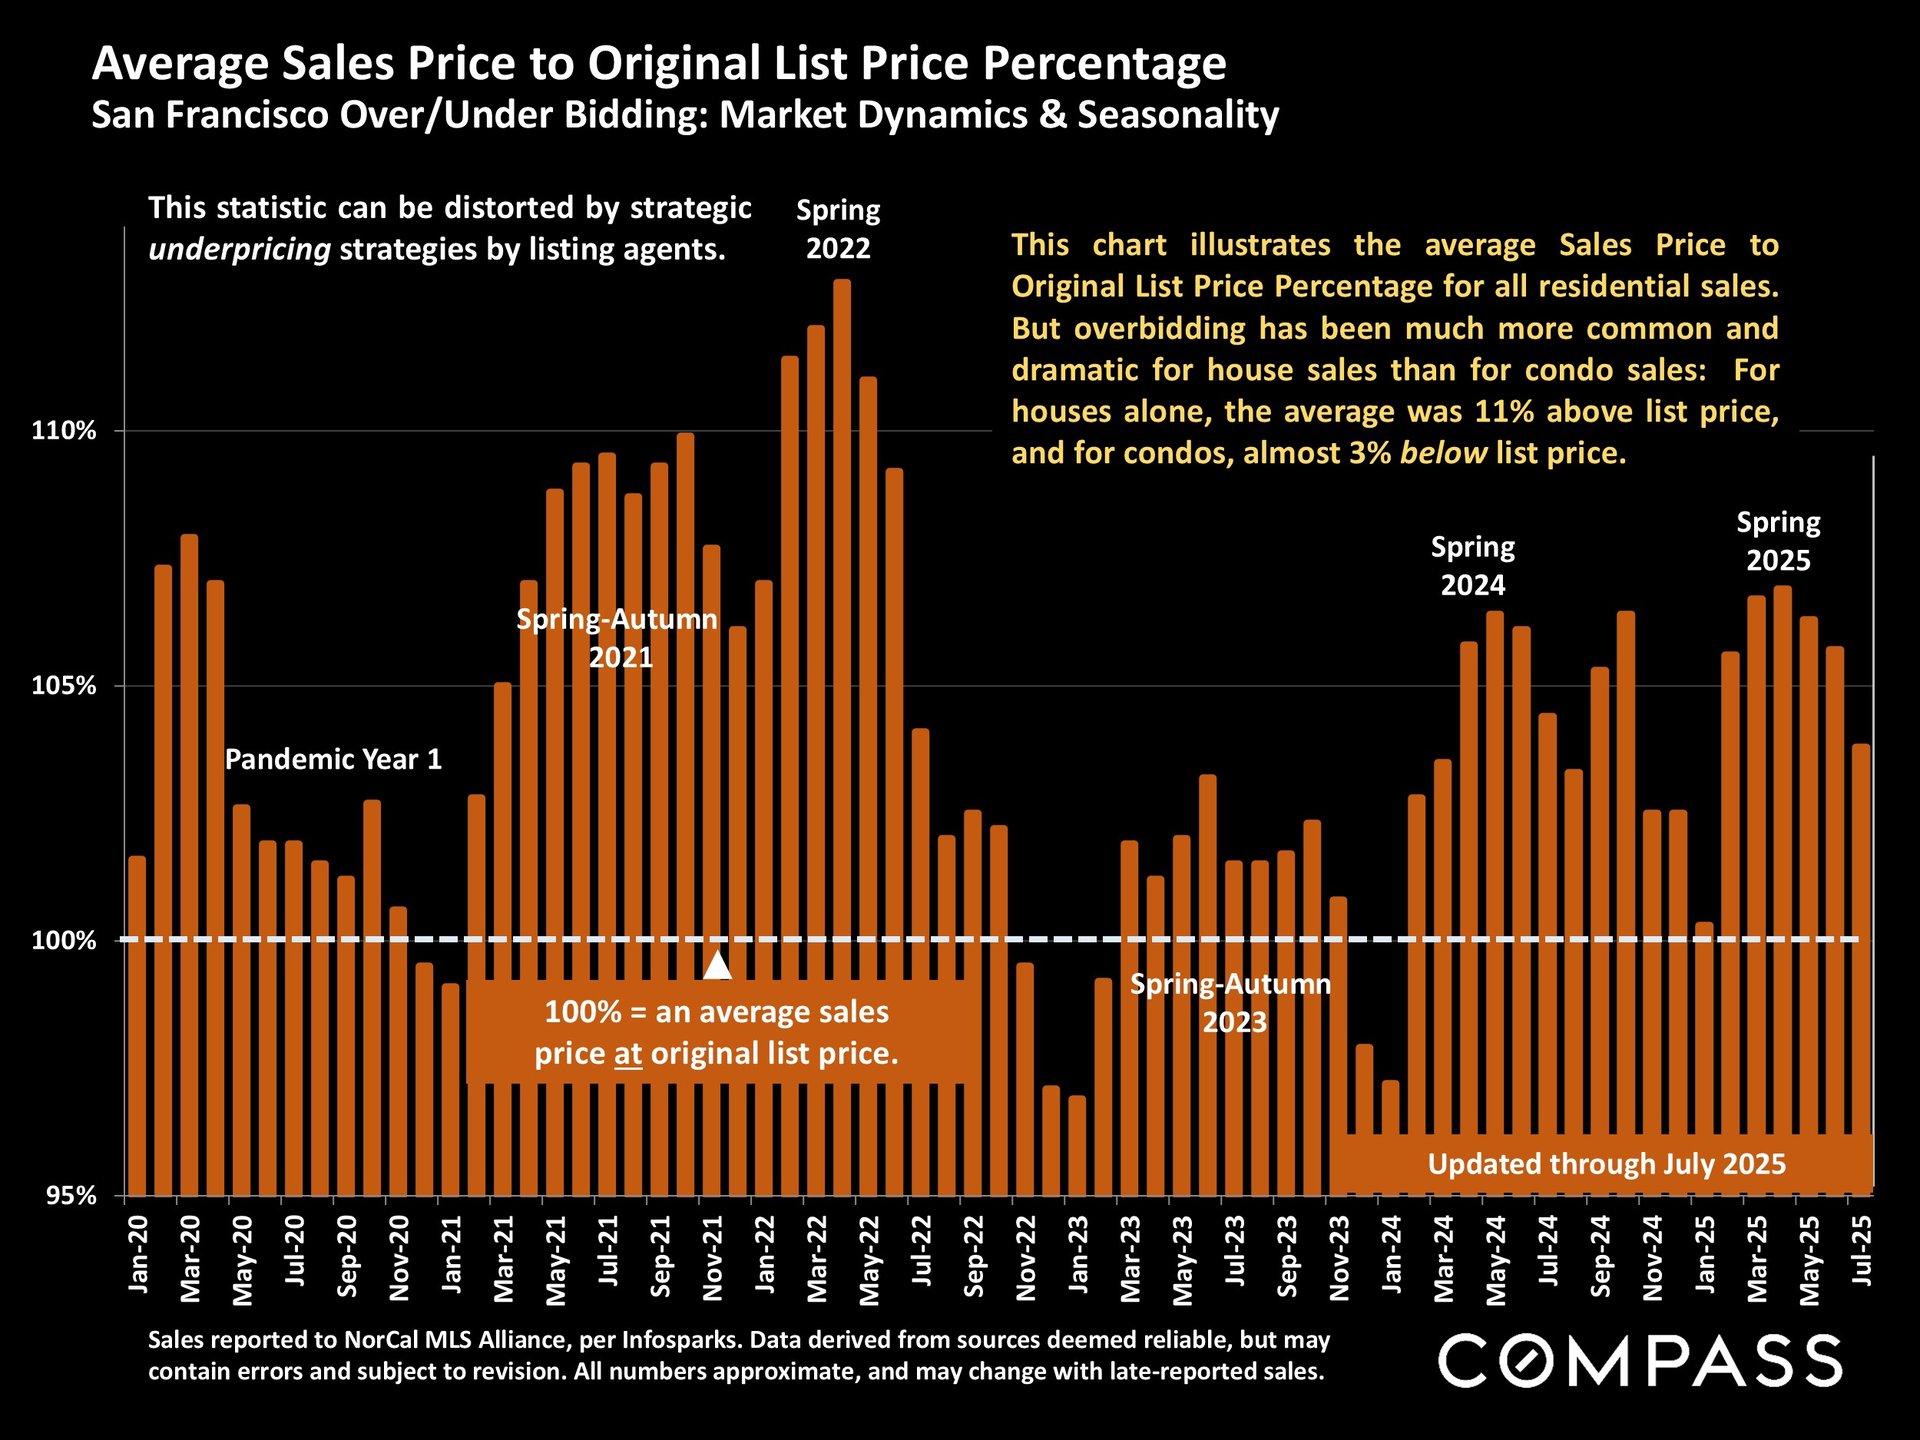
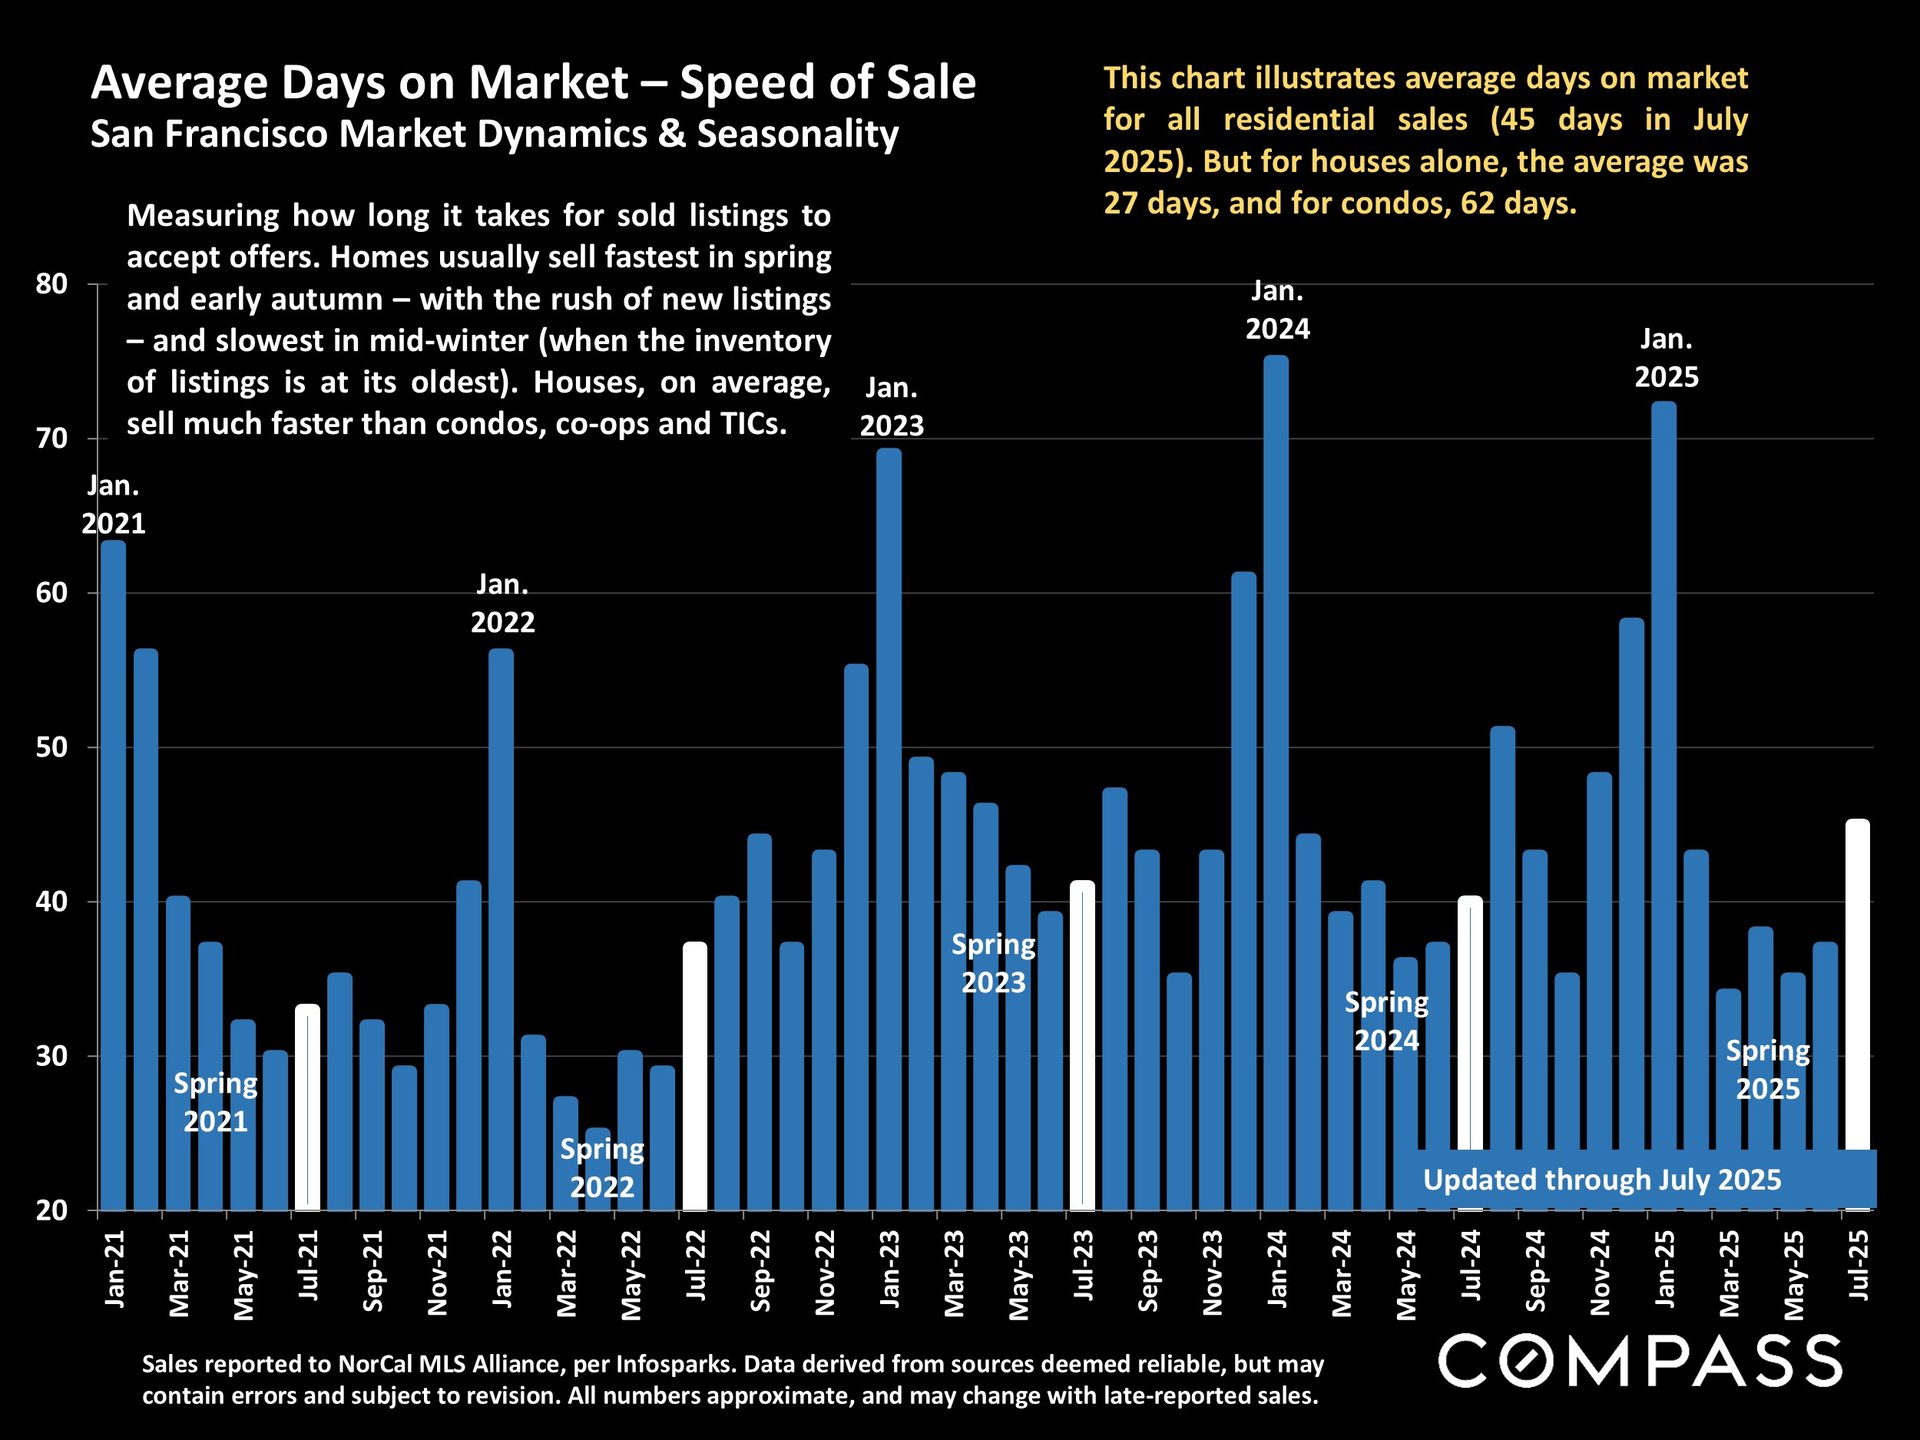
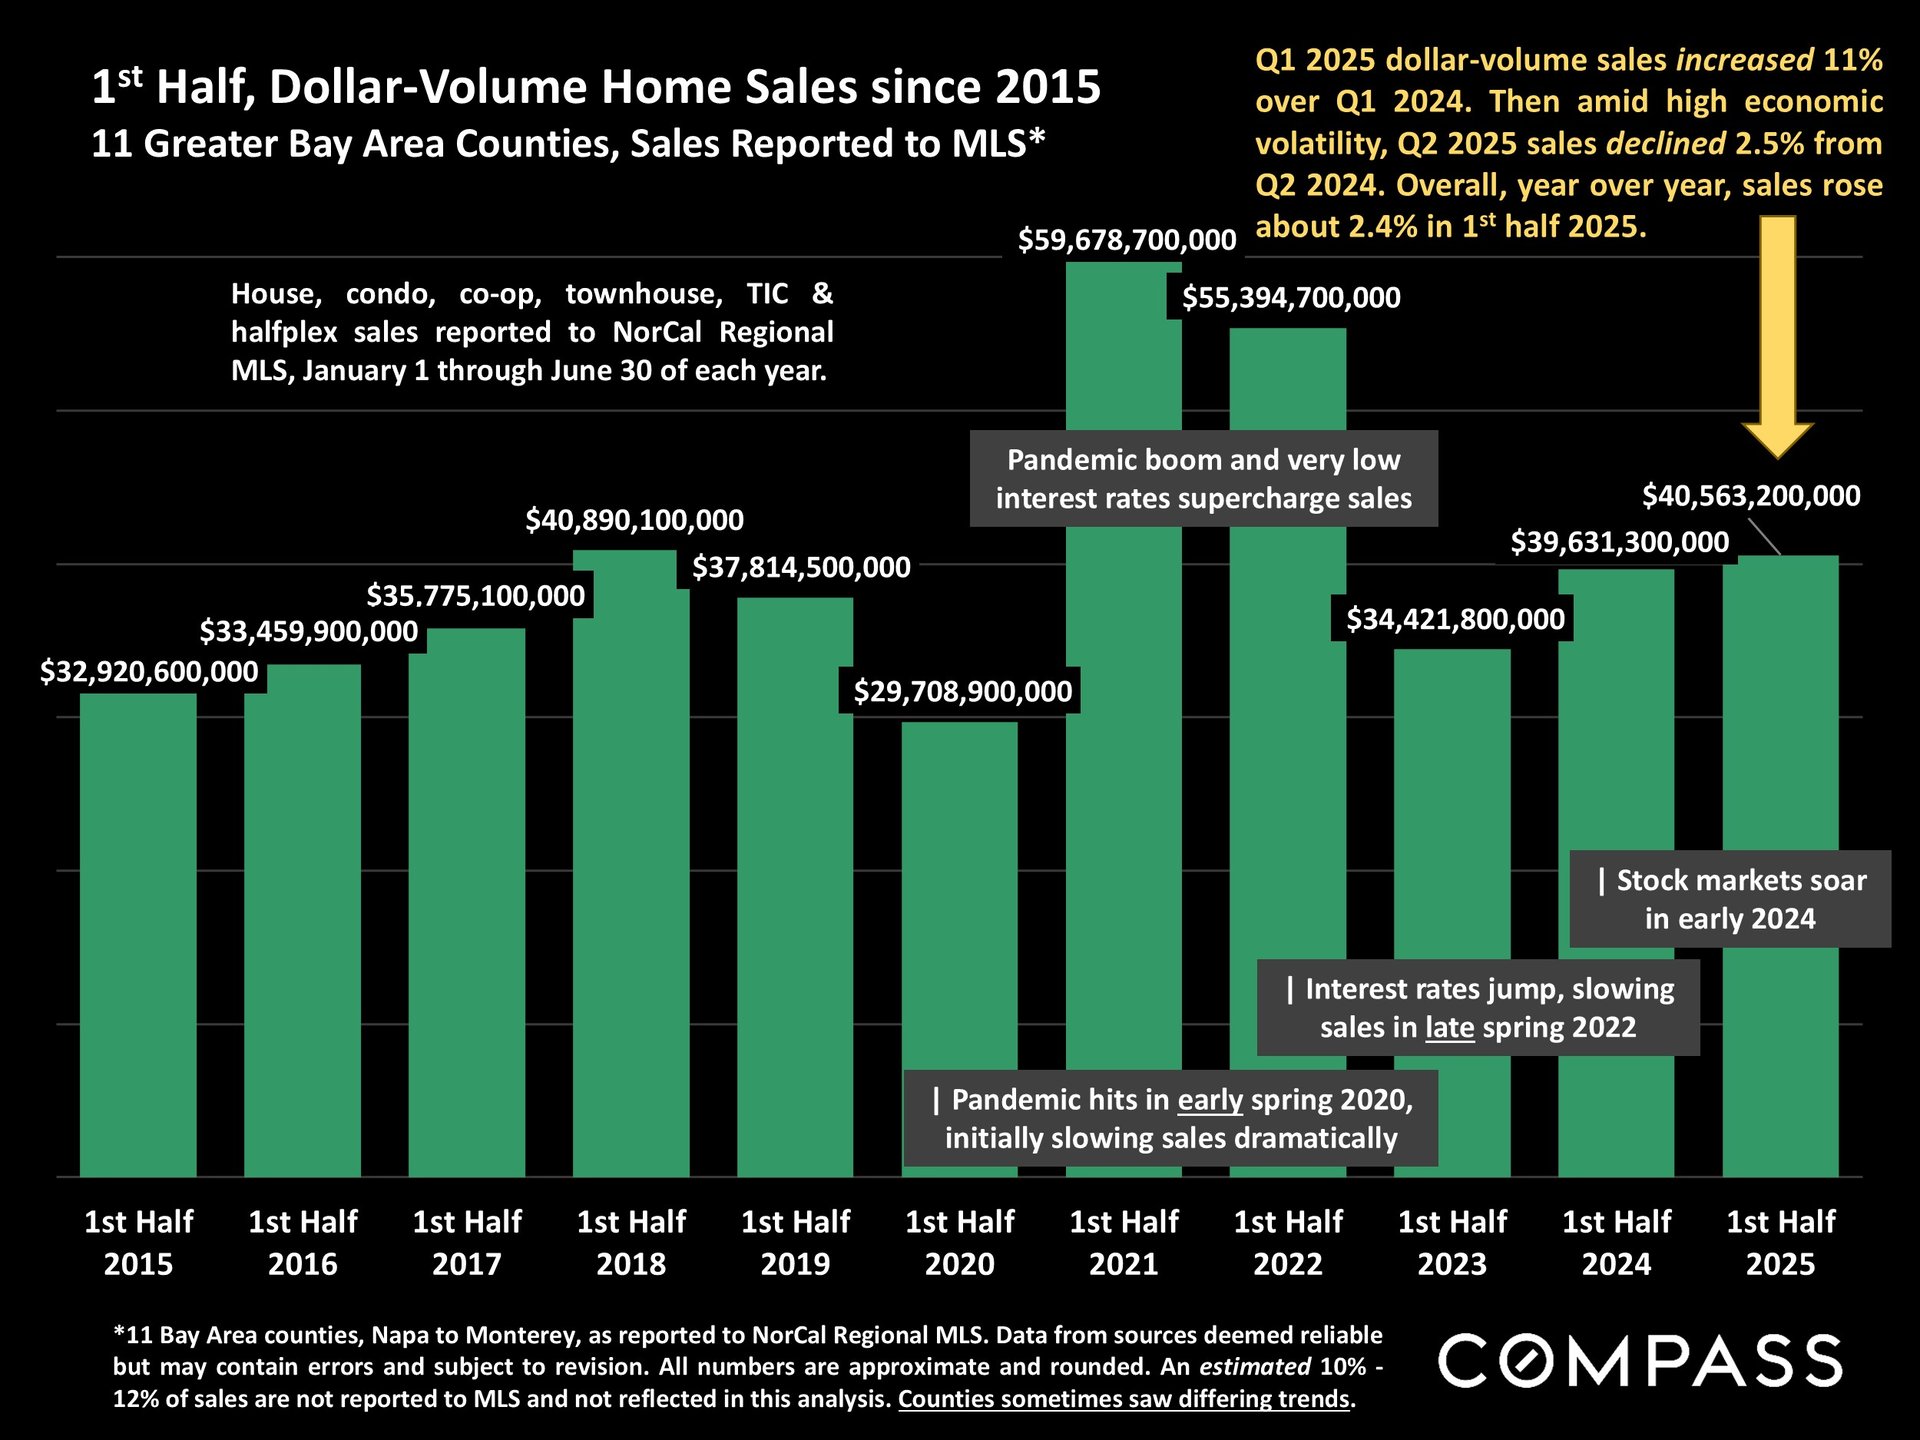
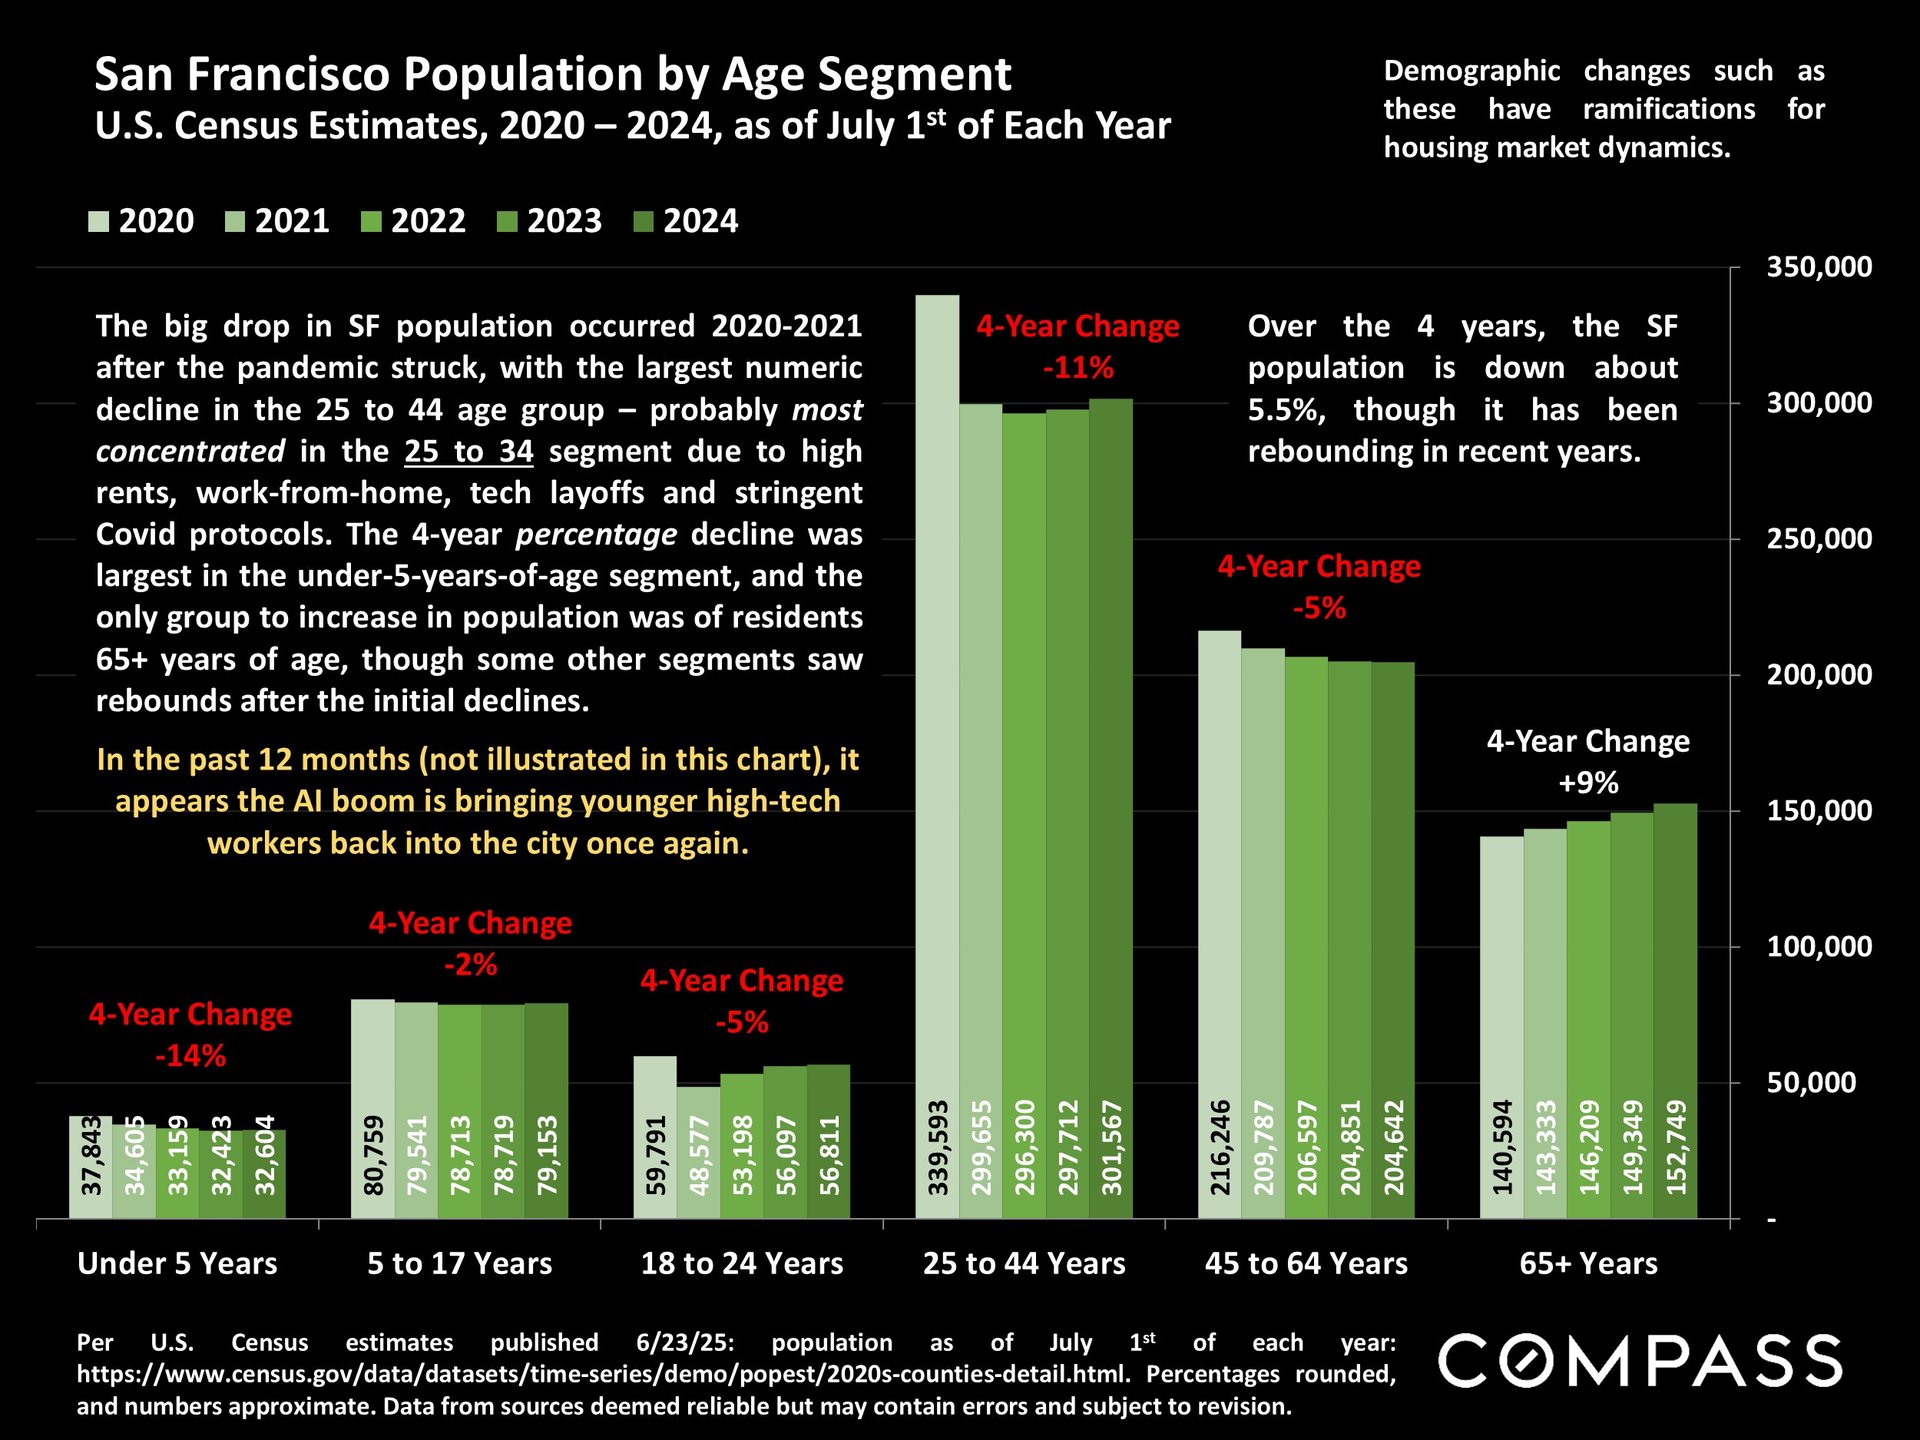
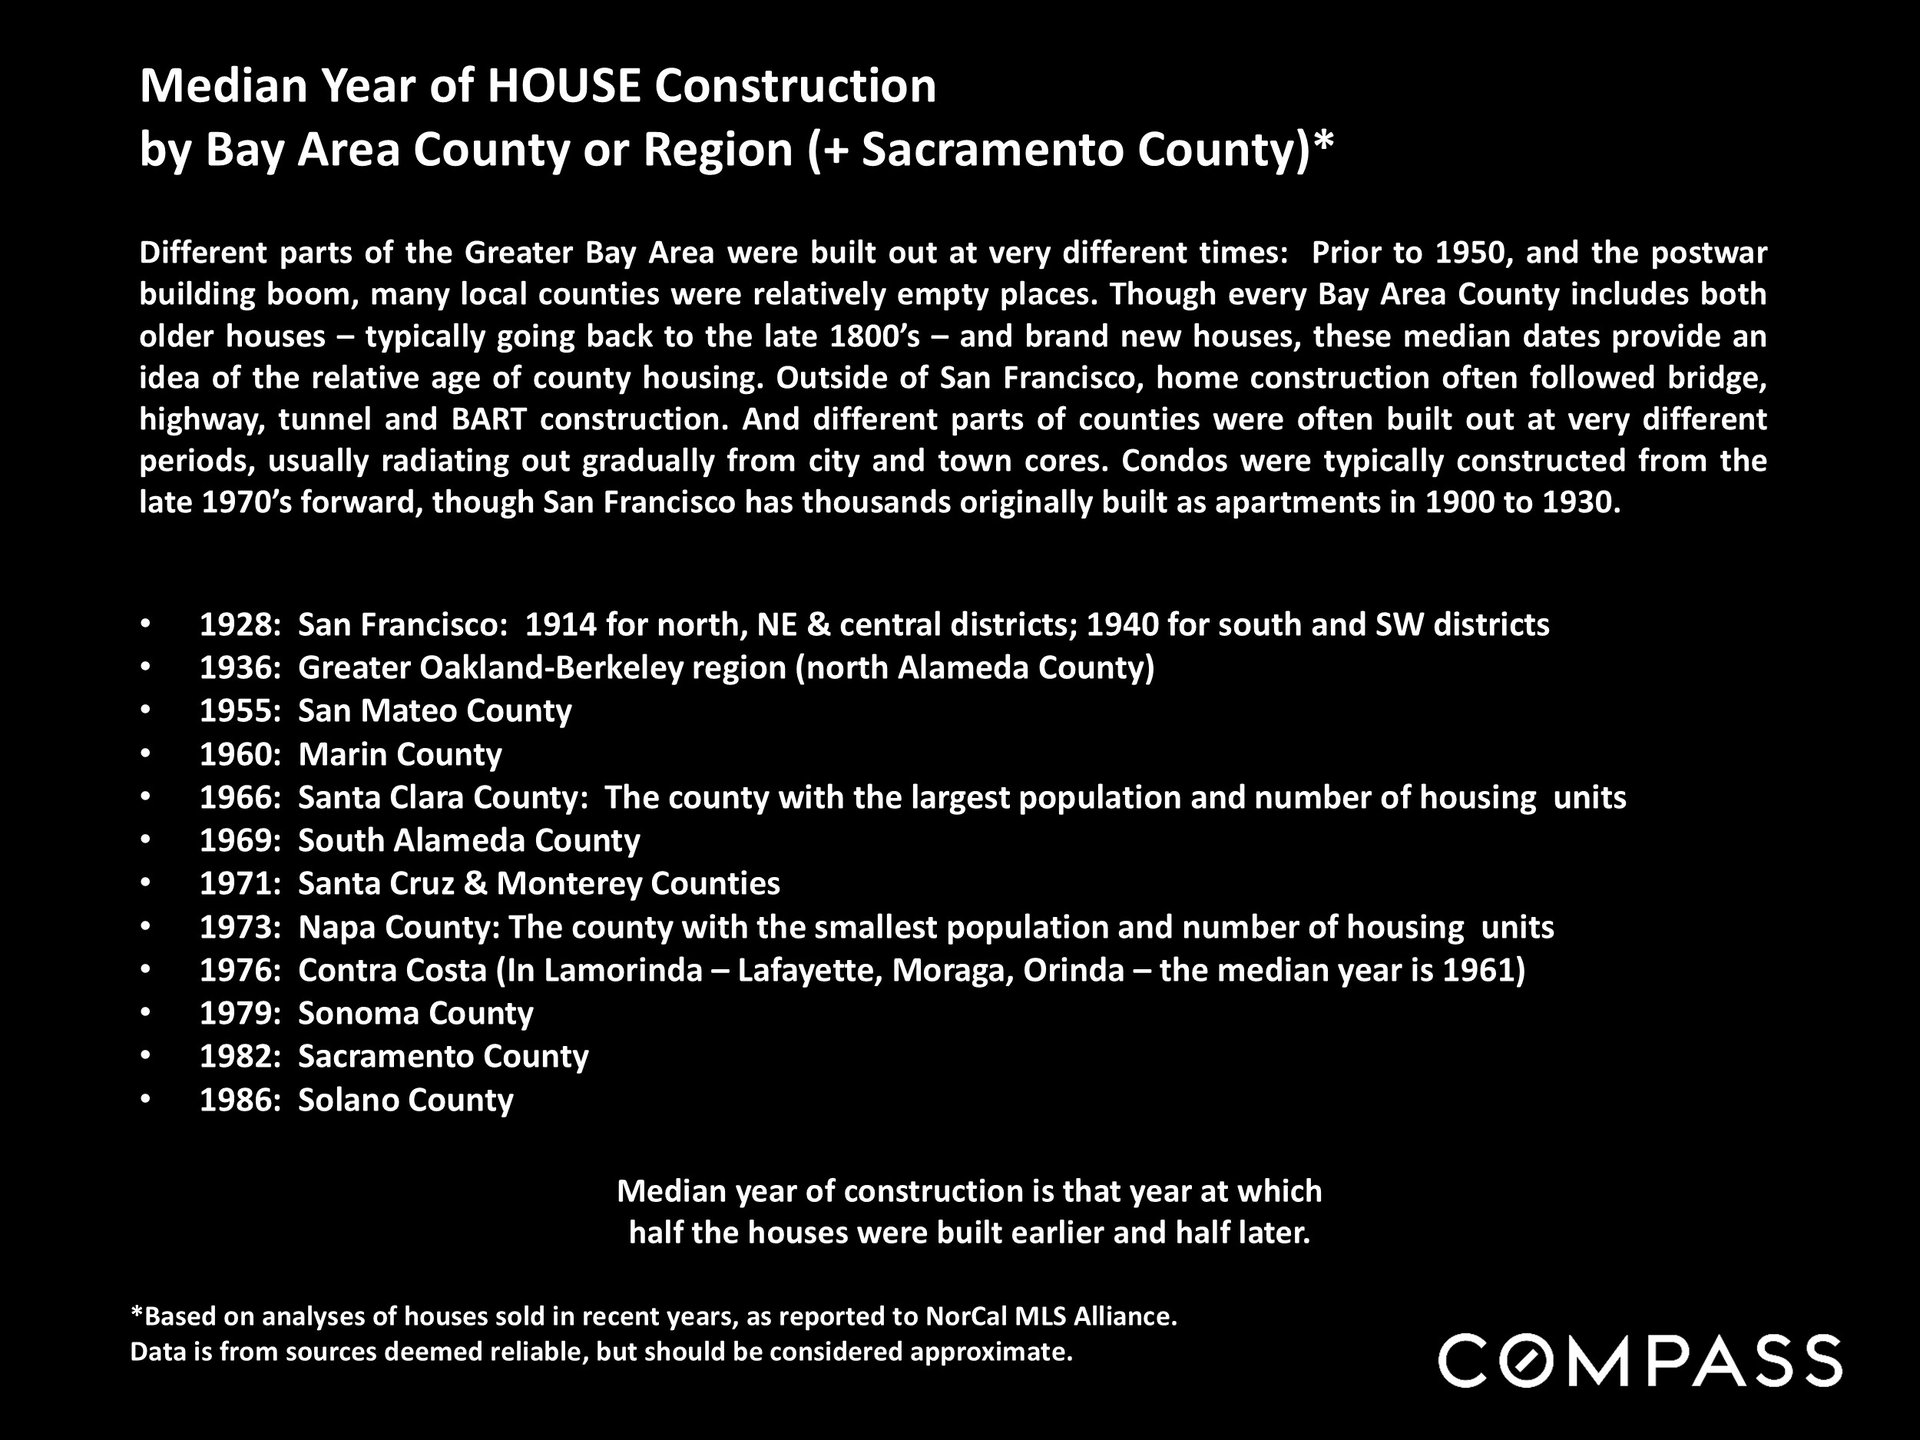
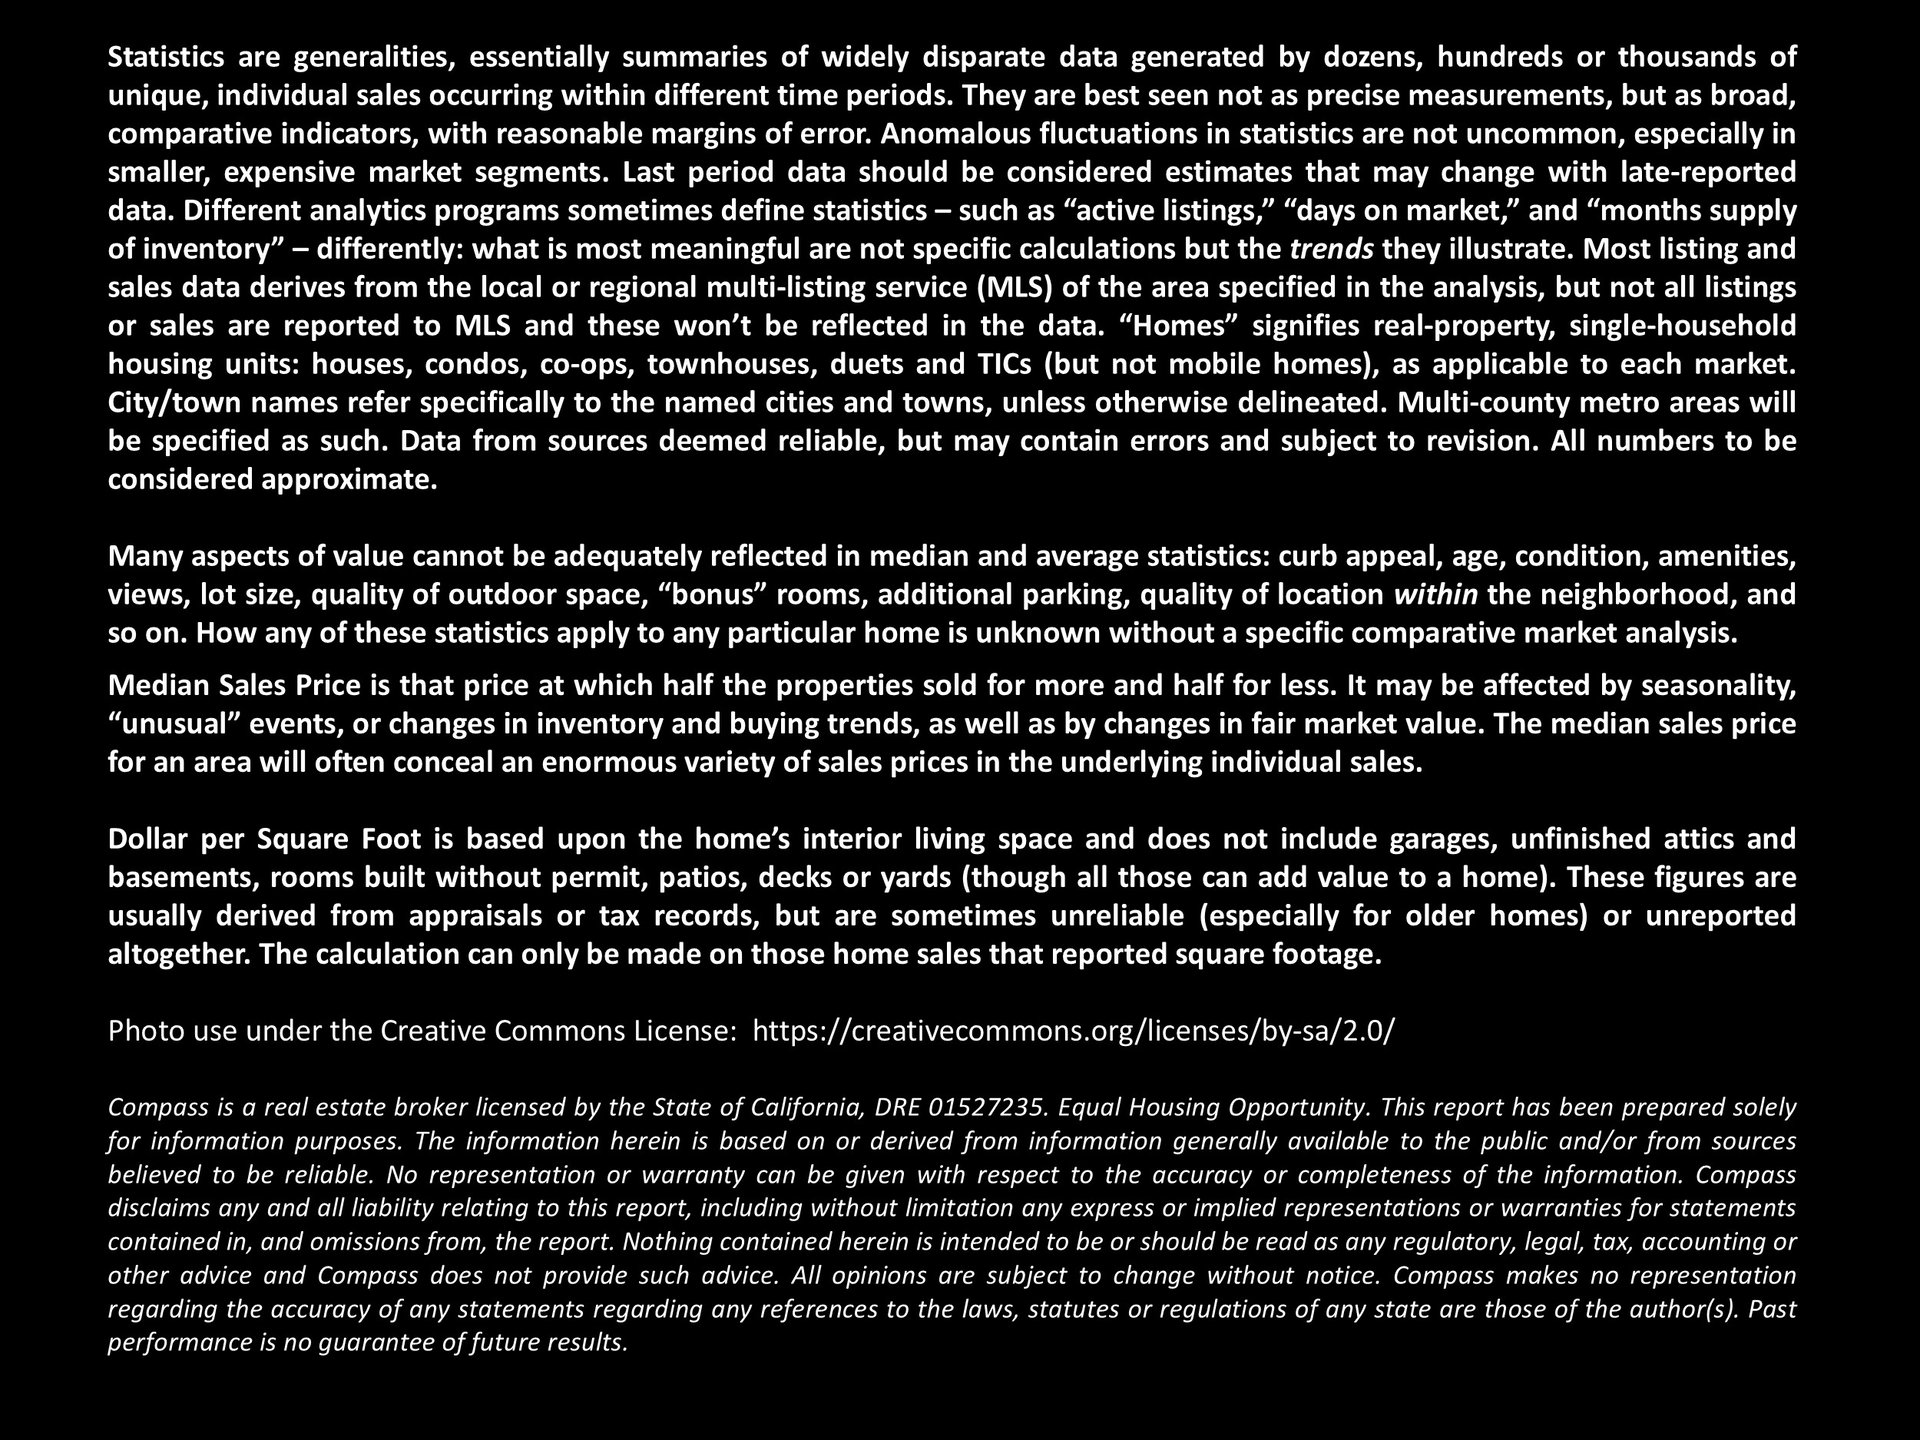
San Francisco housing market report describes AI growth, declining listings, and rising home prices.Chart of 30-year fixed mortgage rates since 2023, showing the August 2025 low and marked financial events.Line chart of Nasdaq and S&P 500 gains from January 2024 to August 2025, ending near 45% and 34%.Chart of San Francisco median house prices from 1990 to July 2025, with a 2022 peak near $2 million.Chart comparing July 2025 median house prices and year-over-year appreciation across Bay Area counties.Chart of San Francisco condo median sale prices from 2005 through July 2025, with recession and pandemic annotations.Chart comparing San Francisco condo and house values per square foot from 2005 through July 2025.Chart comparing San Francisco two-bedroom condo prices downtown and outside downtown from 2005 through July 2025.Bay Area median home values by county, with San Francisco highlighted in a table comparing two home-size groups.Bay Area median house values by county, comparing prices and home sizes by bedroom and bathroom count.Table comparing Bay Area condo and townhouse median prices, sizes, and per-square-foot values by county.Bar chart of San Francisco new listings, January 2021–July 2025, showing seasonal peaks in September and summer declines.San Francisco active and coming-soon listing chart, showing monthly counts from February 2022 to August 2025.Chart of San Francisco listings going into contract, showing monthly seasonality from August 2021 through July 2025.San Francisco residential market table comparing price segments and property types across key sales indicators.San Francisco monthly home sales chart, January 2021–July 2025, with July 2025 sales notes.Chart of San Francisco luxury home sales through July 2025, highlighting pandemic-era peaks and a 19% year-to-date increase.Chart of San Francisco luxury home sales by district and price segment, with Pacific Heights, Cow Hollow, and Marina leading.Chart of San Francisco luxury condo, co-op, and TIC sales by district and price segment.Chart of San Francisco active-listing price reductions, with monthly bars from 2020 through July 2025.Chart of monthly San Francisco listings reducing asking prices, January 2020–July 2025, with peaks in October 2022 and 2023.San Francisco home sales over list price, charted from 2020 to July 2025 with seasonal peaks and dips.Chart of San Francisco sale prices relative to original list prices, January 2020 to July 2025.Chart of San Francisco days on market, January 2021–July 2025, with July 2025 averages of 45 days overall.Chart of first-half Greater Bay Area home-sale dollar volume from 2015 to 2025, with 2025 sales up about 2.4%.San Francisco population by age group, 2020–2024, with four-year changes shown in a green bar chart.Infographic listing median house construction years across Bay Area counties and regions, with explanatory notes and Compass branding.Real estate report disclaimer explaining market statistics, home values, data limitations, and legal terms.

Work With Us

We will help you understand the complex aspects of the transaction and share our expertise so that you can make the best decisions possible. We are experienced, market savvy, and energetic. With both of us working for our clients, you get twice the amount of attention and insight.