Neighborhood House & Condo Prices; Short-Term & Long-Term Appreciation Trends; Population Migration In & Out of the City.
After the heat of the spring market, activity typically slows down markedly in July and August. In September, listings start pouring on the market again to fuel the relatively short autumn selling season – in fact, September is typically the single month with the highest number of new listings. Autumn is also a very important time for the luxury home market – luxury house sales often peak for the year in October.
What occurs in the next 2 months, before the mid-winter holiday doldrums begin, will be the next major indicator of market conditions and direction.
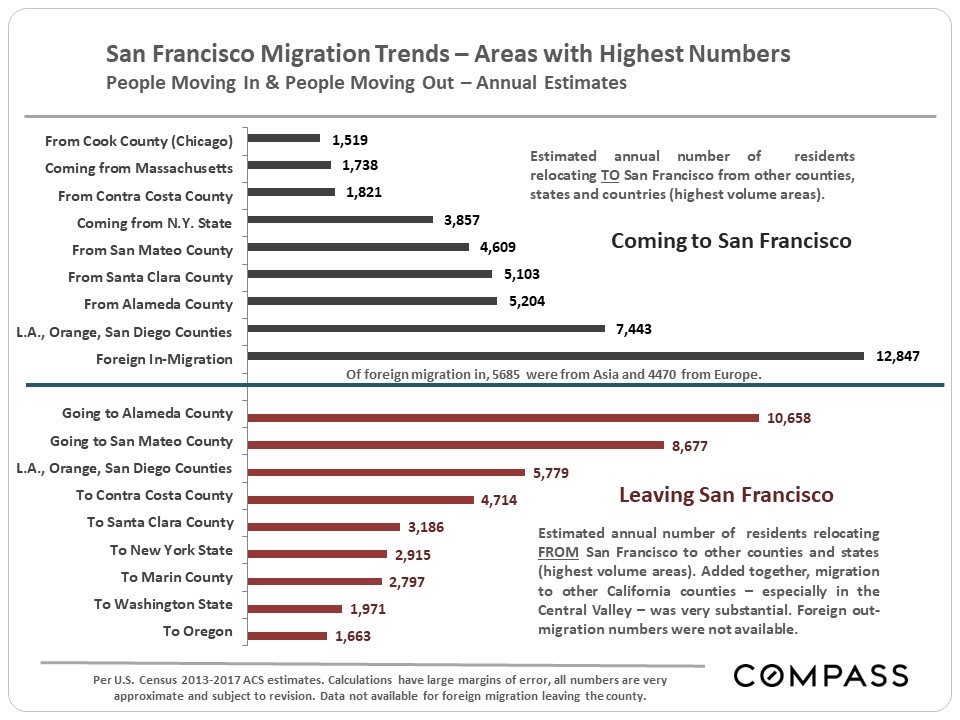
Migration: People Moving In & Out
of San Francisco
Using new U.S. Census estimates released 8/29/19, this chart attempts to identify U.S. counties, states and international regions with the highest number of residents migrating to and from our county. In the Bay Area, there is a general trend outward from more expensive to more affordable places, while in-bound migration is deeply affected not only by exchanges between Bay Area counties, but people arriving from other parts of the state, country and world. Areas often have large two-way exchanges of residents.
Foreign in-migration is a huge issue in SF and the Bay Area, but it will be another year before any impact of new U.S. immigration policy on foreign in-migration in 2018 shows up in census numbers. The census estimates foreign in-migration in this analysis, but not foreign out-migration.
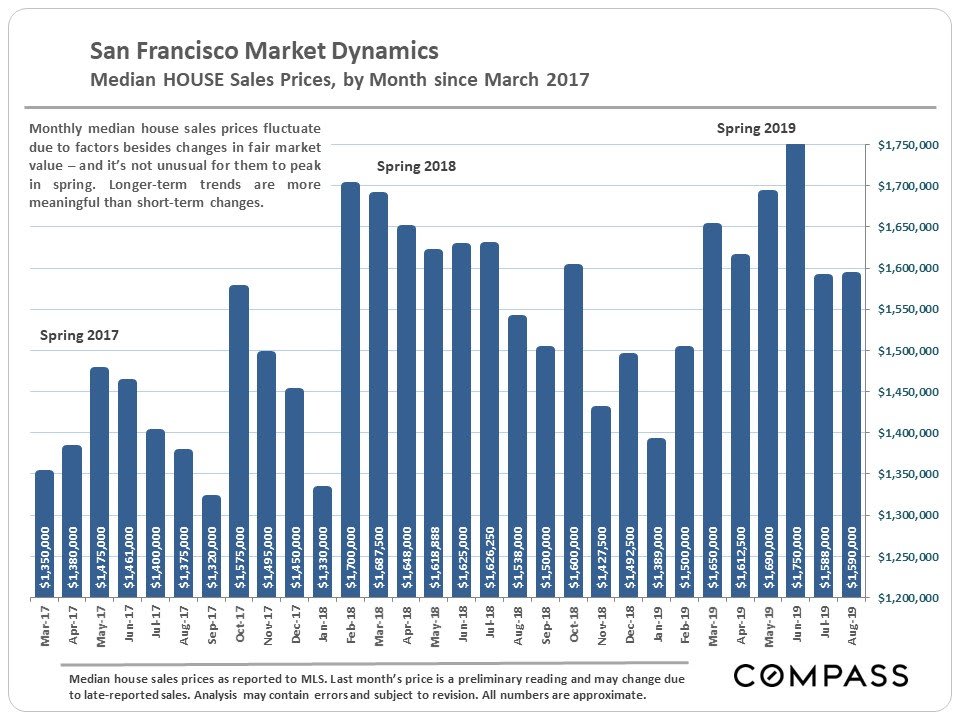
Short-Term & Long-Term Trends
in Median Home Prices
San Francisco is out-performing the Bay Area – most of the other counties have seen 3% to 5% declines in median home prices since peaking in spring 2018, while the city saw a new monthly peak in June and a new quarterly peak in Q2. It has been suggested that the differentiating factor in SF has been the high number of large, local, high-tech IPOs occurring this year since early spring.
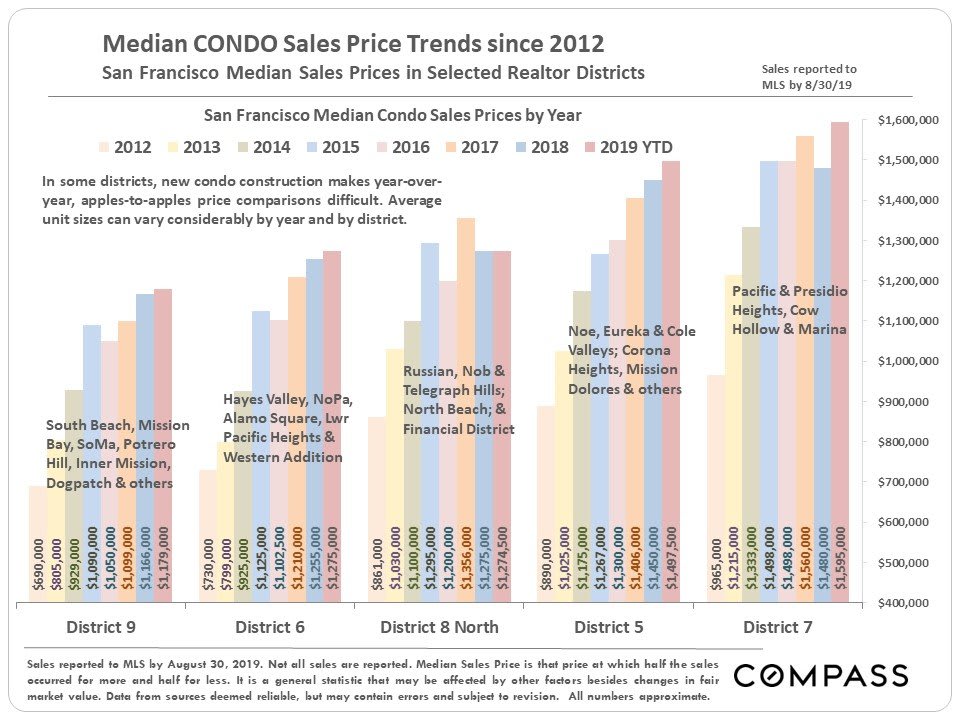
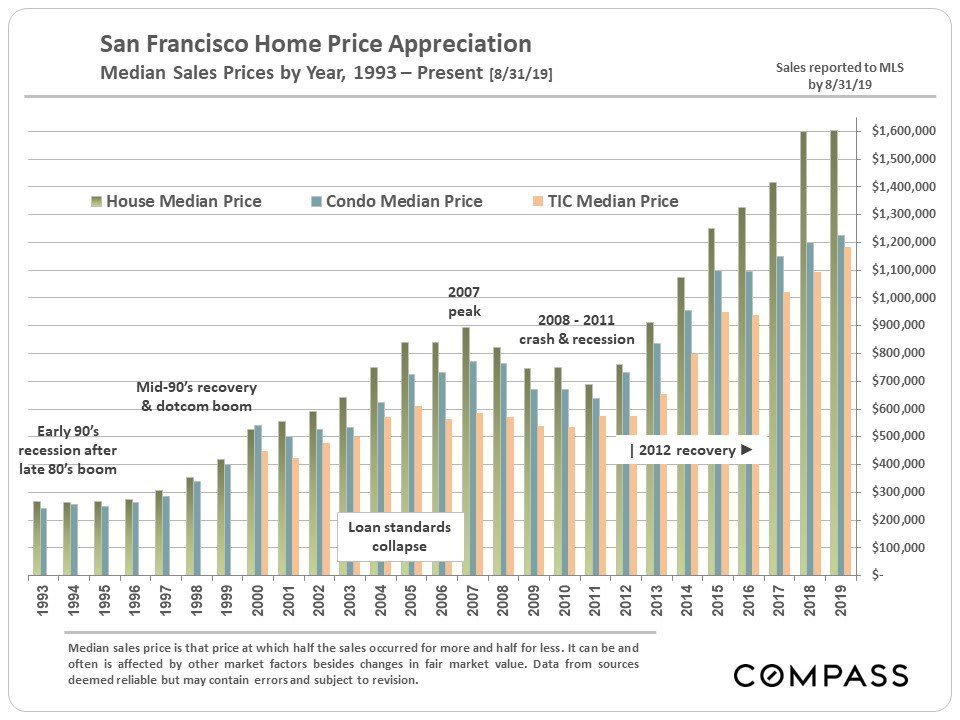
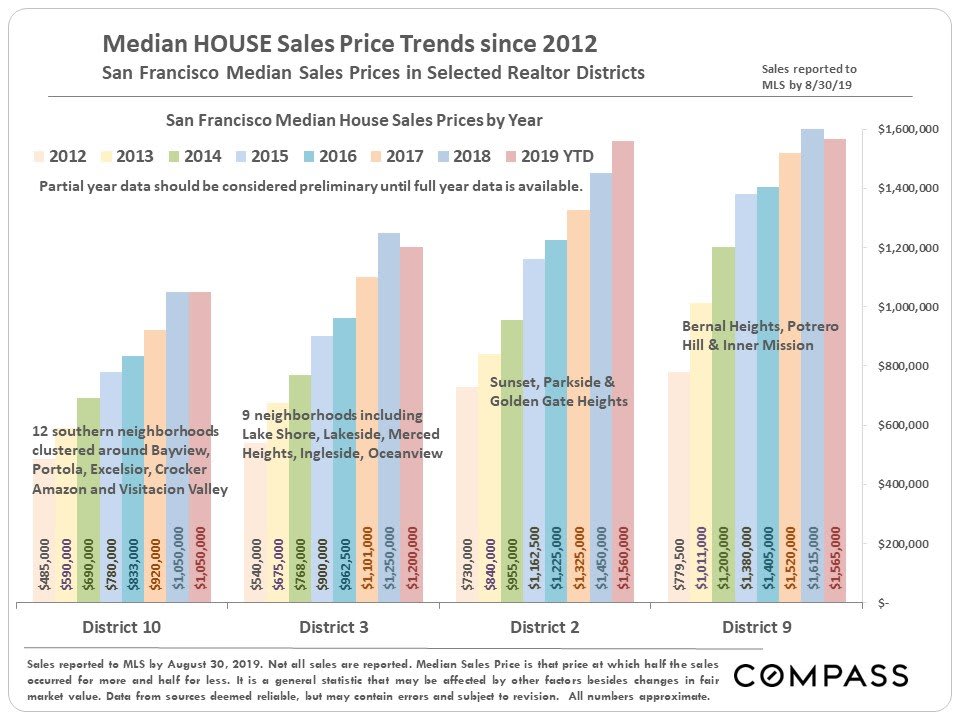
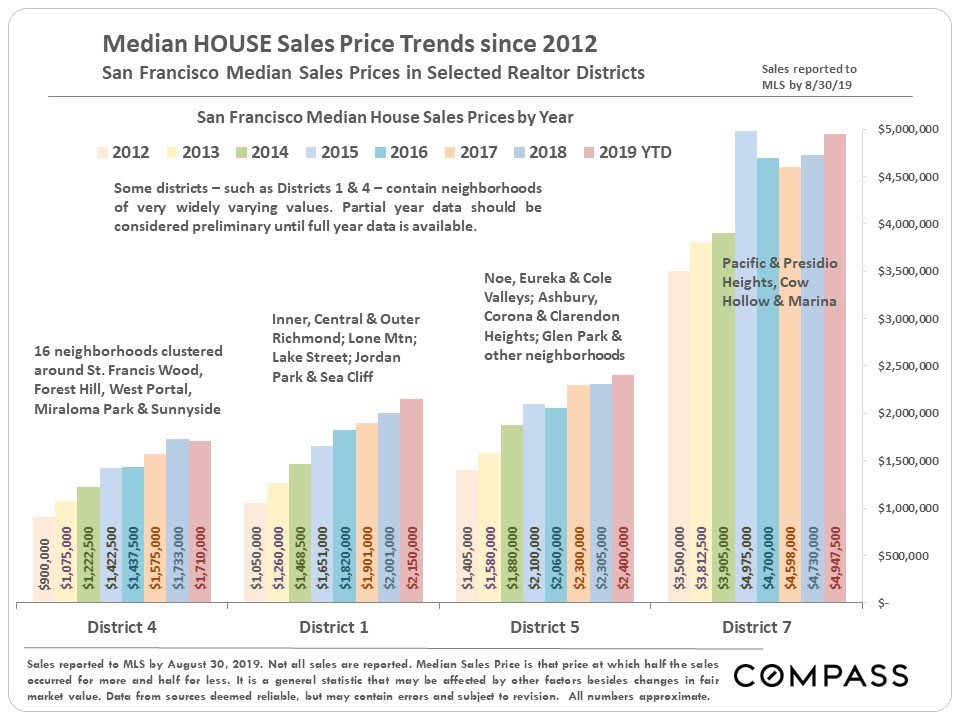
In the next chart, the 2019 YTD median sales prices should be considered preliminary until full year data is in. Note that it is more difficult to compare annual median condo prices on an apples-to-apples basis because of the huge number of new construction condos – many at higher prices – coming on market in the last few years. Comparing 2019 YTD to 2018, the median house sales price is about the same, even though new monthly and quarterly peaks were hit year to date.
Supply & Demand Dynamics since 2005
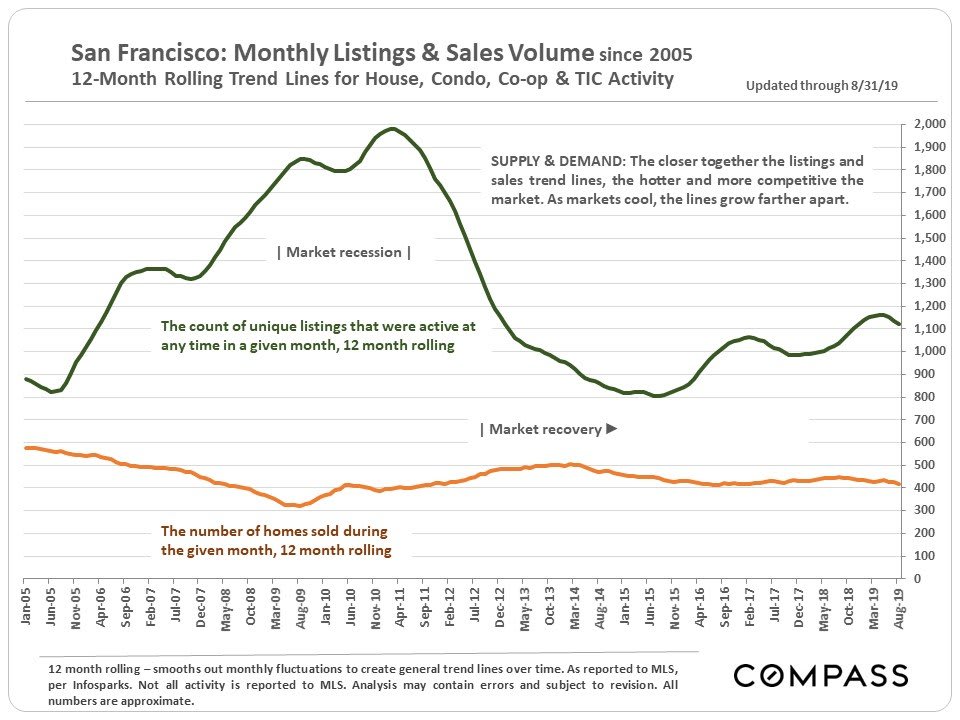
The chart below compares supply, the number of active listings on the market, with demand, as measured by the number of sales. This is a 12-month-rolling graph that smooths out normal monthly fluctuations to provide clearer historical trend lines.
San Francisco Home Prices & Appreciation
by Neighborhood & District
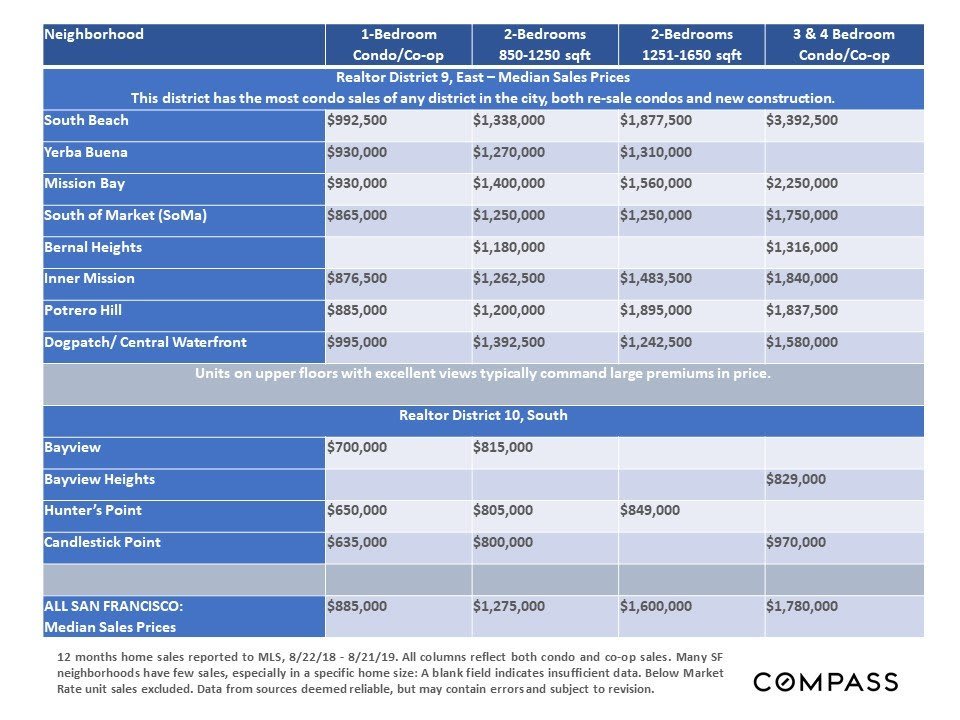
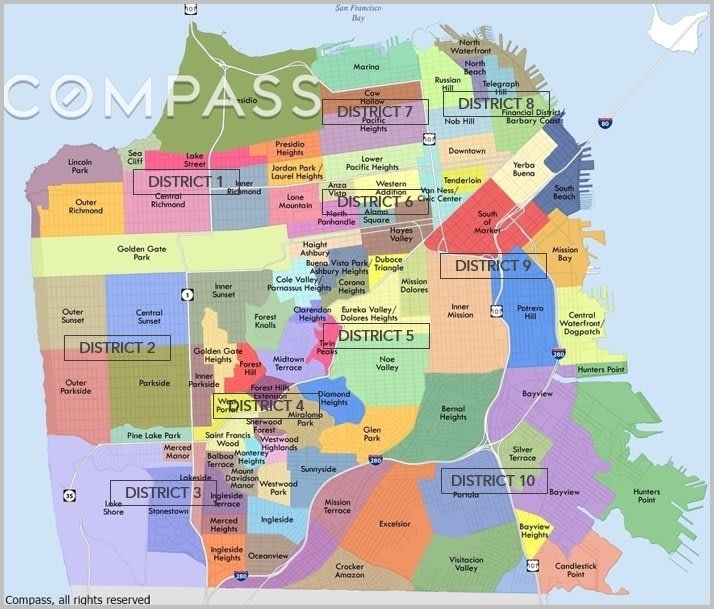
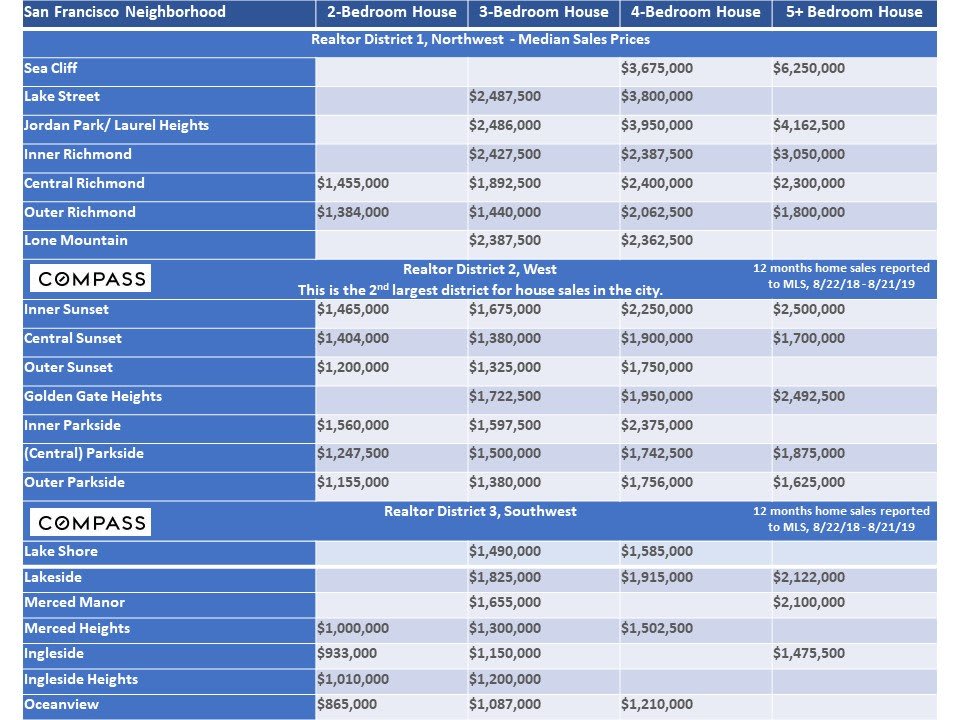
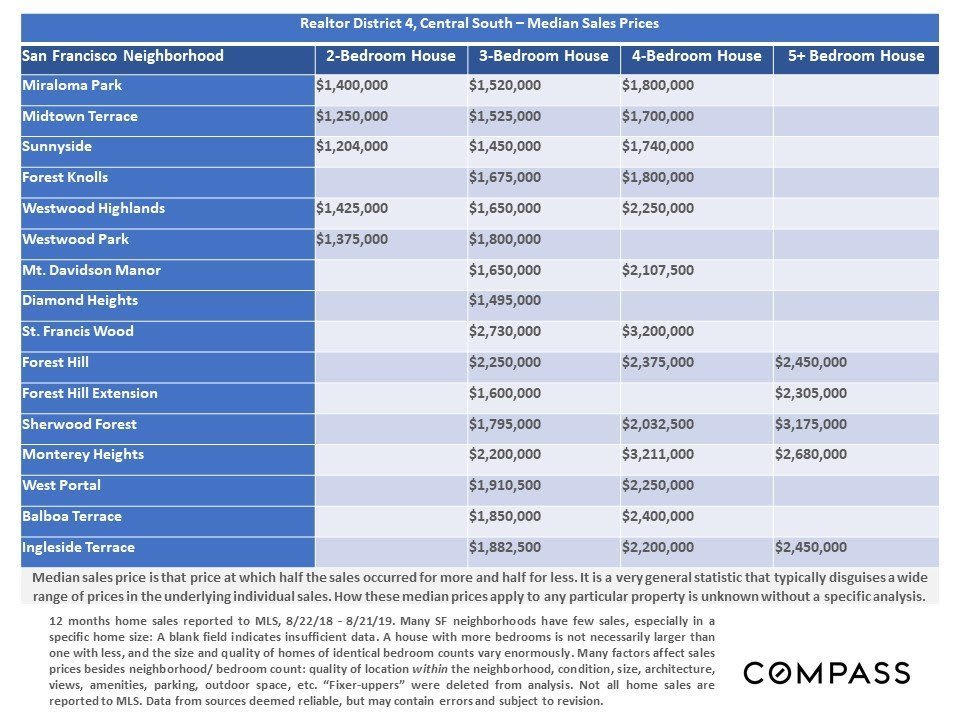
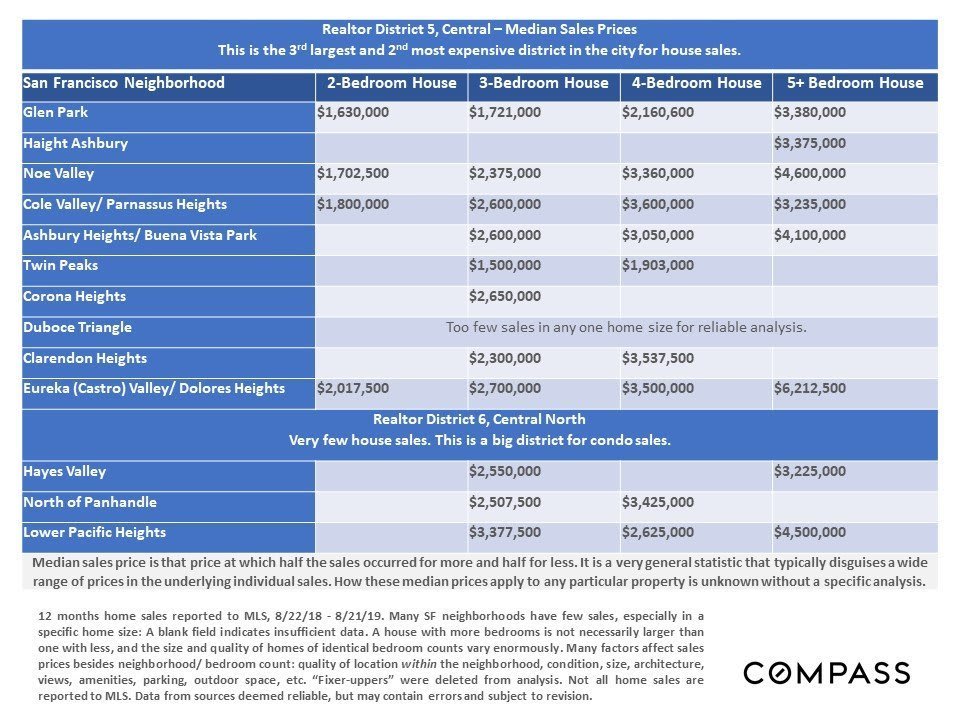
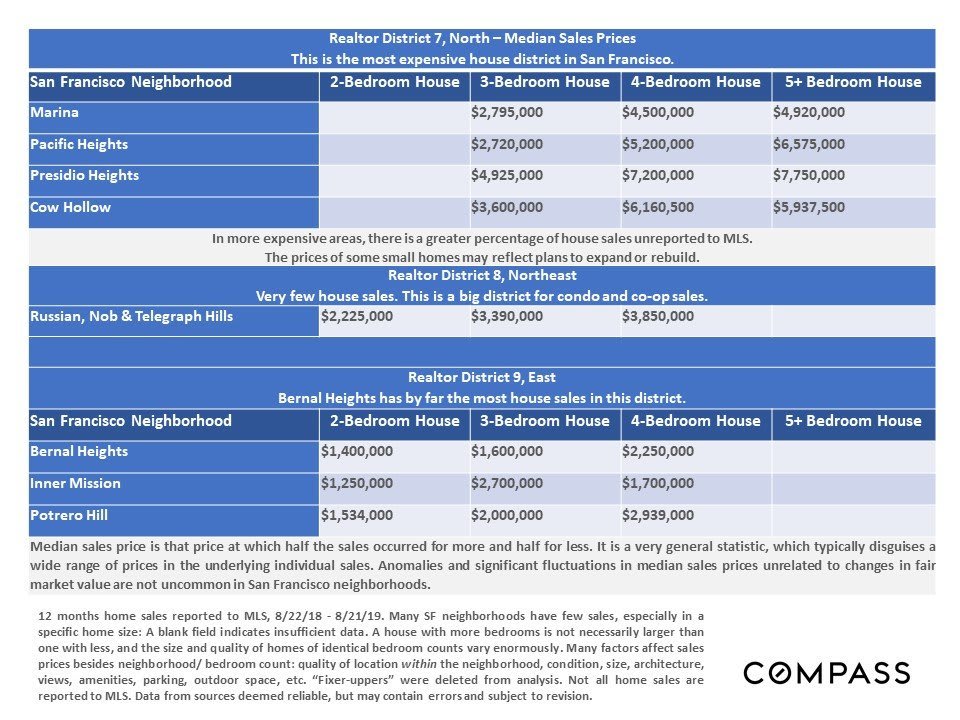
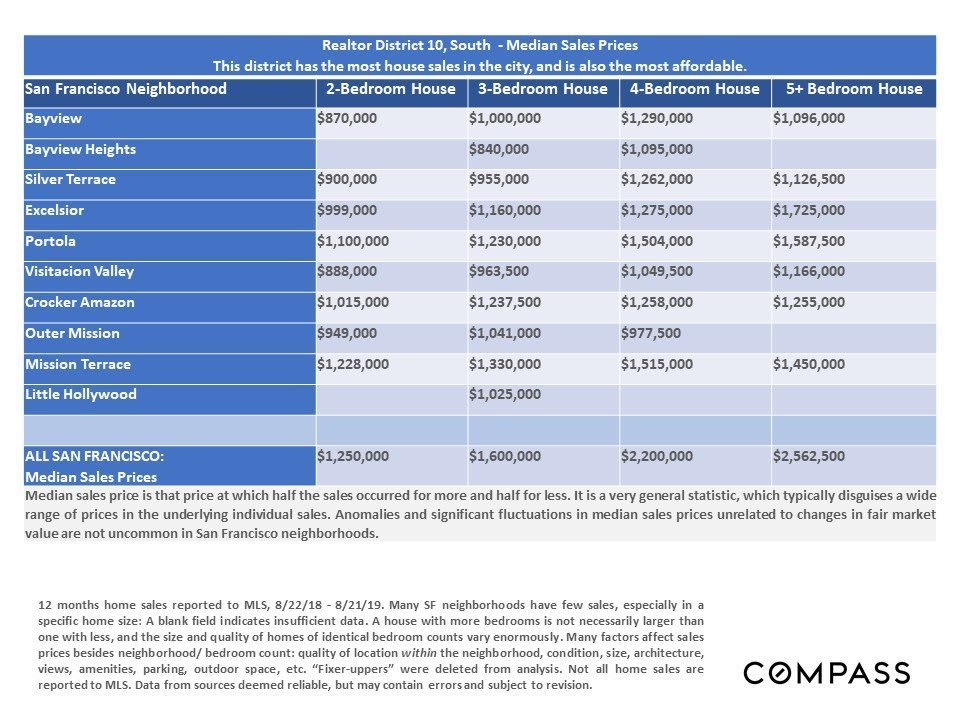
The next long series of charts and tables looks first at house prices by neighborhood, and then at condo and co-op prices. We’ll start with our neighborhood/ Realtor District map for easy reference.
San Francisco Median House Sales Prices
by District & Neighborhood
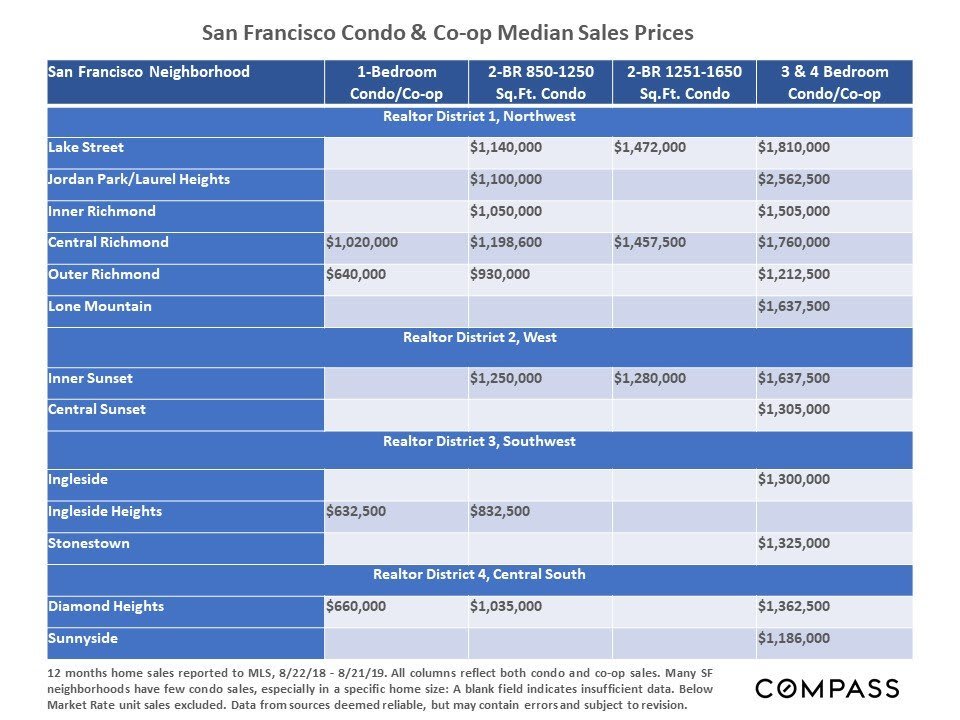
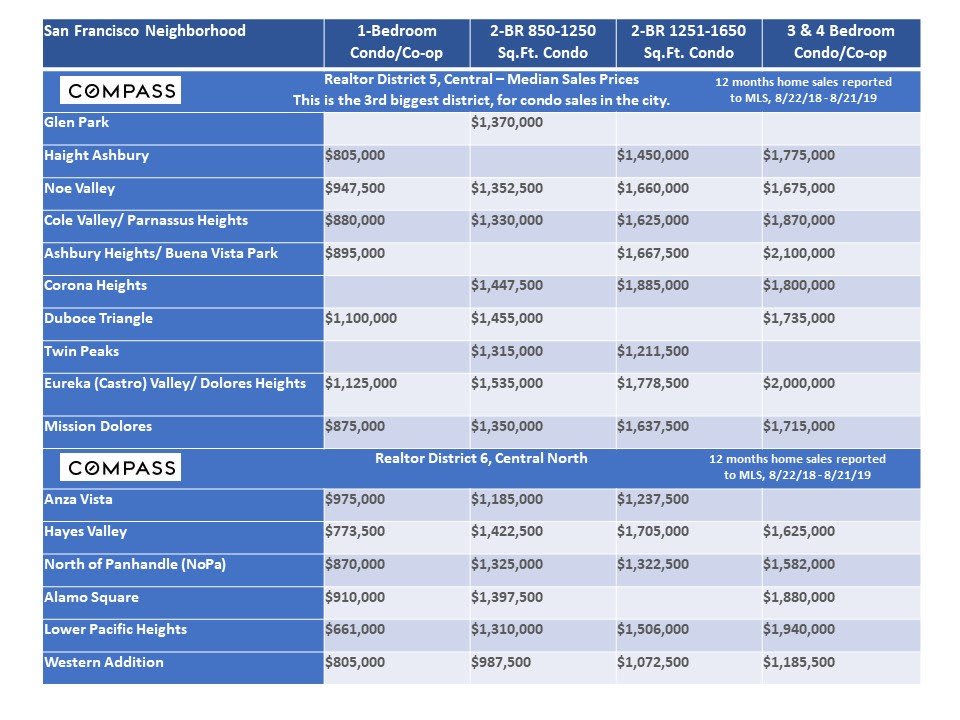
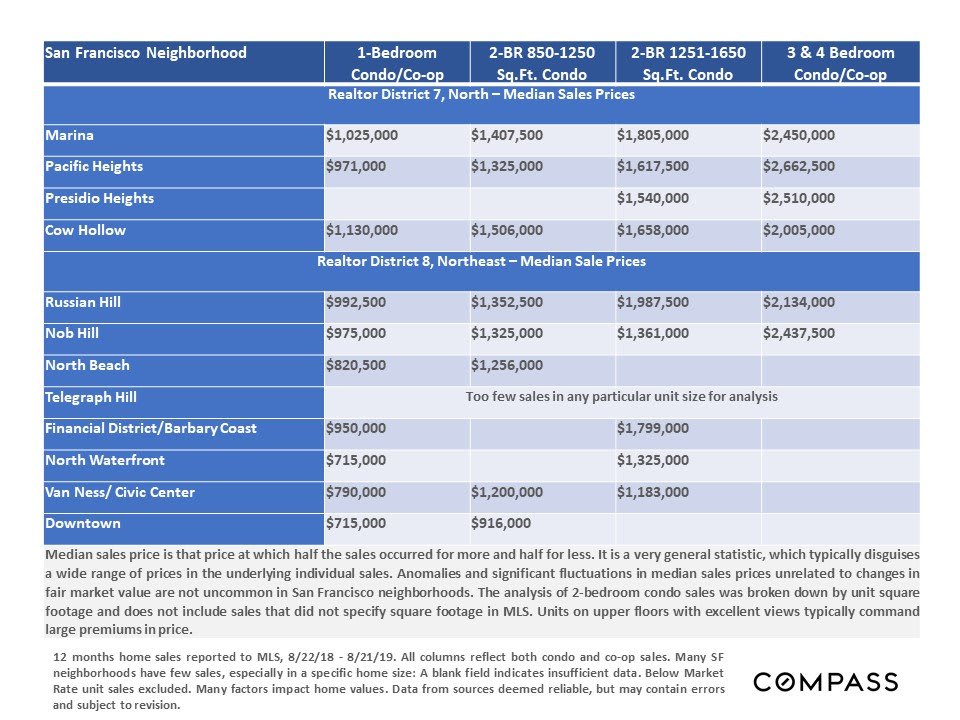
San Francisco Median Condo Sales Prices
by District & Neighborhood