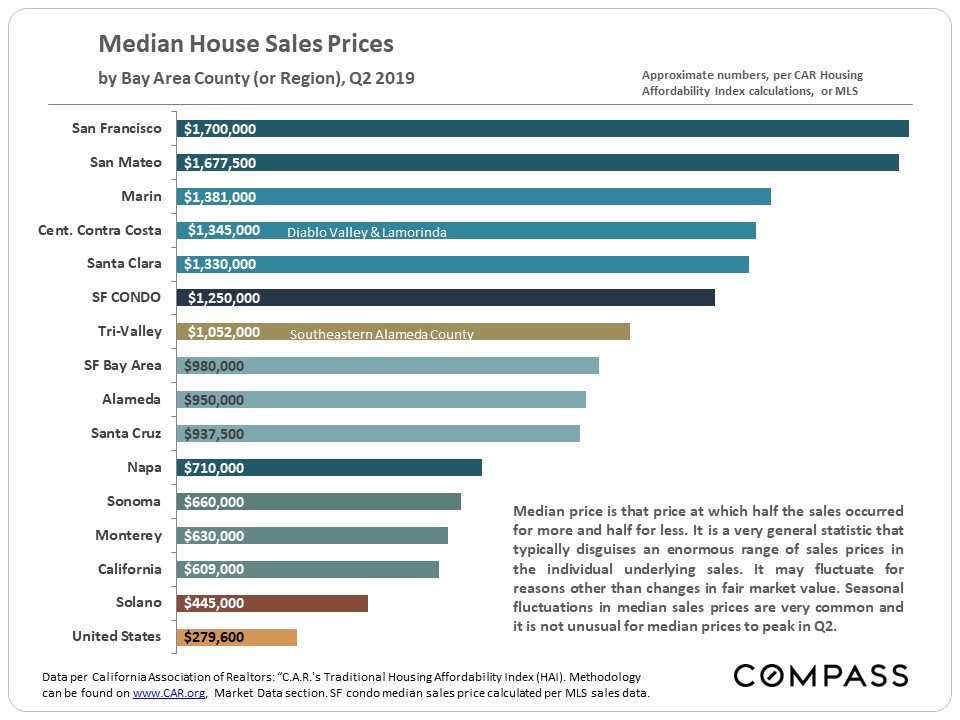
Note that it is not unusual for median home sales prices to peak for the calendar year in spring (Q2). This is due not only to heightened buyer demand, but also to the extreme seasonality of the luxury home market – more luxury home sales (as a percentage of total sales) pull overall median sales prices up.
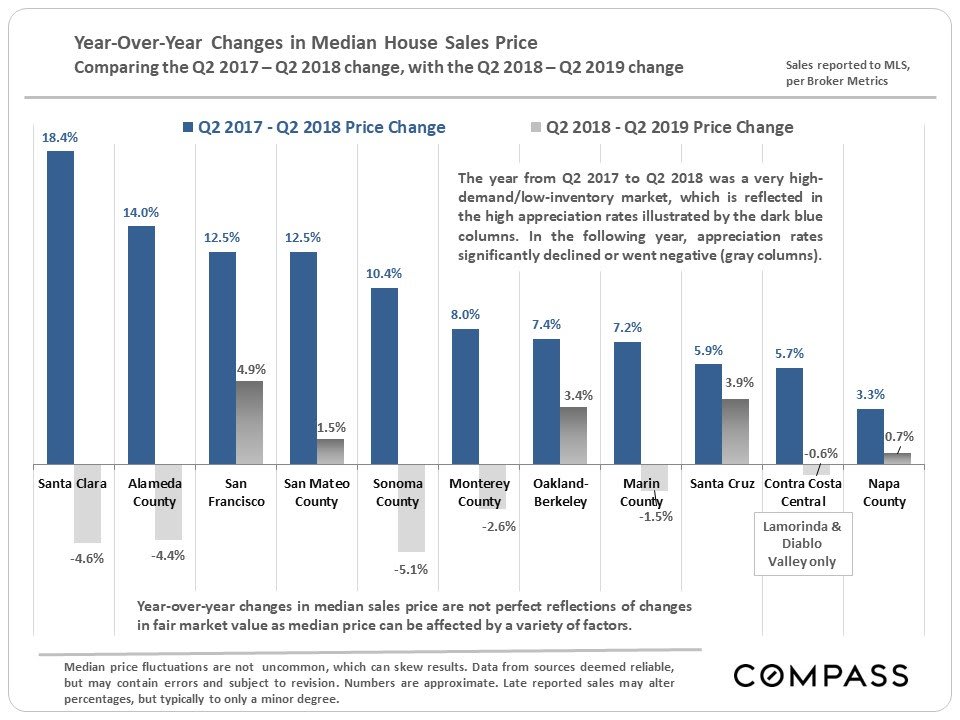
Year-over-Year Median Home-Price Appreciation (or Depreciation) Rates
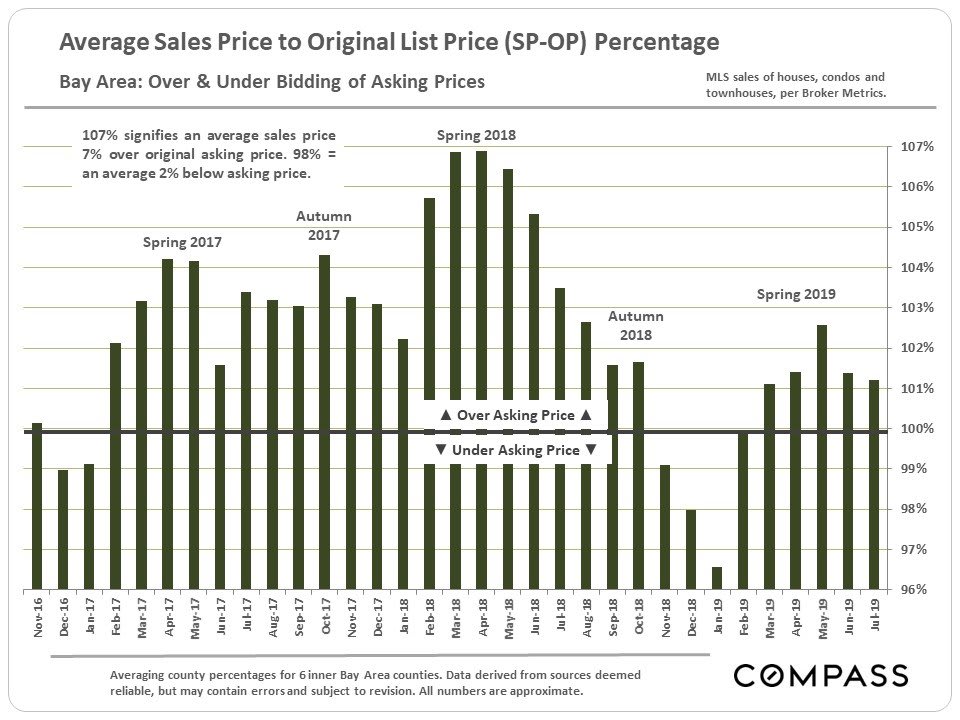
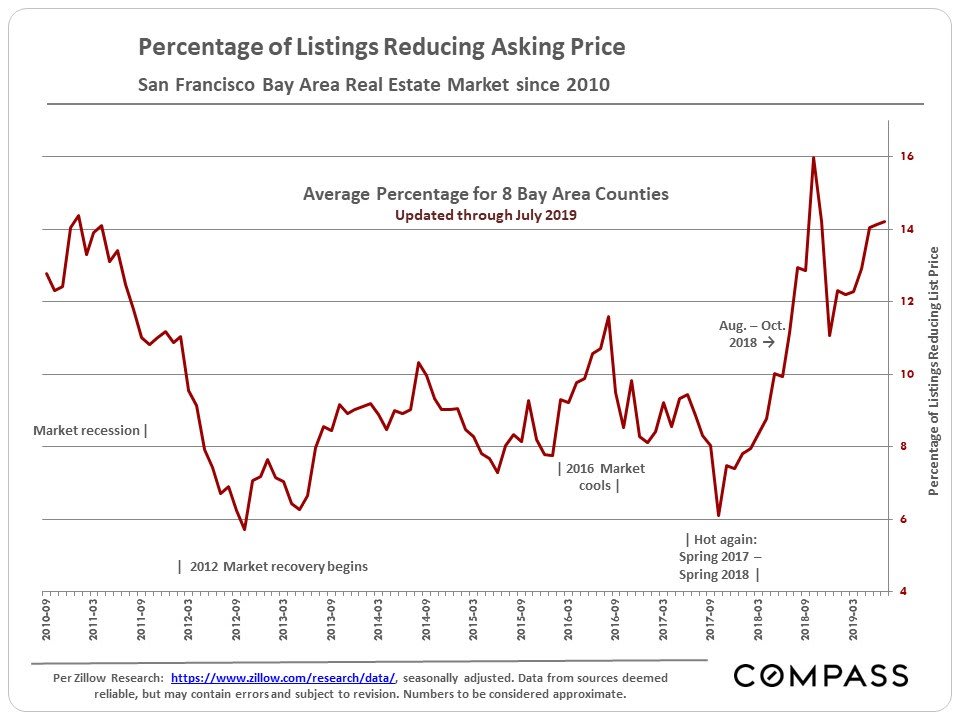
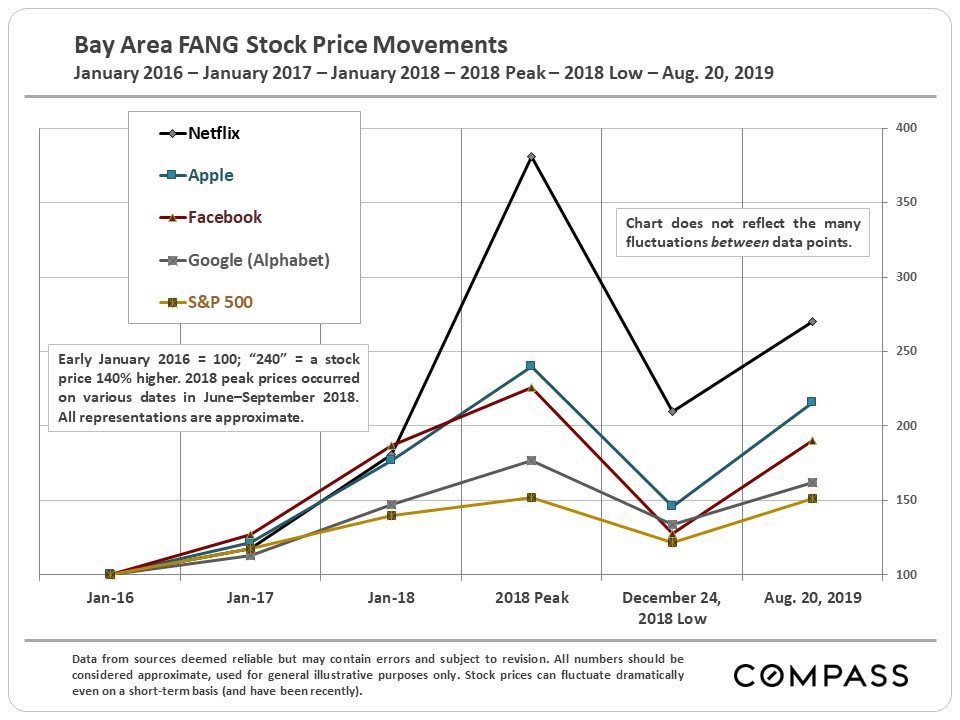
Markets in late 2017 through spring 2018 were very hot virtually throughout the Bay Area – perhaps the hottest they’ve been since 2000, the height of the dotcom boom. In the second half of 2018, markets cooled considerably – besides issues of simple affordability, financial markets saw nerve-wracking volatility and large declines, and interest rates jumped dramatically. Then, in 2019, stock markets recovered to hit new peaks and interest rates hit multi-year lows, and markets heated up again.
However, generally speaking, except for those markets most affected by the slew of local high-tech IPOs – San Francisco and the greater Oakland market – most markets saw either no significant year-over-year appreciation or year-over-year declines in median house sales prices. (Santa Cruz County bucked this trend.) The next major indicator of market direction will come from autumn selling season data: The season runs from early-mid September to early-mid November. Markets then typically go into the mid-winter holiday doldrums for a couple months.
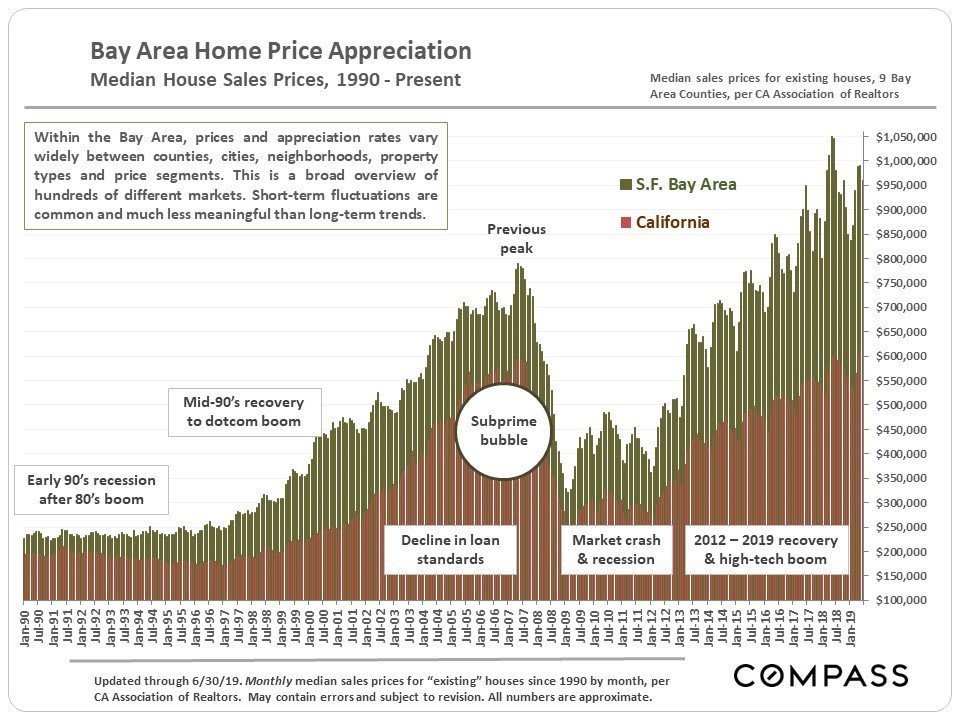
Bay Area & California Long-Term Median House Price Trends
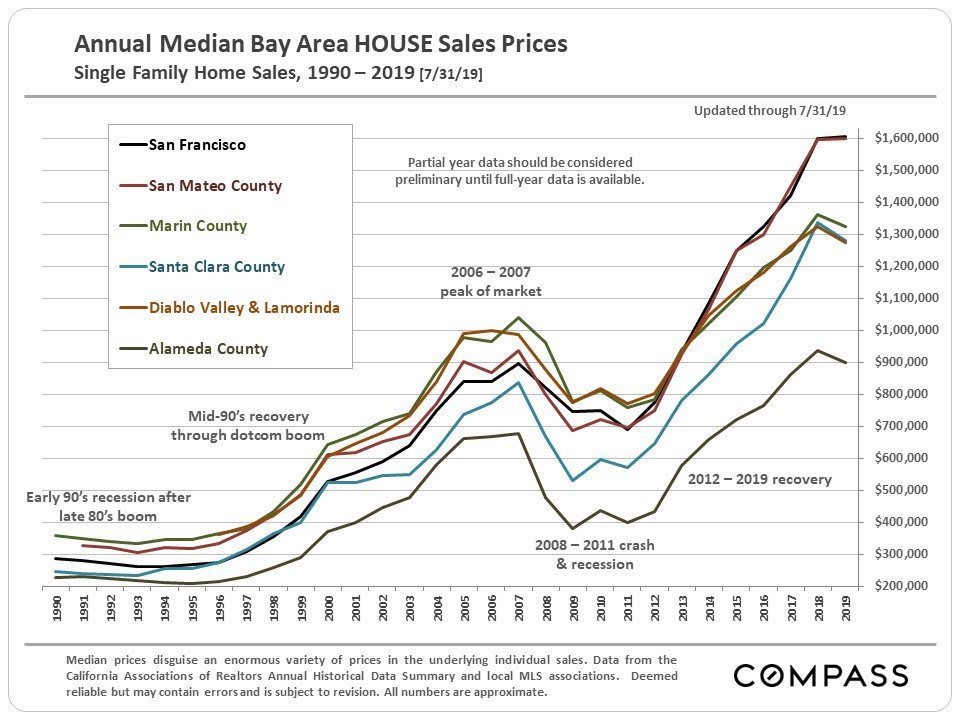
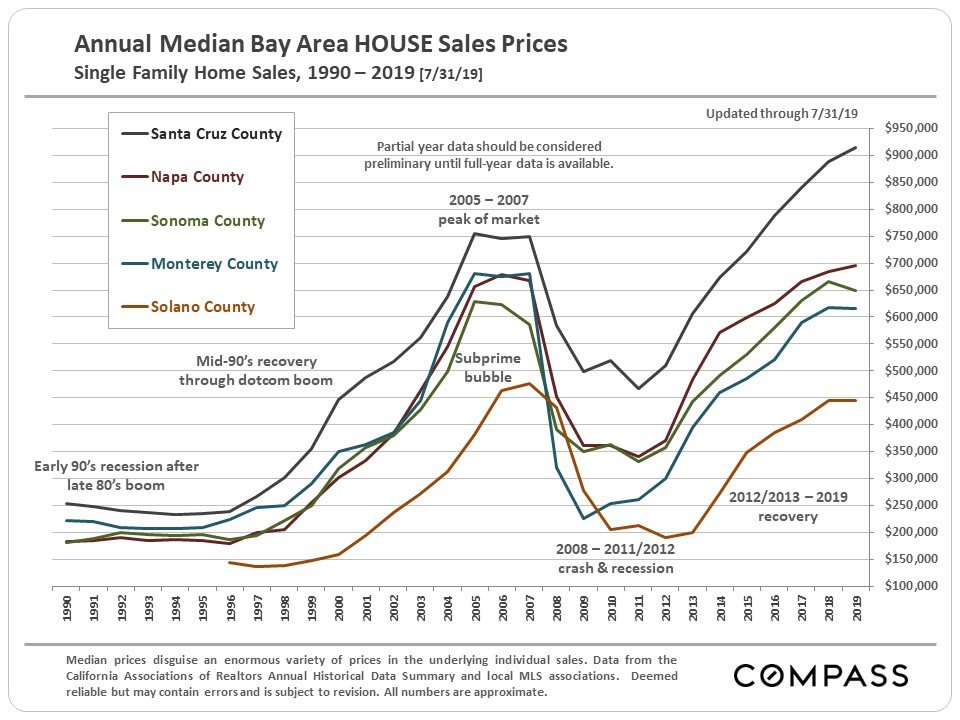
Median House Sales Price Trends by Bay Area County
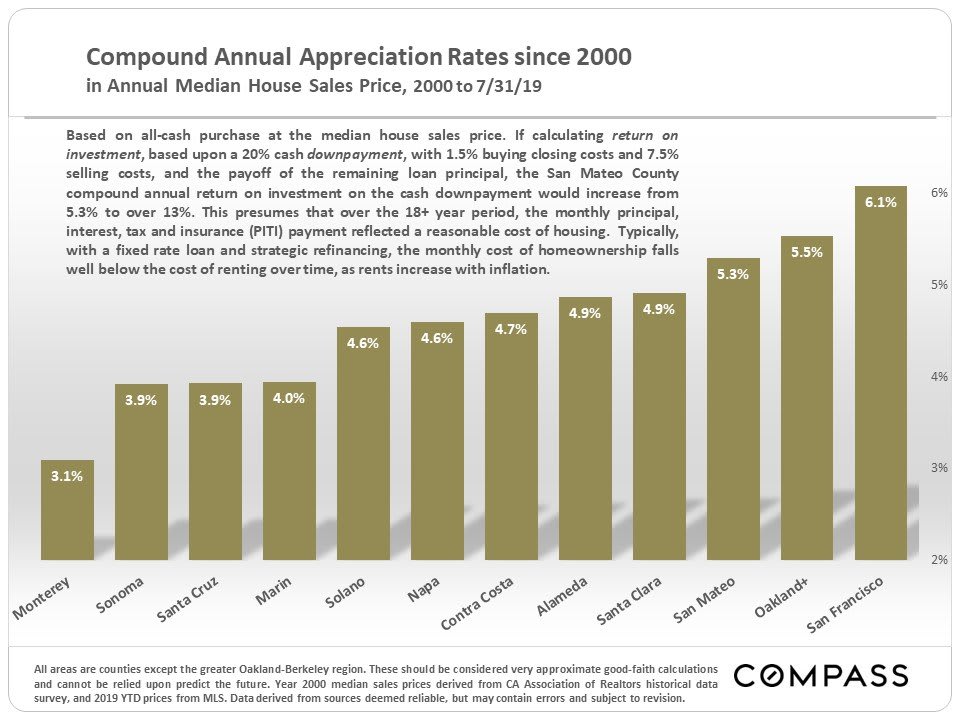
Compound Annual Home Price Appreciation Rates
When calculating these rates, results can vary enormously depending on the year the calculation begins with. These start with the year 2000 – if we started with 1995 – prices rapidly appreciated between 1995 and 2000 – the rates would jump; if we began with 2007 – the height of the subprime boom – then the rates would drop. (The same issue exists with calculating stock market returns.)
These very approximate calculations do not reflect any of the tax benefits that have applied at various times to home ownership and to the sale of one’s primary residence. And they are based simply on the all-cash purchase price and the sales price, without adjusting for closing costs (or the effect of not paying all cash upon purchase).
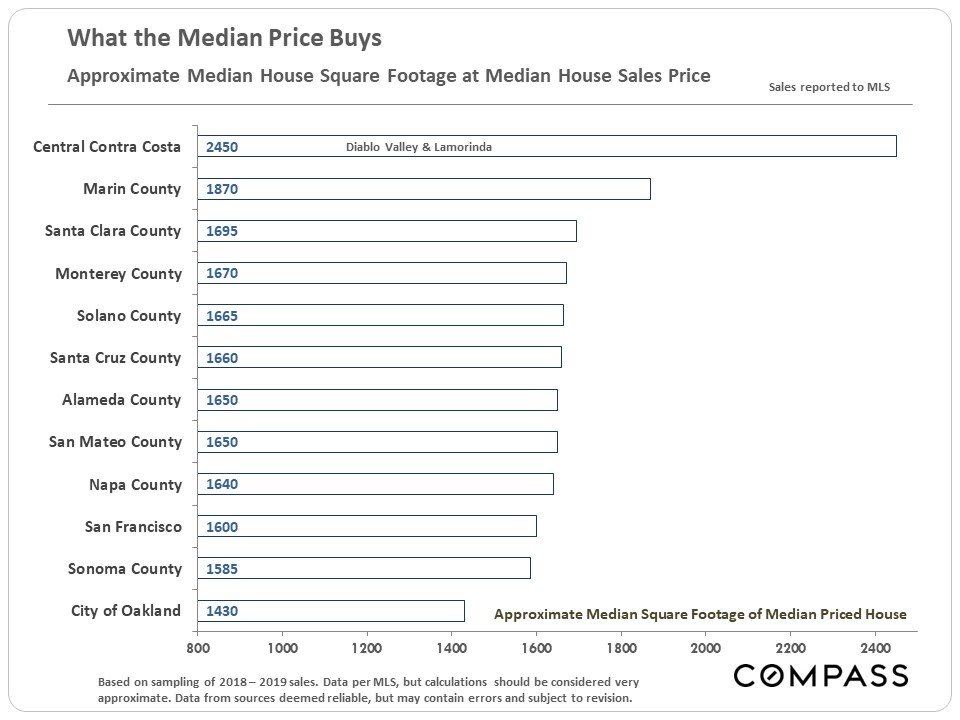
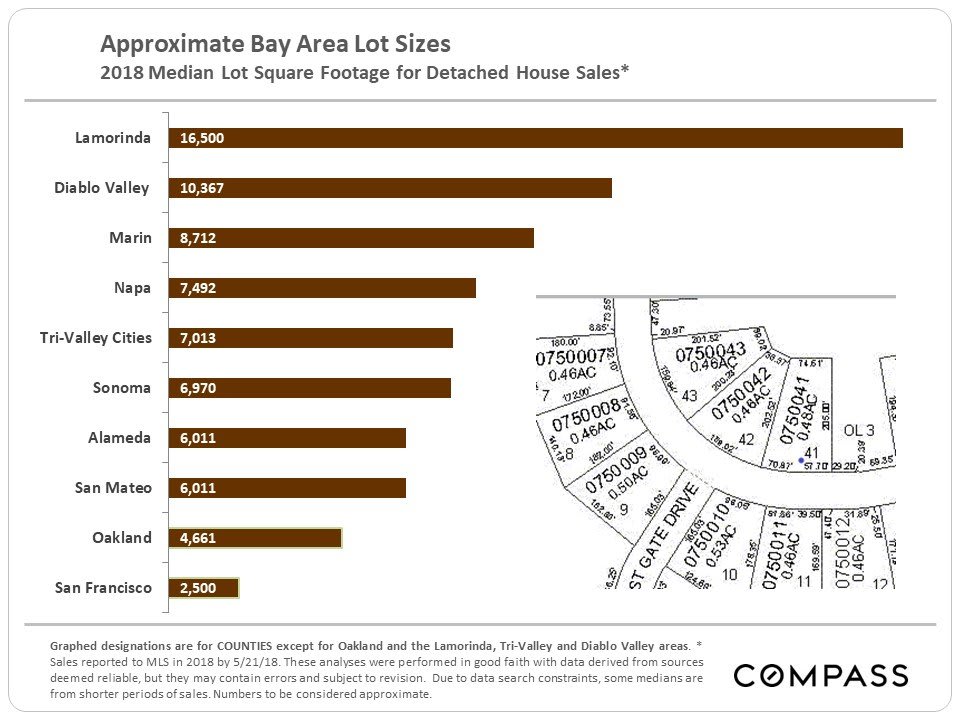
Bay Area House & Lot Sizes
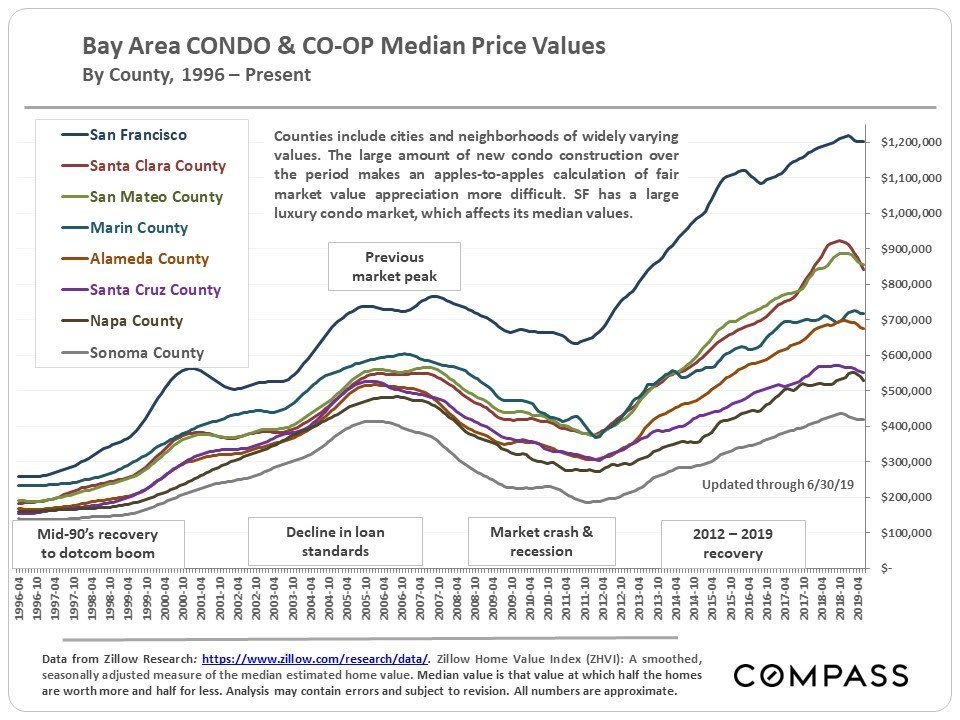
Bay Area Median Condo Values
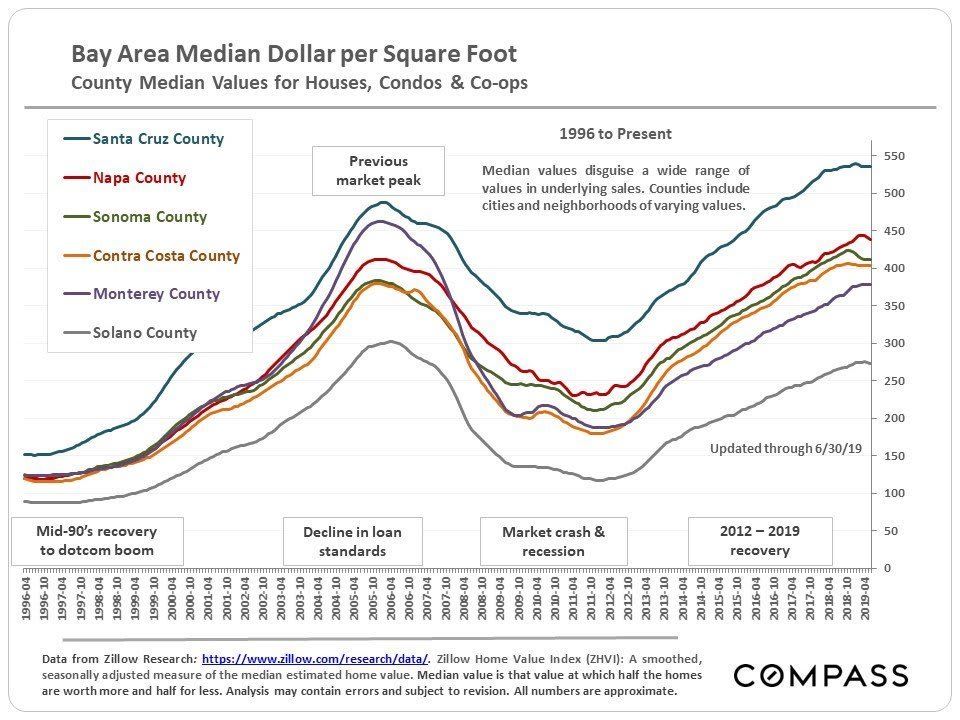
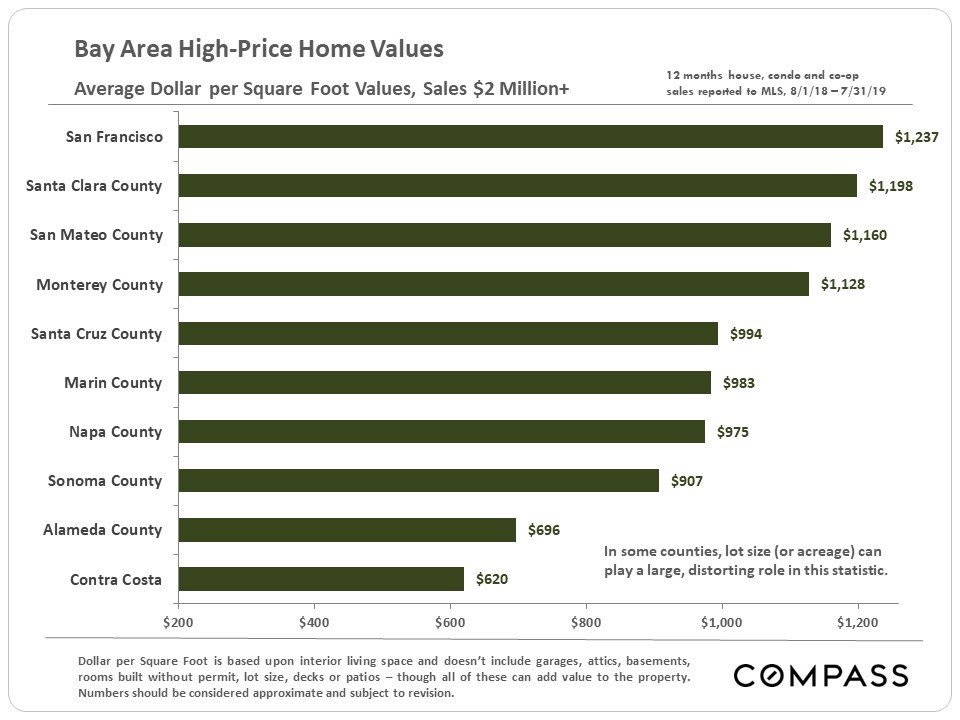
Bay Area Median Dollar per Square Foot Values

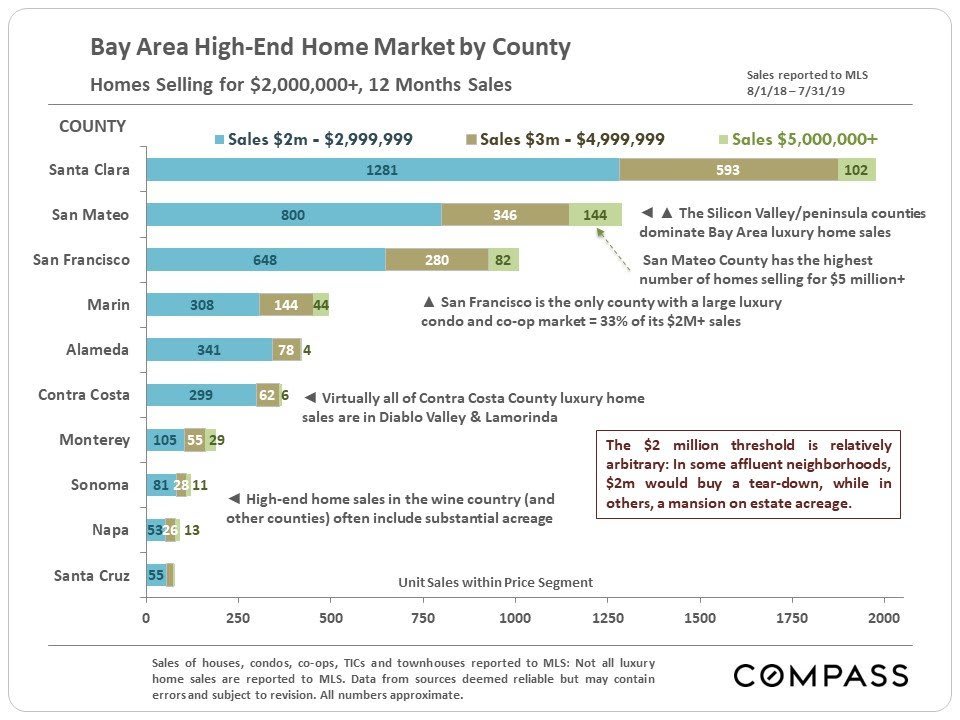
Bay Area Luxury Home Markets
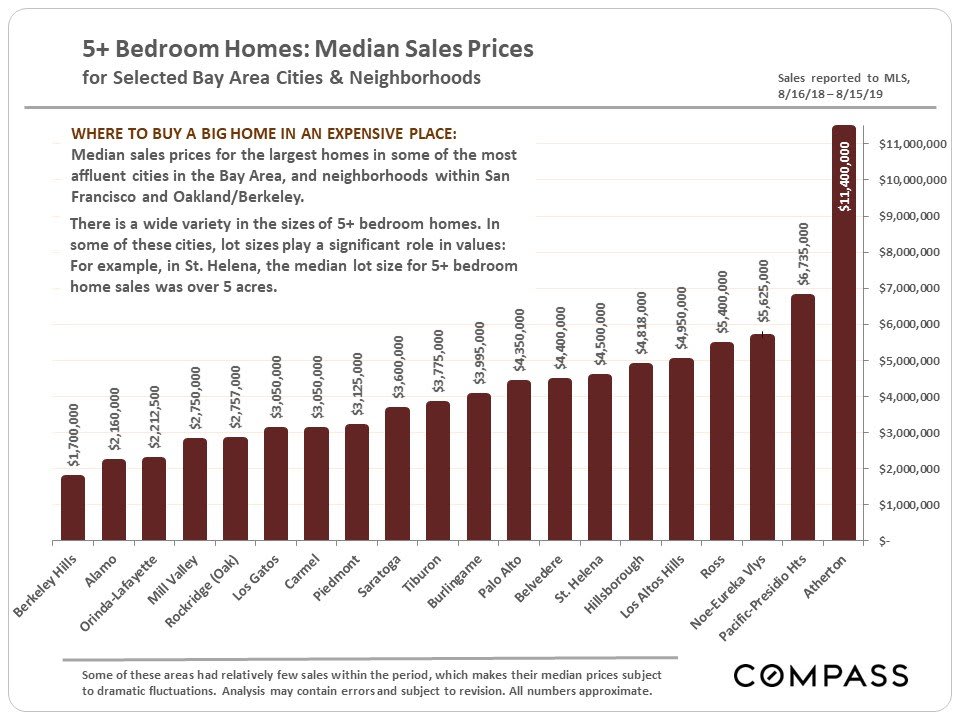
Median Sales Prices for Large Homes in Expensive Bay Area Markets
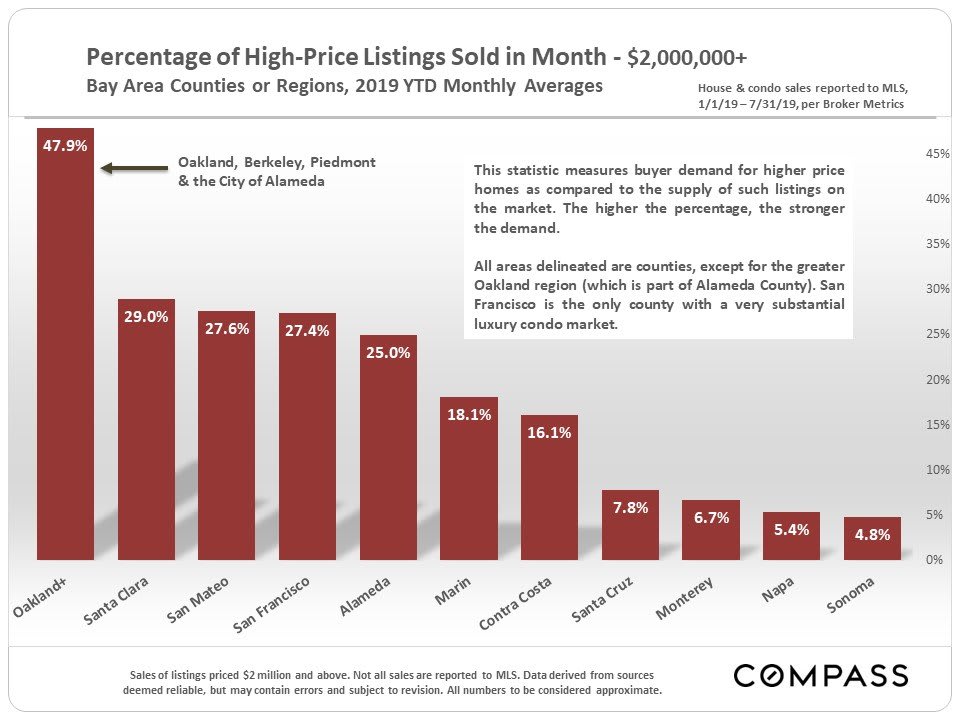
High-end home markets in outlying counties – the four with the lowest percentages in the chart below – have softened considerably, and would typically be considered to be in buyer’s market territory – much more supply than demand. This doesn’t mean, however, that some luxury homes there don’t sell quickly at excellent prices. It does mean that many luxury homes don’t sell without price reductions, or don’t sell at all.
In many ways, average dollar per square foot values give a better indication of what one actually gets for one’s dollar in different counties.
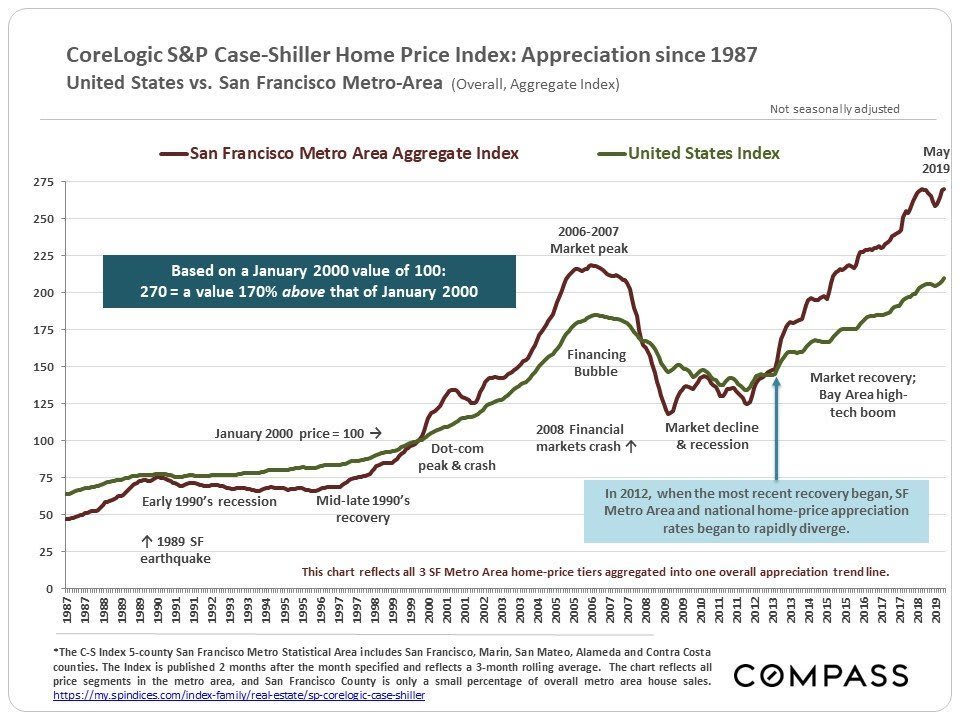
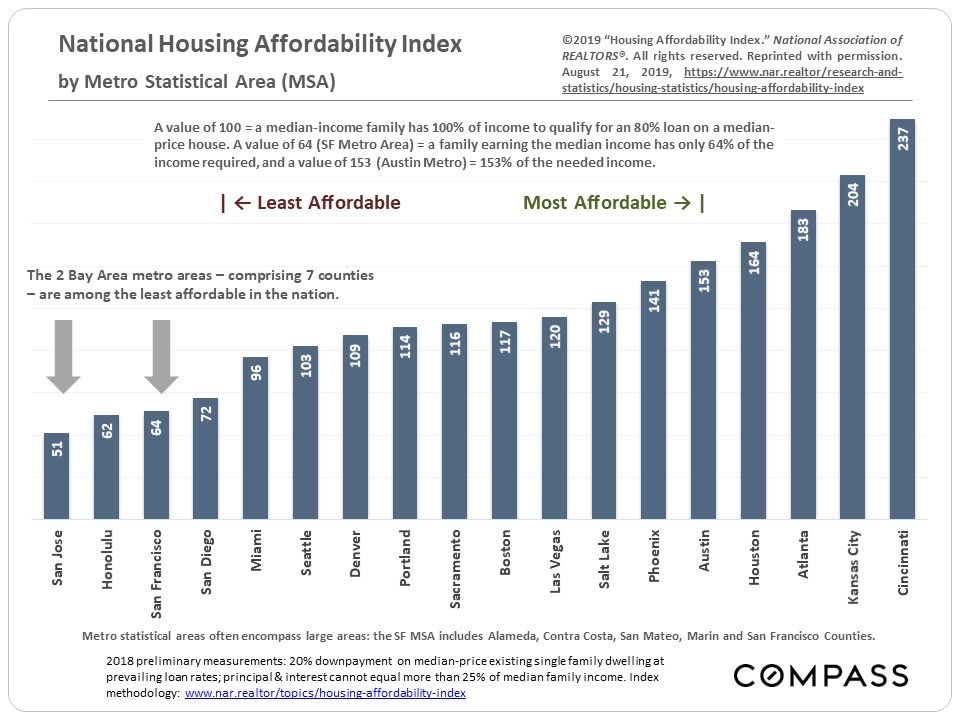
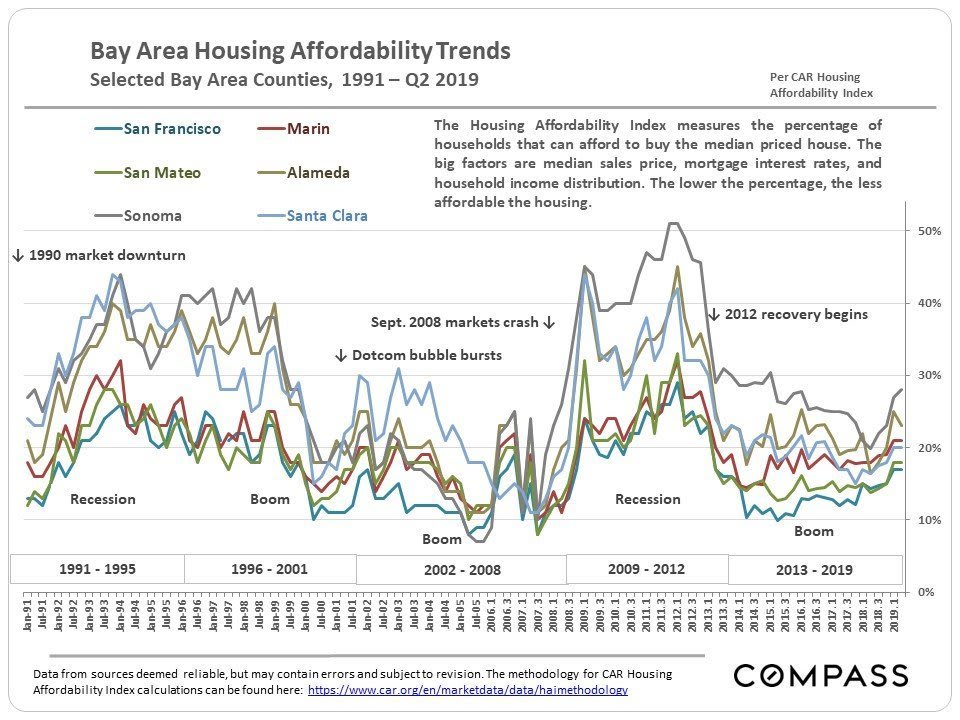
Bay Area & U.S. Home Prices, Appreciation Trends & Affordability
The next chart illustrates the dramatic divergence since 2012 between Bay Area home price appreciation – supercharged by the high-tech boom – and the national trend line.
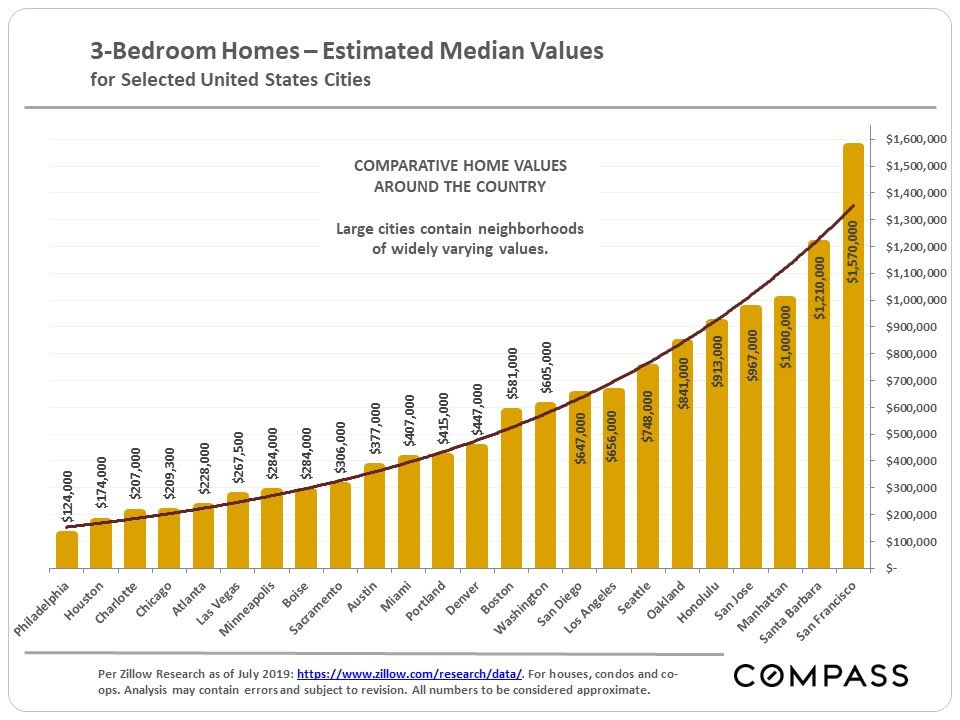
Median 3-Bedroom Home Sales Prices around the Country
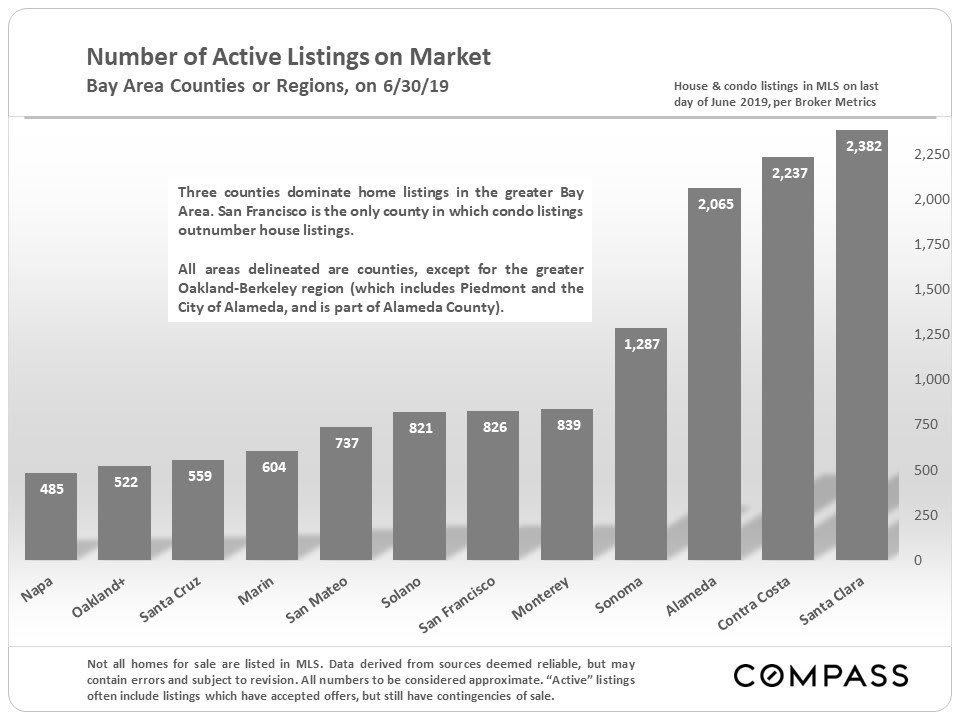
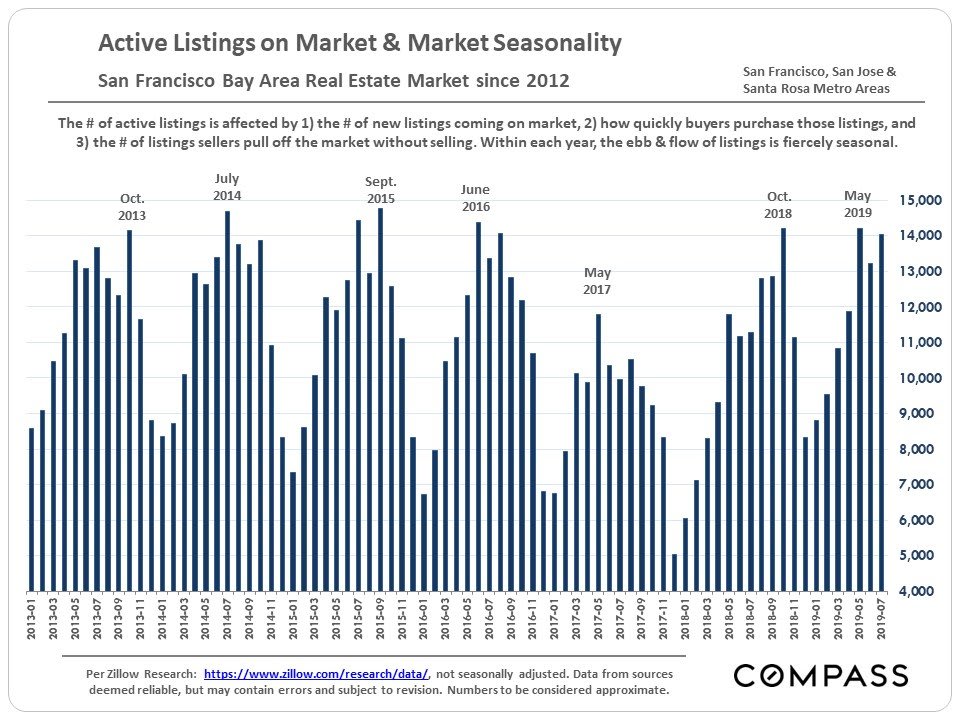
Active Listings on the Market
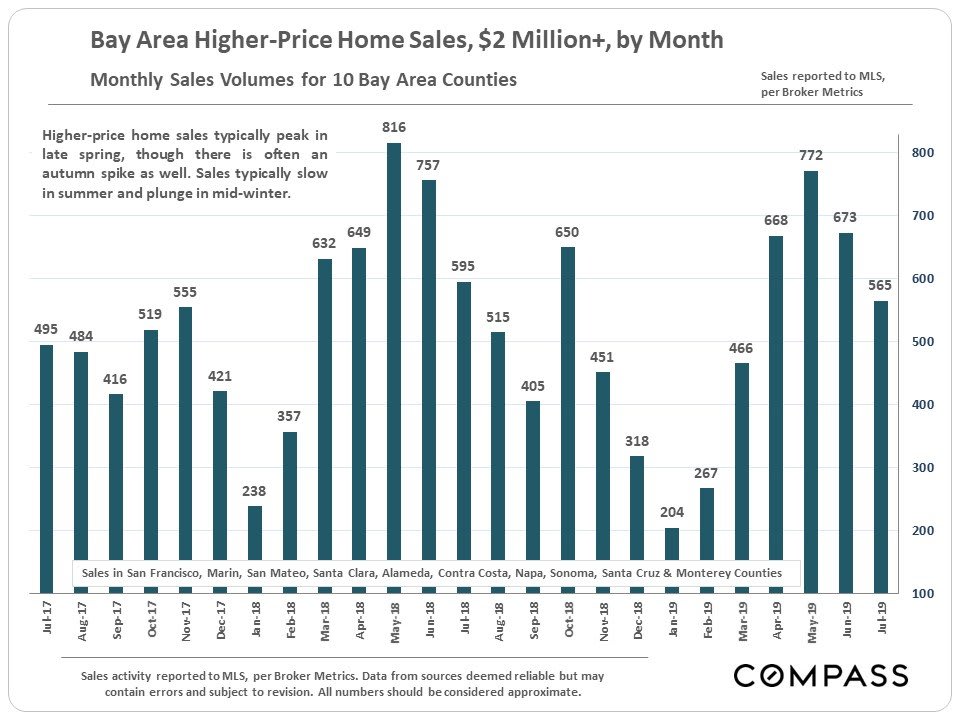
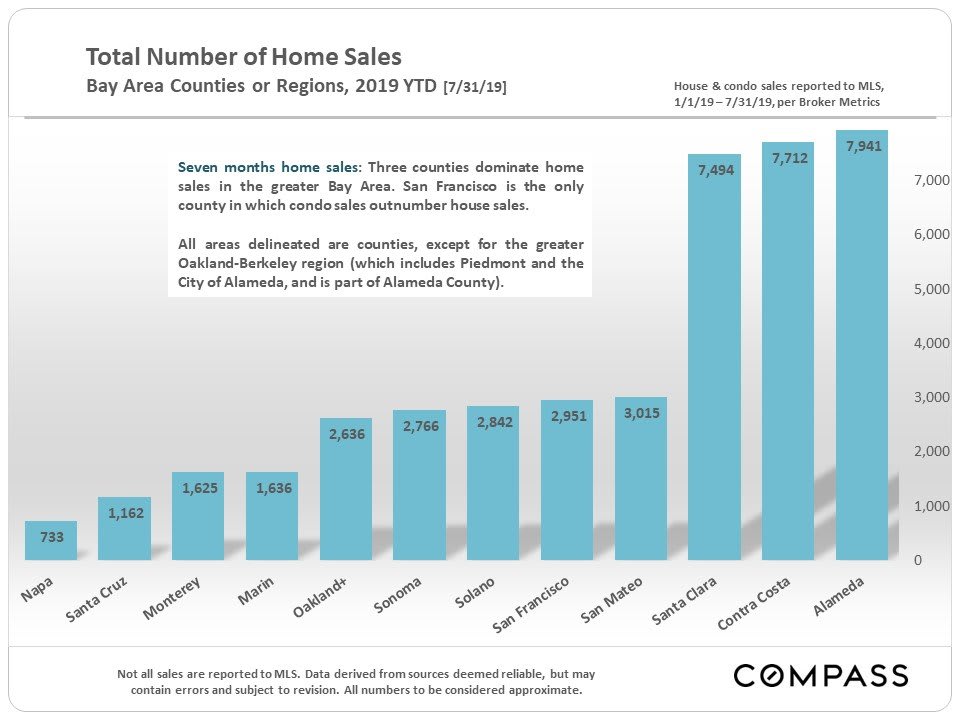
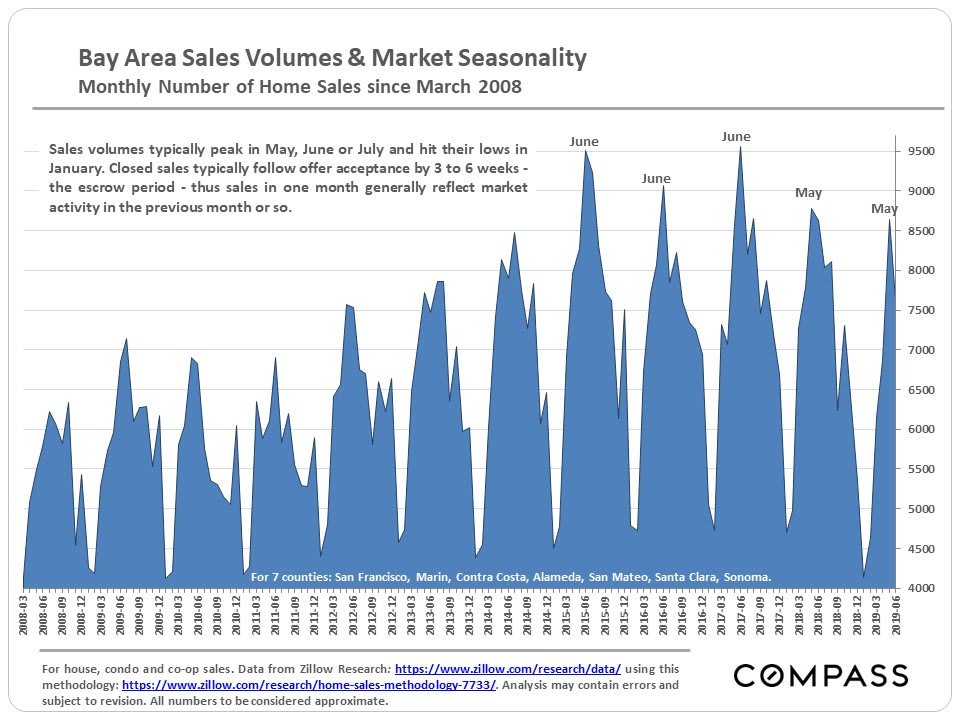
Home Sales Volumes
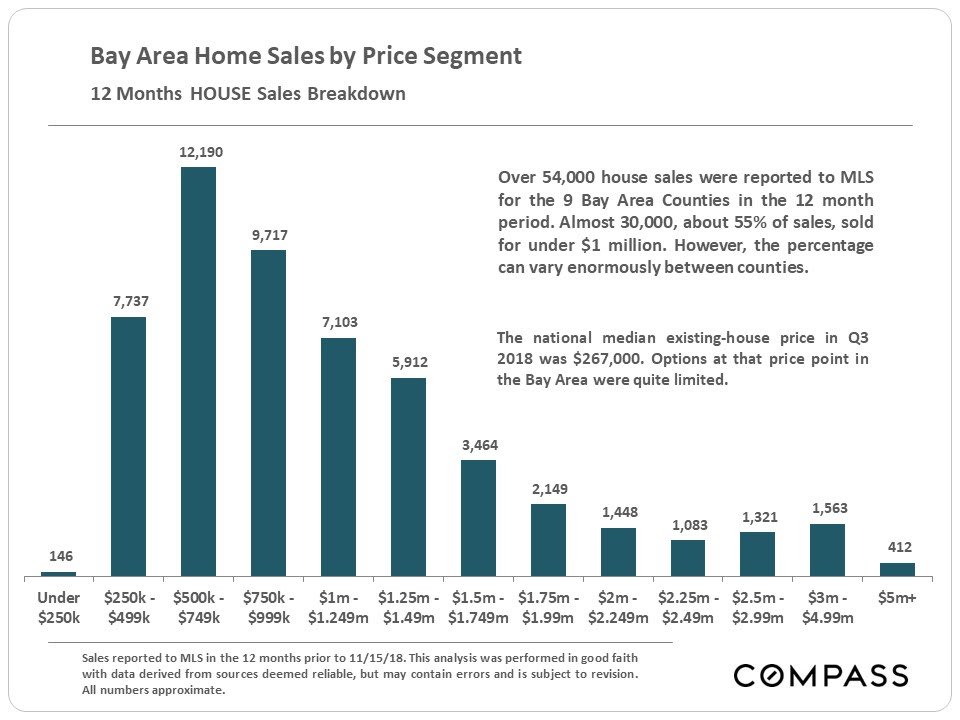
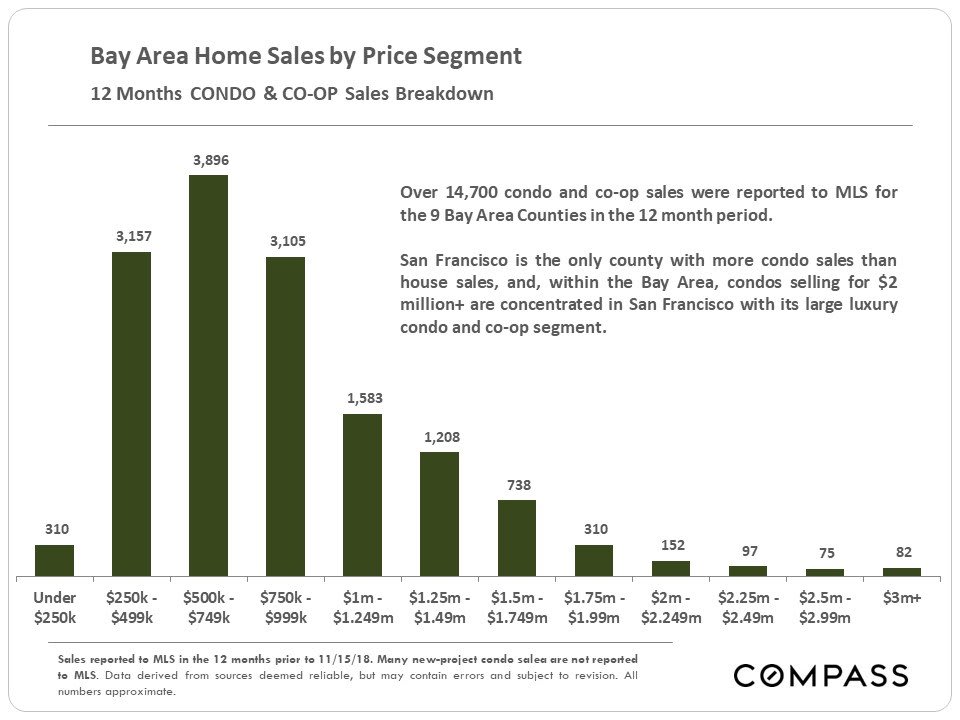
Bay Area Home Sales by Price Segment
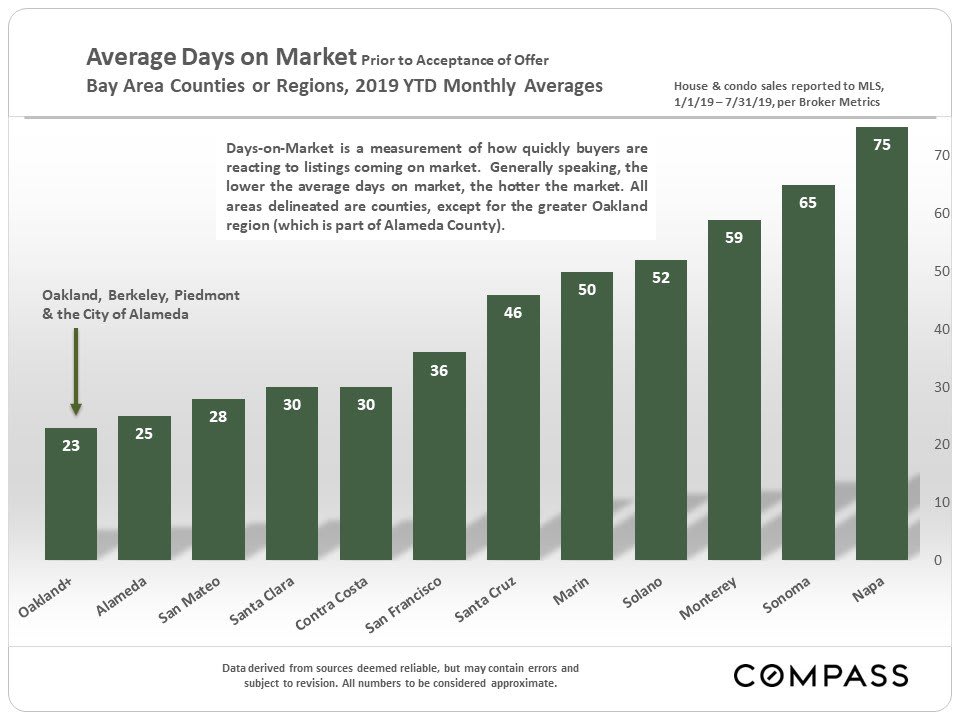
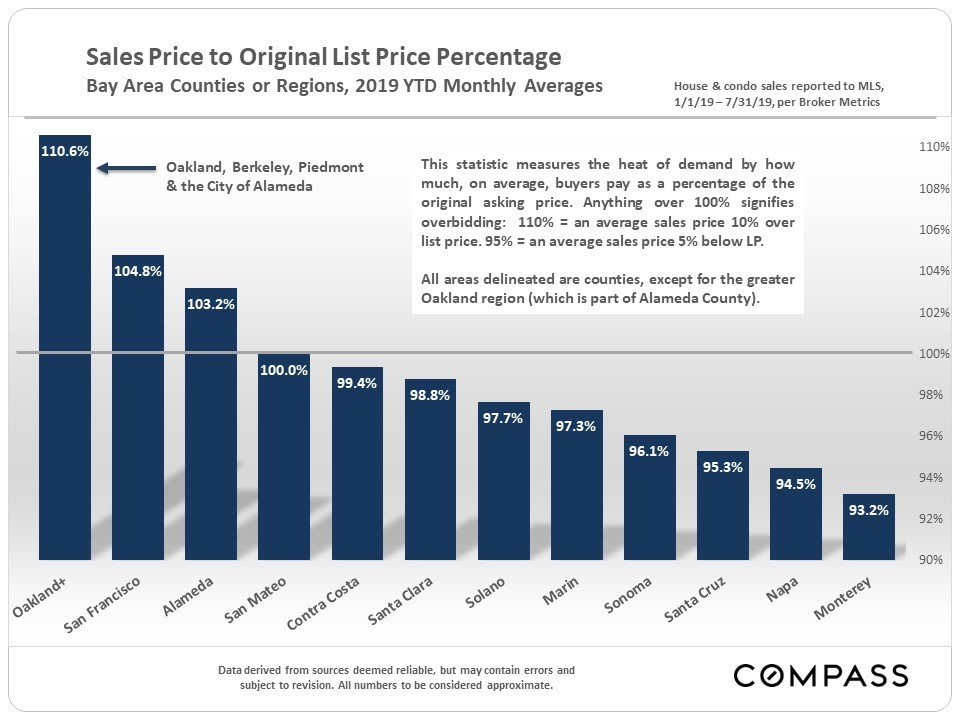
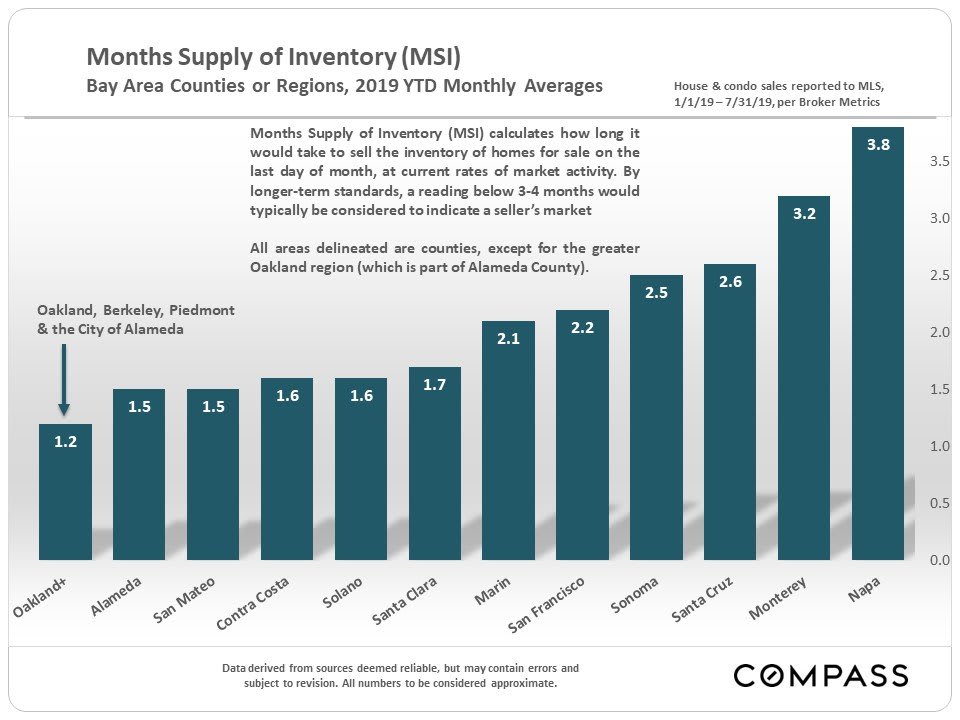
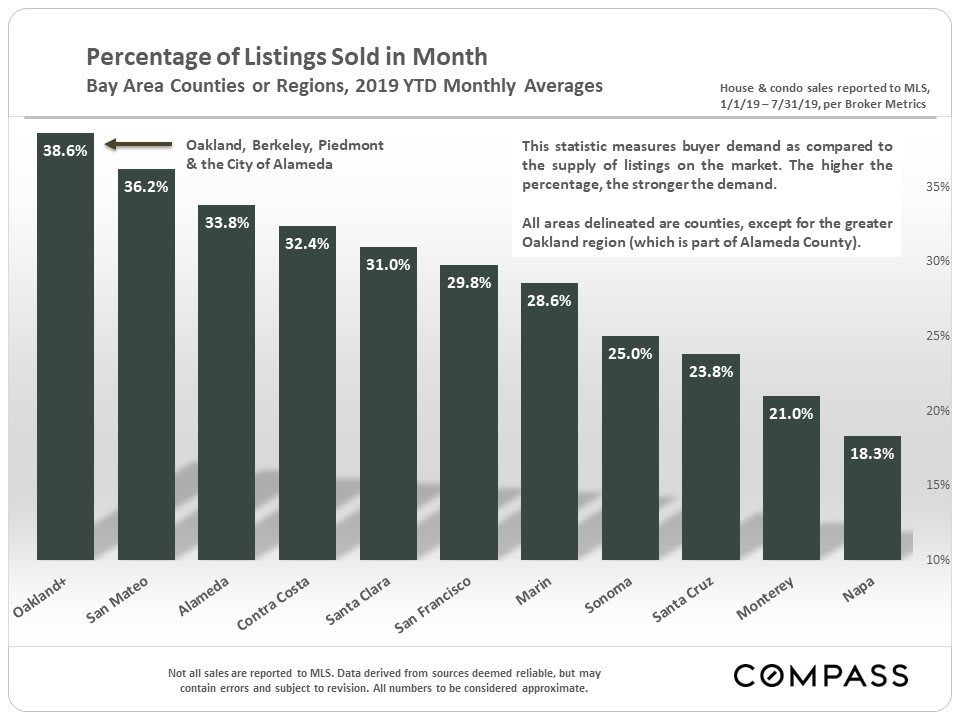
Bay Area Real Estate Market Indicators
Below are a wide variety of standard market statistics broken out by county or region to illustrate respective market conditions, as well as overall trend lines to illustrate the general market direction and the effect of seasonality on supply and demand.
Looking just at 2019 YTD stats, the greater Oakland-Berkeley market has been the strongest in the Bay Area. In San Francisco, the picture is muddied a little by the fact that the city’s house and condo markets have somewhat different dynamics: New-condo construction has increased supply in that segment, while the supply of house listings has declined markedly since 2010, making houses the scarce resource in a high-demand environment.

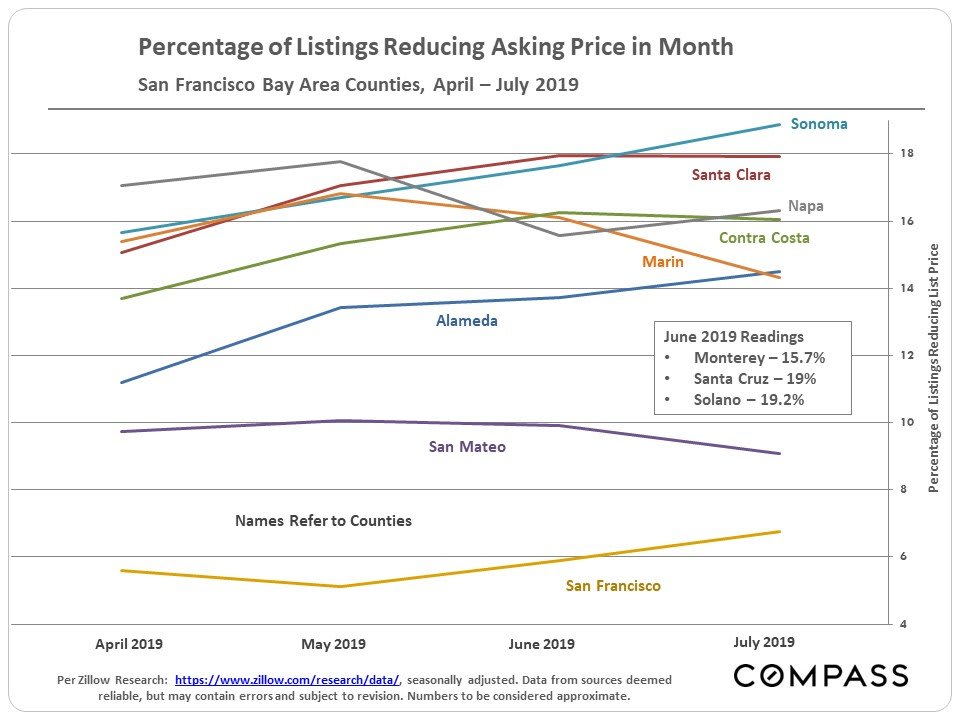
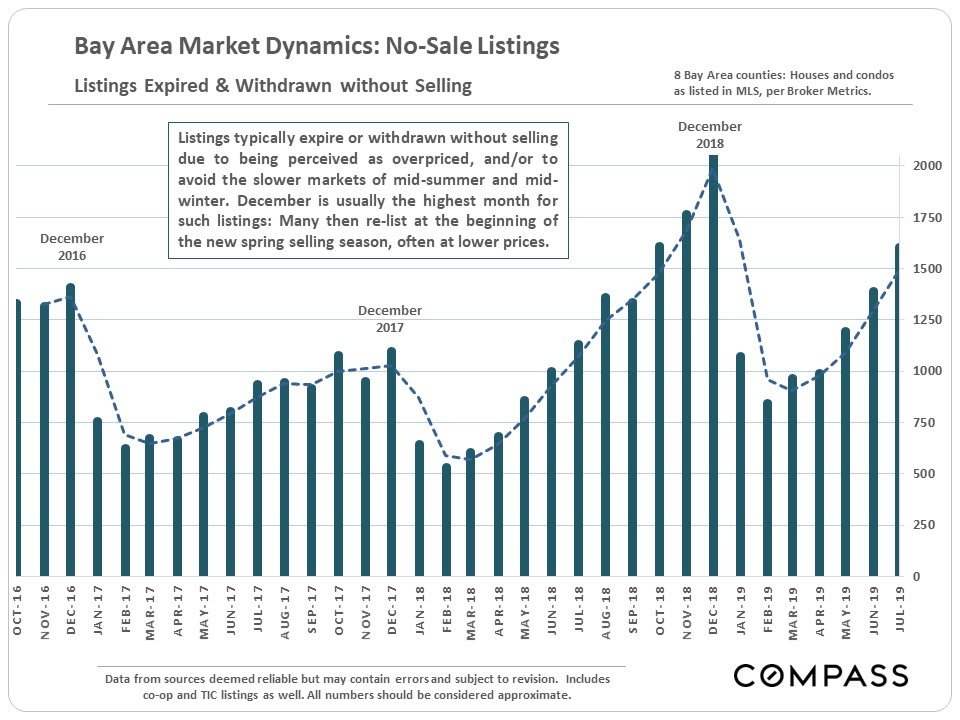
Price Reductions & Listings Expiring without Selling
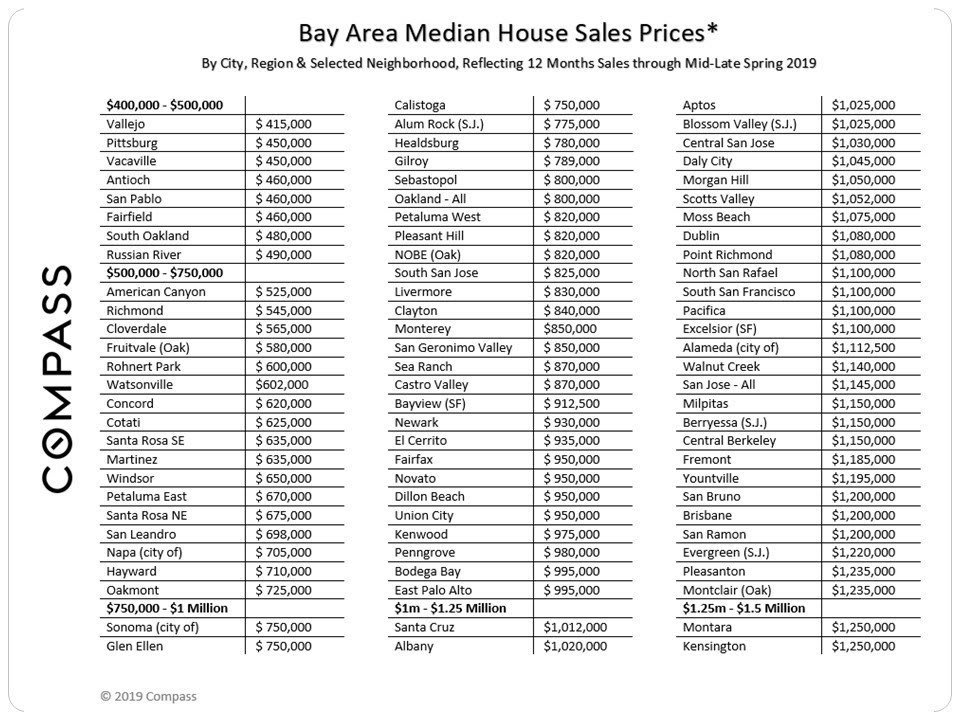
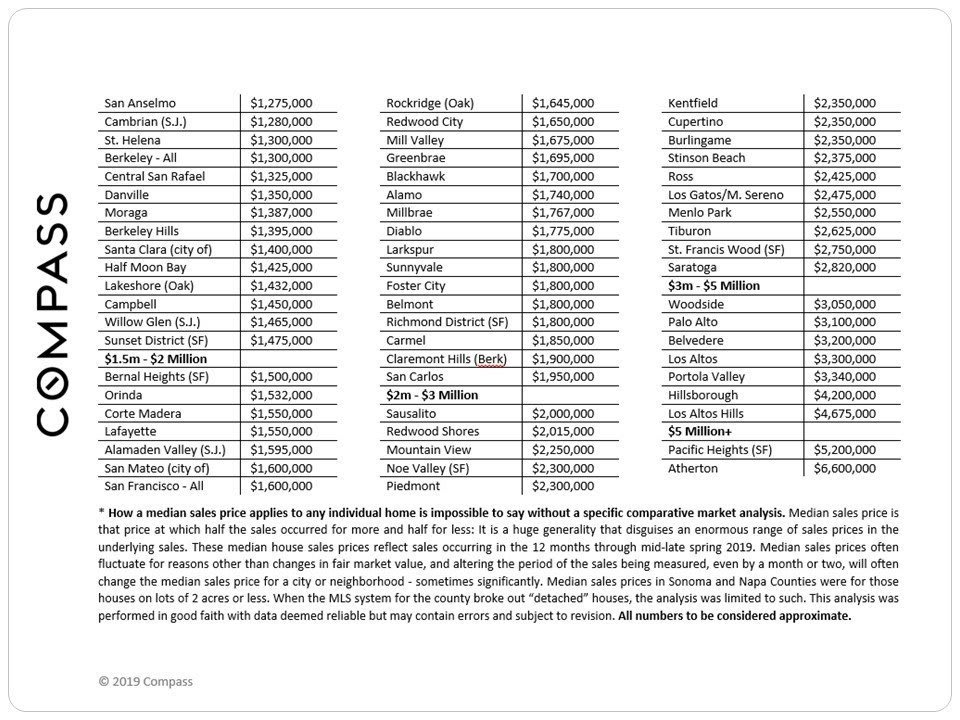
San Francisco Bay Area Median House Sales Prices by City
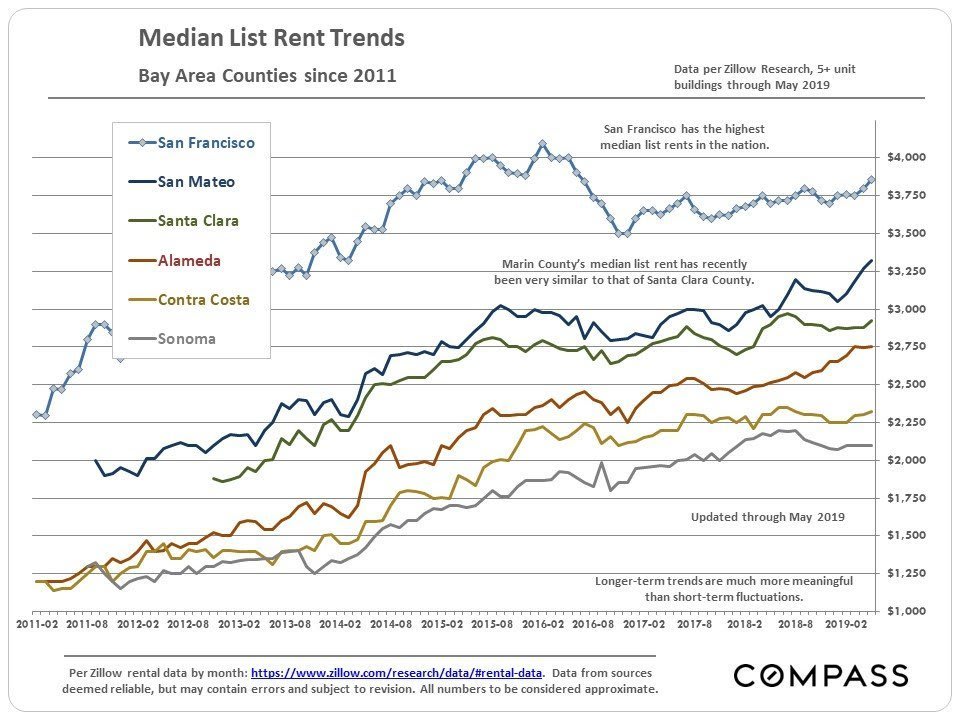
Bay Area Median List Rents

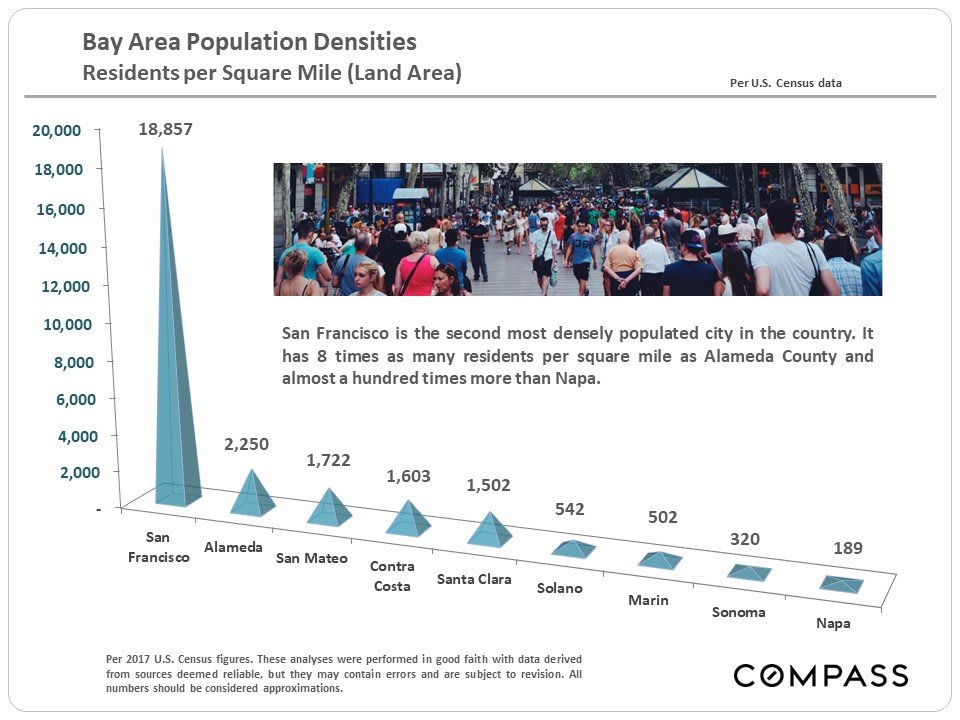
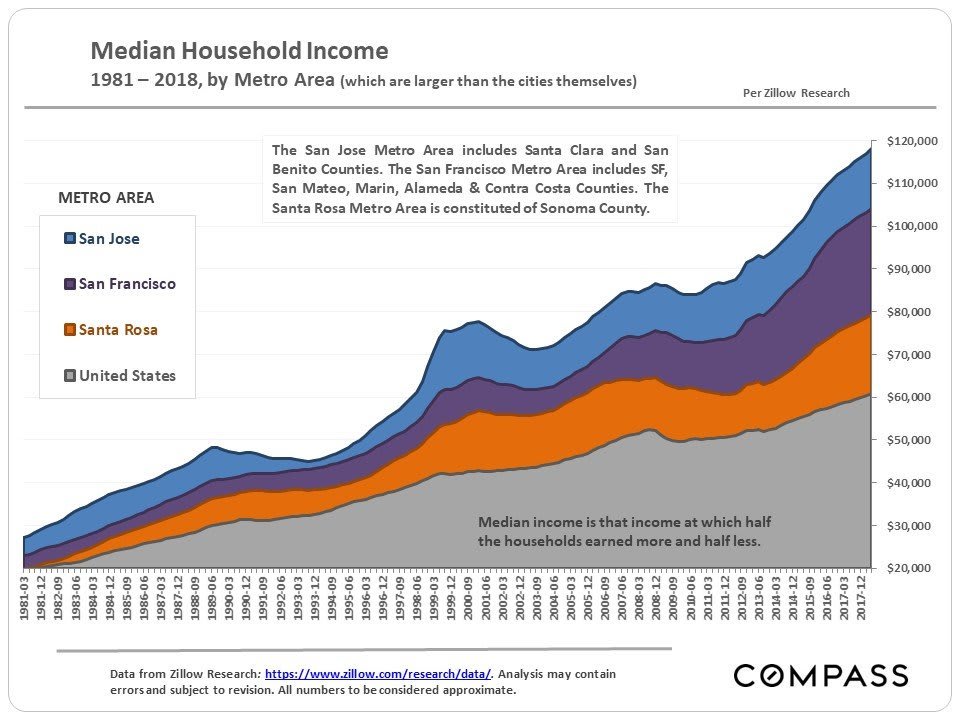
Selected Economic & Demographic Factors
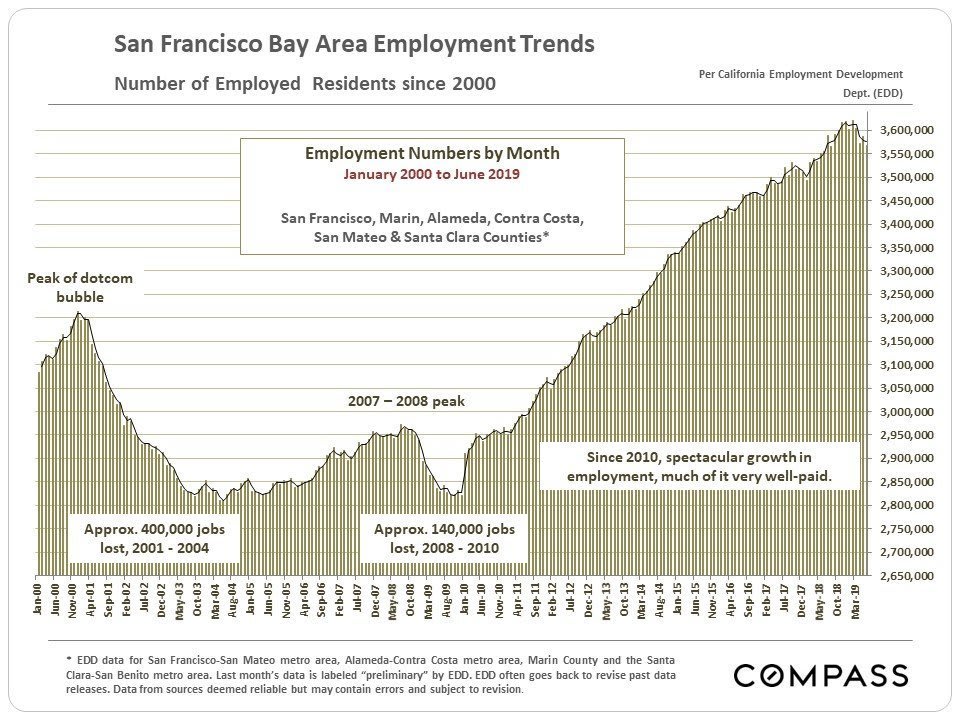
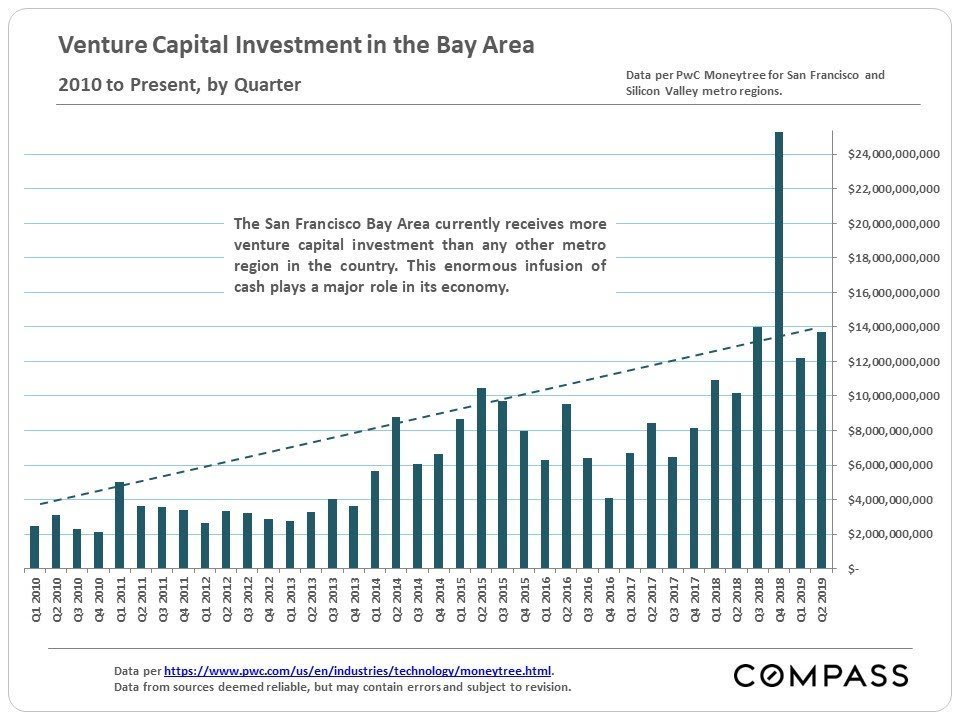
Behind the real estate boom is the stupendous boom in hiring, specifically in the high-tech fields.
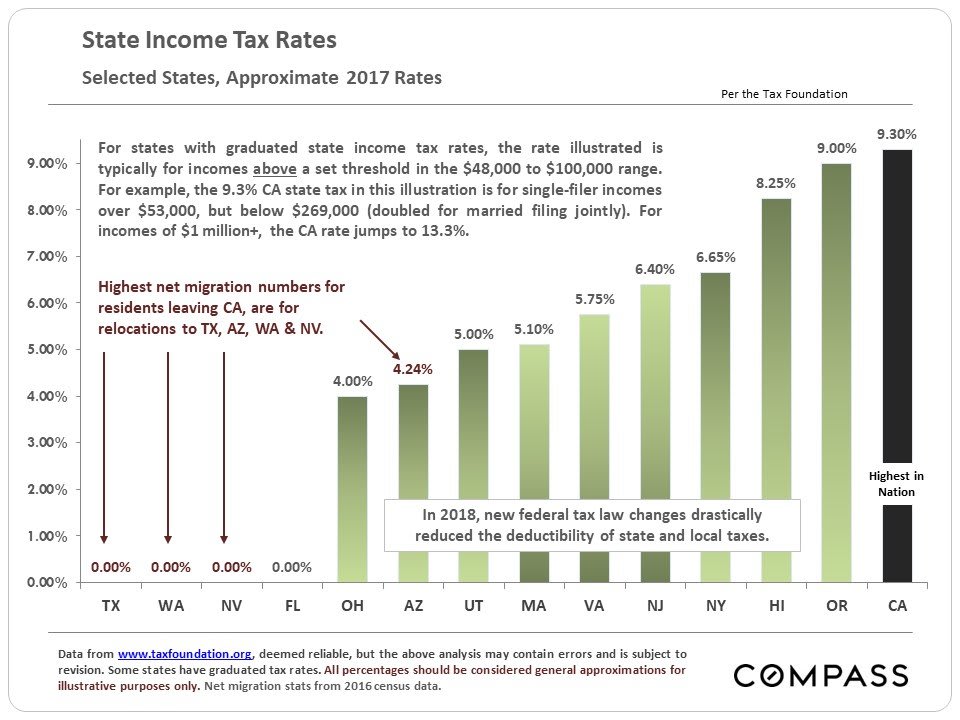
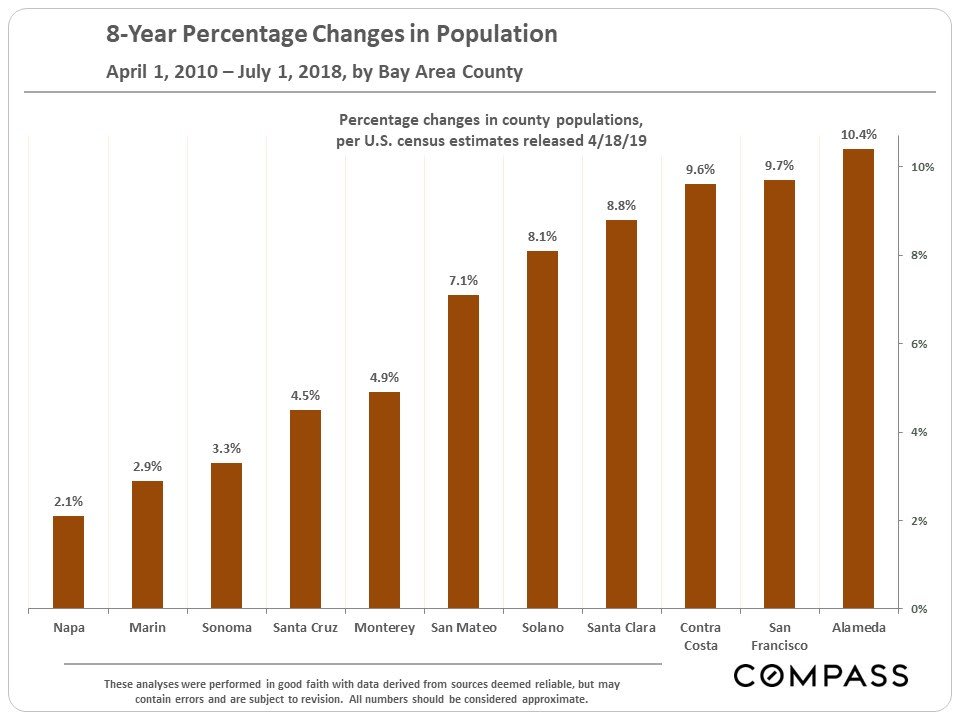
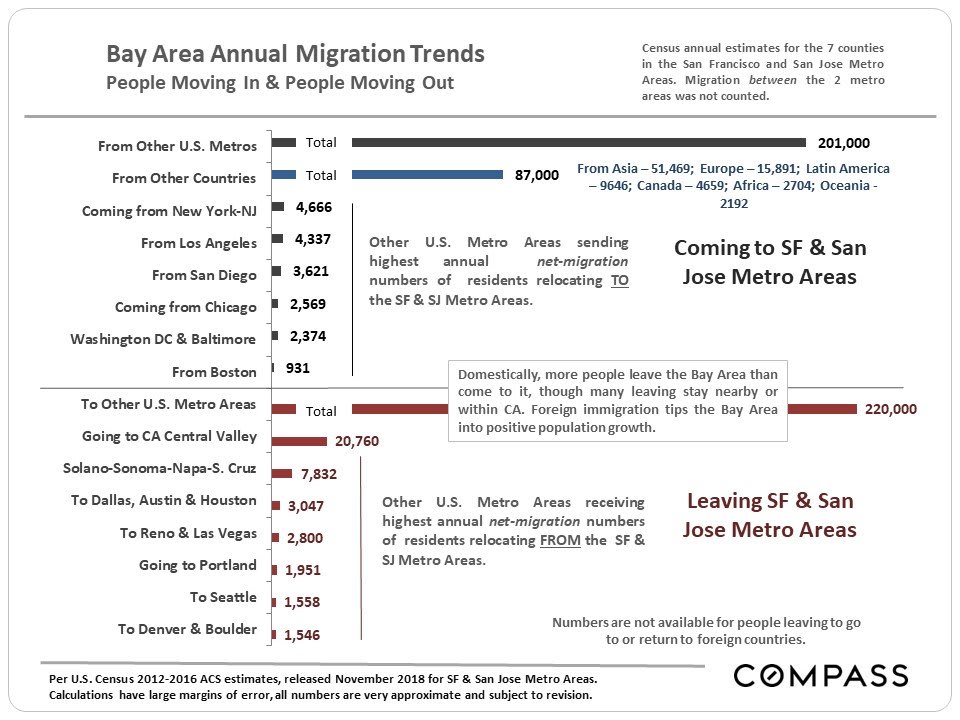
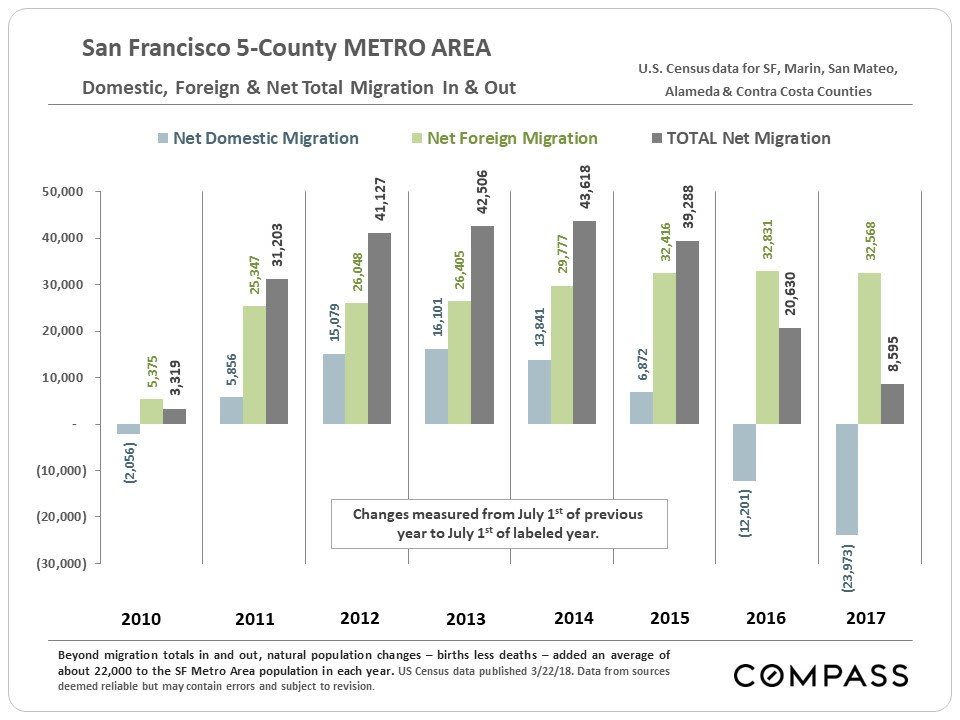
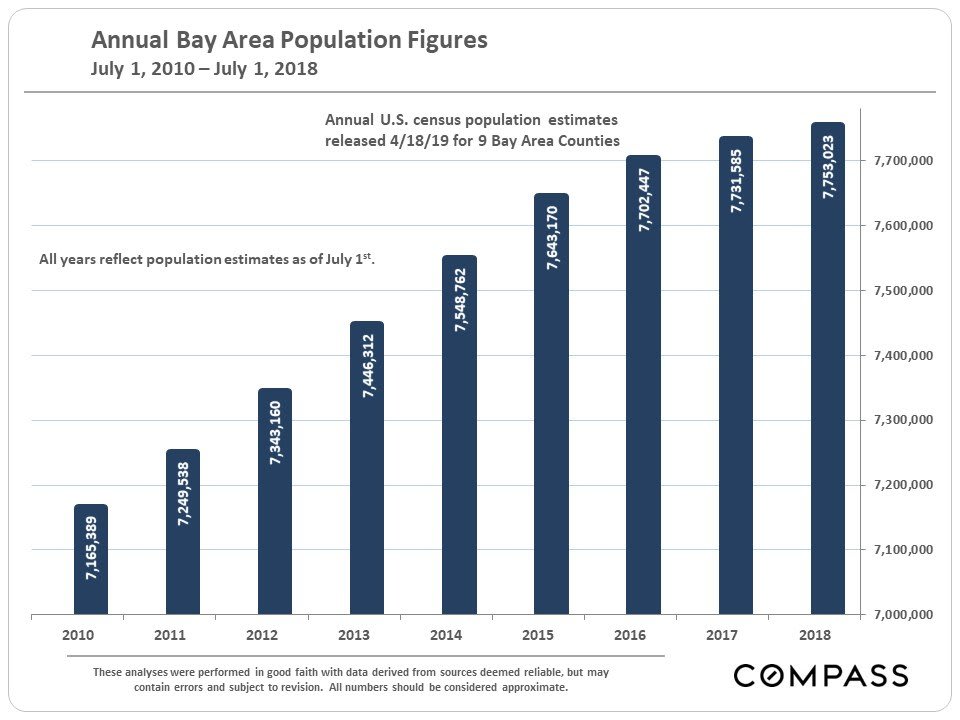
Migration & Population Trends