High-demand/low-inventory spring market brings median home sales prices bouncing back to 2018 peaks. San Francisco luxury home sales hit new monthly high.
Median Home Sales Prices
We consider 3-month rolling median sales prices to be more reliable than single month figures, which are much more prone to less meaningful fluctuations. Both houses and condos are basically back up to the peak prices they hit last year at this time. June sales will mostly reflect accepted-offer activity in May, so it will be interesting to see that final bit of spring data. Market activity typically begins to significantly slow for the summer, hitting its mid-year low in August.

Median House Sales Prices since 1990 – The Long-Term Perspective

Luxury Home Sales Hit New Monthly High
For the purposes of this chart, we looked at all home sales of $2,500,000 and above: May 2019 sales were approximately 13% higher than the previous peak in May 2018. More data on the spring luxury home market can be found in the table further down in this report: High-price house sales saw the big jump this spring.

Comparing Year-over-Year Spring Markets
Last year’s spring 2018 was a very, very hot market – around the Bay Area – which created a large burst in home-price appreciation. Spring 2019 in SF has also been very strong, with many of the supply and demand statistics only slightly cooler – a few more days on market, a bit less overbidding, etc. – plus an increase in high-end home sales. Median home sales prices are much the same as last year, re-attaining, but so far, not exceeding previous peaks to any significant degree.

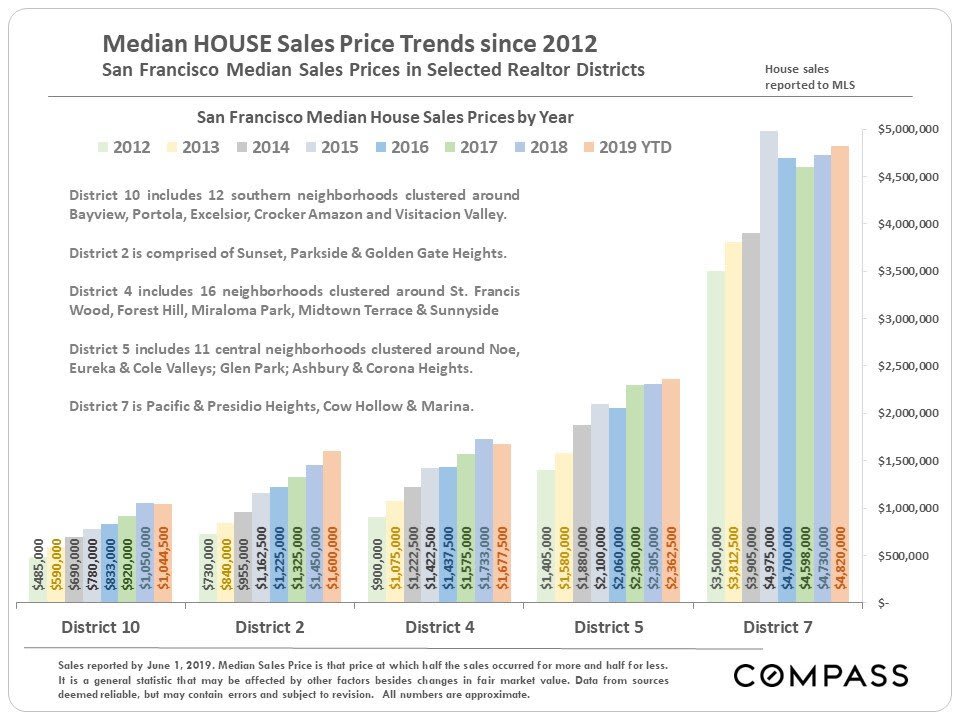
Median Price Changes in Selected Districts
Comparing annual median home prices to partial year prices is not really an apples-to-apples comparison because of the effect of market seasonality on sales prices, but the below analysis is still an interesting look at home-price trends.
We chose these districts to illustrate a range of price points in areas with a good number of sales. Some are up, some are down, some have relatively unchanged median sales prices: It fits in with the overall, city price stability mentioned earlier. Full-year 2019 median home prices may be significantly different than the year-to-date figures.
Further down is a link to an updated San Francisco home price map, featuring the last 12 months of sales.

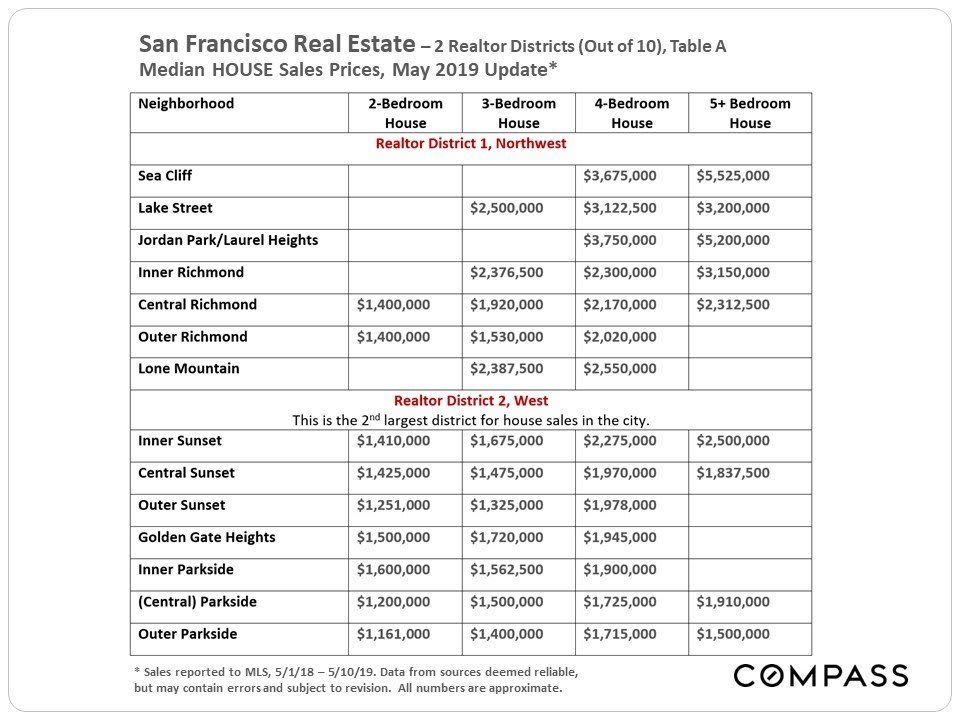
Neighborhood Home Prices – by Bedroom Count
Following are 2 sample tables breaking out median house and condo sales prices over the past year in 3 city districts by bedroom count. Some neighborhoods had relatively few sales of a particular home size.
Below the tables are links to our complete analyses for all 10 Realtor districts with their 70-odd neighborhoods.

Click on the links below for our complete review of San Francisco neighborhood home prices.
SF Neighborhood HOUSE Prices
SF Neighborhood CONDO Prices
SF Neighborhood Home Price Map
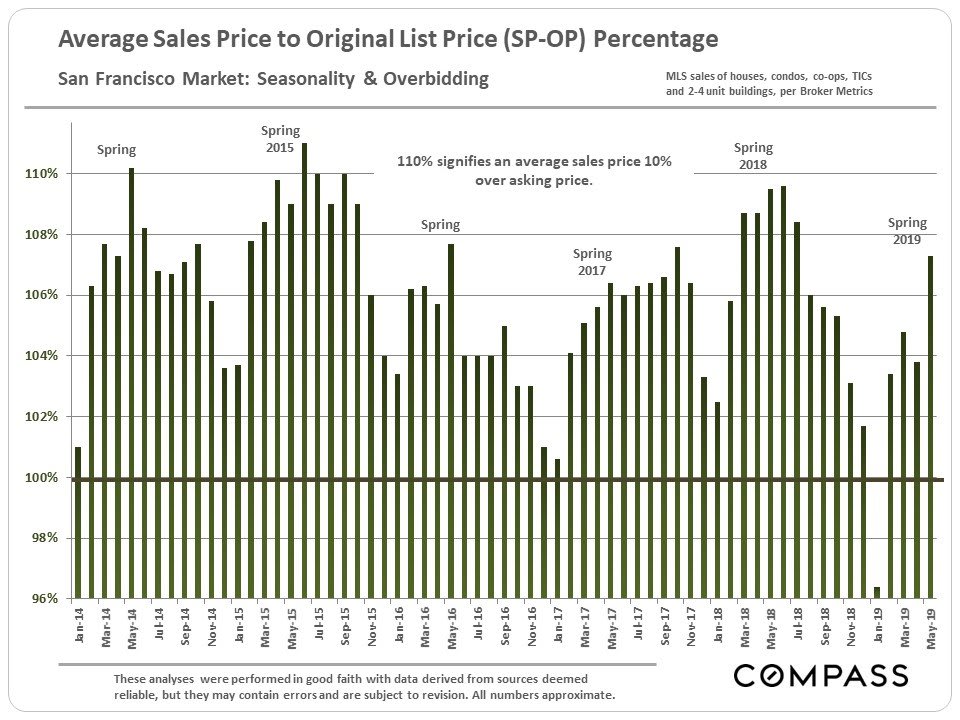
Selected Market Indicators
Besides giving more perspective to longer-term trends, these two charts are also excellent illustrations of how seasonality affects supply and demand statistics.

Selected Demographic & Economic Snapshots
Within the Bay Area, SF has by far the highest percentage of residents aged 25 to 34, and by far the highest percentage of single-person households. It also has the lowest percentage of residents under 5 years of age of any major metro area in the country. So, not too many children, but a big population bulge of millennials.

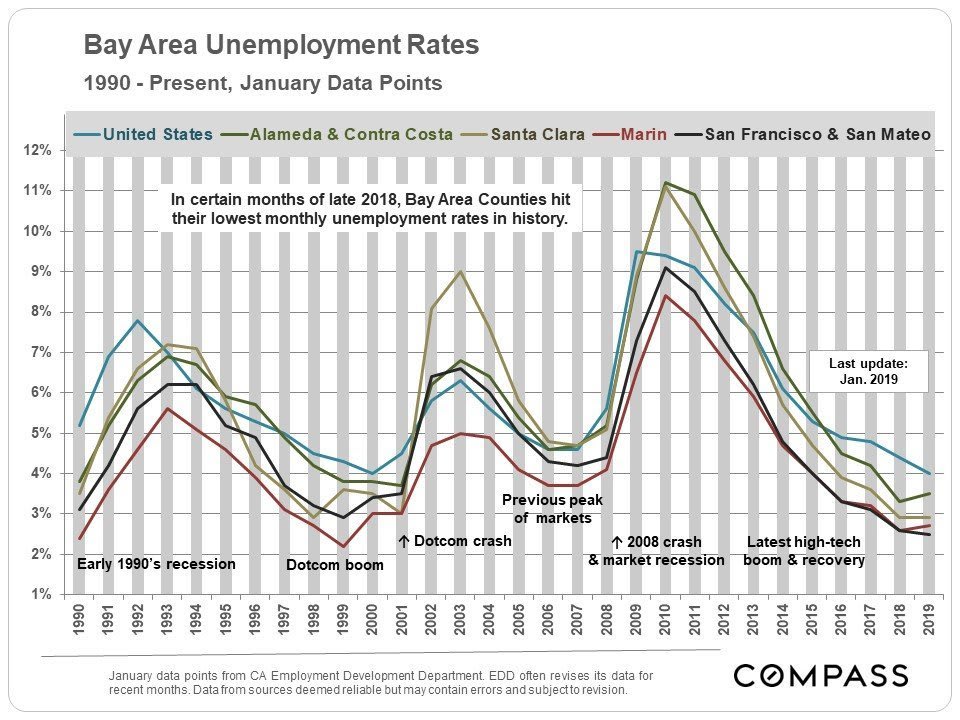
This next chart graphs Bay Area unemployment rates from 1990 through January 2019. By April 2019, they had typically fallen another half percentage point.