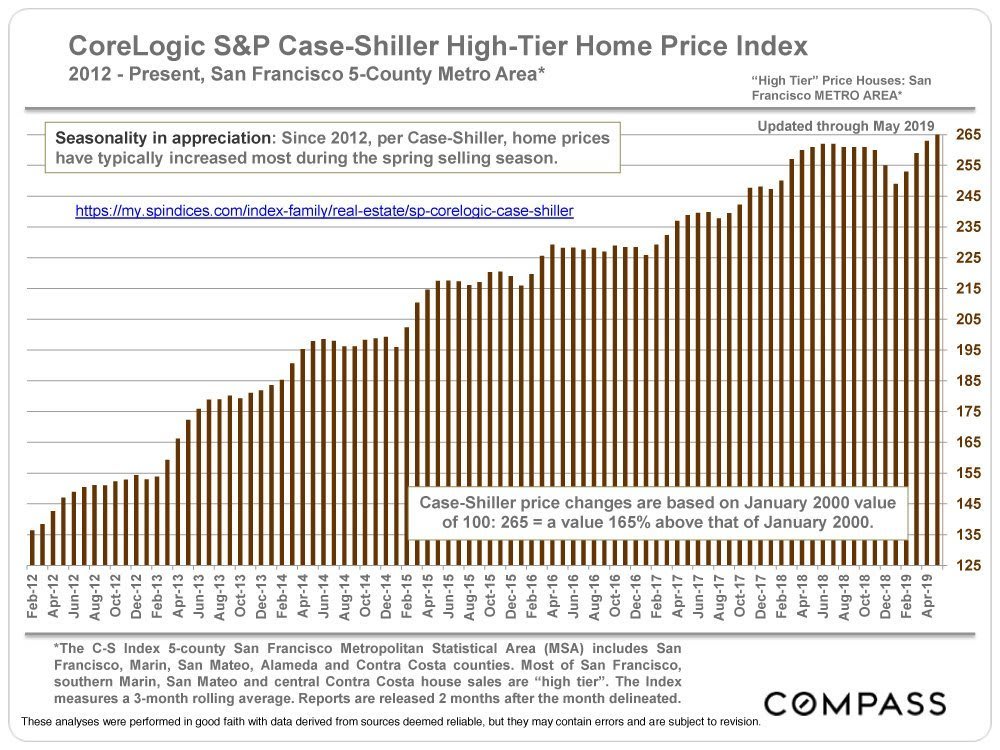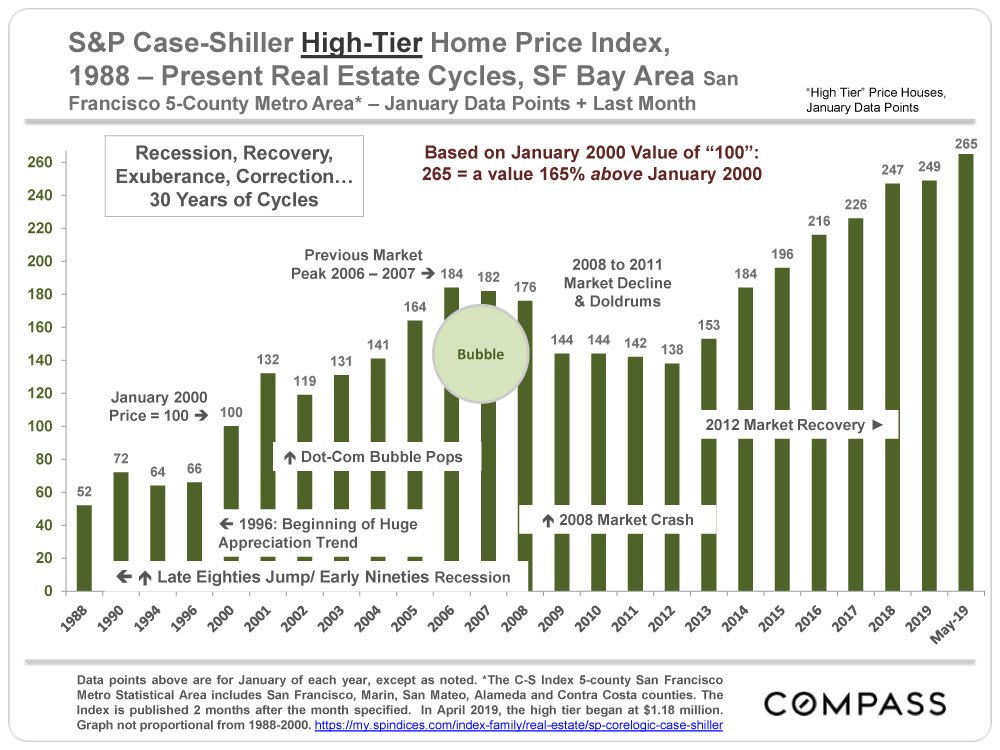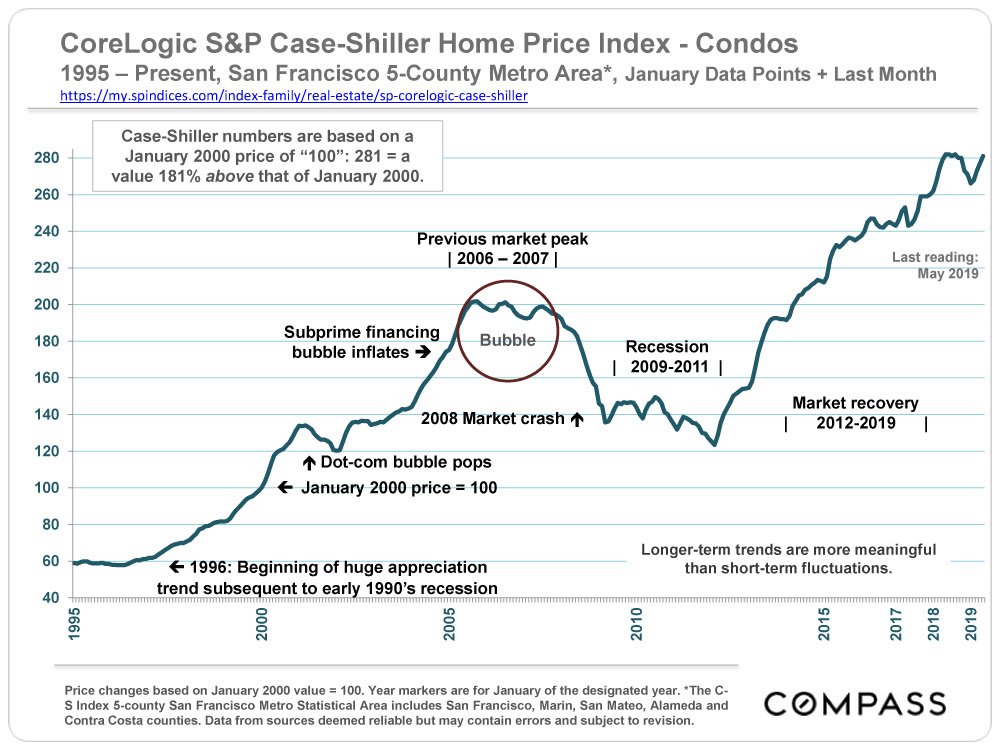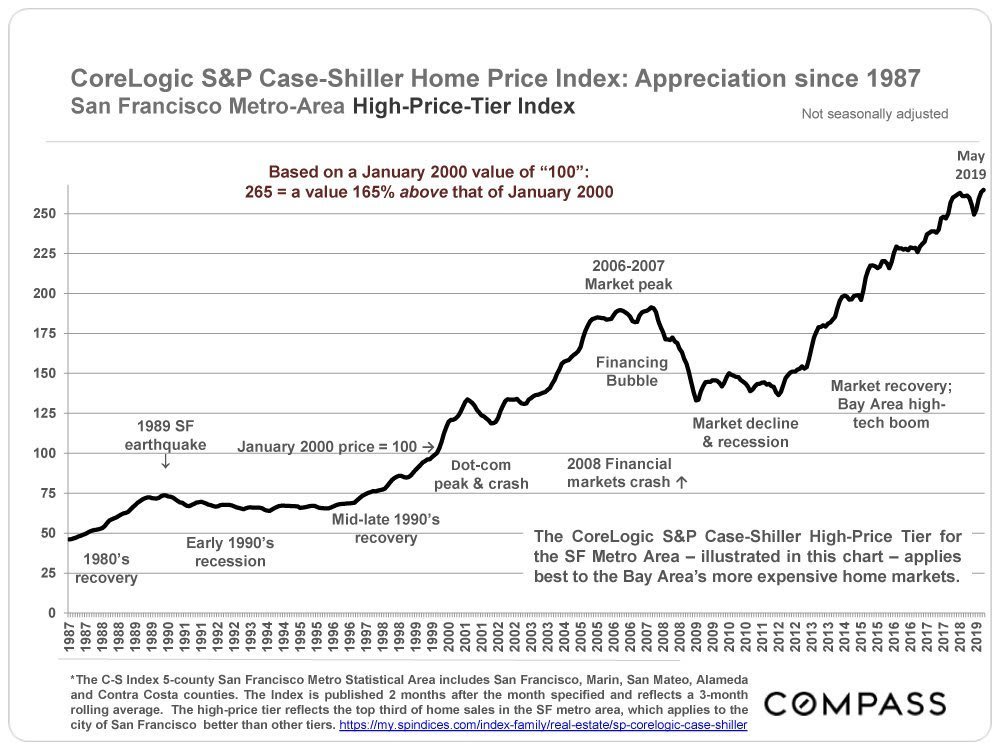
The CoreLogic S&P Case-Shiller Home Price Index does not evaluate median sales price changes, but employs its own proprietary algorithm to measure home price appreciation over time. Since its indices cover large areas – for example, the San Francisco Metro Area is comprised of 5 counties – which themselves contain communities of widely varying home values, the C-S chart numbers do not refer to specific prices, but instead reflect prices as compared to those prevailing in January 2000, which are all designated as having a consistent value of 100. A reading of 250 signifies that home prices have appreciated 150% above the price prevailing in January 2000.
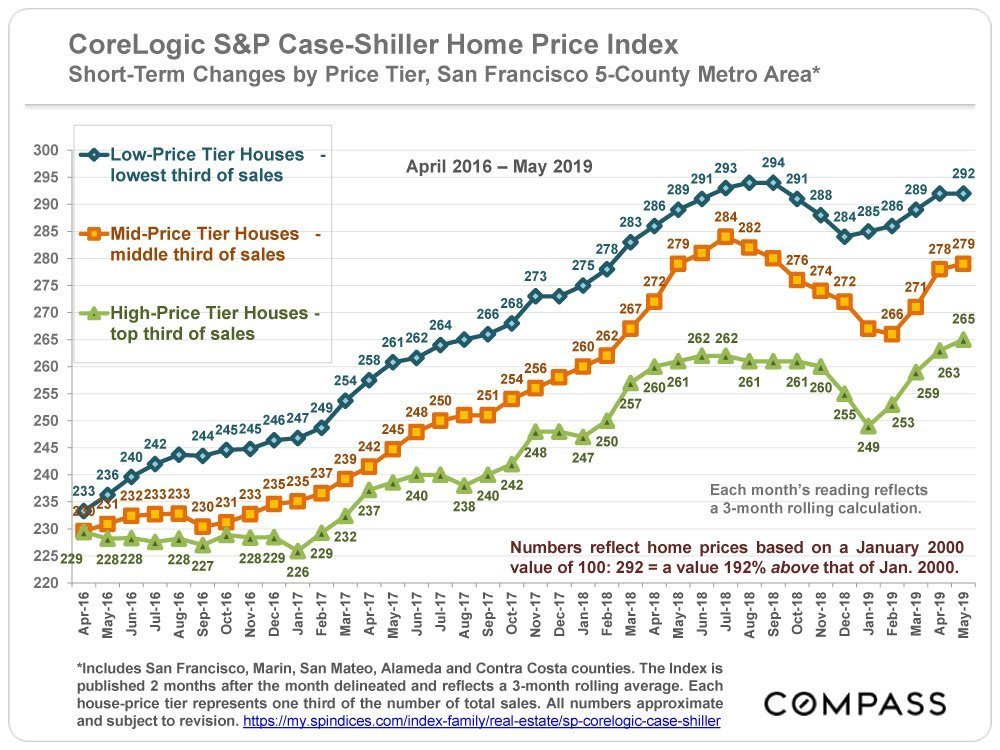
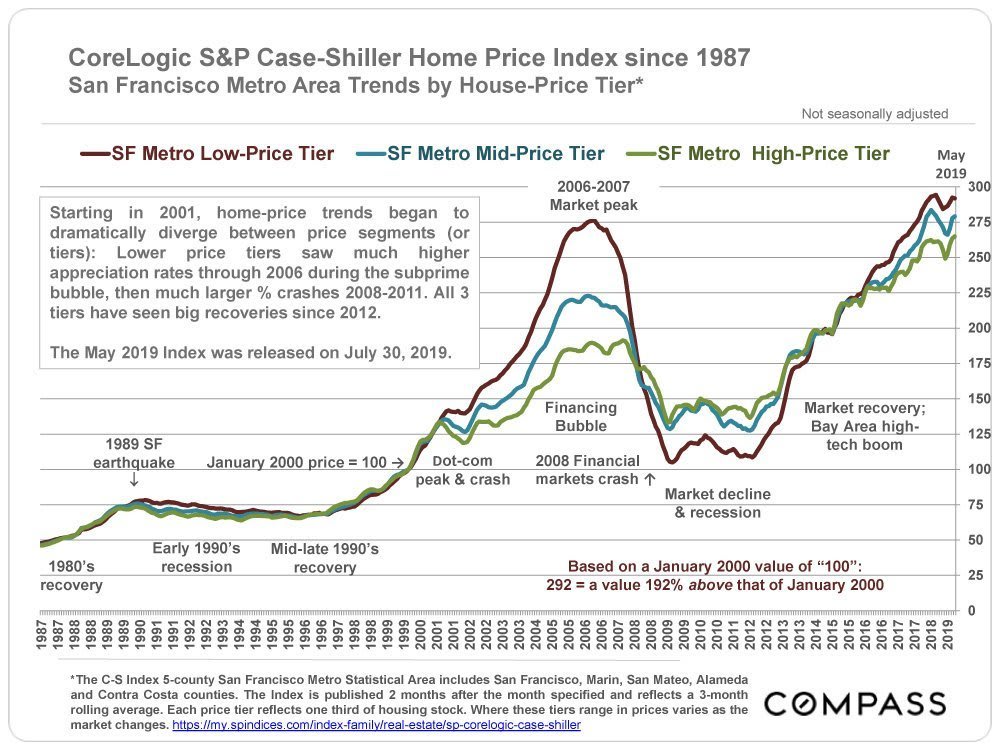
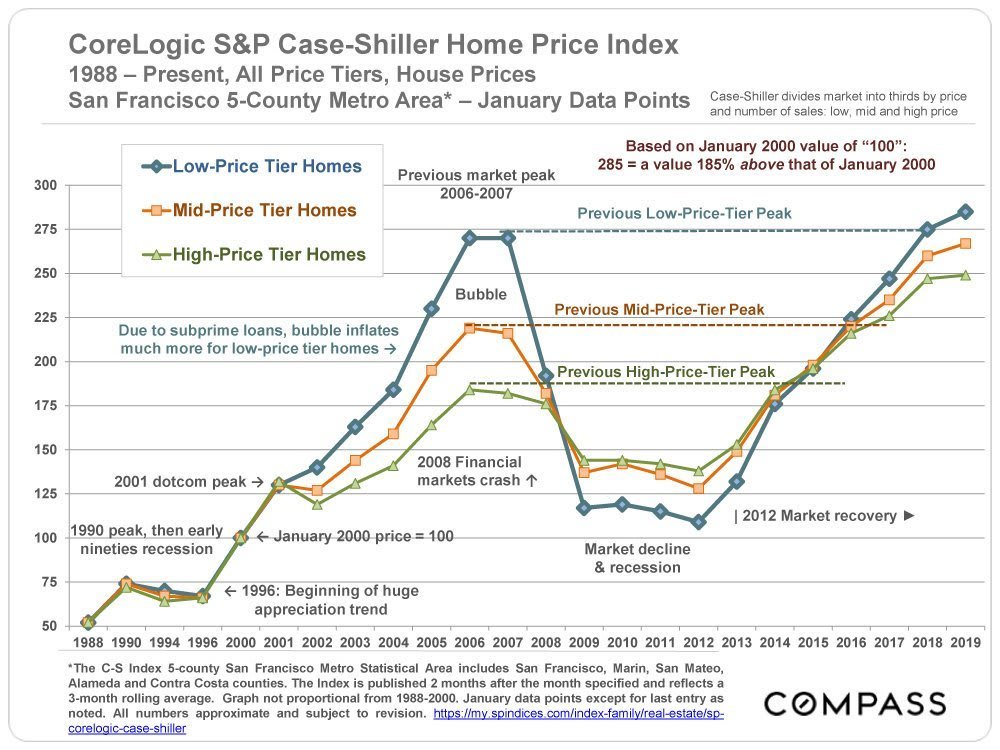
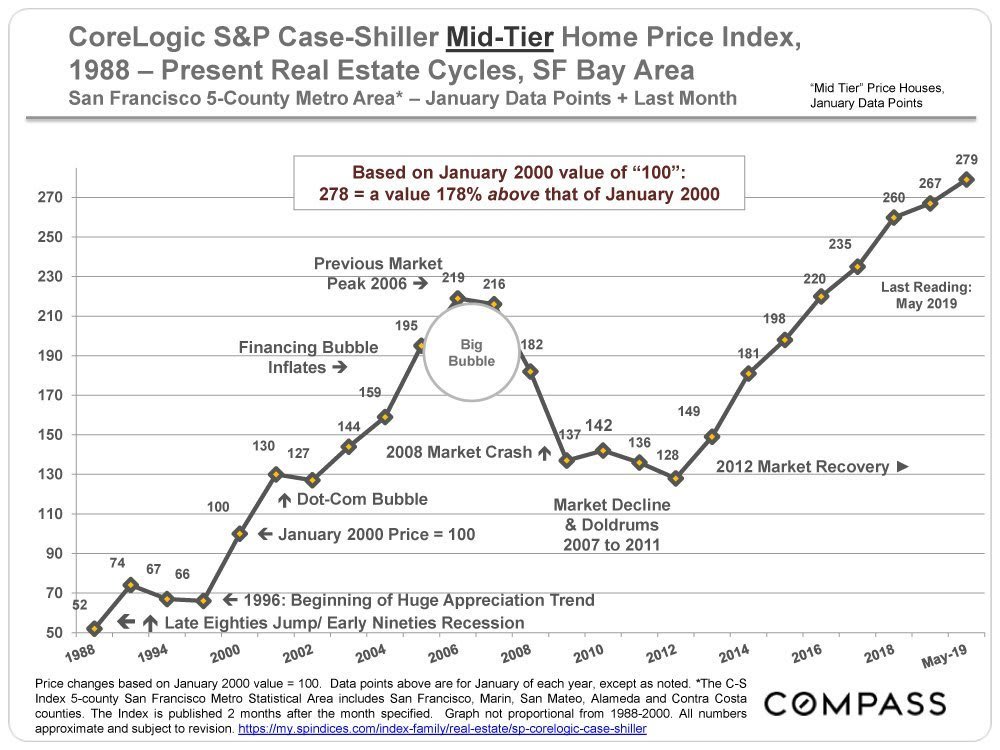
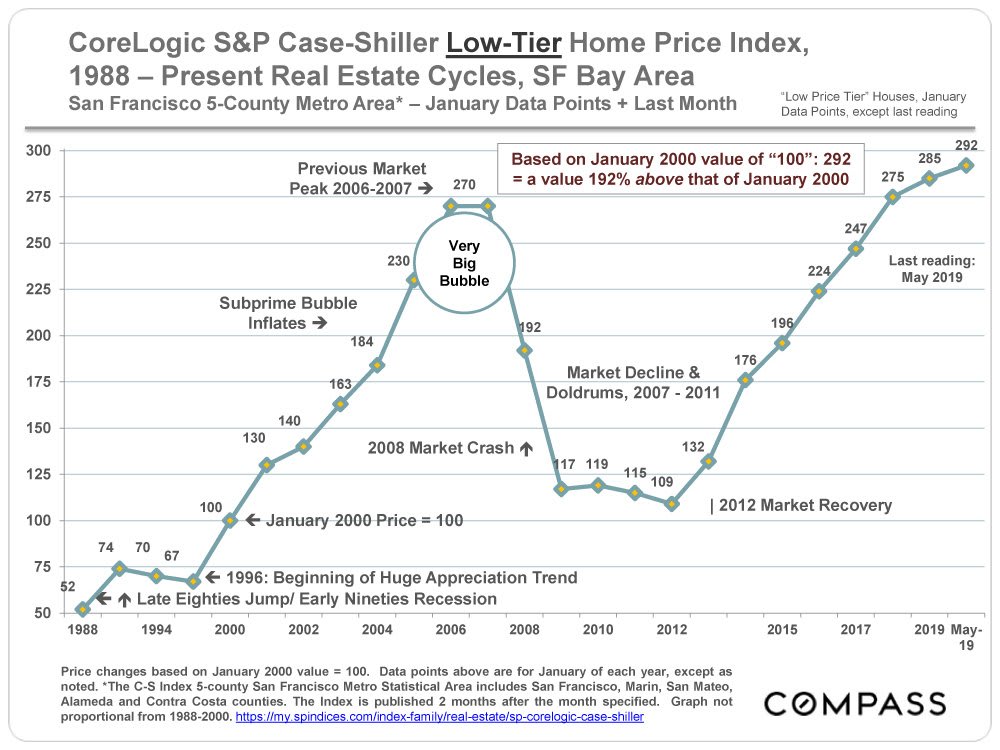
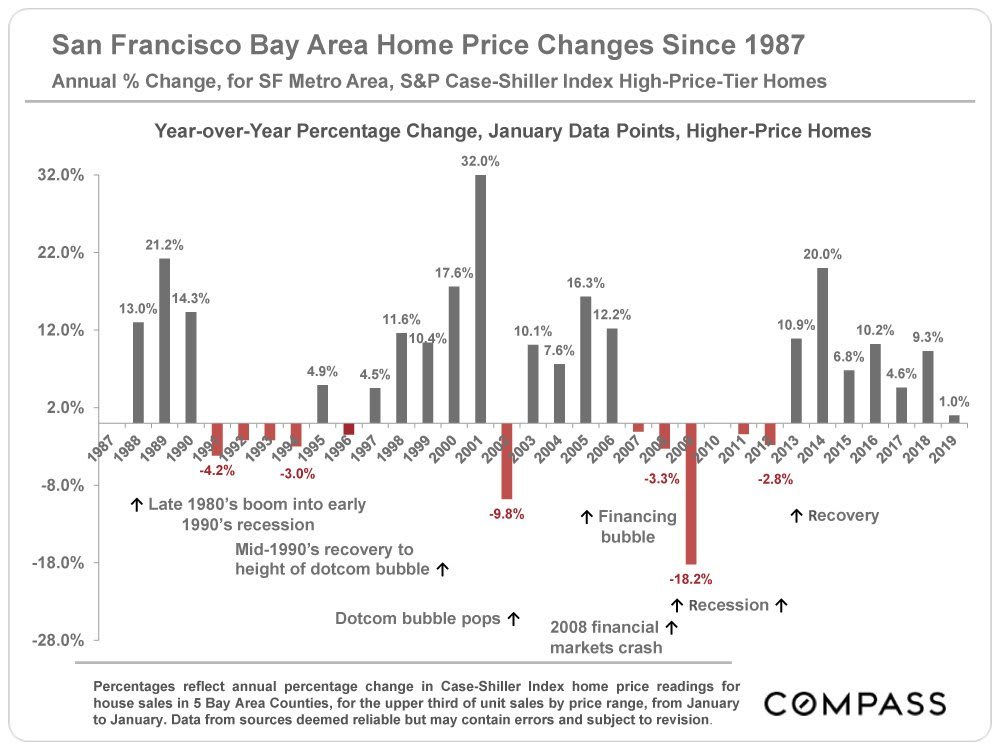
Case-Shiller divides all the house sales into thirds, or tiers: The third of sales with the lowest prices is the low-price tier; the third of sales with the highest sales prices is the high-price tier; and the third in between is the mid-price. The price ranges of these tiers change as the market changes. The 3 price tiers experienced dramatically different bubbles, crashes and recoveries over the past 18+ years, to a large degree determined by how badly the tier was affected by the subprime financing crisis. The low price tier was worst affected – huge bubble, huge crash, most dramatic recovery – and the high price least affected (but still significantly affected).
Most house sales in expensive counties such as San Francisco, Marin and San Mateo, as well as affluent communities in other Bay Area counties are in the “high price tier”, and many would qualify for an “ultra-high-price tier,” if such existed. All counties, to varying degrees, have sales in all 3 price tiers.
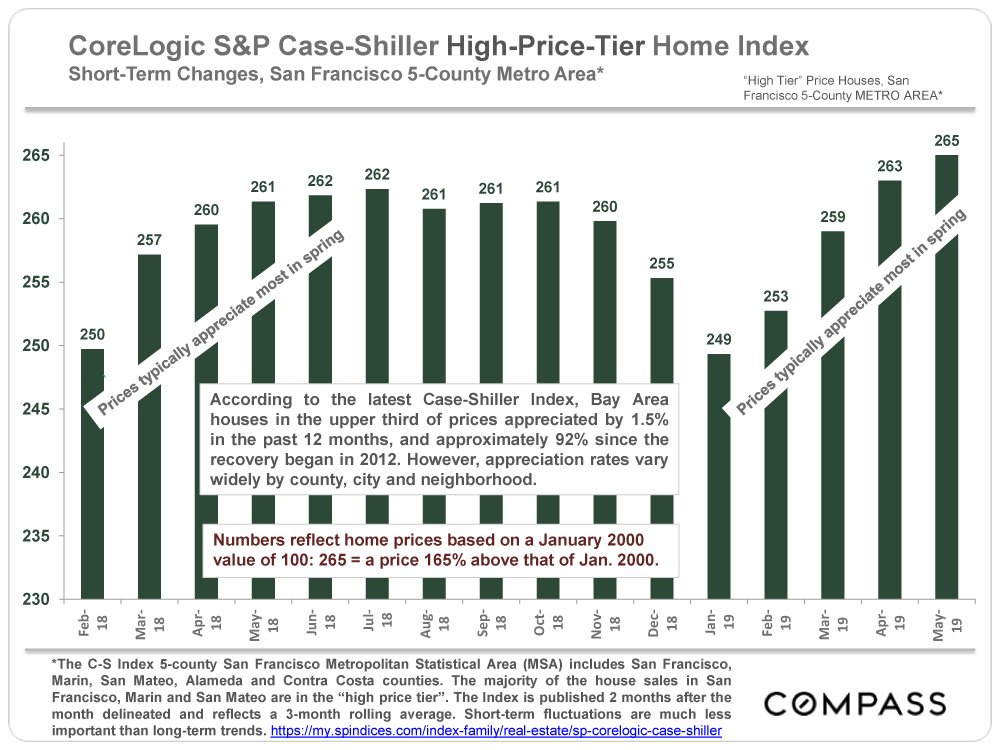
The Index is published 2 months after the month delineated – the May 2019 index was released 7/30/19 – reflects a 3- month rolling calculation, and one month’s sales generally reflect accepted-offer activity in the previous month. The Index is looking into a rear-view mirror at the market 3 to 5 months ago: The May 2019 reading, released in late July, mostly reflects market conditions in February – April 2019.
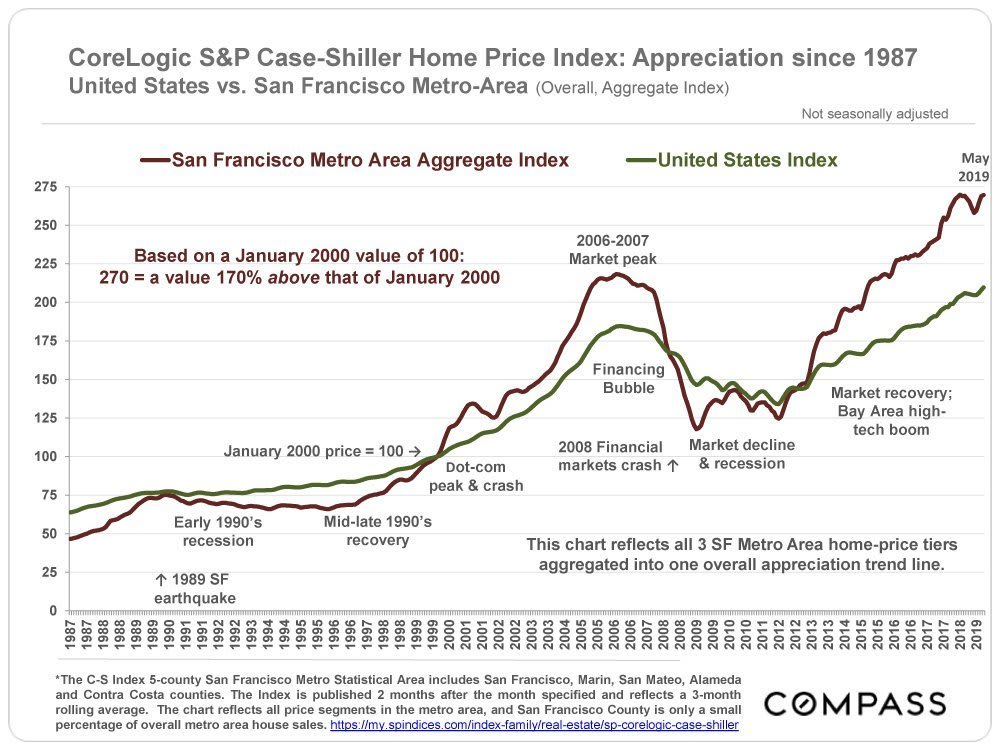
The 5 counties in our Case-Shiller Metro Statistical Area are San Francisco, Marin, San Mateo, Alameda and Contra Costa: Alameda and Contra Costa are by far the largest markets; SF itself comprises only about 7% of house sales in the metro area. We believe the Index generally applies to other Bay Area counties, such as Sonoma and Santa Clara, though those 2 have had somewhat softer markets over the past year. There are hundreds of unique real estate markets in such a broad region, with different dynamics, moving at varying speeds, sometimes in different directions. How the C-S Index applies to any particular property is impossible to know without a specific comparative market analysis.