The SF Team, Eva + James, Compass

It’s important to note that the Bay Area contains many different markets and market segments, sometimes following diverging trends in supply and demand, and home-price appreciation. Most of the materials in this report reflect overall trends for the entire region.

When the data is available we’ve charted longer-term trends since they give much greater context to what the state of the market is today, and where it may be heading.

How these statistics pertain to any particular home is unknown without a specific comparative market analysis.
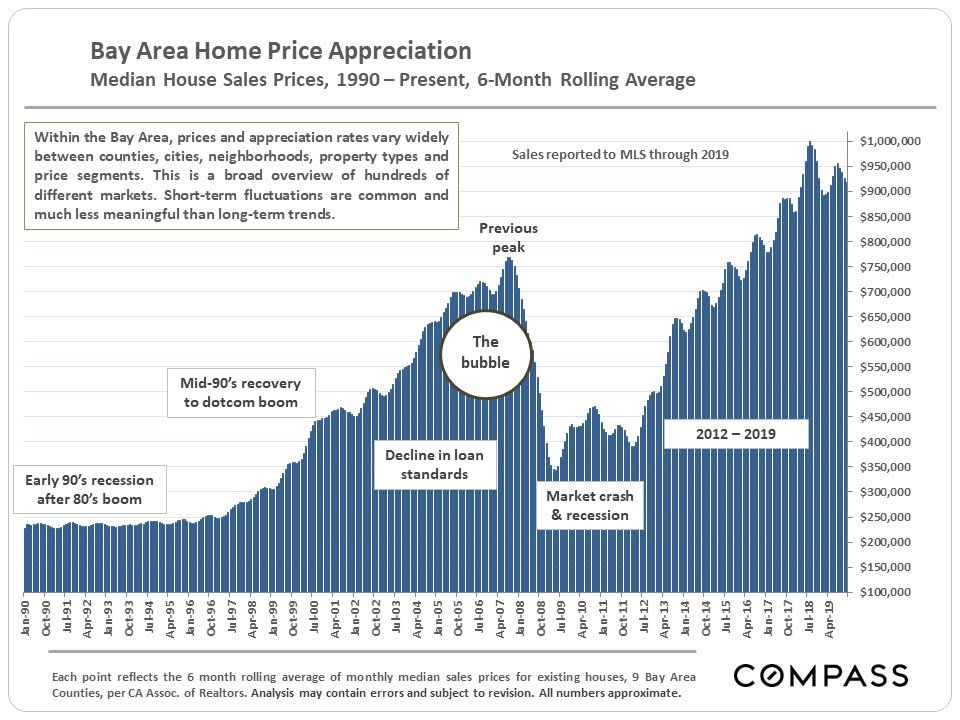
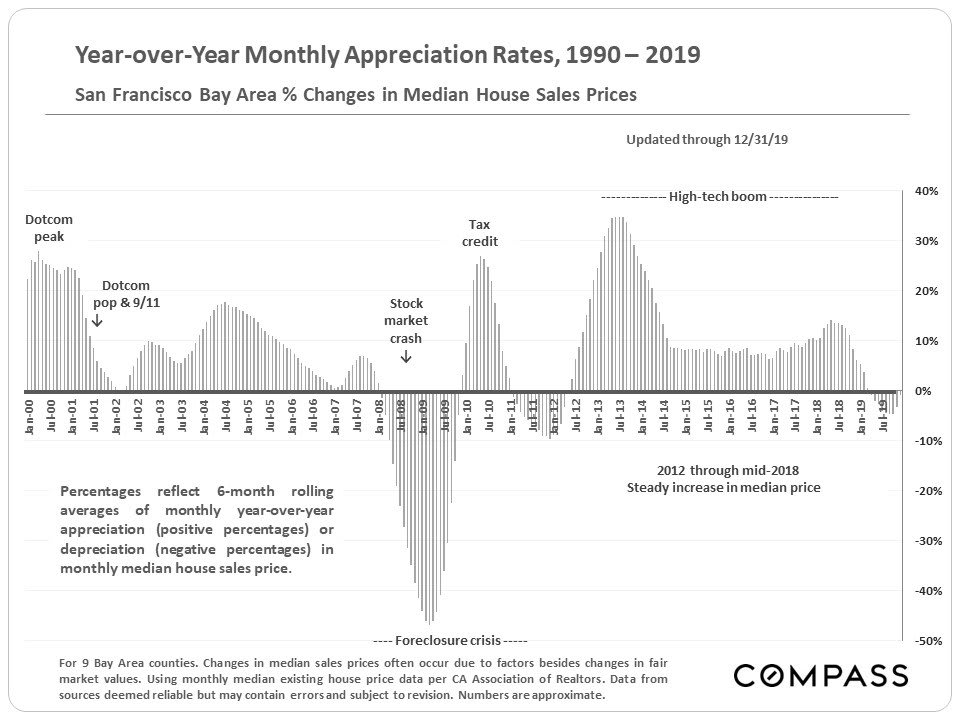
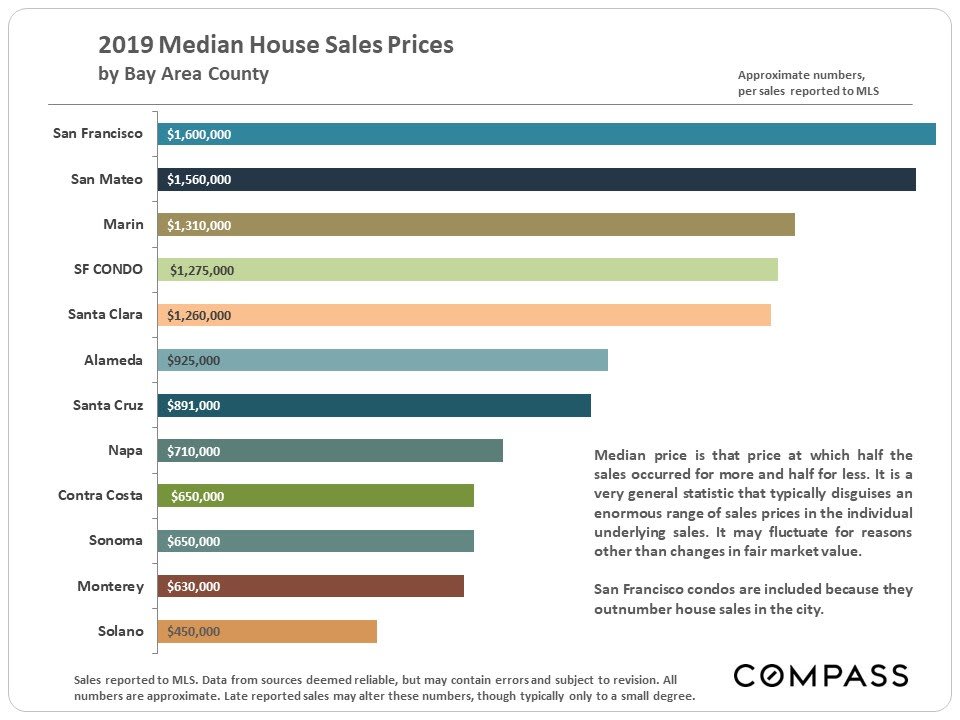
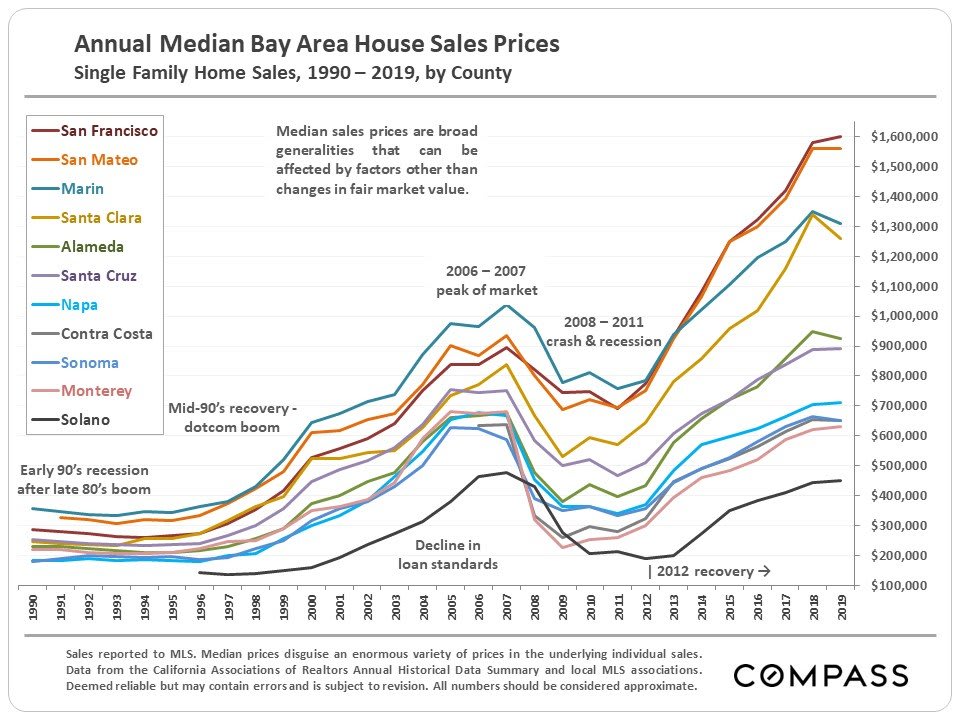
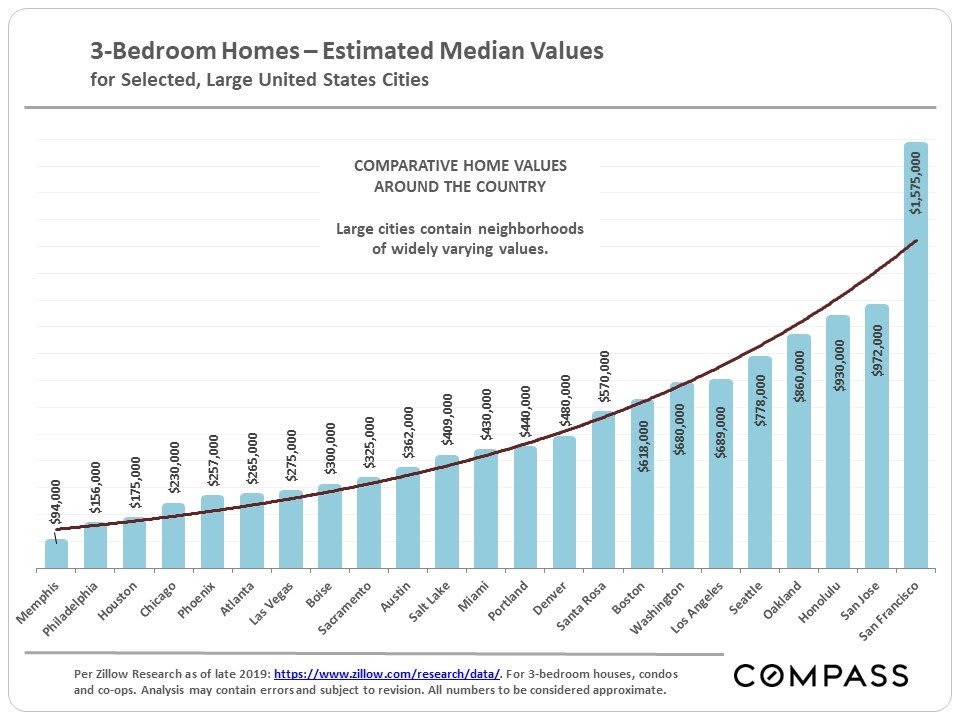
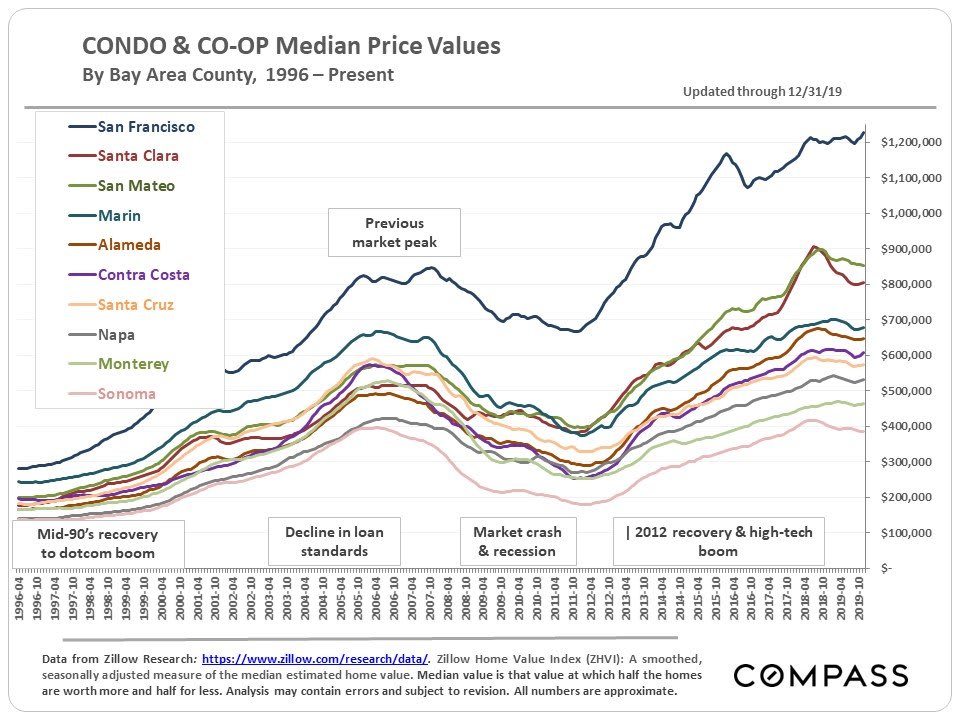
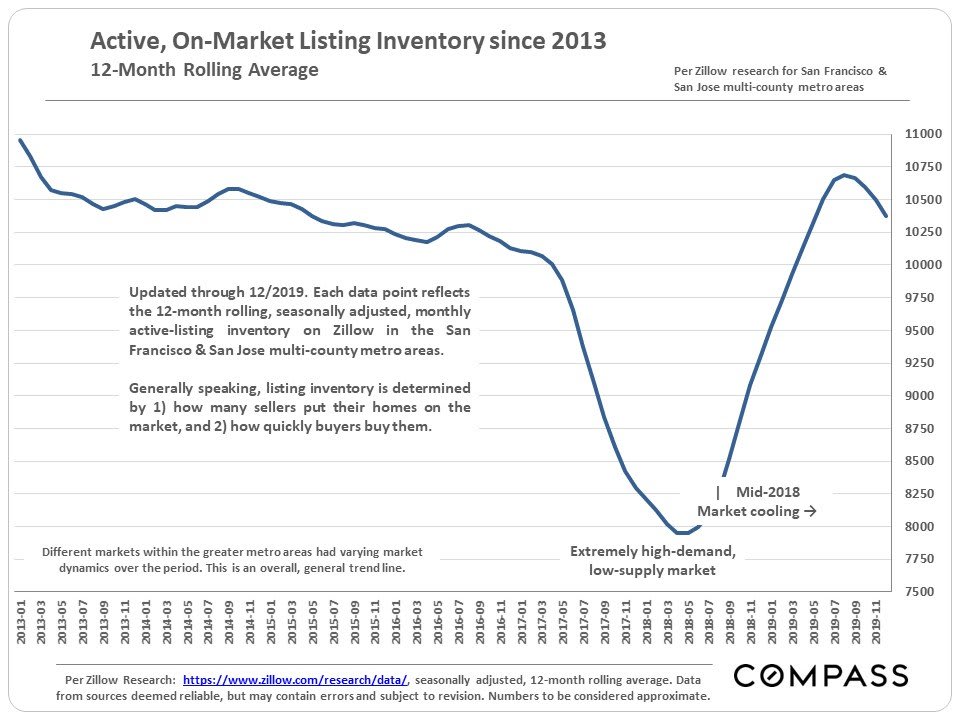
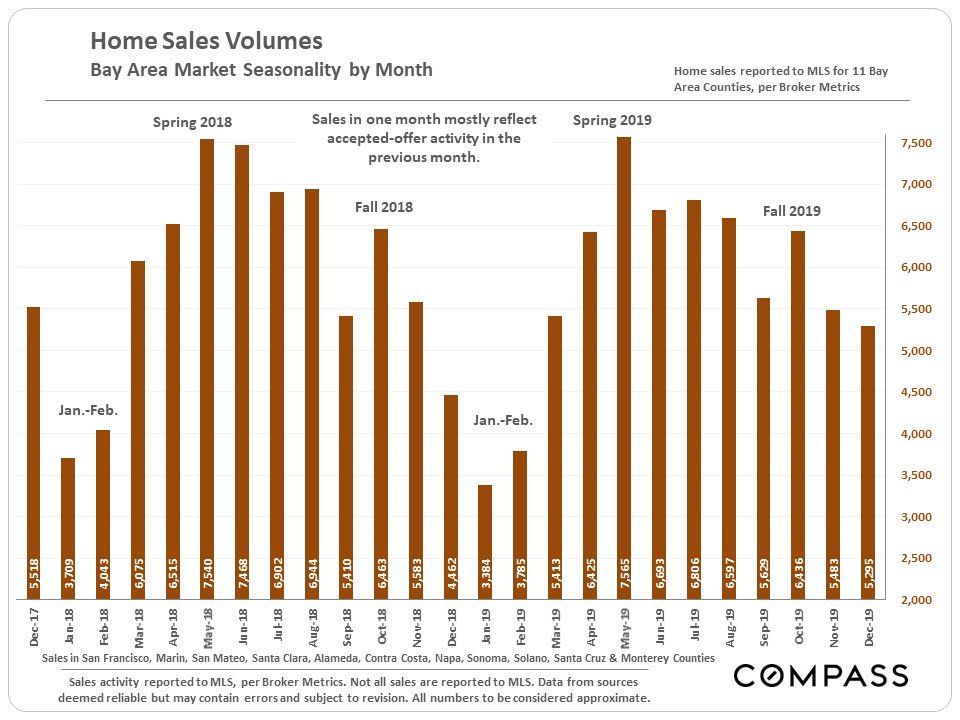
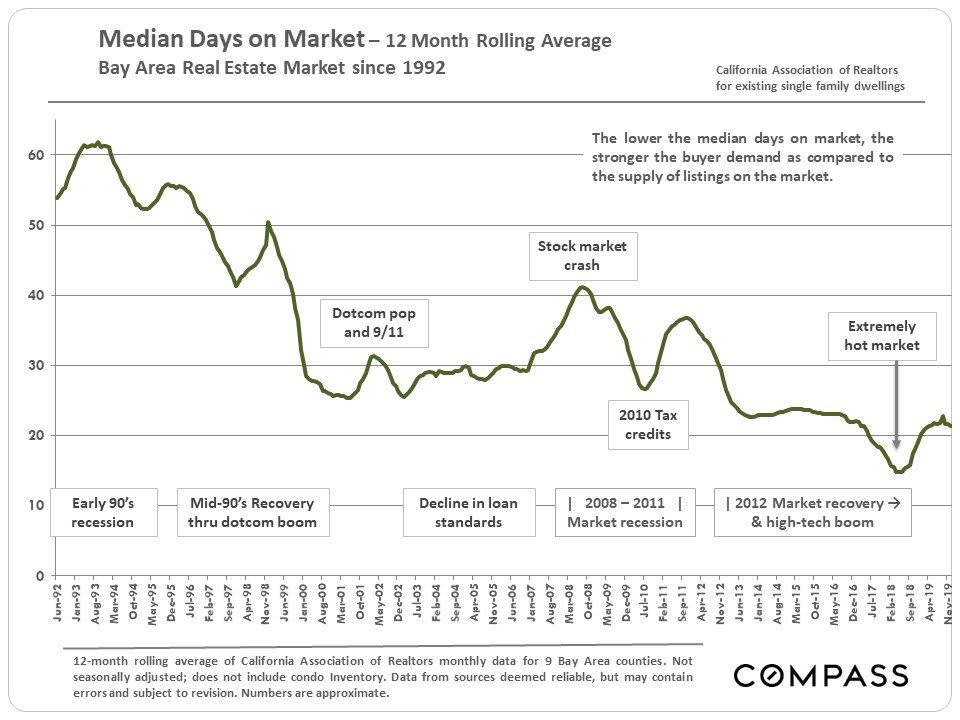
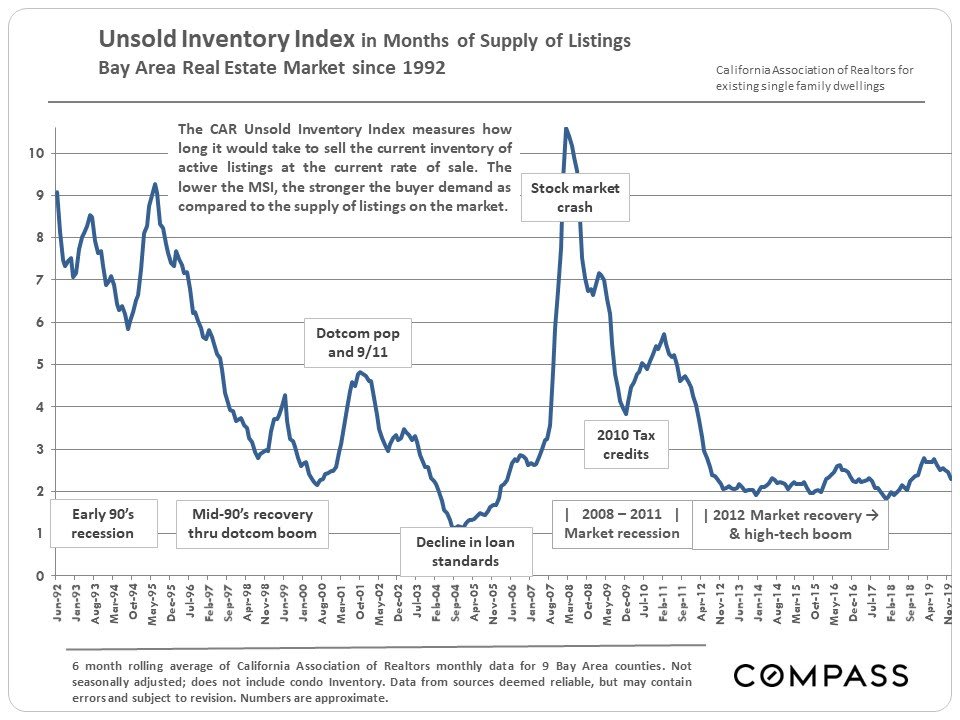
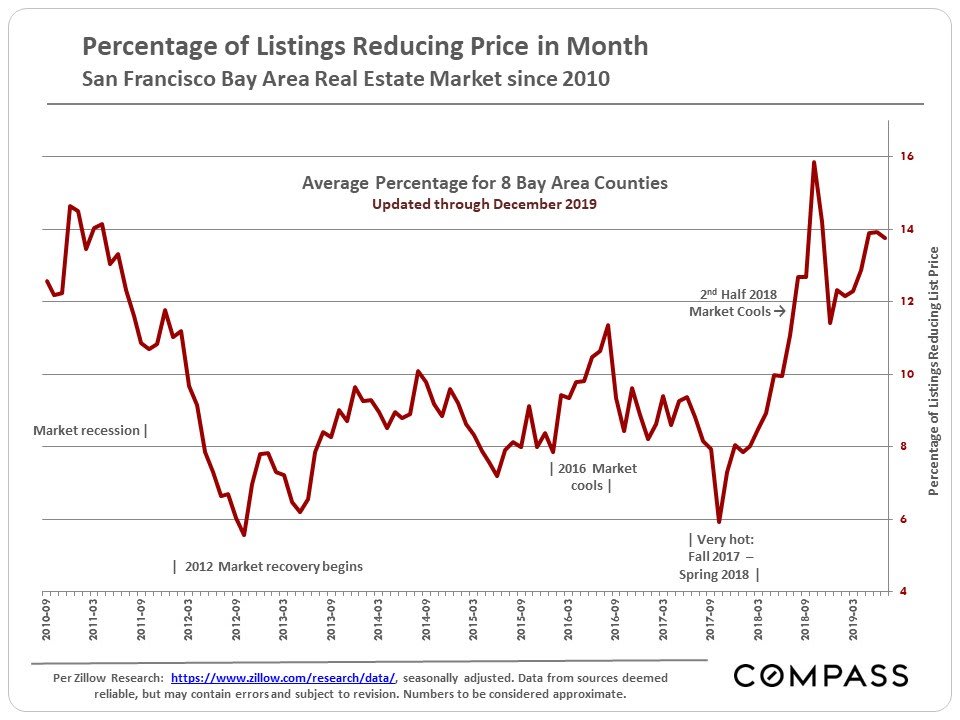
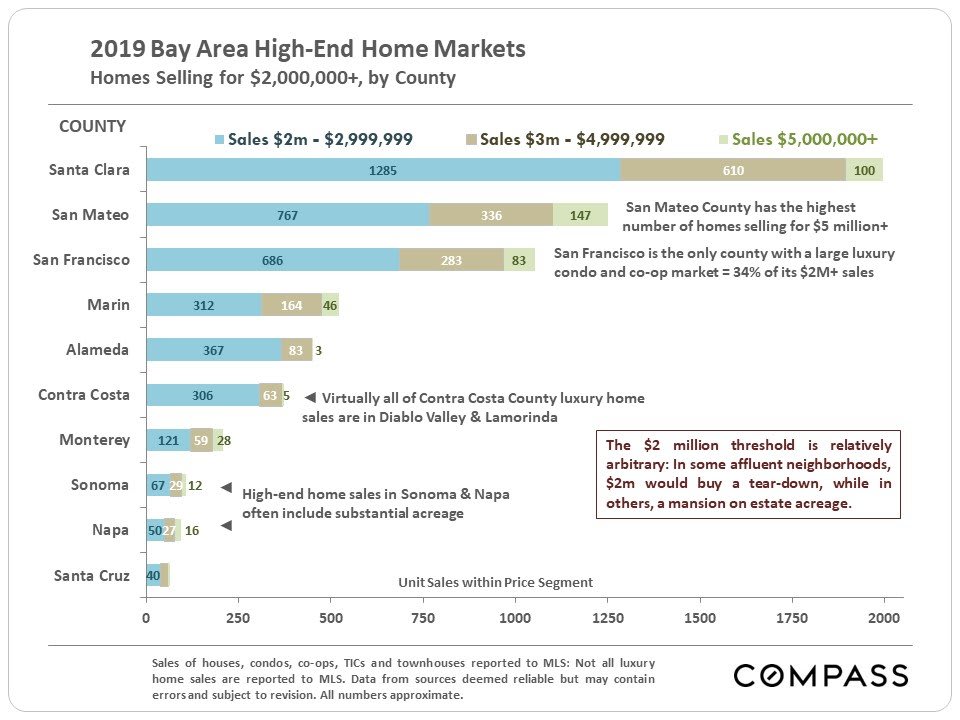
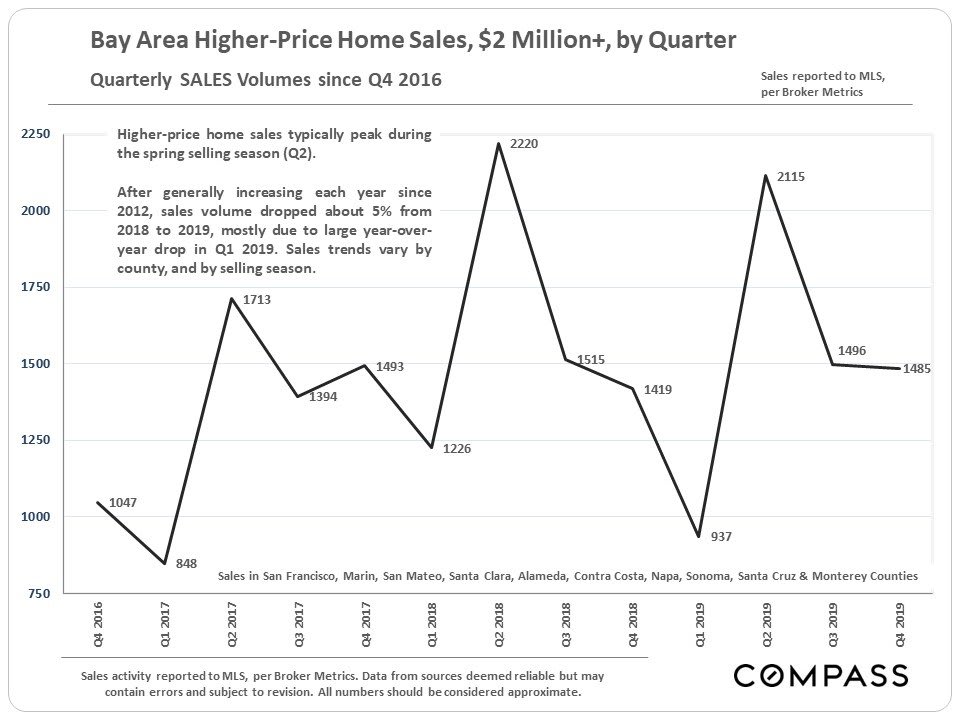
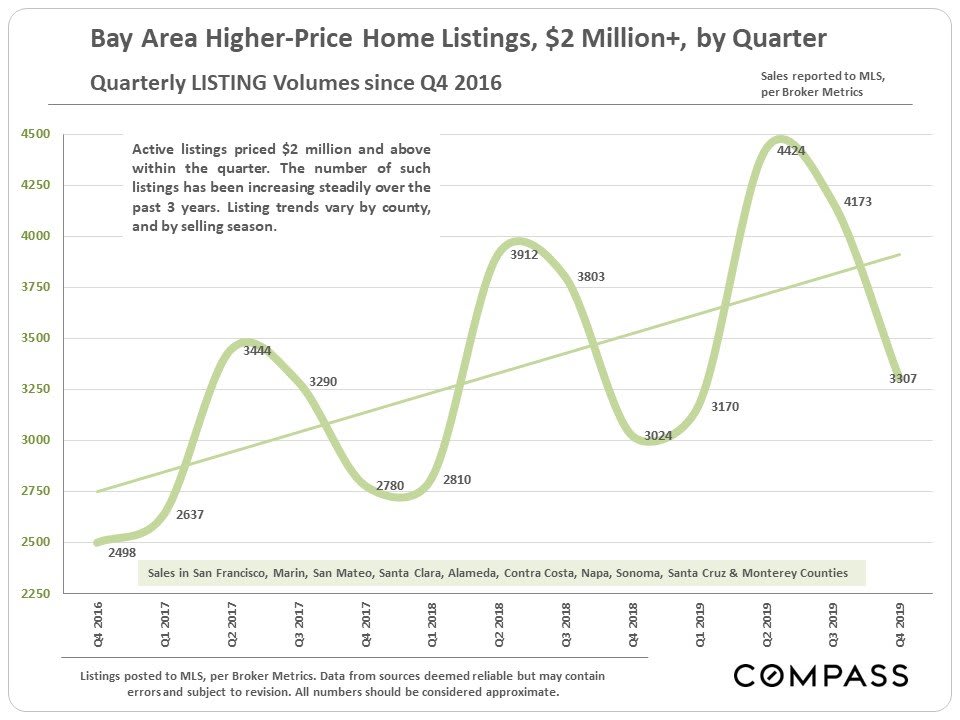
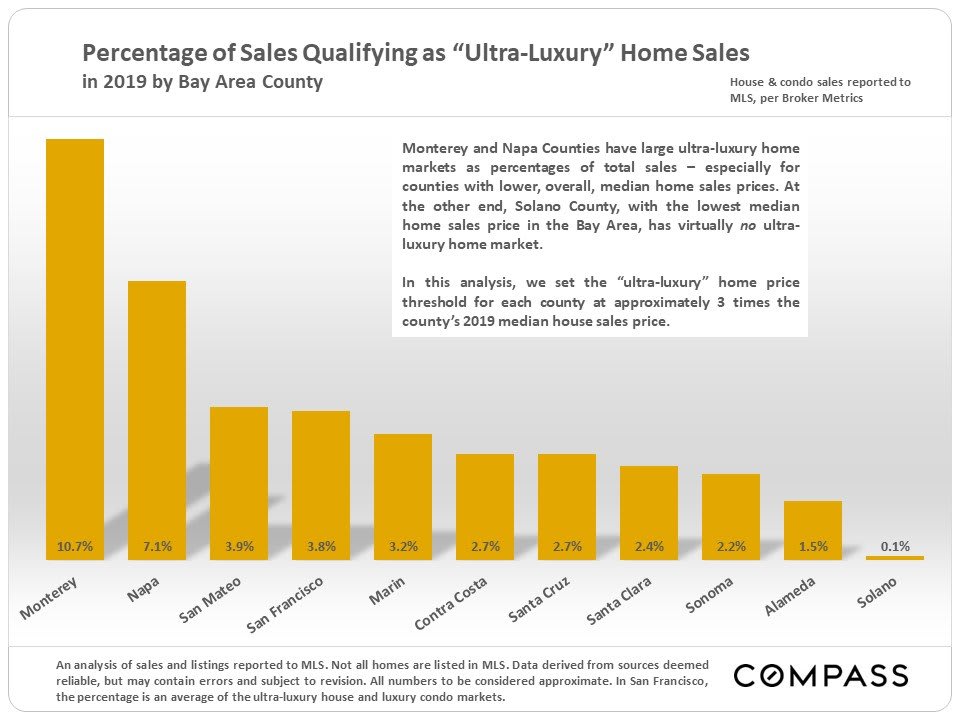
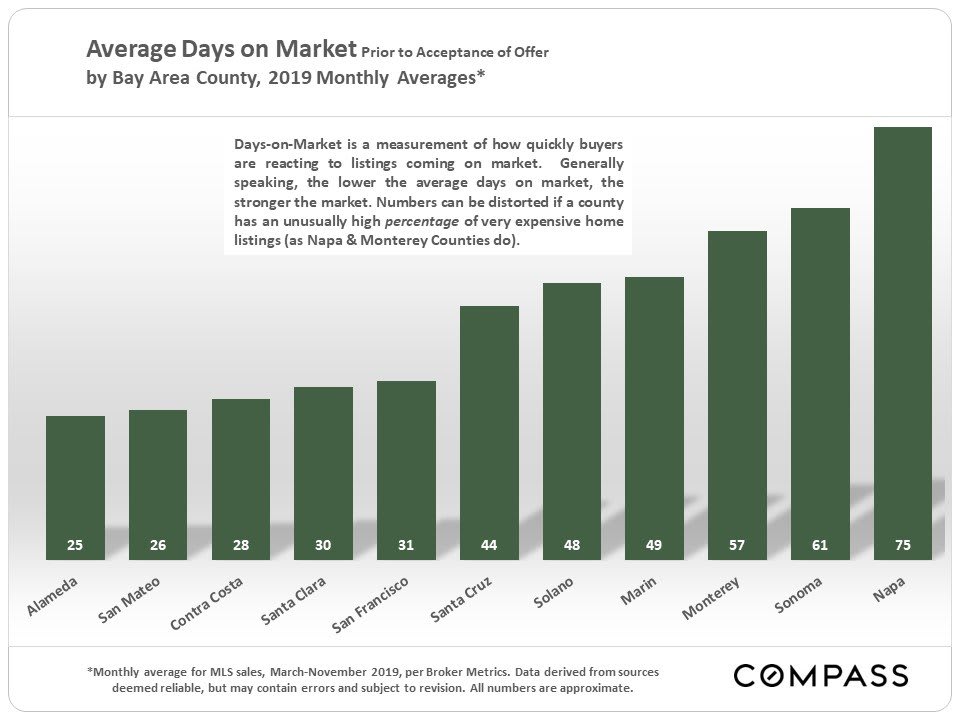
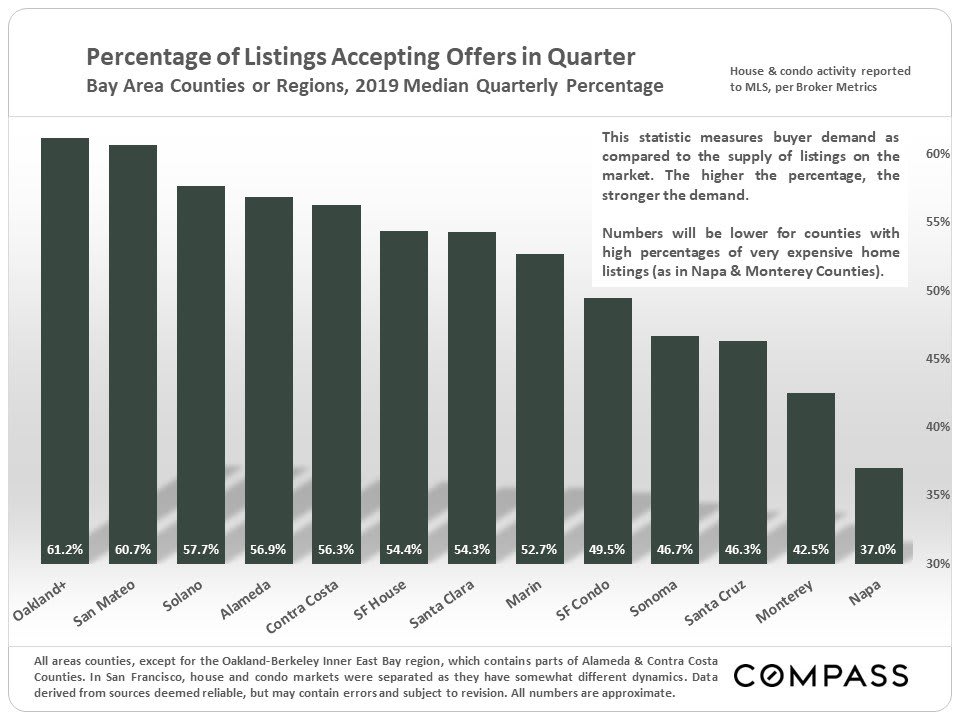
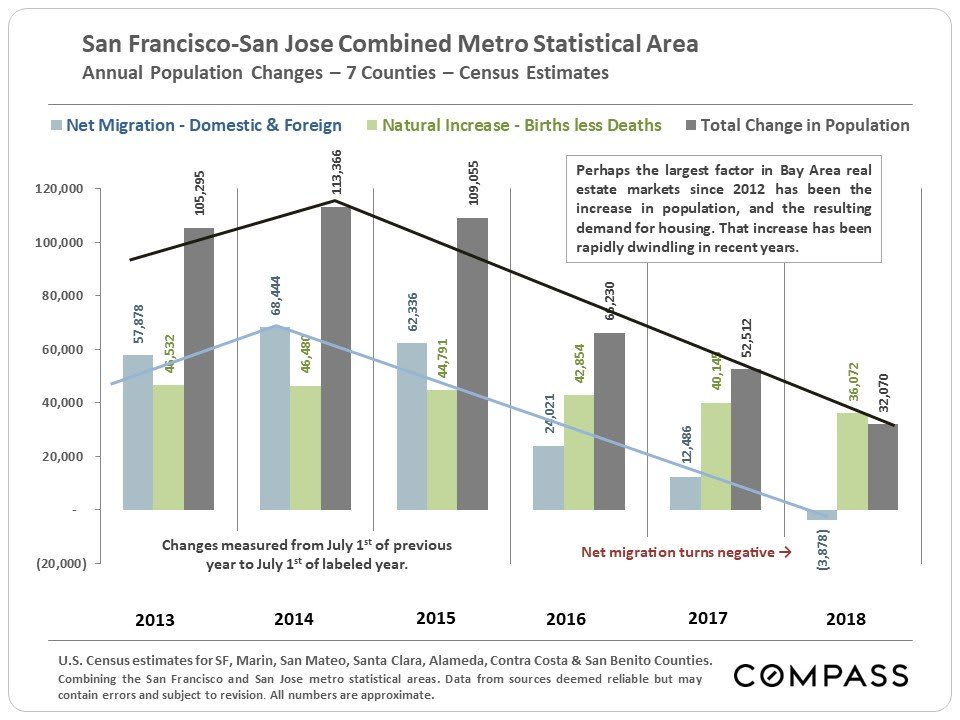
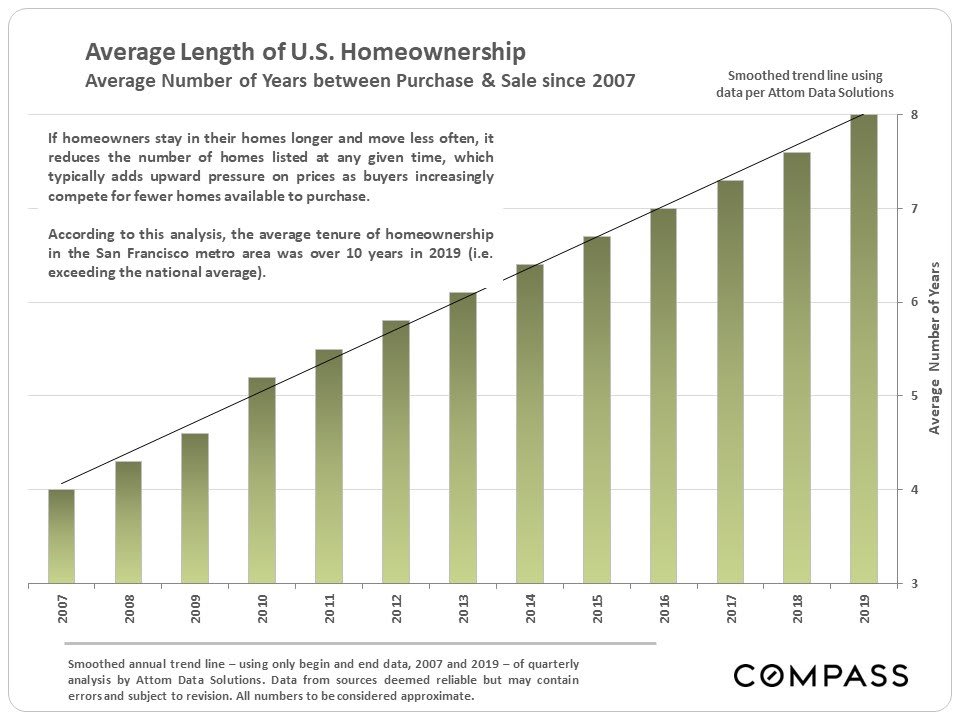
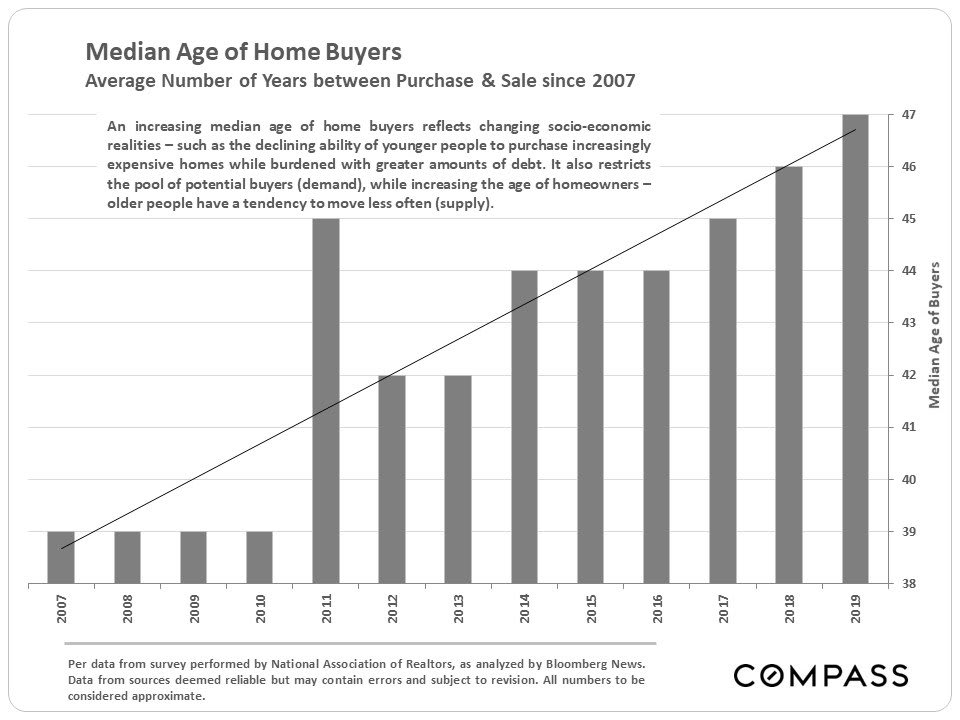
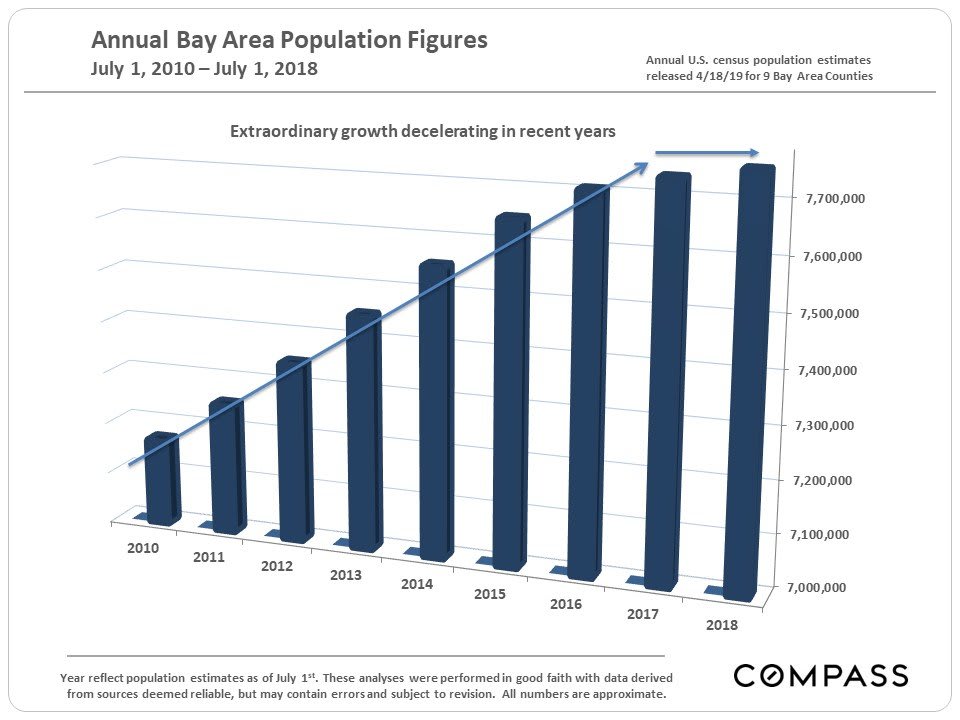
Chart of Bay Area median home prices from 1990–2019, with major housing booms and downturns labeled.Chart of Bay Area monthly home-price appreciation rates from 1990 to 2019, with major market cycles annotated.Bar chart of 2019 median Bay Area home prices by county, from San Francisco at $1.6 million to Solano at $450,000.Line chart comparing annual single-family home sale prices across 11 Bay Area counties from 1990 to 2019.Bar chart of estimated three-bedroom home values across U.S. cities, with San Francisco highest.Line chart comparing condo and co-op median prices across Bay Area counties from 1996–2019.Chart of Bay Area active listing inventory from 2013 to 2019, with a sharp drop in 2017–2018 and recovery.Bar chart of Bay Area monthly home sales from December 2017 to December 2019, with seasonal patterns and sales volumes.Chart of Bay Area median days on market since 1992, with historical market events annotated.Bay Area unsold inventory index chart, 1992–2019, with major recessions and market events annotated.Line chart tracking Bay Area listings with price reductions from 2010 to December 2019.Chart comparing 2019 Bay Area home sales priced at $2 million and above by county and price range.Line chart of Bay Area sales of homes priced at $2 million or more, by quarter, from 2016 to 2019.Chart of Bay Area listings priced at $2 million or more, peaking at 4,424 in Q2 2019.Chart showing ultra-luxury home sales as a percentage of 2019 sales by Bay Area county.Bar chart of 2019 average days on market by Bay Area county, from Alameda at 25 days to Napa at 75.Bar chart comparing 2019 Bay Area listing offer-acceptance rates, from 61.2% in Oakland+ to 37.0% in Napa.Chart of Bay Area population changes from 2013 to 2018, showing net migration turning negative in 2018.Chart shows average U.S. homeownership tenure rising from about four years in 2007 to eight in 2019.Chart shows median home buyer age rising from 39 in 2007 to 47 in 2019.Bar chart of Bay Area population estimates from 2010 to 2018, with growth slowing in recent years.

Work With Us

We will help you understand the complex aspects of the transaction and share our expertise so that you can make the best decisions possible. We are experienced, market savvy, and energetic. With both of us working for our clients, you get twice the amount of attention and insight.